February 2012 Report No. 12-05 Recovery Expected in Lottery Revenue; Options Remain to Enhance Transfers at a glance Although Lottery transfers to the Educational Enhancement Trust Fund declined by $55 million in Fiscal Year 2010-11, revenues are projected to recover during the current fiscal year. To maintain and stimulate sales during 2011, the Lottery continued its practice of launching new products and enhanced product distribution. To increase transfers to education, the Lottery should continue expanding its retailer network and enhancing its product distribution. In addition, it should evaluate the benefits of adding a fast keno game and continue to assess the option of joining another multi-state game. The Legislature could consider authorizing full-service vending machines, which may facilitate recruitment of large corporate accounts. Other options are to authorize Internet sales and video lottery terminals. However, these options represent expanded gambling and could violate the revenue sharing agreement of the gaming compact between the State of Florida and the Seminole Tribe of Florida. The Lottery’s operating expense rate continues to meet legislative performance standards. To reduce operating costs, it recently subleased some of its excess headquarters space to another agency. For additional efficiencies, it could consider using alternative retailer payment terms in its future contracts to attract and retain quality retailers while maximizing revenues to the state. Scope ________________ As directed by the Legislature, OPPAGA examined the Department of the Lottery and assessed options to enhance its earning capability and improve its efficiency. 1 Background ____________ Following voter approval of a constitutional amendment, the 1987 Legislature enacted the Florida Public Education Lottery Act. The act created the Department of the Lottery to generate funds for education and enable the state’s citizens to play state-operated lottery games. The Lottery sells both draw and scratch-off games. Draw games allow players to select from a range of numbers on a play slip. Draw game tickets are printed by terminals that are connected to the Lottery’s central computer system for a drawing at a later time. Scratch- off games are tickets with latex covering that players scratch off to determine instantly whether they have won. The Lottery is headquartered in Tallahassee, with nine district offices that provide field support services to retailers and act as prize 1 Section 24.123, F.S., requires an annual financial audit of the Lottery, which is to include recommendations to enhance the Lottery’s earning capability and efficiency. The Joint Legislative Auditing Committee directed OPPAGA to assess efficiency and the Auditor General to conduct the financial audit.
Transcript
February 2012 Report No. 12-05
Recovery Expected in Lottery Revenue; Options Remain to Enhance Transfers at a glance Although Lottery transfers to the Educational Enhancement Trust Fund declined by $55 million in Fiscal Year 2010-11, revenues are projected to recover during the current fiscal year. To maintain and stimulate sales during 2011, the Lottery continued its practice of launching new products and enhanced product distribution.
To increase transfers to education, the Lottery should continue expanding its retailer network and enhancing its product distribution. In addition, it should evaluate the benefits of adding a fast keno game and continue to assess the option of joining another multi-state game. The Legislature could consider authorizing full-service vending machines, which may facilitate recruitment of large corporate accounts. Other options are to authorize Internet sales and video lottery terminals. However, these options represent expanded gambling and could violate the revenue sharing agreement of the gaming compact between the State of Florida and the Seminole Tribe of Florida.
The Lottery’s operating expense rate continues to meet legislative performance standards. To reduce operating costs, it recently subleased some of its excess headquarters space to another agency. For additional efficiencies, it could consider using alternative retailer payment terms in its future contracts to attract and retain quality retailers while maximizing revenues to the state.
Scope ________________ As directed by the Legislature, OPPAGA examined the Department of the Lottery and assessed options to enhance its earning capability and improve its efficiency.1
Background____________ Following voter approval of a constitutional amendment, the 1987 Legislature enacted the Florida Public Education Lottery Act. The act created the Department of the Lottery to generate funds for education and enable the state’s citizens to play state-operated lottery games.
The Lottery sells both draw and scratch-off games. Draw games allow players to select from a range of numbers on a play slip. Draw game tickets are printed by terminals that are connected to the Lottery’s central computer system for a drawing at a later time. Scratch-off games are tickets with latex covering that players scratch off to determine instantly whether they have won.
The Lottery is headquartered in Tallahassee, with nine district offices that provide field support services to retailers and act as prize
1 Section 24.123, F.S., requires an annual financial audit of the
Lottery, which is to include recommendations to enhance the Lottery’s earning capability and efficiency. The Joint Legislative Auditing Committee directed OPPAGA to assess efficiency and the Auditor General to conduct the financial audit.
redemption and sales centers.2 The Lottery is self-supporting and receives no general revenue. For Fiscal Year 2011-12, the Legislature appropriated $137 million from Lottery sales revenue and authorized 424 positions for Lottery operations.3 Prizes and retailer commissions are paid directly from sales revenues and do not appear in the department’s appropriation. In Fiscal Year 2010-11, prizes were $2.46 billion and retailer commissions were $223 million.4
Since its inception, the Lottery has outsourced its core functions to produce, advertise, and sell tickets. In Fiscal Year 2011-12, the Lottery allocated approximately 68%, or $93 million, of its $137 million appropriation to produce and advertise draw and scratch-off games. Vendor contracts include those listed below.
In October 2010, the Lottery entered a four-year renewal contract by executing two, two-year renewal options with GTECH, its draw gaming system vendor, to provide computer systems, instant ticket vending machines, retailer terminals, software, telecommunications, and technical support services.
In September 2010, the Lottery entered a two-year renewal contract with Machado Garcia-Serra Advertising, Inc., for Hispanic market advertising.
In August 2009, the Lottery entered a three-year contract with St. John & Partners Advertising and Public Relations, Inc., for general market advertising. In October 2010, the Lottery exercised its first one-year renewal option to take effect August 2012.
2 Lottery retailers can pay prizes up to $599. District offices can
pay up to $250,000 for Florida Lottery prizes and up to $1 million for Powerball. Prizes exceeding these amounts must be claimed at Lottery headquarters in Tallahassee.
3 The Governor vetoed $569,000 for a compulsive gambling program.
4 To sell its products, the Lottery contracts with a wide range of retailers across the state, such as supermarkets, convenience stores, gas stations, and newsstands. Retailers receive commissions for selling Lottery products at a rate of 5% of the ticket price in addition to 1% of the prize value for redeeming winning tickets. Retailers can also receive bonuses for selling select winning tickets and performance incentive payments.
In September 2008, the Lottery entered a six-year contract with Scientific Games to print, market, and distribute scratch-off game tickets.
Revenue Performance ______
In Fiscal Year 2010-11, the Lottery transferred $1.192 billion to the Educational Enhancement Trust Fund, $55 million less than the prior year. Although transfers declined slightly below the legislative standard of $1.206 billion, the Lottery continued to meet its internal objective of transferring at least $1 billion annually to the Educational Enhancement Trust Fund and exceeded the Revenue Estimating Conference forecast.5
As shown in Exhibit 1, the Lottery’s transfers to education have declined since Fiscal Year 2008-09. This is likely due to a variety of economic and demographic factors, including reduced population growth and the depressed economy, that limit consumers’ discretionary spending on the Lottery’s products. (See Appendix A for the Lottery’s market share of disposable personal income over time and a comparison to other U.S. lotteries.) However, revenues are projected to recover during the current fiscal year. The November 2011 Revenue Estimating Conference projected that the Lottery’s transfers to education will increase by $73 million in Fiscal Year 2011-12.
The effect of inflation also lowers the purchasing value of the Lottery’s transfers to education. Inflation-adjusted transfers to education have remained relatively flat over the past 20 years, but have declined annually since Fiscal Year 2006-07. Inflation will continue to erode the value of the Lottery’s education transfers unless the Lottery increases the dollar value of the transfers to at least meet the rate of inflation.
5 The Lottery’s legislatively-approved performance standards are
reported in its long-range program plan: Long Range Program Plan Fiscal Years 2012-13 through 2016-17, Florida Lottery, September 30, 2011.
Report No. 12-05 OPPAGA Report
3
Exhibit 1 Unadjusted Transfers to the Educational Enhancement Trust Fund (EETF) Declined $55 Million (4%) in Fiscal Year 2010-11, but Are Projected to Increase by $73 Million in Fiscal Year 2011-121
1 Projected transfers from the November 2011 Revenue Estimating Conference were adjusted for inflation using the previous five-year
average inflation rate of 1.1%.
Source: OPPAGA analysis of Lottery financial data, Revenue Estimating Conference, November 30, 2011, and U.S. Department of Labor, Bureau of Labor Statistics, Consumer Price Index.
Revenue Enhancement Options–– The Lottery has taken steps in the past year to maintain and increase its sales and transfers to the Educational Enhancement Trust Fund. To further increase sales and transfers, the Lottery could implement additional games or expand product distribution by adopting new ways of selling lottery tickets and continuing to expand its retailer network. Appendix B provides a list of new game options and Appendix C provides a list of product distribution options.
The estimated values of the revenue enhancements outlined below are based on individual options; if multiple options were implemented concurrently, the fiscal impact of each would likely be smaller due to shifts in sales from one game to another. Estimates of annual revenue assume full implementation by July 1, 2012; however, some options would require additional time to implement, such as launching a keno game or installing video lottery terminals across the state.
The Lottery has continued to enhance its product mix and product distribution to stimulate sales To increase revenues, the Lottery continued its practice of launching new games in 2011. For example, in March 2011, the Lottery launched the $10 Lucky 7 Raffle, another in a series of raffle-styled games offered by the Lottery in the past several years. A limited number of tickets were available for sale within a two-month period, and in May 2011, the Lottery held a random computerized drawing from among the tickets issued. The Lottery estimated that the Lucky 7 Raffle earned a net $2 million for transfer to the Educational Enhancement Trust Fund.
In July 2011, the department enhanced and relaunched its Monopoly family of scratch-off games. The relaunch brought back the $10 price point and included a second chance game. The sales from the Monopoly games comprised 18% of the total instant ticket sales for Fiscal Year 2010-11.
In September 2011, the Lottery launched the $20 Gold Rush Tripler scratch-off game, which generated over $8 million in sales per week
Actual Transfers To EETFInflation Adjusted Transfers to EETF
In Millions
Projected Actual Transfers to EETFProjected Inflation Adjusted Transfers to EETF
Projected Transfers
OPPAGA Report Report No. 12-05
4
during the first 12 weeks after its launch. This performance exceeds the highest average weekly sales among all U.S. lotteries that offered $20 games in Fiscal Year 2009-10. The Gold Rush Tripler offers better odds of winning $30 to $500 compared to previous Gold Rush games, and the best odds ever offered for winning $500,000 (1-in-1,512,000).
Enhanced distribution also benefitted revenues. The 2011 Legislature continued to provide budget authority for 1,500 instant ticket vending machines. The Lottery had previously installed 1,000 vending machines in 2009 and another 500 in 2010, mostly in existing lottery retailer locations.
During the first year of implementation, instant ticket vending machines were installed at the Lottery’s highest selling retailers around the state. Scratch-off sales at these retailers increased 20% compared to a statewide decrease of 1% for all other retailers. Lottery officials attribute the higher sales levels as being primarily due to vending machine sales because the vending machines provide players convenient access to a larger selection of games. Assuming that the average increase of 20% in scratch-off ticket sales at these retailers was primarily due to vending machine sales, the Lottery achieved nearly $12 million more in transfers to education.6 Moreover, the machines transmit sales data in real-time, allowing the Lottery to better track ticket sales and improve retailer operational efficiency.
New Lottery games could generate substantial revenues, but could represent expanded gambling Florida could consider adding several lottery games that might attract new players and substantially increase state revenues, although some of these games have drawbacks. For
6 OPPAGA’s estimate is based on average weekly scratch-off sales
44 weeks prior to and after deployment (mid-October 2009) of the 1,000 instant ticket vending machines. According to Lottery officials, no other obvious factor than the deployment of instant ticket vending machines appears to account for the increase in sales at these retailer locations.
example, Florida could introduce fast keno, which could generate between $49 million and $258 million in additional transfers.7, 8 Fourteen U.S. lotteries currently offer fast keno. (See Appendix D for U.S. lotteries that offer selected games and their sales methods.) To implement fast keno in Florida, the Legislature would need to grant budget authority for the Lottery to spend sales revenue to acquire a fast keno gaming system.9 If it were offered on video lottery terminals, fast keno could violate the terms of the gaming compact between the State of Florida and the Seminole Tribe of Florida.10, 11
Another game option, which is authorized by s. 24.105(18), F.S., would be joining Mega Millions, which is another multi-state game that operates similar to Powerball. Multi-state lottery associations permitted states to cross-sell Powerball and Mega Millions starting in January 2010. All U.S. lotteries except California and Florida are selling both multi-state games.
Implementing Mega Millions could bring in additional revenues and help avoid losing sales
7 Fast keno is a draw lottery game in which players choose from 10
to 12 numbers from a panel of 80 numbers in the hope of matching their choices to those drawn by a central computer. Fast keno is similar in principle to other draw games, but occurs more frequently (typically every five minutes) and is often played in a social setting such as a bar or restaurant.
8 We estimated a range of potential fast keno revenue based on the highest and lowest per capita sales in states that offer fast keno after excluding outlier states from the upper and lower quartiles. We used a transfer rate of 30.38%. This rate was determined by the Lottery based on the average fast keno payout in other states of 60.62% and an administrative expense rate of 9%.
9 Implementing fast keno also may require legislative action to modify the requirement for a drawing to be witnessed by an accountant, given that electronic drawings could occur every five minutes (s. 24.105(9)(d), F.S.).
10 A gaming compact between the State of Florida and the Seminole Tribe of Florida was approved by the Governor April 7, 2010, ratified by Ch. 2010-29, Laws of Florida, and approved by the U.S. Department of the Interior on July 6, 2010. The gaming compact provides the Tribe with partial but substantial exclusivity with respect to the play of covered games in exchange for payments to the state derived from gambling proceeds.
11 Video lottery terminals are player activated and can be programmed to play casino-style games such as poker, blackjack, fast keno, and bingo; or simulate mechanical slot machines or roulette wheels.
to bordering states. Georgia participates in Mega Millions and Florida participates in Powerball. Rather than potentially lose sales to Georgia, particularly when Mega Millions offers large jackpots, Florida could keep sales in-state by selling both games. Since Powerball drawings are held Wednesday and Saturday, and Mega Millions drawings are held Tuesday and Friday, cross-selling would provide players more choice of games offering large jackpots. However, preliminary sales data indicates implementing Mega Millions may also result in an offsetting sales shift from Florida Lotto and Powerball.
Introducing video lottery terminals statewide is another option that could be considered, but may violate the terms of the gaming compact.12 If so, there could be some offsetting revenue losses that would affect whether the state achieves a net revenue increase. The compact states that in the event the state authorizes expanded gaming such as video lottery terminals beyond what was legal at the time of the signing of the compact agreement, payments due to the state may cease or be reduced.
Florida could implement video lottery terminals in several ways, some of which have greater potential to result in a net revenue increase even if revenue were lost from the gaming compact. (See Appendix E for more information.)
Bingo only. The estimated net revenue impact would range from a loss of $22 million to a gain of $123 million.
Class II gaming, not limited to bingo. The estimated net revenue impact would range from a gain of $1 million to a gain of $162 million.
Class III slot machines. The estimated net revenue impact would range from a gain of $76 million to a gain of $291 million.13, 14
12 Eight states offered video lottery terminals in 2010-11. See
Appendix D for U.S. lotteries that offer selected games and sales methods.
13 OPPAGA’s video lottery terminal revenue estimate assumes 1,000
Adding new lottery games could represent an expansion of legalized gambling and could produce negative social costs.15 Video lottery terminals and fast keno are considered to be more addictive than traditional lottery games because of their fast play pace. They could contribute to problem and pathological gambling rates and increase law enforcement costs to combat crime typically associated with gambling.
New ticket selling methods could also generate additional revenues The Legislature and the Lottery could consider expanding product distribution by using new types of vending machines or selling lottery tickets over the Internet. Several of the top performing state lotteries are using new vending machine technology to dispense draw games.16 According to the department, the Florida Lottery is not authorized to use vending machines to dispense draw game tickets because the law was written before such technology existed and specifically restricts player-activated games.
As shown in Appendix D, at least 22 U.S. lotteries use full-service vending machines to sell both scratch-off and draw game tickets. Although the machines can be configured to accept credit and debit cards, U.S. lotteries
video lottery terminals are active a full year in 20 pari-mutuel facilities operating outside Broward and Miami-Dade counties. The estimates are based on Florida’s lowest pari-mutuel net income per slot machine to the highest net income per slot machine. We then adjusted these figures to a 35% tax rate and compensated for shifts from other state revenue sources, including the Lottery, sales tax, and slot machine tax.
14 As defined by the Indian Gaming Regulatory Act (25 U.S.C. 2703), class II gaming means the game of chance commonly known as bingo (whether or not electronic, computer, or other technologic aids are used in connection therewith), whereas class III gaming means all forms of gaming that are not class I gaming or class II gaming.
15 For more information see our 2010 report, Lottery Profits Flat; Increasing Retailer Outlets is Critical to Increasing Sales, OPPAGA Report No. 10-16, January 2010.
16 Based on per capita sales, top-performing state lotteries that use full service vending machines include the District of Columbia, Maryland, Michigan, New York, Pennsylvania, and Rhode Island. See Appendix D for U.S. lotteries that offer selected games and sales methods.
configure the machines to accept only cash. Authorizing player-activated vending machines for draw games could facilitate the recruitment of large corporate accounts such as Walgreens and Walmart. This is because the machines minimize on-site labor and increase player choice and the potential for larger sales.17 In November 2011, the Revenue Estimating Conference estimated that placing full-service machines in existing and new retailer locations could generate $21 million annually in additional transfers to education.
Another product distribution option is to authorize a new type of retailer or player-activated vending machine for electronic instant ticket games. These machines offer the players the option of touching a computer or video screen in order to view the instant ticket and reveal the outcome of the ticket or they can purchase a voucher and have the retailer reveal the outcome. Electronic instant vending machines could facilitate expansion into non-traditional retailer locations such as taverns and restaurants. These devices may not violate the revenue sharing terms of the gaming compact if not more than 10 machines are installed at any location and machines are not installed at any licensed pari-mutuel facility. In April 2010, the Lottery estimated that 2,000 electronic instant ticket vending machines could generate between $33 million and $114 million in additional transfers to education.
Selling lottery products over the Internet is another option that could increase sales. Other states permit subscription sales for certain draw games via the Internet.18 For instance, New Hampshire sells Mega Millions, Powerball, and Tri-State Megabucks subscriptions over the Internet, but requires a
17 Currently, Walgreens and Walmart do not sell lottery products
anywhere in the U.S., with the exception of the Florida Lottery pilot with the Walmart Neighborhood Market grocery stores.
18 Typically, subscription sales permit players to order a number of drawings at a time, such as 26 or more game drawings, and charge the purchase to a credit card through the lottery’s website. See Appendix D for U.S. lotteries that offer selected games and sales methods.
New Hampshire mailing address and a charge card to make the purchase. According to Lottery estimates, if Florida performed at average levels, annual sales through subscriptions could generate an additional $10 million in transfers to education.
The U.S. Department of Justice released a legal opinion in December 2011 that found state lotteries’ use of the Internet and out-of-state transaction processors to sell lottery tickets to adults within their states’ borders does not violate federal law. However, Florida law currently restricts the use of player-activated terminals and does not authorize the use of credit cards for lottery purchases without a purchase of $20 in other goods.19
Authorizing the sale of lottery products over the Internet has the potential to affect revenues from the gaming compact depending on whether the Seminole Tribe of Florida chooses to also offer Internet gaming. If only the state offers this option and the tribe’s net win of covered games drops more than 5% below its net win from the previous 12-month period, the tribe may no longer be required to make guaranteed minimum payments to the state. Instead, the tribe may continue to make payments based on the percentage revenue sharing amount. However, if the tribe also offers Internet gaming, as authorized by law, state revenue from the compact may not be affected.
Increasing the retailer network could increase the Lottery’s sales Increasing the number of retailers that sell lottery tickets has the potential to increase revenues by making lottery products more readily available to residents and tourists. Nationwide data on state lotteries shows that there is a significant relationship between per capita sales and the number of residents per retailer, with states achieving higher sales
19 Section 24.105(9)(a)4, F.S., restricts the use of player-activated
machines and s. 24.118(1), F.S., requires the purchase of no less than $20 of other goods and services in order to use a credit card to purchase lottery products.
when they have more retailers per 10,000 residents.
In Fiscal Year 2009-10, the top 10 U.S. lotteries ranked by per capita sales had an average of 1,200 residents per retailer. During that period, Florida’s Lottery averaged 1,400 residents per retailer, and ranked 13th among U.S. lotteries in per capita sales. To meet the top-performing states’ average market penetration, the Lottery would need to expand its retail network from 13,100 to 15,500 retailers. Adding 2,400 new retailers has the potential to generate about $44 million annually in additional transfers to the Educational Enhancement Trust Fund.20
The Lottery’s current market penetration rate varies across the state with pockets of the highest market penetration typically found in rural counties, as shown in Exhibit 2. Almost half (31) of Florida’s 67 counties have low market penetration, including highly populated urban counties such as Broward, Hillsborough, Orange, and Palm Beach. These areas represent the greatest potential for expanding the department’s retailer network.
Exhibit 2 Retailer Market Penetration Varies Across the State
Source: OPPAGA analysis of Florida population and Department of the Lottery retailer data.
20 OPPAGA’s estimate is based on new retailers achieving at least
the average weekly gross sales for new retailers in 2011. The estimate assumes all 2,400 terminals being active for a full year and that 20% of their sales would be shifted from existing retailers.
The Lottery’s retailer recruitment goal for Fiscal Year 2011-12 is to expand to 13,700 retailers. Some of the ways in which the department aims to achieve this goal are to continue its focus on potential corporate retailers and increase the use of instant ticket vending machines. It has also embarked on a pilot project with Walmart in which the retailer’s Neighborhood Market stores are selling lottery products in five metropolitan areas (Fort Myers, Miami, Orlando, Tampa, and West Palm Beach).21 In addition, the department is requesting authority to implement full-service vending machines. As discussed earlier, these machines may help in recruiting corporate accounts.
Operational Efficiency Options–– The Lottery continues to keep its expenses as a percentage of sales low. However, for additional efficiencies, it could consider using alternative retailer payment terms in its future contracts to attract and retain quality retailers while maximizing revenues to the state.
21 Walmart Neighborhood Market stores sell the types of products
typically purchased at grocery stores and pharmacies.
Resident Population per Retailer (n = 13,129 retailers)
High Market Penetration (under 1,200:1 )
Middle Range Market Penetration (1,200:1 to 1,400:1)
Low Market Penetration (over 1,400:1)
Florida Lottery district offices
OrlandoDistrict
Fort MyersDistrict
PensacolaDistrict
JacksonvilleDistrict
GainesvilleDistrict
MiamiDistrict
TampaDistrict
OPPAGA Report Report No. 12-05
8
The Lottery’s operating expense rate is lower than the legislative standard The Lottery’s operating expenses in relation to its ticket sales continue to be lower than the legislative standard, as shown in Exhibit 3. Compared to other U.S. lotteries, the Lottery had the 3rd lowest expense rate (8.8%) in Fiscal Year 2009-10, behind New Jersey (8.1%) and Massachusetts (7.8%).22
Exhibit 3 The Lottery’s Operating Expense Rate Has Continued to Meet the Legislative Standard
Source: Department of the Lottery Long Range Program Plans.
The Lottery subleased some of its excess headquarters space and continues to seek additional building tenants In prior reports, we noted that the Lottery has not been able to reduce its headquarters leased space commensurately with staffing reductions and was paying to lease about 30,600 square feet of excess office space at an annual cost of $496,000. The Legislature directed the Lottery to develop a plan to consolidate its leased office space where economical and to sublet excess office and warehouse space to suitable tenants. In 2010, the Lottery hired an architect to develop a space consolidation plan, which identified about 16,000 square feet of office space that would be suitable to sublease.
The Lottery consulted with the Department of Management Services to identify state agencies with expiring private leases, and contacted
22 Florida Lottery’s ranking is based on the latest fiscal year data available from La Fleur’s 2011 World Lottery Almanac.
prospective agencies. As a result of this effort, the Lottery executed a sublease for 14,854 square feet with the Office of Early Learning, which began to occupy the space in November 2011. The Office of Early Learning is subleasing space for employee offices and meeting, copy, and work areas. The two agencies are sharing reception, conference, mail, and warehouse space.
To prepare the space for occupancy, the Lottery reorganized its staff and spent tenant improvement funds for the construction needed to reconfigure space for both agencies. The Office of Early Learning will pay $16.91 per square foot for the space it subleases, offsetting the Lottery’s headquarters lease costs by $251,181 in Fiscal Year 2012-13.
In addition, the Lottery reports that having additional tenants in the building has made the cafeteria space (approximately 2,200 square feet) more attractive to restaurants, as it provides them with more potential customers. The department received proposals from three local restaurants interested in subleasing the cafeteria space. Lottery officials stated they have reached an agreement with one of the vendors and expect to open the cafeteria in early February 2012.
Retailer commissions could be modified to reduce costs
To increase sales and transfers to education, the Lottery began offering higher priced games such as $20 raffle and $20 and $30 scratch-off games. However, the Lottery did not change its method for paying commissions to retailers to reflect these changes in ticket pricing. While the Lottery’s administrative expense rate is low, the actual dollars spent on retailer scratch-off commissions has increased. Scratch-off sales commissions to retailers increased by 192% between Fiscal Years 2001-02 and 2010-11, while the number of scratch-off tickets sold increased by only 25%. During this same period, total retailer commissions increased significantly more (69%) compared to transfers to education (29%).
9.31% 9.28%8.88% 8.85% 8.90%
9.52% 9.52% 9.52% 9.52% 9.52%
2006-07 2007-08 2008-09 2009-10 2010-11
Operating Expense Rate Legislative Standard
Report No. 12-05 OPPAGA Report
9
This is a result of commissions being tied to the dollar value of tickets sold rather than to the number of tickets sold. That is, retailers are paid a five-cent commission for each $1 ticket and $1 for each $20 ticket they sell.
The Lottery’s retailer compensation structure, which includes three payment components, has been in place since its inception in 1987 and includes
a sales commission of 5% of the sales price of every ticket sold by a retailer;
a 1% prize redemption payment applied to the value of the prize being redeemed; and
special retailer incentive payments, such as selling a jackpot or top-prize winning ticket, sales of a new lottery game during the early weeks of its launch or for achieving a pre-determined sales goal.
In 2007, OPPAGA recommended using alternative retailer payment terms in future contracts to attract and retain quality retailers while maximizing revenues to the state. These alternative payment terms include fixed fees with incentive payments, staggered commission rates, and commission caps.23, 24 For example, if the Lottery capped retailer sales commissions at $1 per ticket sale and subsequently relaunched a $30 scratch-off game, the Lottery could save about $2 million in retailer sales commissions by saving $.50 per ticket sale.25
The 2009 Legislature required the Lottery to study the retailer commission structure and develop alternatives for rewarding retailer performance, such as using a fixed fee payment structure based on the number of tickets sold and providing an incentive for exceeding
23 Lottery Scratch-Off Sales Increase; Options Available to
Enhance Transfers to Education, OPPAGA Report No. 07-09, February 2007.
24 In 2007, a similar structural inefficiency existed in the Lottery’s scratch-off ticket vendor’s payment terms. In October 2008, the Lottery negotiated new payment terms for its scratch-off games vendor contract to reduce Lottery’s cost for higher priced scratch-off tickets.
25 This estimate assumes the same sales volume (4,300,000) as the Lottery experienced selling $30 scratch-off tickets in Fiscal Year 2008-09.
performance targets to attract and retain quality retailers. The Lottery published a study in January 2010 that identified eight alternatives for retailer compensation programs. (See Appendix F for more information.) The study included results from retailer surveys, interviews, and focus groups on their compensation preferences and compared Florida Lottery’s retailer compensation against historical inflation rates and compensation rates of other U.S. lotteries. However, the Lottery’s 2010 study did not include a cost and feasibility analysis for any of the retailer compensation alternatives. Instead, the Lottery reported that this analysis would be completed separately at a later date.
Lottery officials have recently released a draft cost analysis, but state that they do not plan to change the retailer compensation structure at this time. In December 2011, the Lottery released a draft report that quantifies the costs of the eight retailer compensation ideas it identified in 2010, as well as the cost of a ninth idea—raising the sales commission from 5% to 6% or higher.
Recommendations ______ In Fiscal Year 2010-11, the Lottery transferred $1.192 billion to the Educational Enhancement Trust Fund, $55 million less than in 2009-10. Sales are expected to recover by $73 million in Fiscal Year 2011-12. While the department and the Legislature have taken steps to increase transfers to education, there are additional actions that could increase sales, reduce administrative expenses, and ultimately increase transfers to education.
Department Options We recommend that the Department of the Lottery consider the options listed below to enhance its revenues and increase its operational efficiency.
Evaluate the benefits of adding a fast keno game and continue to assess the option of offering another multi-state lottery game. Introducing fast keno has the potential to significantly increase transfers to education.
A second multi-state super jackpot game could also increase transfers to education, but more data on experience in other states is needed to estimate net sales revenue in Florida. The Lottery should carefully evaluate the benefits of offering fast keno and another multi-state game and provide the results to the Legislature.
Consider using alternative retailer payment terms in its future contracts to attract and retain quality retailers while maximizing revenues to the state. Alternative payment terms could include fixed fees with incentive payments, staggered commission rates, and commission caps. For example, if the Lottery capped retailer sales commissions at $1 per ticket sale and subsequently relaunched a $30 scratch-off game, the Lottery could save about $2 million in retailer sales commissions by saving $.50 per ticket sale.
Legislative Options The Legislature could consider authorizing the Lottery to expand its current games and product distribution methods to enhance revenues.
Consider authorizing new games. The Legislature could consider granting budget authority to the Lottery for a fast keno gaming system. The Legislature could also consider authorizing and granting budget authority to expand video lottery terminals statewide. These games have the greatest potential to significantly increase transfers to education; however, they are considered more addictive than Florida Lottery’s
current games and authorizing video lottery terminals could violate the revenue sharing agreement with the Seminole Tribe of Florida.
Authorize the Lottery to offer draw game and electronic instant ticket vending machines. The Legislature could consider authorizing the department to use vending machines to distribute draw products. Vending machines selling both scratch-off and draw games have the potential to appeal to large corporate retailers not currently distributing lottery products. The Legislature could also authorize the Lottery to use electronic instant ticket vending machines to expand product distribution to taverns and restaurants.
Consider authorizing the Lottery to offer Internet sales. The Legislature could consider selling Lottery subscriptions and products over the Internet, but would need to address several issues, including the use of player activated terminals, restrictions regarding credit cards for lottery purchases, and the potential effect on the gaming compact with the Seminole Tribe of Florida.
Agency Response ______ In accordance with the provisions of s. 11.51(5), Florida Statutes, a draft of our report was submitted to the Secretary of the Department of the Lottery for review and response. The Secretary’s written response to this report is in Appendix G.
Report No. 12-05 OPPAGA Report
11
Appendix A
Lottery’s Market Share of Disposable Personal Income Disposable personal income is the total personal income available to individuals for spending or saving after paying government taxes. For purposes of this report, the Lottery’s market share of disposable personal income is defined as per capita net sales (not adjusted for inflation) as a percentage of per capita disposable personal income (also not adjusted for inflation).
Table A-1 shows the Lottery’s market share of disposable personal income. The table shows that, as the Lottery matured, its share of disposable personal income declined until variable prize payouts were authorized in 2002, which helped to increase the sale of scratch-off products and higher priced scratch-off tickets. Table A-2 shows each U.S. lottery’s market share. In Fiscal Year 2009-10, the Lottery ranked 12th in per capita net sales as a percentage of per capita disposable personal income among U.S. lotteries.
Table A-1 Lottery Share of Disposable Personal Income Declining Slightly Since Fiscal Year 2007-08
Source: U.S. Department of Commerce, Bureau of Economic Analysis; Florida Demographic Estimating Conference population estimates; and Department of the Lottery net sales data.
0.00%
0.20%
0.40%
0.60%
0.80%
1.00%
Lottery Market Share of Disposable Income(Fiscal Year 1987-88 through 2009-10)
OPPAGA Report Report No. 12-05
12
Table A-2 Compared to Other U.S. Lotteries, Florida Lottery Ranked 12th in Per Capita Net Sales as a Percentage of Per Capita Disposable Income
U.S. Lottery1 2010 Population
(in millions) Ticket Sales (in millions)
Per Capita Sales
Per Capita Disposable Income
Market Share
Rank Order
Massachusetts 6.6 4,412.09 665 $45,013 1.48% 1
Georgia 9.9 3,387.42 342 $31,736 1.08% 2
New York 19.6 6,781.07 346 $41,825 0.83% 3
Michigan 9.9 2,359.23 238 $31,757 0.75% 4
South Carolina 4.6 1,007.16 219 $29,948 0.73% 5
Maryland 5.7 1,706.57 297 $43,498 0.68% 6
New Jersey 8.7 2,605.10 298 $45,420 0.66% 7
Pennsylvania 12.6 3,065.72 243 $36,531 0.66% 8
Ohio 11.5 2,490.19 216 $32,832 0.66% 9
District of Columbia 0.6 230.16 377 $62,110 0.61% 10
Connecticut 3.5 996.85 283 $47,454 0.60% 11
Florida 18.7 3,900.50 209 $35,296 0.59% 12
Rhode Island 1.1 234.62 222 $38,216 0.58% 13
Kentucky 4.3 723.43 167 $29,502 0.57% 14
Tennessee 6.3 1,060.11 167 $32,717 0.51% 15
Maine 1.3 217.03 165 $33,521 0.49% 16
Missouri 6.0 971.86 162 $33,775 0.48% 17
North Carolina 9.5 1,421.33 150 $31,821 0.47% 18
Virginia 8.0 1,435.13 180 $39,476 0.46% 19
New Hampshire 1.3 233.77 177 $39,945 0.44% 20
Illinois 12.9 2,191.42 169 $37,997 0.45% 21
Arkansas 2.9 383.70 132 $30,075 0.44% 22
Delaware 0.9 136.94 154 $35,449 0.43% 23
Vermont 0.6 97.48 157 $36,695 0.43% 24
Texas 25.2 3,738.37 148 $34,826 0.43% 25
Indiana 6.4 740.34 115 $30,961 0.37% 26
West Virginia 1.8 181.23 99 $29,313 0.34% 27
Idaho 1.6 147.23 94 $29,535 0.32% 28
Arizona 6.7 551.49 83 $31,960 0.26% 29
Colorado 5.1 501.20 98 $38,142 0.26% 30
Oregon 3.9 320.70 83 $32,799 0.25% 31
Minnesota 5.3 498.96 94 $38,383 0.25% 32
Wisconsin 5.7 481.10 85 $34,455 0.25% 33
Iowa 3.0 256.26 85 $34,817 0.24% 34
Report No. 12-05 OPPAGA Report
13
U.S. Lottery1 2010 Population
(in millions) Ticket Sales (in millions)
Per Capita Sales
Per Capita Disposable Income
Market Share
Rank Order
Louisiana 4.5 372.39 82 $34,226 0.24% 35
Kansas 2.8 235.41 83 $35,411 0.23% 36
New Mexico 2.0 143.59 71 $30,698 0.23% 37
California 37.3 3,040.96 82 $37,948 0.22% 38
Nebraska 1.8 130.58 72 $36,329 0.20% 39
Washington 6.7 491.02 73 $39,255 0.19% 40
Oklahoma 3.7 199.75 54 $32,512 0.16% 41
South Dakota 0.8 45.54 56 $36,948 0.15% 42
Montana 1.0 46.85 48 $32,038 0.15% 43
North Dakota 0.7 24.42 37 $39,300 0.10% 44
1 Seven states do not operate a lottery (Alabama, Alaska, Hawaii, Mississippi, Nevada, Utah, and Wyoming).
Source: La Fleur’s 2011 World Lottery Almanac and the U.S. Department of Commerce, Bureau of Economic Analysis.
OPPAGA Report Report No. 12-05
14
Appendix B
New Lottery Game Options New games that attract new players have the potential to substantially increase revenues to education. While the Legislature could consider authorizing the Lottery to offer new games such as fast keno and video lottery terminals, these options could increase the negative social costs of gambling and, in some cases, could conflict with the gaming compact between the State of Florida and the Seminole Tribe of Florida. Table B-1 lists these and other game options that could increase Lottery sales and transfers to education, their advantages and disadvantages, and estimated revenues where we were able to develop reasonable estimates. The estimated revenues are based on individual options; if multiple options were implemented concurrently, the fiscal impact of each would likely be smaller due to shifts in sales from one game to another.
Table B-1 New Games Have the Potential to Increase Revenues to Education
Option Advantages Disadvantages Fast Keno Draw lottery game in which players choose from 10 to 12 numbers from a panel of 80 numbers in the hope of matching their choices to those drawn by the central computer at Lottery headquarters; may be played frequently (e.g., every five minutes) on monitors in social settings such as bars or restaurants
Potential recurring transfers to education range from $49 million to $258 million per year
Can be limited to pari-mutuel facilities or social settings such as bars and restaurants
Fast keno is reportedly more addictive than traditional lottery games, though not as addictive as video lotteries.
Could be considered an expansion of gambling
May require legislative action to modify the requirement for a drawing to be witnessed by an accountant, given that electronic drawings could occur every five minutes (s. 24.105(9)(d), F.S.)
Requires legislative budget approval for a fast keno gaming system
If it were offered on video lottery terminals, fast keno could violate the terms of the gaming compact between the State of Florida and the Seminole Tribe of Florida.
Daily Keno Draw lottery game in which players choose as many as 10 numbers from a panel of 80 numbers in the hope of matching their choices to those drawn by the central computer at Lottery headquarters; similar in principle to other draw games and it may be played weekly or daily
Potential recurring transfers to education range from $6 million to $12 million per year
Could be considered an expansion of gambling
Mega Millions Multi-state games, such as Mega Millions, often reach very large jackpot sizes because they cover several states
Offers players greater opportunities for very large jackpots
Potential recurring transfers to education may be positive but are indeterminate at this time
More frequent mega jackpots could reduce incentive for occasional players to respond to large jackpots
Probable sales shift from Powerball and Florida Lotto
Could be considered an expansion of gambling
Report No. 12-05 OPPAGA Report
15
Option Advantages Disadvantages Video Lottery Terminals Players use video terminals that can be programmed to play casino-style games such as poker, blackjack, fast keno, and bingo, or simulate mechanical slot machines or roulette wheels
Potential recurring transfers to education range up to a gain of $291 million per year depending on how it is implemented and after accounting for potential lost Seminole Tribe of Florida gaming revenue if determined to violate the terms of the revenue sharing agreement
To reduce issues/concerns about underage players, play could be limited to pari-mutuel facilities, such as racetracks or establishments with liquor licenses
Potential recurring transfers to education could result in a loss of $22 million per year depending on how it is implemented and after accounting for potential lost Seminole Tribe of Florida gaming revenue if determined to violate the terms of the revenue sharing agreement
Because of its rapid play style, it may be more addictive than other lottery games, and thus increase social costs associated with problem and pathological gambling
Could be considered an expansion of gambling
Represents a substantial change for gambling in Florida by permitting casino-style lottery games statewide, which could be criticized by anti-gambling groups
Would require legislative action to authorize player-activated video lottery terminals in Florida (s. 24.105, F.S.)
Requires legislative budget approval for a video lottery gaming system
If launched in racinos (i.e., horse or dog race tracks with casinos), it could erode sales of traditional Florida Lottery games within certain market segments
Higher Priced Scratch-off Games As the economy strengthens or the value of the dollar depreciates, higher priced scratch-off games can be offered (e.g., $50 games)
Since 2002, most scratch-off growth in transfers to education in Florida has been due to higher price point games. Compared to other states offering high priced tickets, Florida is an industry leader in the $20 scratch-off game.
Higher priced scratch-off games are contingent on the strength of the economy.
Florida’s experience with $30 tickets was not encouraging and the growth in scratch-off sales has begun to level off, indicating there are limits to what will sell.
Only seven states have offered scratch-off tickets over $20 dollars, including Connecticut, Florida, Indiana, New Hampshire, New York, Pennsylvania, and Texas. Texas offers the only $50 game.
Monitor Games Computer animated games simulating horse racing, golf, etc., that are played on in-store monitors similar to the way fast keno is played
May have less association to casino gambling than fast keno
Could appeal to emerging markets of Lottery players that have grown up playing computer games
Allows the Lottery to recruit new retailers in social venues such as bars and restaurants
Because of its rapid play style, it could be more addictive than traditional lottery games
Could be considered an expansion of gambling
Source: OPPAGA analysis of industry and Department of the Lottery information.
OPPAGA Report Report No. 12-05
16
Appendix C
Product Distribution Options Making lottery products more accessible and convenient for players by expanding product distribution has the potential to substantially increase revenues to education. New equipment such as full service vending machines, product distribution through the Internet, and increasing the number of retailers have the potential to increase revenues by making lottery products more readily available to residents and tourists. These options have been shown to drive lottery sales more than advertising or jackpot size. Table C-1 lists these and other product distribution options that could increase Lottery sales and education transfers, their advantages and disadvantages, and estimated revenues where we were able to develop reasonable estimates. The estimated revenues are based on individual options; if multiple options were implemented concurrently, the fiscal impact of each would likely be smaller due to shifts in sales from one point of sale to another.
Table C-1 Expanding Product Distribution Has the Potential to Increase Revenues to Education
Option Advantages Disadvantages Authorize Full-Service Vending Machines The Legislature would amend the law to permit player-activated vending machines that are capable of selling tickets for draw games
Potential to generate about $21 million annually in additional transfers to the Educational Enhancement Trust Fund
Provides more convenience to players who do not want to stand in line to purchase tickets
Successful in other U.S lotteries May attract large corporate retailers currently
not selling lottery products Allows retailer network expansion into
non-traditional retailer locations (e.g., airports and hotels)
Would not require a modification to the Lottery retailer contracts that require retailers to carry both scratch-off and draw games
Requires a statutory change to allow player-activated terminals for draw games (s. 24.105, F.S.)
Requires legislative budget approval Requires monitoring of underage play Some criticize the potential ease of access by
problem gamblers Could be considered an expansion of
gambling
Electronic Instant Ticket Vending Machine Players touch a video screen and receive the image of the instant ticket on the screen to reveal the outcome of the ticket
Potential recurring transfers to education range from $33 million to $114 million per year depending on how implemented
Provides a business model allowing retailer network expansion into non-traditional retailer locations, such as bars and restaurants
Could violate revenue sharing gaming compact between the state and the Seminole Tribe of Florida if these devices are deployed at any licensed pari-mutuel facility or if more than 10 machines are installed at any location
Requires legislative budget approval for more instant ticket vending machines
Requires monitoring of underage play Some stakeholders criticize the potential ease
of access by problem gamblers
Report No. 12-05 OPPAGA Report
17
Option Advantages Disadvantages Authorize Internet Sales The Legislature would enact laws to authorize intrastate Internet sales of lottery products
Provides more convenience to players who prefer to purchase their lottery products from their personal computer or cellular device
Canadian lotteries are selling individual games over the Internet using technology that detects the player’s location (e.g., British Columbia Lottery Corporation at www.bclc.com).
Would require ensuring that Internet sales are made within Florida borders
Requires a statutory change to allow player-activated terminals (s. 24.105, F.S.)
Requires legislative budget approval for enhanced systems and technology
Use of credit cards for lottery purchases without purchase of $20 in other goods would require a law change (s. 24.118, F.S.)
Could be considered an expansion of gambling
Could affect revenue from gaming compact between the state and the Seminole Tribe of Florida
Subscription Play Players can subscribe to game drawings for up to one year in advance on the Florida Lottery website
Potential to generate about $10 million annually in additional transfers to the Educational Enhancement Trust Fund
Internet technology has made subscription services much easier and more cost-effective for lotteries to manage.
Key benefits for the consumers are no missed draws, no waiting in lines, and ease of prize claims.
Provides the ability for people to play who may not be able to otherwise, such as seasonal residents and physically challenged residents
Subscription play is offered in 10 U.S. lotteries.
May require a statutory change to allow player-activated terminals (s. 24.105, F.S.)
Use of credit cards for lottery purchases without a purchase of $20 in other goods would require a law change (s. 24.118, F.S.).
Requires legislative budget approval for enhanced systems and technology
Must comply within federal laws that restrict subscriptions from out-of-state players unless they have in-state mailing addresses
Game changes require communication with players and possibly a replacement ticket.
Because all prize payments will be paid automatically, subscription play would not generate revenues from unclaimed prize funds.
Could be considered an expansion of gambling
Expand Retailer Network Add additional corporate and independent Lottery retailers in both traditional locations, such as convenience and grocery stores, and non-traditional locations, such as airports, hotels, and restaurants
Should result in incremental sales increases if terminals are placed in the right retailer locations
Florida has been below the average in terminal density compared to other successful Lottery states, so expanding its network should improve per capita sales.
Could increase product distribution and awareness, making products available to new players who don’t shop where products are currently being sold
Adding 2,400 new retailers has the potential to generate about $44 million annually in additional transfers to the Educational Enhancement Trust Fund.
Requires legislative budget approval for more terminals
Retailer expansion has been difficult during recession because retailer closings have been higher than new retailers recruited.
The non-traditional lottery business model may require the development of different products and distribution strategies.
May require additional lottery staff to service new accounts
Expand Instant Ticket Vending Machines (ITVMs) Self-service vending machines for scratch-off tickets are installed in approximately 1,500 Lottery retailers
Allows additional product access at high volume Lottery retailers
Latest technology provides improved functionality, better security, and better accounting.
Early instant ticket vending machine sales show increases in retailer sales where ITVMs are deployed.
Could be cost-effective where scratch-off tickets are not being sold, such as in hotels and restaurants
Requires legislative budget approval for more ITVM units
Requires monitoring of underage play Some criticize the potential ease of access to
problem gamblers.
Source: OPPAGA analysis of industry and Department of the Lottery information.
U.S. Lotteries Offer Various Games and Sales Methods
U.S. Lottery1 Daily Keno Fast Keno Video Lottery
Terminals Full-Service
Vending Machines Subscription Sales Game Play via Internet
Arizona X Arkansas X California X Colorado Connecticut Delaware X District of Columbia X X 2 Florida Georgia X Idaho X Illinois X X Indiana X Iowa Kansas X Kentucky X Louisiana Maine X Maryland X X X X Massachusetts X X Michigan X X X Minnesota X X Missouri X Montana X Nebraska New Hampshire X X New Jersey New Mexico X New York X X X X X North Carolina X North Dakota X Ohio X X X Oklahoma X Oregon X X X Pennsylvania X Puerto Rico Rhode Island X X X South Carolina South Dakota X Tennessee Texas X U.S. Virgin Islands X X Vermont X X Virginia X Washington X X West Virginia X X Wisconsin TOTAL 5 14 8 22 10 0
1 Seven states do not operate a lottery (Alabama, Alaska, Hawaii, Mississippi, Nevada, Utah, and Wyoming). 2 Washington D.C. has put the infrastructure in place to implement game play via the Internet, but its proposed i-Gaming site is not yet
operational and it has been holding a series of community meetings to receive public input on this change. Source: OPPAGA analysis of information from La Fleur’s 2011 World Lottery Almanac; other U.S. lottery websites; companies that provide lottery game and distribution options to other U.S. lotteries; and reviews of selected literature.
Report No. 12-05 OPPAGA Report
19
Appendix E
Estimates of Net Revenues for Video Lottery Terminals The Governor approved a gaming compact between the State of Florida and the Seminole Tribe of Florida on April 7, 2010, which was ratified by the Legislature in Ch. 2010-29, Laws of Florida, and approved by the U.S. Department of the Interior on July 6, 2010. The compact provides the Tribe with partial but substantial exclusivity with respect to the play of covered games in exchange for payments to the state derived from gambling proceeds.
Introducing video lottery terminals statewide could violate the terms of the gaming compact, thereby creating offsetting revenue losses that could affect whether the state achieves a net revenue increase. The compact states that in the event that the state authorizes expanded gaming beyond what was legal at the time of the signing of the compact, Seminole Tribe of Florida gaming payments may cease. As shown in Table E-1, Florida could implement video lottery terminals in several ways, some of which have greater potential to result in a net revenue increase after accounting for potential lost revenue from the gaming compact.
Table E-1 Introducing Video Lottery Terminals Could Be a Revenue Gain or Loss Depending on Implementation (estimates in millions)
Revenue Source
Class II Bingo Only1 Class II Games1 Class III Slot Machines1 Low
Estimate High
Estimate Low
Estimate High
Estimate Low
Estimate High
Estimate Video Lottery Terminals2 $204.1 $349.0 $226.7 $387.8 $302.3 $517.1
Indian Gaming Revenues3 226.0 226.0 226.0 226.0 226.0 226.0
Net Revenue -$21.9 $123.0 $0.7 $161.8 $76.3 $291.1 1 As defined by the federal Indian Gaming Regulatory Act, class II gaming means the game of chance commonly known as bingo
(whether or not electronic, computer, or other technologic aids are used in connection with it), but may include other games of chance such as pull-tabs, lotto, and other games similar to bingo, whereas class III gaming means all forms of gaming that are not class I gaming or class II gaming (25 U.S.C. 2703).
2 Our estimates of net revenue from video lottery terminals assume 1,000 video lottery terminals are active a full year in 20 pari-mutuel facilities operating outside Broward and Miami-Dade counties. We developed the estimates based on Florida’s lowest pari-mutuel net income per slot machine and the highest net income per slot machine. We then adjusted these figures to a 35% tax rate and compensated for shifts from other state revenue sources including the Lottery, sales tax, and slot machine tax.
3 The Revenue Estimating Conference met December 5, 2011, and adopted this estimate for Indian Gaming revenues in 2013-14.
Source: Revenue Estimating Conference and OPPAGA analysis.
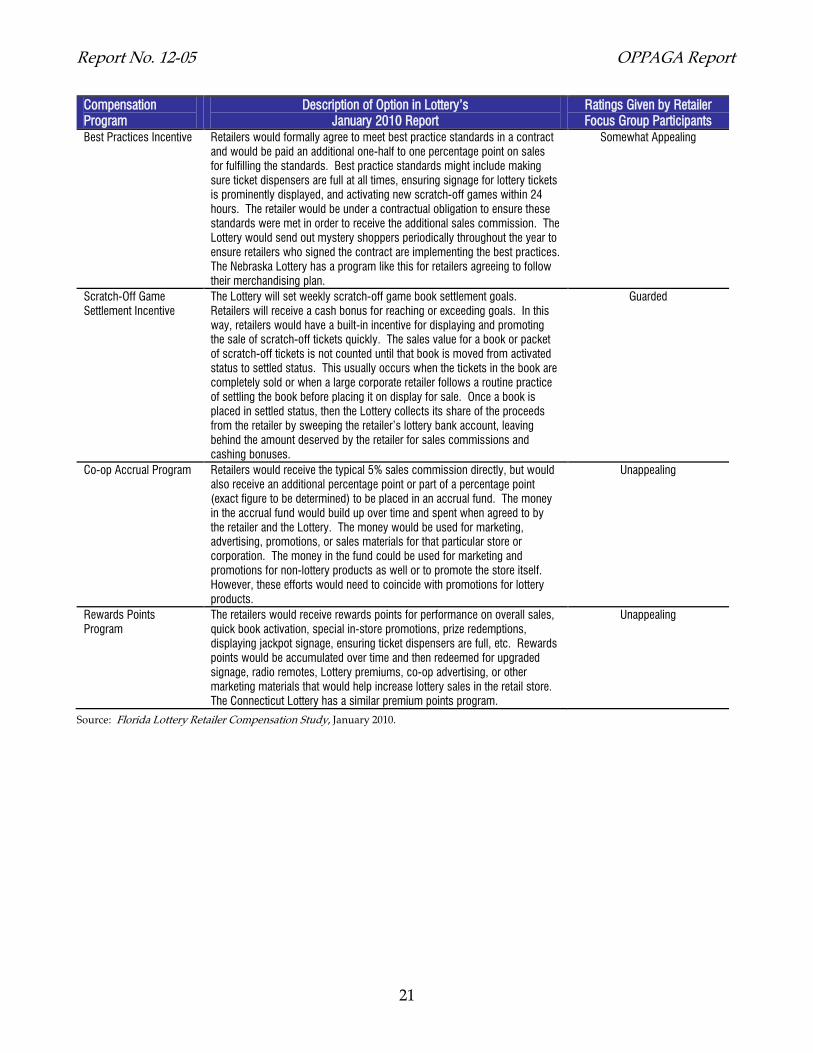
Options the Lottery Identified in Its Review of Retailer Compensation In 2007, OPPAGA recommended using alternative retailer payment terms in its future contracts to attract and retain quality retailers while maximizing revenues to the state. The 2009 Legislature required the Lottery to study the retailer commission structure and develop alternatives for rewarding retailer performance, such as using a fixed fee payment structure based on the number of tickets sold and providing an incentive for exceeding performance targets to attract and retain quality retailers. In January 2010, the department issued a report that identified eight alternatives for its retailer compensation structure. Table F-1 provides an overview of the alternative retailer compensation programs, ranked by the ratings of participants in retailer focus groups.
Table F-1 The Lottery Identified Eight Options for Revising How Retailers Are Compensated for Their Services
Compensation Program
Description of Option in Lottery’s January 2010 Report
Ratings Given by Retailer Focus Group Participants
Higher Prize Redemption Bonus
The Lottery increases the standard prize redemption bonus to retailers from the current 1% commission to a 2% commission. A number of U.S. lotteries pay higher cashing bonuses than Florida, and a few pay the percentage rate on redeemed prizes exceeding $600 even if the ticket actually must be cashed in a lottery office.
Most Appealing
Graduated Compensation
Using quarterly changes in sales figures (percentage change from past quarters), retailers would be compensated at a higher rate if they out-perform the statewide average change in sales. Quarterly changes in sales would be measured at the statewide level and for each retailer, and the payment rate re-assessed each quarter. The Arizona, Colorado, Kentucky, and Montana lotteries use this method with some variations.
Appealing
Fixed Compensation Value Per Ticket
The Lottery would pay retailers a commission on a per-ticket basis rather than on a percentage-of-sales basis (which is how retailers are currently receiving commissions). Thus, retailers would be compensated on each Lottery ticket or play rather than on the amount of sales.
Medium Appeal
Clerk Targeted Incentives
This program consisted of three options. 1) The Lottery would pay a higher sales commission to retailers if the retailer
agreed to split the incentive with the sales clerks or at least provide the clerks with some type of bonus for promoting the increase of lottery ticket sales.
2) Someone working for the Florida Lottery would act as a mystery shopper and reward clerks who ask customers if they want to purchase a ticket. An example reward would be a $25 VISA gift card. Many state lotteries, including New York, North Dakota, and South Carolina, operate similar programs and point to it as their most effective strategy for incentivizing sales.
3) A promotional scratch-off game book would be given to a retail store. A sign would be displayed in the store for a given time period telling customers that if the sales clerk did not ask about purchasing a ticket, the customer would get one of the promotional game books for free. At the end of the time period, the store would keep the tickets that are not given away, and either retain any profits from their sale or receive the proceeds from their winnings.
Some Appeal
Report No. 12-05 OPPAGA Report
21
Compensation Program
Description of Option in Lottery’s January 2010 Report
Ratings Given by Retailer Focus Group Participants
Best Practices Incentive Retailers would formally agree to meet best practice standards in a contract and would be paid an additional one-half to one percentage point on sales for fulfilling the standards. Best practice standards might include making sure ticket dispensers are full at all times, ensuring signage for lottery tickets is prominently displayed, and activating new scratch-off games within 24 hours. The retailer would be under a contractual obligation to ensure these standards were met in order to receive the additional sales commission. The Lottery would send out mystery shoppers periodically throughout the year to ensure retailers who signed the contract are implementing the best practices. The Nebraska Lottery has a program like this for retailers agreeing to follow their merchandising plan.
Somewhat Appealing
Scratch-Off Game Settlement Incentive
The Lottery will set weekly scratch-off game book settlement goals. Retailers will receive a cash bonus for reaching or exceeding goals. In this way, retailers would have a built-in incentive for displaying and promoting the sale of scratch-off tickets quickly. The sales value for a book or packet of scratch-off tickets is not counted until that book is moved from activated status to settled status. This usually occurs when the tickets in the book are completely sold or when a large corporate retailer follows a routine practice of settling the book before placing it on display for sale. Once a book is placed in settled status, then the Lottery collects its share of the proceeds from the retailer by sweeping the retailer’s lottery bank account, leaving behind the amount deserved by the retailer for sales commissions and cashing bonuses.
Guarded
Co-op Accrual Program Retailers would receive the typical 5% sales commission directly, but would also receive an additional percentage point or part of a percentage point (exact figure to be determined) to be placed in an accrual fund. The money in the accrual fund would build up over time and spent when agreed to by the retailer and the Lottery. The money would be used for marketing, advertising, promotions, or sales materials for that particular store or corporation. The money in the fund could be used for marketing and promotions for non-lottery products as well or to promote the store itself. However, these efforts would need to coincide with promotions for lottery products.
Unappealing
Rewards Points Program
The retailers would receive rewards points for performance on overall sales, quick book activation, special in-store promotions, prize redemptions, displaying jackpot signage, ensuring ticket dispensers are full, etc. Rewards points would be accumulated over time and then redeemed for upgraded signage, radio remotes, Lottery premiums, co-op advertising, or other marketing materials that would help increase lottery sales in the retail store. The Connecticut Lottery has a similar premium points program.
Unappealing
Source: Florida Lottery Retailer Compensation Study, January 2010.
OPPAGA Report Report No. 12-05
22
Appendix G
Report No. 12-05 OPPAGA Report
23
OPPAGA Report Report No. 12-05
24
Report No. 12-05 OPPAGA Report
25
OPPAGA Report Report No. 12-05
26
The Florida Legislature
Office of Program Policy Analysis and Government Accountability
OPPAGA provides performance and accountability information about Florida government in several ways.
Reports deliver program evaluation and policy analysis to assist the Legislature in overseeing government operations, developing policy choices, and making Florida government better, faster, and cheaper.
PolicyCasts, short narrated slide presentations, provide bottom-line briefings of findings and recommendations for select reports.
Government Program Summaries (GPS), an online encyclopedia, www.oppaga.state.fl.us/government, provides descriptive, evaluative, and performance information on more than 200 Florida state government programs.
The Florida Monitor Weekly, an electronic newsletter, delivers brief announcements of research reports, conferences, and other resources of interest for Florida's policy research and program evaluation community.
Visit OPPAGA’s website at www.oppaga.state.fl.us
OPPAGA supports the Florida Legislature by providing data, evaluative research, and objective analyses that assist legislative budget and policy deliberations. This project was conducted in accordance with applicable evaluation standards. Copies of this report in print or alternate accessible format may be obtained by telephone (850/488-0021), by FAX (850/487-3804), in person, or by mail (OPPAGA Report Production, Claude Pepper Building, Room 312, 111 W. Madison St., Tallahassee, FL 32399-1475). Cover photo by Mark Foley.
OPPAGA website: www.oppaga.state.fl.us
Project supervised by Becky Vickers (850/487-1316) Project conducted by Mark Frederick (850/487-9251)
Tim Elwell (850/487-9228), Staff Director, Education Policy Area R. Philip Twogood, Coordinator