+ All Categories
Home > Documents > Recovery of Mono-Ethylene Glycol Distillation and the Impact of … · 2019-10-16 · Recovery of...

Recovery of Mono-Ethylene Glycol Distillation and the Impact of … · 2019-10-16 · Recovery of...

Date post: 24-Mar-2020
Category:
Upload: others
View: 10 times
Download: 0 times
Share this document with a friend
28
Recovery of Mono-Ethylene Glycol Distillation and the Impact of Dissolved Salts Simulating Field Data Sami Zaboon 1 , Adam Soames 1 , Varun Ghodkay 1 , Rolf Gubner 1 , Ahmed Barifcani 1 Chemical Engineering Department, Curtin University of Technology, Perth W.A, Australia Abstract This study was conducted to investigate the operation of a packed distillation column and analyse its performance during the separation of mono-ethylene glycol from water. The column was designed and constructed by the Curtin Corrosion Engineering Industry Centre (CCEIC) and operated in collaboration with a reputable oil company to generate experimental field data. A secondary investigation was then performed into the impacts of dissolved salts within the rich MEG feed upon the purity of the lean MEG product. It was observed through application of the FUG shortcut distillation design equations that six equilibrium stages were required to attain the experimental separations reported under continuous operation of the column. It was further determined that the packing utilised within the column had a Height Equivalent to a Theoretical Plate (HETP) of approximately 0.34 metres when no dissolved salts were present corresponding to an estimated packing height of approximately 1.7 metres. The impact of dissolved salts upon the performance of the column was evident through lower lean MEG purities observed during experimental operation of the column in comparison to salt free trials. The reduction in column performance was reaffirmed by Aspen HYSYS and Aspen Plus simulations of the field data, where salt trials resulted in lean MEG purities noticeably less than corresponding salt free experimental trials and simulated predictions. Overall, it was observed that the presence of dissolved salts during operation led to a reduction in MEG mass fraction of the final lean MEG product by on average 7.2%. The impact of dissolved salts on lean MEG purity was successfully predicted by Aspen Plus simulation with an average accuracy of 1.61% through the inclusion of monovalent salt cations using the ELECNRTL equation of state with modified binary parameters. The reduction in lean MEG purity was attributed to boiling point elevation of the MEG-Water solution and the impact of the dissolved salts on the systems vapour liquid equilibrium. Keywords: Mono-ethylene Glycol; MEG; Distillation; Salts; Simulation and Experimental Study; Field Data 1.0 Introduction Mono-ethylene glycol (MEG) is an important raw material having numerous research and industrial applications, one such example is its application as a hydrate inhibitor in the hydrocarbon processing industry (Lu, Kan, and Tomson 2010). MEG is one of the most favoured thermodynamic hydrate inhibitors used in hydrocarbon transportation pipelines and processing facilities due to its low volatility, low toxicity, low flammability, favourable thermodynamic behaviour, simple and proven technology requirements and high availability (Bikkina et al. 2012, Haque 2012). Furthermore, the preference for using MEG over other traditional thermodynamic hydrate inhibitors such as methanol stems from several operational, environmental and safety issues imposed by the use of methanol and MEG’s ability to be effectively recovered, regenerated and reused (AlHarooni et al. 2015, Haghighi et al. 2009). Due to the high cost of MEG and significant volumes required to provide effective hydrate control, following the hydrate inhibition process it is essential to separate MEG from the produced water so that it can be recycled and reused to minimize operating costs. The most prevalent MEG recovery methods have been broadly categorised into two main process types, (i) reconcentration and (ii) regeneration (Bikkina et al. 2012). The reconcentration process is the most basic MEG recovery method and is comprised of a simple distillation column where the water rich MEG is concentrated to form lean MEG by vaporisation of the excess water. Typically, the distillation column is operated to regain a MEG purity within the range of 80-90% by weight as the bottoms product (Latta, Seiersten, and Bufton 2013, Carroll 2003). The reconcentration method for MEG recovery is applicable when no salts are expected to precipitate out during recovery, typically during the early production stages when the produced water contains just low amounts of dissolved salts (Bikkina et al. 2012, Brustad, Løken, and Waalmann 2005). As the reconcentration process only removes water from the MEG solution, any dissolved salts, pipeline corrosion products and additional non-volatile chemicals will accumulate inside the closed MEG loop. The accumulation of salt beyond saturation limits within
Transcript

Recovery of Mono-Ethylene Glycol Distillation and the

Impact of Dissolved Salts Simulating Field Data

Sami Zaboon1 , Adam Soames1, Varun Ghodkay1, Rolf Gubner1, Ahmed Barifcani1

Chemical Engineering Department, Curtin University of Technology, Perth W.A, Australia

Abstract

This study was conducted to investigate the operation of a packed distillation column and analyse its performance

during the separation of mono-ethylene glycol from water. The column was designed and constructed by the

Curtin Corrosion Engineering Industry Centre (CCEIC) and operated in collaboration with a reputable oil company

to generate experimental field data. A secondary investigation was then performed into the impacts of dissolved

salts within the rich MEG feed upon the purity of the lean MEG product. It was observed through application of

the FUG shortcut distillation design equations that six equilibrium stages were required to attain the experimental

separations reported under continuous operation of the column. It was further determined that the packing

utilised within the column had a Height Equivalent to a Theoretical Plate (HETP) of approximately 0.34 metres

when no dissolved salts were present corresponding to an estimated packing height of approximately 1.7 metres.

The impact of dissolved salts upon the performance of the column was evident through lower lean MEG purities

observed during experimental operation of the column in comparison to salt free trials. The reduction in column

performance was reaffirmed by Aspen HYSYS and Aspen Plus simulations of the field data, where salt trials resulted

in lean MEG purities noticeably less than corresponding salt free experimental trials and simulated predictions.

Overall, it was observed that the presence of dissolved salts during operation led to a reduction in MEG mass

fraction of the final lean MEG product by on average 7.2%. The impact of dissolved salts on lean MEG purity was

successfully predicted by Aspen Plus simulation with an average accuracy of 1.61% through the inclusion of

monovalent salt cations using the ELECNRTL equation of state with modified binary parameters. The reduction in

lean MEG purity was attributed to boiling point elevation of the MEG-Water solution and the impact of the

dissolved salts on the systems vapour liquid equilibrium.

Keywords: Mono-ethylene Glycol; MEG; Distillation; Salts; Simulation and Experimental Study; Field Data

1.0 Introduction

Mono-ethylene glycol (MEG) is an important raw material having numerous research and industrial applications,

one such example is its application as a hydrate inhibitor in the hydrocarbon processing industry (Lu, Kan, and

Tomson 2010). MEG is one of the most favoured thermodynamic hydrate inhibitors used in hydrocarbon

transportation pipelines and processing facilities due to its low volatility, low toxicity, low flammability, favourable

thermodynamic behaviour, simple and proven technology requirements and high availability (Bikkina et al. 2012,

Haque 2012). Furthermore, the preference for using MEG over other traditional thermodynamic hydrate inhibitors

such as methanol stems from several operational, environmental and safety issues imposed by the use of

methanol and MEG’s ability to be effectively recovered, regenerated and reused (AlHarooni et al. 2015, Haghighi

et al. 2009). Due to the high cost of MEG and significant volumes required to provide effective hydrate control,

following the hydrate inhibition process it is essential to separate MEG from the produced water so that it can be

recycled and reused to minimize operating costs.

The most prevalent MEG recovery methods have been broadly categorised into two main process types, (i)

reconcentration and (ii) regeneration (Bikkina et al. 2012). The reconcentration process is the most basic MEG

recovery method and is comprised of a simple distillation column where the water rich MEG is concentrated to

form lean MEG by vaporisation of the excess water. Typically, the distillation column is operated to regain a MEG

purity within the range of 80-90% by weight as the bottoms product (Latta, Seiersten, and Bufton 2013, Carroll

2003). The reconcentration method for MEG recovery is applicable when no salts are expected to precipitate out

during recovery, typically during the early production stages when the produced water contains just low amounts

of dissolved salts (Bikkina et al. 2012, Brustad, Løken, and Waalmann 2005). As the reconcentration process only

removes water from the MEG solution, any dissolved salts, pipeline corrosion products and additional non-volatile

chemicals will accumulate inside the closed MEG loop. The accumulation of salt beyond saturation limits within

the MEG system may result in severe fouling and plugging of equipment and flowlines, as such the salt must be

either removed or the MEG periodically replaced (Son and Wallace 2000).

For cases where the rich MEG contains high quantities of dissolved salts, reclamation must instead be performed

before the MEG can be reinjected at the well head to prevent damage to process equipment through excessive

solid build-up. The reclamation of MEG can be performed using two different methods depending on the required

final lean MEG salt concentration, by either full reclamation or slip-stream salt removal. The process of full

reclamation entails a two-step process where the rich MEG solution is initially vaporized at low pressure (10-15

kPaa) leaving the salts and non-volatile solids remaining within a flash drum (Bikkina et al. 2012, Brustad, Løken,

and Waalmann 2005). The salt free MEG solution is then reconcentrated by distillation to the required lean MEG

specifications by the removal of water. Full reclamation is generally performed when high rates of formation water

are expected over the lifetime of the processing facility.

Alternatively, slip stream regeneration may be performed when a certain level of dissolved salts can be tolerated

within the closed MEG loop during processing. For low to medium formation water rates it is often more attractive

to use the split-stream salt removal process to minimise operating costs and equipment size (Latta, Seiersten, and

Bufton 2013). In performing split stream regeneration, the rich MEG solution first undergoes pre-treatment to

remove light hydrocarbons, low soluble salts and corrosion products before conventional distillation is performed

to remove excess water to achieve the desired MEG purity. Following distillation, the majority of the lean MEG

undergoes salt removal via a reclaimer or ion exchange system to remove the remaining highly soluble salts.

However, a fraction of the salty lean MEG stream by-passes the salt removal operation and mixes with the final

salt free lean MEG. The slip-stream rate is typically determined by the allowable amount of soluble salts in the

final lean MEG product required to prevent scaling in pipelines (Bikkina et al. 2012, Brustad, Løken, and Waalmann

2005).

The typical design and construction of MEG recovery columns utilise packed internals for columns of diameter

0.7m and below due to the low pressure drop and high efficiency of separation (McCabe 1993, Kister 1992). For

columns operating with higher vapour loads, trays may be more suitable and as such must be considered during

the design phase. The design of a packed column can be performed through either the concept of transfer units

or the evaluation of the height equivalent to theoretical plates (HETP) in combination with standard estimation of

the number of required equilibrium stages. The number of equilibrium stages required can be determined through

either graphical methods such as McCabe-Thiele or short-cut distillation column design methods such as the

Fenske-Underwood-Gilliland (FUG) method. Further evaluation of a packed columns design can be performed

using mass and heat transfer coefficients through non-equilibrium rate based models and is recommended for

highly non-ideal, polar or reactive systems (Kister 1992). Additionally, simulation software, such as ASPEN HYSYS

or ASPEN Plus may also be used for the design or evaluation of distillation systems.

The operating conditions of a MEG recovery column can vary depending upon the operating envelope of the

individual distillation unit (AlHarooni et al. 2015). Some MEG recovery units operate at temperatures as low as

95°C (Diba, Guglielminetti, and Schiavo 2003), 140°C (Montazaud 2011) and up to temperatures of 160°C

(Gonzalez, Alfonso, and Pellegrino 2000), with Psarrou et al (2011) recommending operation between 120°C to

160°C within the reboiler. Standard industrial operating practice for both the regeneration and reclamation

process typically sees the operation of the MEG distillation column at atmospheric to vacuum pressures (Psarrou

et al. 2011). The operating temperature and pressure of the reboiler depends highly on the temperature to which

MEG will begin to experience thermal degradation. Under excessive temperatures, MEG may begin to break down

to form organics acids including glycolic, acetic and formic acids (AlHarooni et al. 2015, Rossiter Jr et al. 1985)

leading to higher operating costs through MEG makeup, impacts on system pH requiring additional adjustment

and the potential increase in carbon steel corrosion through the presence of acetic acid (Ikeh, Enyi, and Nasr 2016,

Dong, ZhenYu, and XingPeng 2008). To combat MEG thermal degradation, the reboiler may be operated at lower

pressures to reduce the required temperature to achieve boiling in order to decrease the likelihood of the MEG

degrading (AlHarooni et al. 2015).

In this study, the primary focus of investigation is the recovery of MEG from water at varying temperatures and

feed concentrations under both batch and continuous operation at a fixed reflux ratio. A secondary investigation

has then been performed to investigate the impact salts present within the rich MEG feed on the MEG

regeneration process through analysis of experimental and simulated results.

2.0 Salt Precipitation within MEG Systems

The prevention and mitigation of salt precipitation within process piping and equipment is a crucial aspect of

effectively designing a MEG regeneration system. Typically, the most frequently encountered salts in MEG

processing occur from the presence of the monovalent cations sodium, Na+ potassium, K+ and the divalent

cations calcium, Ca2+ iron, Fe2+ and magnesium, Mg2+ (Latta et al. 2016, Babu et al. 2015). Within the confines

of the MEG regeneration column, the primary impact of salt occurs due to the precipitation of the divalent salts,

CaCO3, FeCO3, FeS and Mg(OH)2 within the columns internals and reboiler unit. Due to the high solubility of

monovalent cations, they typically remain dissolved in the MEG solution by-passing the regeneration column only

precipitating once reaching the downstream MEG reclamation unit (Latta et al. 2016).

In hydrocarbon gas processing, the participation of CaCO3 is considered to be one of the most frequently

experienced sources of mineral precipitation and scaling (Flaten et al. 2015). The presence of Ca2+ in the MEG

solution originates from the breakthrough of formation water during processing alongside Mg2+ and the

previously mentioned monovalent cations. Conversely, the presence of Fe2+ within an MEG recovery system

primarily stems from the development of an iron carbonate film upon the inside of piping for corrosion control

and is such referred to as a corrosion product (Flaten, Seiersten, and Andreassen 2010). The precipitation of FeCO3

primarily occurs within ‘sweet’ systems with low H2S content, however, the precipitation of FeS is possible when

the H2S concentration is sufficient (Figueiredo et al. 2015). As carbon steel piping is used in most if not all MEG

recovery systems, pipeline corrosion products will always be present to some degree in both solid and dissolved

forms. Alongside CaCO3, FeCO3 is one of the most abundant carbonates precipitating within MEG distillation

systems (Latta et al. 2016, Figueiredo et al. 2015).

The effect of salt precipitation upon MEG regeneration columns is most prevalent within a columns reboiler unit

and associated piping. The precipitation of divalent salts, in particular CaCO3 and FeCO3 is promoted by the high

fraction of MEG in the bottom product (Latta et al. 2016). This effect is shown by the solubility studies performed

by Kassa and co-workers who observed decreasing solubility of various salts in increasing MEG content solutions.

The precipitation of salts within the columns reboiler can cause severe fouling and the accumulation of suspended

solids in the lean MEG bottoms product (Latta et al. 2016). The overall influence of fouling may lead to the reduced

heat transfer efficiency of the reboiler resulting in a poor separation of the MEG from water. The presence of iron

sulphide within piping and MEG systems can cause major issues due to its ability to cause crevice or bimetallic

corrosion in the presence of water (Smith and Miller 1975).

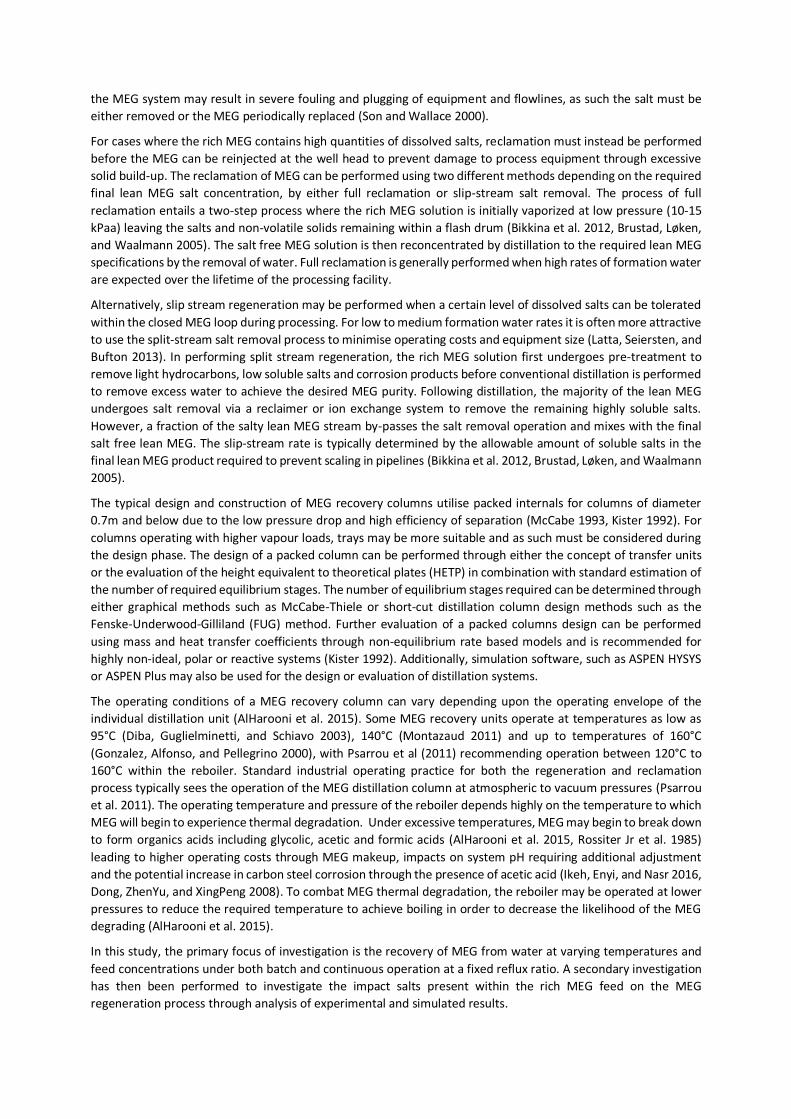
3.0 Process Design and Configuration

As shown by the process flow scheme in Figure 1, the distillation system is comprised of a feed pre-treatment

section followed by a packed distillation column. Initially, a feed tank is used for the preparation of the MEG-Water

solution using MEG supplied by Chem Supply Australia with the typical composition shown in Table 1. Once

prepared, the rich MEG feed is pumped through a filtration system to remove solid particulates and is

subsequently measured by a mass flow meter (MFM) to monitor inlet flow. The MEG-Water feed to the column

was maintained at 30°C, 140 kPa at a mass flow rate of 6.5 kg/hour and fed directly into the re-boiler unit. Prior

to operation, the MEG feed tank is blanketed with nitrogen gas to prevent oxygen ingress within the vessel.

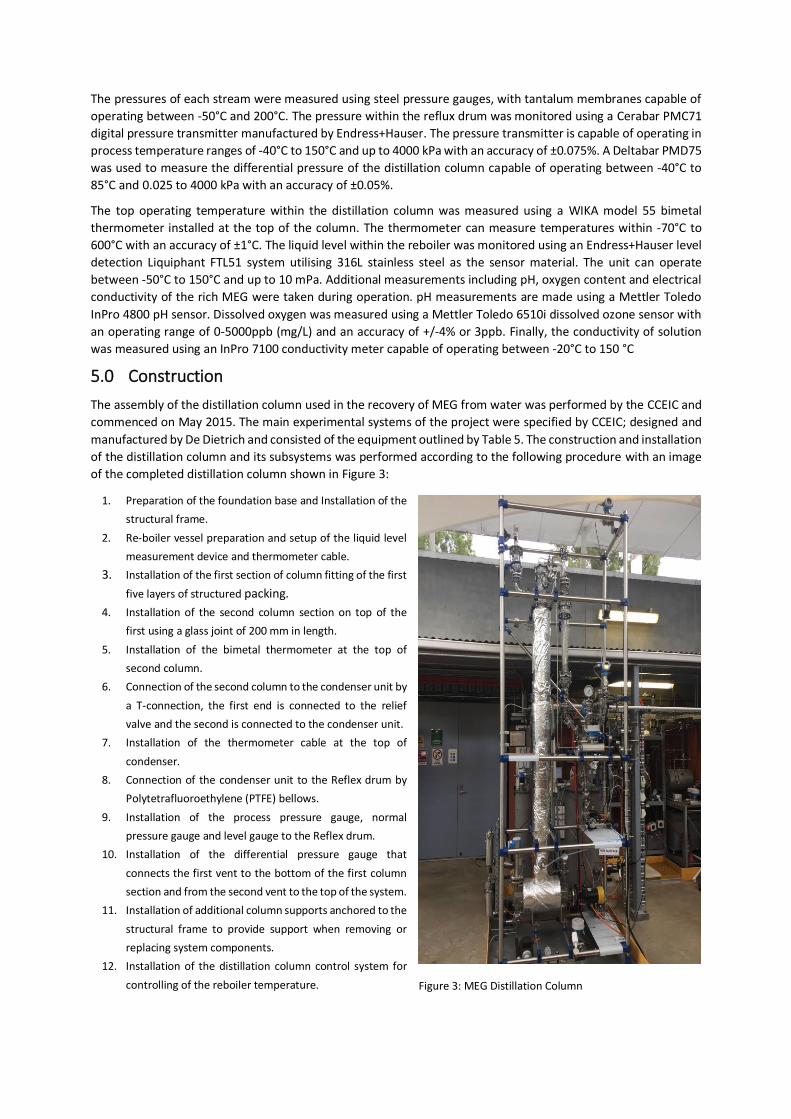
The distillation system employs a 0.012m3 glass re-boiler at the base of the column heated by a 5kW insertion

heater. The power of the re-boiler’s heater is directly controlled by a programmable logical controller (PLC) to

maintain the desired reboiler temperature during operation. The bottoms product of the re-boiler is removed

through the MEG pump and the flow rate measured by a MFM, the product is then cooled by a plate heat

exchanger operated using cooling water at 15°C.

The main section of the distillation column itself is comprised of two individual sections, each one metre in height.

The sections are connected and fitted with structural packing of diameter 80 mm DN (3”). The column operates

with a pressure differential indicator and temperature gauge to monitor the conditions within the column during

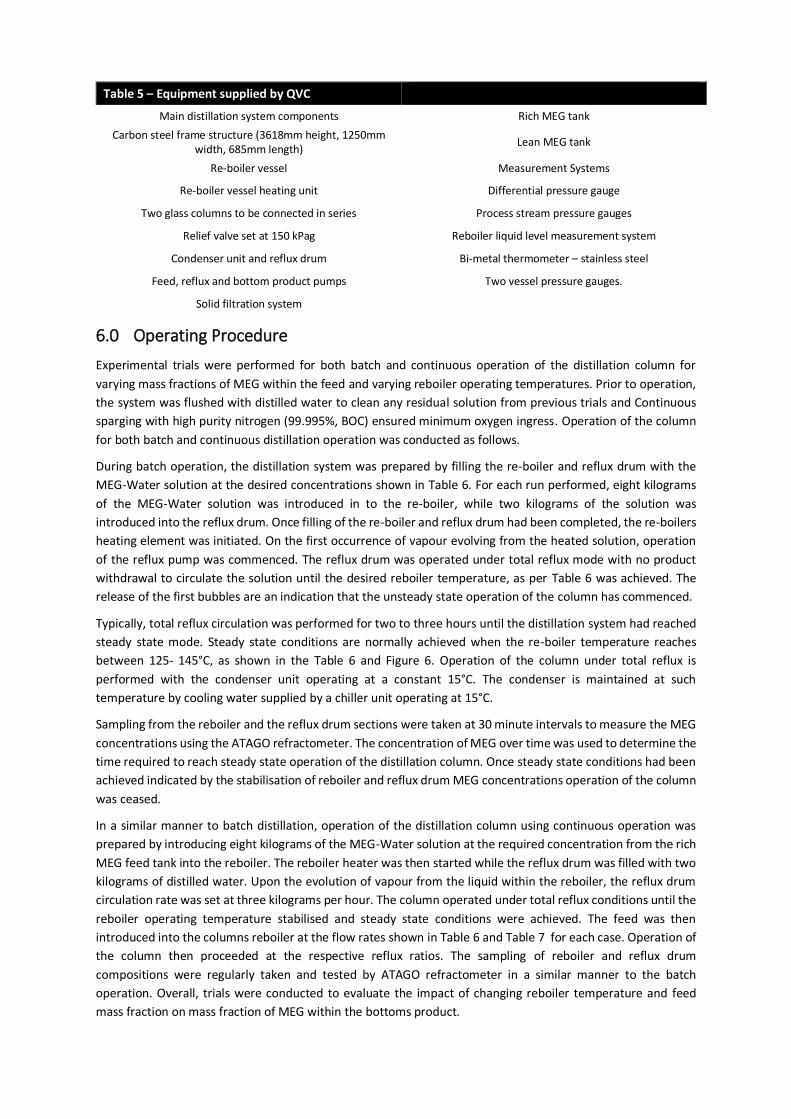
processing. The final section of the distillation system encapsulates the vapour condensation and reflux systems.

The condenser unit acts as a total condenser and is operated using cool water provided by a chiller system at

approximately 15°C with the flow rate of cooling water manually controlled. A glass reflux drum is located directly

below the condenser unit to collect the liquid reflux by gravitationally induced flow. The reflux is then fed back

into the distillation columns by pump and measured by a MFM, if required, a water product stream can also be

operated during continuous operation.

Additional measurements are performed by means of pH, O2 and conductivity probes located at the re-boiler and

reflux product line. Further monitoring of the process is performed by level and pressure gauges installed in the

locations shown by Figure 1, with an additional level sensor installed on the re-boiler unit.

Table 1 – MEG Composition

Minimum Assay (%) 99.0%

Water 0.5%

Diethylene Glycol (DEG) 0.02%

Ash Content 0.001%

Acidity (as Acetic Acid) 0.001%

Aldehyde (as Formaldehyde) 0.0008%

Chlorine (Cl) 0.00001%

Iron (Fe) 0.000005%

Table 2 – MEG Regeneration Flow Scheme Abbreviations

B.V Ball Valve LG Level Gauge PDI

Pressure Differential Indicator

SV Safety Valve

CH.V Check Valve LS Level Sensor TG Temperature Gauge

CO Total Condenser LT Level Transmitter PG Pressure Gauge V Valve

DC Distillation Column MFM Mass Flow Meter RB Reboiler

H-Ex Heat Exchanger N.V Needle Valve RD Reflux Drum

Figure 1: Flow Diagram for MEG Recovery System

4.0 Equipment Used

The separation of MEG from water was performed using a structurally packed distillation column constructed by

De Dietrich Process Systems GmbH, Germany, (De Dietrich) for MEG processing, based upon specifications

developed by the Curtin Corrosion Engineering Industry Centre (CCEIC). The operating conditions and design

specifications of the MEG distillation column are summarised in Table 3. The distillation column operates using

Durapack borosilicate glass 3.3 structured packing provided by De Dietrich, such packing was chosen for its high

mass transfer efficiency. Table 4 outlines the specifications and dimensions of the structured packing.

Partial vaporisation of the bottoms product was performed using a kettle type glass reboiler designed for a liquid

volume capacity of eight litres. Operation of the reboiler unit was maintained at 130 kPa throughout distillation,

with the unit operated within a temperature range of 120°C up to 160°C. Operation of the reboiler unit at

temperatures above 160°C was not performed due to the possibility of thermal degradation effects of MEG at

temperatures reaching its boiling point with a temperature limiter was installed as a safety measure to prevent

operation at temperatures above 160°C. Furthermore, the total condenser unit operates in conjunction with a 5

litre capacity reflux drum to provide liquid reflux to the column.

The distillation system was operated using magnetic drive gear

pump systems manufactured by Micropump for the feed,

bottom and reflux product pumps. The Micropump L15034

pump was employed for pumping of the feed stream with a total

capacity of 6.5 kg/hr. Conversely, the reflux and bottom product

pumps were designed for a maximum capacity of 4kg/hr using

the L21382 Micropump system. The composition of the MEG-

Water solution in the feed, distillate and bottom products was

measured using an ATAGO PAL-91S refractometer shown in

Figure 2. The refractometer measures the MEG concentration

within a 0-90% concentration range with an accuracy of ±0.4%

(V/V) based upon the refractive index of the solution. The mass

flow rate of each stream was measured by Promass A100 inline

mass flow metres manufactured by Endress+Hauser with an

accuracy of ±0.1%.

Table 3 – Distillation Column Specifications

Feed Rate Up to 6.5 Kg/hr.

Feed Conditions Temperature: 30°C, Pressure: 140 kPa

Column Design Operating Pressure 100-150 kPa

Distillation Design Temperature 20-150 °C

Condenser Type Total

Reflux Drum (Capacity/Pressure) 0.005m3 / 120 kPa

Reboiler (Capacity/Pressure) Kettle type (0.008m3/130 kPa)

Reboiler Power requirements 5 kW

Column Diameter DN 80 (76.2 mm)

Packing height 900 mm x 2 Sections

Packing material Borosilicate glass 3.3 Structured Packing

Table 4 – Packing Specifications

Packing Surface Area 300.0 m2/m3

Packing Factor, 𝐹𝑃 195.3 m2/m3

Packing Void Fraction 0.824

Corrugation Base Width 1.8856 cm

Corrugation Side Dimension 1.3333 cm

Corrugation Height 0.94281 cm

Corrugation Angle 45°

Figure 2: ATAGO Refractometer (ATAGO)

The pressures of each stream were measured using steel pressure gauges, with tantalum membranes capable of

operating between -50°C and 200°C. The pressure within the reflux drum was monitored using a Cerabar PMC71

digital pressure transmitter manufactured by Endress+Hauser. The pressure transmitter is capable of operating in

process temperature ranges of -40°C to 150°C and up to 4000 kPa with an accuracy of ±0.075%. A Deltabar PMD75

was used to measure the differential pressure of the distillation column capable of operating between -40°C to

85°C and 0.025 to 4000 kPa with an accuracy of ±0.05%.

The top operating temperature within the distillation column was measured using a WIKA model 55 bimetal

thermometer installed at the top of the column. The thermometer can measure temperatures within -70°C to

600°C with an accuracy of ±1°C. The liquid level within the reboiler was monitored using an Endress+Hauser level

detection Liquiphant FTL51 system utilising 316L stainless steel as the sensor material. The unit can operate

between -50°C to 150°C and up to 10 mPa. Additional measurements including pH, oxygen content and electrical

conductivity of the rich MEG were taken during operation. pH measurements are made using a Mettler Toledo

InPro 4800 pH sensor. Dissolved oxygen was measured using a Mettler Toledo 6510i dissolved ozone sensor with

an operating range of 0-5000ppb (mg/L) and an accuracy of +/-4% or 3ppb. Finally, the conductivity of solution

was measured using an InPro 7100 conductivity meter capable of operating between -20°C to 150 °C

5.0 Construction

The assembly of the distillation column used in the recovery of MEG from water was performed by the CCEIC and

commenced on May 2015. The main experimental systems of the project were specified by CCEIC; designed and

manufactured by De Dietrich and consisted of the equipment outlined by Table 5. The construction and installation

of the distillation column and its subsystems was performed according to the following procedure with an image

of the completed distillation column shown in Figure 3:

1. Preparation of the foundation base and Installation of the

structural frame.

2. Re-boiler vessel preparation and setup of the liquid level

measurement device and thermometer cable.

3. Installation of the first section of column fitting of the first

five layers of structured packing.

4. Installation of the second column section on top of the

first using a glass joint of 200 mm in length.

5. Installation of the bimetal thermometer at the top of

second column.

6. Connection of the second column to the condenser unit by

a T-connection, the first end is connected to the relief

valve and the second is connected to the condenser unit.

7. Installation of the thermometer cable at the top of

condenser.

8. Connection of the condenser unit to the Reflex drum by

Polytetrafluoroethylene (PTFE) bellows.

9. Installation of the process pressure gauge, normal

pressure gauge and level gauge to the Reflex drum.

10. Installation of the differential pressure gauge that

connects the first vent to the bottom of the first column

section and from the second vent to the top of the system.

11. Installation of additional column supports anchored to the

structural frame to provide support when removing or

replacing system components.

12. Installation of the distillation column control system for

controlling of the reboiler temperature. Figure 3: MEG Distillation Column

6.0 Operating Procedure

Experimental trials were performed for both batch and continuous operation of the distillation column for

varying mass fractions of MEG within the feed and varying reboiler operating temperatures. Prior to operation,

the system was flushed with distilled water to clean any residual solution from previous trials and Continuous

sparging with high purity nitrogen (99.995%, BOC) ensured minimum oxygen ingress. Operation of the column

for both batch and continuous distillation operation was conducted as follows.

During batch operation, the distillation system was prepared by filling the re-boiler and reflux drum with the

MEG-Water solution at the desired concentrations shown in Table 6. For each run performed, eight kilograms

of the MEG-Water solution was introduced in to the re-boiler, while two kilograms of the solution was

introduced into the reflux drum. Once filling of the re-boiler and reflux drum had been completed, the re-boilers

heating element was initiated. On the first occurrence of vapour evolving from the heated solution, operation

of the reflux pump was commenced. The reflux drum was operated under total reflux mode with no product

withdrawal to circulate the solution until the desired reboiler temperature, as per Table 6 was achieved. The

release of the first bubbles are an indication that the unsteady state operation of the column has commenced.

Typically, total reflux circulation was performed for two to three hours until the distillation system had reached

steady state mode. Steady state conditions are normally achieved when the re-boiler temperature reaches

between 125- 145°C, as shown in the Table 6 and Figure 6. Operation of the column under total reflux is

performed with the condenser unit operating at a constant 15°C. The condenser is maintained at such

temperature by cooling water supplied by a chiller unit operating at 15°C.

Sampling from the reboiler and the reflux drum sections were taken at 30 minute intervals to measure the MEG

concentrations using the ATAGO refractometer. The concentration of MEG over time was used to determine the

time required to reach steady state operation of the distillation column. Once steady state conditions had been

achieved indicated by the stabilisation of reboiler and reflux drum MEG concentrations operation of the column

was ceased.

In a similar manner to batch distillation, operation of the distillation column using continuous operation was

prepared by introducing eight kilograms of the MEG-Water solution at the required concentration from the rich

MEG feed tank into the reboiler. The reboiler heater was then started while the reflux drum was filled with two

kilograms of distilled water. Upon the evolution of vapour from the liquid within the reboiler, the reflux drum

circulation rate was set at three kilograms per hour. The column operated under total reflux conditions until the

reboiler operating temperature stabilised and steady state conditions were achieved. The feed was then

introduced into the columns reboiler at the flow rates shown in Table 6 and Table 7 for each case. Operation of

the column then proceeded at the respective reflux ratios. The sampling of reboiler and reflux drum

compositions were regularly taken and tested by ATAGO refractometer in a similar manner to the batch

operation. Overall, trials were conducted to evaluate the impact of changing reboiler temperature and feed

mass fraction on mass fraction of MEG within the bottoms product.

Table 5 – Equipment supplied by QVC

Main distillation system components Rich MEG tank

Carbon steel frame structure (3618mm height, 1250mm width, 685mm length)

Lean MEG tank

Re-boiler vessel Measurement Systems

Re-boiler vessel heating unit Differential pressure gauge

Two glass columns to be connected in series Process stream pressure gauges

Relief valve set at 150 kPag Reboiler liquid level measurement system

Condenser unit and reflux drum Bi-metal thermometer – stainless steel

Feed, reflux and bottom product pumps Two vessel pressure gauges.

Solid filtration system

7.0 Operating Results and Calculations

Operating results of sixteen trials utilising both batch and continuous operation are summarised in Table 6 and

Table 7. Analysis of the results was conducted using the McCabe-Thiele graphical method in conjunction with

the Fenske-Underwood-Gilliland short cut distillation column design equations to determine the number of

stages required to achieve the experimental separations. As results were recorded in mass fractions they were

first converted to mole fractions for the purpose of estimating the number of stages by both methods. Figures

8 to 10 present the McCabe Thiele diagrams for Trials (1), (6) and (16) respectively. In addition, the concepts of

transfer units and HETP were used to further evaluate the efficiency of the columns packing with the

methodology utilised discussed in the subsequent section. A summary of the analysis performed can be found

in Table 9 for batch and Table 10 for continuous experimental trials. Figure 6, illustrates the operation of the

column during batch operation for Trials (1) and (2), it was observed that the system reached equilibrium

typically within 60 minutes.

In order to construct the McCabe-Thiele graphical diagrams, an estimation of the Vapour Liquid Equilibrium

(VLE) curve of the MEG-Water binary system was required. Estimation of the curve was performed using partial

pressures derived from Antoine coefficients for both water and MEG over the operating temperature of the

column. A comparison was also made to literary sources of VLE data and is graphically represented in Figure 7.

It can be observed that the calculated VLE curve is lower than that of many sources of VLE data, the difference

can be attributed to the higher operating temperatures of the column compared to the test conditions the VLE

data was obtained at. However, the calculated VLE curve closely matches the data of Trimble and Potts (1935)

where the data was derived at a similar pressure.

The operation of the ATAGO refractometer in measuring the MEG mass concentration within the reflux drum

was limited to 100ppm. Therefore, the lower concentrations experienced during continuous operation recorded

a concentration of zero, as such, a value of minimum value of 100ppm was used in analysis of the continuous

trials.

Figure 4: MEG Distillation Column Reboiler Figure 5: MEG Distillation Column Reflux Vessel

Table 6 – Batch and Continuous Operating Conditions and Product Compositions Salt Free Trials

Trial

No.

Column

Operation

Type

Reboiler

Temperature

(K)

MEG Feed

Mass

Fraction

Feed Flow

Rate

(kg/hr)

Reflux

Ratio

Reboiler

MEG Mass

Fraction

Reflux Drum MEG

Concentration

(ppm)

(1) Batch 135°C 0.55 - Total 0.820 1500

(2) Batch 140°C 0.65 - Total 0.860 2000

(3) Continuous 130°C 0.5 5 0.44 0.776 < 100

(4) Continuous 135°C 0.50 5 0.52 0.834 < 100

(5) Continuous 137°C 0.5 5 0.52 0.848 < 100

(6) Continuous 140°C 0.50 5 0.44 0.864 < 100

(7) Continuous 141°C 0.65 6 0.51 0.860 < 100

(8) Continuous 142°C 0.45 5 0.33 0.868 < 100

(9) Continuous 145°C 0.5 5 0.44 0.876 < 100

Table 7 – Continuous Operating Conditions and Product Compositions Dissolved Salt Trials

Trial

No.

Reboiler

Temperature (K)

MEG Feed

Mass Fraction

Feed Flow

Rate (kg/hr)

Reflux

Ratio

Reboiler MEG Mass

Fraction

Reflux Drum MEG

Concentration (ppm)

(10) 130°C 0.675 5.24 0.50 0.740 < 100

(11) 130°C 0.65 5.0 0.50 0.720 < 100

(12) 135°C 0.715 5.0 0.50 0.750 < 100

(13) 135°C 0.71 5.3 0.50 0.780 < 100

(14) 135°C 0.70 5.0 0.50 0.750 < 100

(15) 135°C 0.74 5.0 0.50 0.770 < 100

(16) 140°C 0.73 5.3 0.51 0.800 < 100

Table 8 – Salt Trial Dissolved Salt Compositions Within Reboiler

Dissolved Salts (ppm)

Trial Number

(10) (11) (12) (13) (14) (15) (16)

Na+ 8744 8804 8021 7819 8281 7243 6695

K+ 3090 2715 2909 3213 3121 2813 2645

Ca2+ 2.9 3.5 3.88 163 19.8 2.3 99

Mg2+ - - 0.233 0.647 - - -

Fe3+ 0.346 0.445 0.347 0.109 0.255 0.43 0.127

Sr2+ 0.011 0.013 - 0.243 0.044 0.024 0.237

Ba2+ 0.504 0.367 0.273 0.574 0.452 0.295 0.615

7.1 Calculation Equations and Methodology

The required number of stages for each trial experiment was estimated using the Fenske-Underwood-Gilliland

(FUG) shortcut design equations. Initially, the minimum number of stages required to achieve a given separation

was estimated using the Fenske equation given by Equation (1). For trials one and two, operating under batch

conditions the minimum number of stages given by the Fenske equation represent the actual number of stages

required.

Nmin =

ln [(xA

xB)

dist

(xB

xA)

bot

]

ln αAB

(1)

Due to the binary nature of the MEG-Water system, estimation of the minimum reflux ratio by the

multicomponent system Underwood equations was unnecessary. Instead, the minimum reflux was estimated

by Equation (2) of which is derived from the Underwood minimum reflux equations for binary systems where

the liquid feed fraction is equal to one.

Rmin =1

α − 1[xD

xF

− α (1 − xD

1 − xF

)] (2)

The estimation of the actual number of stages required at a finite reflux was performed using the Gilliland

correlation in the form of the modified Molokanov et al. (1971) equation. Molokanov’s correlation is

represented by Equation (3).

N − Nmin

N + 1= 1 − exp [(

1 + 54.4ψ

11 + 117.2ψ) (

ψ − 1

ψ0,5)]

ψ =R − Rmin

R + 1

(3)

The number and height of transfer units were estimated to provide a secondary estimation of the packed

columns performance. The number of transfer units (NTU) required represents the difficulty of the separation

whereas the height of transfer units (HTU) is a measure of the effectiveness of the packing (Coker 2010).

50

55

60

65

70

75

80

85

90

0 40 80 120 160 200 240

MEG

% in

RB

Time (min)

Reboiler MEG Concentration vs. Time

MEG 55% at 135°C

MEG 65% at 140°C

Figure 6: Batch Reboiler MEG Concentration Over Time

Estimation of the number of transfer units for each trial was performed using Equation (4) and evaluated using

numerical integration by the Simpson’s rule.

NTU = ∫dy

y∗ − y

yD

yB

(4)

As described by Dutta (2007), the mass transfer exchange between the vapour and liquid phases in distillation

is primarily controlled by the vapour phase resistance. As such, the estimation of the HTU was conducted based

upon the overall height of the gas phase transfer unit, HOG as per Equation (6). The gas and liquid phase transfer

units, HG and HL can be evaluated from the individual mass transfer coefficients of the gas and liquid phases,

kG and kL respectively and the effective interfacial area of packing, ae through Equations (6) and (7).

HOG = HG + λHL (5)

HG =ug

kGae

(6)

HL =uL

kLae

(7)

λ = mGm

Lm

(8)

The height equivalent to a theoretical plate (HETP) represents a correlating factor between the height of packing

required and the estimated number of theoretical stages necessary to achieve a desired separation (Coker 2010).

The concept of HETP is used during column design to allow comparison of efficiencies between packed and plate

columns, and is defined by Equation (9). Alternately, the HETP can be estimated from experimental results

through the HOG by application of Equations (10) or (11).

HETP = Z/N (9)

HETP =HOG . ln (m

Gm

Lm)

mGm

Lm − 1

= HOG .ln λ

λ − 1 for λ ≠ 1 (10)

HETP = HOG for λ = 1 (11)

In order to determine gas phase transfer unit HOG, initial estimation of the gas and liquid phase mass transfer

coefficients was required. Estimation was performed using the mass transfer correlations developed by Bravo,

Rocha, and Fair (1985) for gauze type structured packing due to its applicability to the structured packing utilised

during distillation. Furthermore, the more simplistic nature of the correlations developed by Bravo, Rocha, and

Fair (1985) compared to newer correlations as outlined by Wang, Yuan, and Yu (2005) was considered

favourable. The gas and liquid phase mass transfer coefficient correlations utilised are outlined by Equations

(12) and (13) respectively.

kG = 0.0338DG

deq

[ρgdeq(uLe + uGe)

μG

]

0.8

ScG0.33 (12)

kL = 2√DL

πs(

9Γ2g

8ρLμL

)

13

(13)

uGe =uG

ϵ sin α (14)

uLe = (9Γ2g

8ρLμL

)

13

(15)

Additional correlations developed by Wilke and Chang (1955) and Chapman (1970) were utilised in estimation

of the liquid and gas phase diffusion coefficients respectively. The liquid phase diffusion coefficient, DL was

estimated through Equation (17) utilising an association parameter assumed equal to that of ethanol of 1.5. The

gas phase diffusion coefficient, DG was estimated through Equation (16) with the collision integral, Ω estimated

through Equation (18) using the corresponding collision integrals reported by Cussler (1997). Equation (18) was

evaluated using the Lennard-Jones potential parameters reported by Cussler (1997) and Ben-Amotz and

Herschbach (1990) for water and ethylene glycol respectively. The average collision diameter, σ12 calculated

through Equation (19) was evaluated using the particle sizes reported by Cussler (1997) and Ben-Amotz and

Herschbach (1990) for water and ethylene glycol respectively.

DG = 1.86 ×

10−3T32 (

M1 + M2

M1M2)

12

Pσ122 Ω

(16)

DL =7.4 × 10⁻⁸(√ϕ2M2)T

μ2V10.6 (17)

ε12

kBT=

√(ε1

kB) (

ε2

kB)

T (°K)

(18)

σ12 =1

2(σ1 + σ2) (19)

The effective interfacial area provided by the packing utilised within the distillation column was estimated using

the simple correlation proposed by Bravo and Fair (1990) given by Equation (20). The interfacial area was

estimated assuming a flood percentage, Fr less than 85% based upon the packing surface area, ap provided in

Table 4.

Table 9 – Analysis Summary of Batch Operation

Trial No.

McCabe-Thiele FUG Method

Number of Theoretical Stages

Number of Theoretical Plates

Number of Theoretical Stages

Number of Theoretical Plates

(1) 3 2 2.223 (3) 2

(2) 3 2 2.240 (3) 2

ae

ap

= 0.50 + 0.0058 (Fr ≤ 0.85) (20)

Table 10 – Analysis Summary of Continuous Operation

Trial No.

McCabe-Thiele FUG Method Transfer Units HETP

Number of Theoretical

Stages

Number of Theoretical

Plates

Number of Theoretical

Stages

Number of Theoretical

Plates NTU

HTU (m)

HETP (m)

(Z/N)

HETP (m) Estimated

(4) 4 3 5.325 (6) 5 7.374 0.308 0.360 0.346

(6) 5 4 5.762 (6) 5 6.169 0.308 0.360 0.329

(7) 5 4 5.516 (6) 5 6.351 0.302 0.360 0.338

(13) 4 3 5.332 (6) 5 6.310 0.229 0.360 0.254

(16) 4 3 5.395 (6) 5 6.360 0.217 0.360 0.241

Figure 8: McCabe-Thiele Diagram, Batch Trial (1)

0.73810

0.431

0.99956

0.0

0.2

0.4

0.6

0.8

1.0

0.0 0.2 0.4 0.6 0.8 1.0

y, m

ole

fra

ctio

n w

ater

in v

apo

ur

x, mole fraction water in liquid

McCabe-Thiele Diagram Batch Operation

Figure 7: Literature MEG-Water VLE Data

0.0

0.1

0.2

0.3

0.4

0.5

0.6

0.7

0.8

0.9

1.0

0.0 0.1 0.2 0.3 0.4 0.5 0.6 0.7 0.8 0.9 1.0

y, m

ole

fra

ctio

n w

ater

in v

apo

ur

x, mole fraction water in liquid

MEG-Water VLE Curve

T = 323.15 K Gonzalez, Carlos 1983 T = 333.15 K Villamanan et al. 1984

T = 343.15 K Chiavone-Filho et al 1993 T = 363.15 K Chiavone-Filho et al 1993

P = 101.33 kPa Popov 1934 P = 3.333 kPa Zhavoronkov 1971

P = 99.6 kPa Trimble and Potts 1935 VLE Curve (Antione Coeffients)

Figure 9: McCabe-Thiele Diagram, Continuous Trial (6)

Figure 10: McCabe-Thiele Diagram, Continuous Trial (16)

0.77500

0.352

0.99997

0.0

0.2

0.4

0.6

0.8

1.0

0.0 0.2 0.4 0.6 0.8 1.0

y, m

ole

fra

ctio

n w

ater

in v

apo

ur

x, mole fraction water in liquid

McCabe-Thiele Diagram Continuous Operation

0.56024

0.463

0.99997

0.0

0.2

0.4

0.6

0.8

1.0

0.0 0.2 0.4 0.6 0.8 1.0

y, m

ole

fra

ctio

n w

ater

in v

apo

ur

x, mole fraction water in liquid

McCabe-Thiele Diagram Continuous Operation with Salts

8.0 Simulation of MEG-Water System

In order to evaluate the experimental results of each trial, simulations were conducted to model the expected

recovery of the MEG-Water distillation system. Simulation of the MEG-Water binary system was performed

using the rigorous distillation column models available in Aspen HYSYS and Aspen Plus. As indicated by Table 11,

separate simulations were performed utilising the HYSYS Peng-Robinson property package, the HYSYS Glycol

package and the ELECNRTL package available within Aspen Plus. The Peng-Robinson Equation of State (EOS) was

selected for its reliability in simulating a wide range of systems, typically comprised of non-polar light

hydrocarbons. Although water and MEG are non-hydrocarbon polar components the Peng-Robinson package

was considered suitable as the system to be simulated operates at atmospheric pressure, moderate

temperatures and far below the critical properties of each component. Thus, the estimates of vapour properties

and component volatility by the package can be considered reliable for initial simulations. The default Peng-

Robinson fluid package available within HYSYS was utilised for simulation with no binary parameters associated

with the package altered during simulation.

To further improve the capabilities of the developed model, the ELECNRTL Aspen Plus property package was

also investigated for its capabilities in simulating electrolytes, such as those commonly experienced industrially

during rich MEG regeneration. Initial simulations were performed to evaluate the accuracy of the base property

package when simulating only Meg-Water distillation when no dissolved salts were present in order to compare

it to the Peng Robinson package. In addition, upon the recommendation of the HYSYS property package selection

assistant for systems containing glycols, additional simulations were performed using the available Glycol

package.

The experimental operating conditions of the lab-scale MEG recovery column were used as the basis of each

simulation. The reboiler operating temperature and reflux ratio of each trial were used as the rigorous columns

operating specifications. The feed pressure and temperature for each trial was set at 140 kPa and 30°C

respectively with the condenser and reboiler operating pressure maintained at 120 and 130 kPa respectively as

per Table 3. The main assumptions made in order to develop and simulate the distillation model include:

Stream flow rates were considered constant and the average flow rate during plant operation was used Reboiler temperature remained constant at the specified operating temperature through monitoring

and adjustment by the PLC unit. Salt free trials consisted of only MEG and water Dissolved salt trials consisted of MEG, water and monovalent ions. The majority of divalent ions present

within the rich MEG feed are removed prior to distillation during pre-treatment and the impact of remaining divalent ions as given by Table 8 are negliable when compared to the monovalent ions Na+ and K+.

The formation and precipitation of divalent salts during distillation was not simulated due to the low concentration of divalent ions within the rich MEG feed. The formation of monovalent salts was also not considered as they are unlikely to precipitate out within the reboiler unit of a MEG regeneration column.

The results of each simulation can be found within Table 11 for both salt free and dissolve salt trials for each of

the selected fluid packages and their associated average accuracy when compared to the experimental data.

Additionally, Figure 11 illustrates the relationship between reboiler temperature and lean MEG purity as well as

a comparison between experimental and simulated results. Only the Peng-Robinson and ELECNRTL simulation

results were illustrated due to the inaccuracy of the results generated by the Glycol fluid package during

simulation. The experimental trials involving dissolved salts were also included to visually express the impact of

dissolved salts on the lean MEG purity. Lastly, the impact of MEG mass fraction in the feed upon the lean MEG

purity was investigated for constant reboiler temperature trials as Table 12. Trials were performed using a

constant reboiler temperature of 141°C for feed fractions ranging from 45 to 65% by weight MEG. Lean MEG

purities for each trial were subsequently estimated using HYSYS and Aspen Plus with the relationship between

feed fraction and lean MEG purity illustrated in Figure 12.

Through simulation it was observed that the results obtained using the Peng-Robinson property package were

the most consistent with the lean MEG purities obtained through operation of the column when no salts were

present. From Table 11, the Peng Robinson package was capable of simulating the lean MEG purity within on

average 0.72% of the experimentally achieved recovery in comparison to 1.40% by the ELECNRTL package.

However, the HYSYS Glycol property package was the least accurate of the tested fluid packages typically

estimating a lean MEG purity significantly less than that found experimentally. In contrast, the experimentally

obtained lean MEG purities for trials involving dissolved salts were significantly lower than that reported by the

respective simulations. The Peng-Robinson and ELECNRTL fluid packages were only capable of simulating salt

trials within 7.79% and 9.59% on average respectively, suggesting the dissolved salt content of the rich MEG has

a major impact on achievable lean MEG purity during distillation.

The uncertainty associated with the reported experimental data is expressed within Figures 11, 12 and 13 as

uncertainty bars. The uncertainty bars represent the combined uncertainty associated with the measurements

made in terms of reboiler operating temperature and the mass fraction of MEG as reported by MEG the

refractometer. The errors associated with the reboiler thermometer and MEG refractometer range from ± 1°C

and ± 0.4% v/v respectively as per Section 4.0.

Table 11 – MEG-Water Simulation Results

Trial No.

Experimental Lean MEG Purity

Simulated Lean MEG Purity

Aspen HYSYS Aspen Plus

Peng-Robinson Glycol Package ELECNRTL

Salt Free Trials

(3) 0.776 0.7837 0.7131 0.7966

(4) 0.834 0.8249 0.7647 0.8387

(5) 0.848 0.8384 0.7821 0.8523

(6) 0.864 0.8565 0.8056 0.8702

(7) 0.860 0.8619 0.8128 0.8755

(8) 0.868 0.8671 0.8197 0.8806

(9) 0.876 0.8815 0.8388 0.8945

Average Percentage Experimental Deviation 0.72% 6.61% 1.40%

Dissolved Salt Trials

(10) 0.740 0.7836 - 0.7966

(11) 0.720 0.7836 - 0.7966

(12) 0.750 0.8246 - 0.8387

(13) 0.780 0.8247 - 0.8387

(14) 0.750 0.8246 - 0.8387

(15) 0.770 0.8247 - 0.8387

(16) 0.800 0.8565 - 0.8702

Average Percentage Experimental Deviation 7.79% - 9.59%

Table 12 – MEG Purity vs. MEG Feed Mass Fraction

Reboiler Temperature (°C)

MEG Feed Fraction Lean MEG Purity Peng Robinson

Estimated Purity ELECNRTL Estimated

Purity

142 45 0.854 86.71 88.06

141 50 0.864 86.2 87.54

141 55 0.854 86.19 87.55

141 60 0.86 86.2 87.57

141 65 0.86 86.19 87.58

Figure 11: Reboiler Temperature vs. Lean MEG Purity (Experimental and Simulated)

Figure 12: Feed MEG Mass Fraction vs. Lean MEG Purity (Experimental and Simulated)

70

75

80

85

90

95

128 130 132 134 136 138 140 142 144 146 148

Lean

MEG

Pu

rity

(%

)

Reboiler Temperature (°C)

Reboiler Temperature Vs. Lean MEG Purity

Experimental No Salts Experimental With Salts

PR HYSYS Simulation ELECNRTL Aspen Plus Simulation

Salt Free Experimental Trendline Dissolved Salt Experimental Trendline

85

85.5

86

86.5

87

87.5

88

88.5

40 45 50 55 60 65 70 75

Lean

MEG

Pu

rity

(%

)

MEG Feed Mass Fraction (%)

MEG Feed Mass Fraction Vs. Lean MEG Purity

Experimental No Salts PR HYSYS Simulation ELECNRTL Aspen Plus Simulation

In order to improve the accuracy of the ELECNRTL fluid package for simulating salt free trials the binary

parameters associated with the package were adjusted using the data regression function within Aspen Plus.

Several sets of isobaric VLE data sets available within the Aspen Plus database were used to regress the MEG

and water NRTL binary parameters 𝑎𝑖𝑗 , 𝑏𝑖𝑗 and 𝑐𝑖𝑗 to find the best fit with respect to the experimental data. The

ELECNRTL property package is consistent with the NRTL-Redlich-Kwong property method utilising the NRTL

model given by Equation (21) with the temperature dependant parameter, 𝜏𝑖𝑗 , given by Equation (23). Additional

trials not listed in Table 6, were used to allow a more accurate fitting of the binary parameters for the ELECNRTL

property package. It was found that the VLE data reported by Kamihama et al. (2012) provide the best fit for the

experimental achieved lean MEG purities within this study.

The new NRTL binary parameters were regressed using the VLE data by Kamihama et al. (2012) as a basis and

then further modified to generate the binary components found in Table 13 where components 𝑖 and 𝑗 are MEG

and water respectively. Simulations involving the ELECNRTL package for salt free trials were then re-performed

using the newly modified ELECNRTL package with results shown in Table 14 and graphically illustrated by Figure

13. It was observed that the modified binary parameters allowed a much more accurate estimation on average

of the lean MEG purity consistent with experimentally achieved results. Attempts were also made to regress

more accurate binary parameters for the Peng Robinson property package within Aspen Plus but it was

determined that the default Peng Robinson fluid package within Aspen HYSYS was the most accurate. The VLE

curve for the MEG-Water system derived from the modified NRTL binary parameters and the default Peng

Robinson EOS available within HYSYS is given by Figure 14. The VLE data was generated using the binary analysis

capabilities of Aspen Plus and the ‘Equilibrium Unit Operation’ model within HYSYS at a constant pressure of 130

kPa as per the operating pressure of the reboiler.

Table 13 – ELECNRTL Temperature Dependant Binary Parameters

A𝑖𝑗 A𝑗𝑖 B𝑖𝑗 B𝑗𝑖 C𝑖𝑗

-1.77 1.9479 912.662 -1024.5 0.3

ln 𝛾𝑖 =∑ 𝑥𝑗𝜏𝑖𝑗𝐺𝑗𝑖𝑗

∑ 𝑥𝑘𝐺𝑘𝑖𝑘

+ ∑𝑥𝑗𝐺𝑖𝑗

∑ 𝑥𝑘𝐺𝑘𝑗𝑘𝑗

(𝜏𝑖𝑗 −∑ 𝑥𝑘𝜏𝑘𝑗𝐺𝑘𝑗𝑘

∑ 𝑥𝑘𝐺𝑘𝑗𝑘

)

Where:

(21)

𝐺𝑖𝑗 = exp (−𝛼𝑖𝑗𝜏𝑖𝑗) (22)

𝜏𝑖𝑗 = 𝑎𝑖𝑗 +𝑏𝑖𝑗

𝑇+ 𝑐𝑖𝑗 ln 𝑇 (23)

Table 14 – Salt Free ELECNRTL MEG-Water Simulation Results with Adjusted Binary Parameters

Trial No. Reboiler Temp Experimental Original ELECNRTL Modified ELECNRTL

(3) 130 0.776 0.797 0.782

(4) 135 0.834 0.839 0.825

(5) 137 0.848 0.852 0.839

137 0.840 0.852 0.839

137 0.844 0.852 0.839

(6) 140 0.864 0.870 0.858

141 0.854 0.876 0.864

(7) 141 0.860 0.876 0.864

(8) 142 0.868 0.881 0.869

144 0.880 0.890 0.879

(9) 145 0.876 0.895 0.884

Average Percent Deviation from Experimental 1.45% 0.63%

76

78

80

82

84

86

88

90

92

128 130 132 134 136 138 140 142 144 146 148

Lean

MEG

Pu

rity

(%

)

Reboiler Temperature (°C)

ELEC NRTL Binary Parameter Adjustment

Experimental No Salts Original ELECNRTL Modified ELECNRTL

Experimental Trendline Original ELECNRTL Trendline Updated ELECNRTL Trendline

Figure 13: Modified ELECNRTL Binary Parameter Simulation Results

0

0.1

0.2

0.3

0.4

0.5

0.6

0.7

0.8

0.9

1

0 0.1 0.2 0.3 0.4 0.5 0.6 0.7 0.8 0.9 1

y, m

ole

fra

ctio

n w

ater

in v

apo

ur

x, mole fraction water in liquid

Simulated MEG-Water VLE Data

Antione Coefficients Kamihama et al. (2012) Modified ELECNRTL HYSYS Peng Robinson

Figure 14: Simulated MEG-Water VLE Data

8.1 Simulation of Dissolved Salt Impact upon Operation

Modelling the impact of dissolved salts upon the operation of the distillation column was performed using the

salt simulation capabilities of the Aspen Plus ELECNRTL model. The presence of salts within the rich MEG feed

to the distillation column was modelled using the dissociation of NaOH and KOH to their respective mono-valent

cations to produce the salt concentrations listed in Table 8 within the feed stream. This was achieved by

calculating the amount of NaOH and KOH required using the known concentration of the respective cations,

stream flow rates and dissociation reaction stoichiometric ratios. Only the impact of monovalent salt ions, Na+

and K+ were included in the analysis as the majority of divalent cations would be removed in the pre-treatment

stage prior to the distillation column in industrial regeneration systems. Thus, due to their low concentration

their impact can be considered minimal compared to the much greater presence of monovalent cations within

the rich MEG. Furthermore, the formation and precipitation of salts was not modelled as the high solubility of

monovalent cations ensures they remain dissolved during distillation to be later removed downstream within

the reclaimer unit (Latta et al. 2016).

The results of dissolved salt simulation are summarised within Table 15 of which compares simulation results

produced by both the original and modified ELECNRTL fluid packages when dissolved salts are included and

compared graphical in Figure 15. it can be seen that the ELECNRTL package modified with the reported binary

parameters allowed a more accurate estimation of the lean MEG purity in comparison to the original ELECNRTL

fluid package when salts where excluded and included. Overall, the Modified ELECNRTL fluid package when salts

where incorporated was able to simulate the experimentally determined lean MEG purity within 1.61% on

average compared to 9.59% of the simulations reported in Table 11. From this it can be determined that the

presence of monovalent cations and to an extent divalent cations within the rich MEG feed to MEG regeneration

column can have a significant impact on the achievable lean MEG purity and can be modelled with relative

accuracy.

Table 15 – MEG-Water Simulation Results

Trial No.

Experimental Lean MEG Purity

Original ELECNRTL (No Salts)

Original ELECNRTL (With Salts)

Modified ELECNRTL (With Salts)

(10) 0.74 0.7966 0.725 0.715

(11) 0.72 0.7966 0.724 0.714

(12) 0.75 0.8387 0.777 0.765

(13) 0.78 0.8387 0.774 0.763

(14) 0.75 0.8387 0.774 0.763

(15) 0.77 0.8387 0.782 0.771

(16) 0.80 0.8702 0.819 0.808

Average Percentage Experimental Deviation

9.59% 2.02% 1.61%

60.0

65.0

70.0

75.0

80.0

85.0

90.0

10 11 12 13 14 15 16

Lean

MEG

Pu

rity

(%

)

Trial Number

ELECNRTL vs. Experimental Salt Trials

Experimental Salt Trials Original ELECNRTL Modified ELECNTRL

Figure 15: ELECNRTL Simulated Dissolved Salt Lean MEG Purities

9.0 Discussion

The design and construction of the MEG distillation column utilised in this study was performed to investigate

the recovery of MEG within a pilot scale packed distillation column. Through the experimental trials conducted,

the validity of the design for the separation of water from MEG was confirmed. Operation of the distillation

column was successfully performed under varying feed and reboiler conditions with lean MEG purities above

80% by mass achieved. Furthermore, operation of the column was successfully tested upon the introduction of

dissolved salts into the rich MEG feed.

One of the primary aspects of this study was to evaluate the design of the MEG distillation column and assess

its performance under varying operation conditions. The column was operated using both batch and continuous

operation utilising a wide range of both MEG feed mass fractions and reboiler operating temperatures and the

impact on lean MEG purity investigated. It was found when operating under batch conditions the number of

theoretical stages required to achieve separation was three, of which corresponds to the minimum number of

stages required under total reflux. However, when operating at a finite reflux typically between 0.4-0.6 by weight

under continuous operation, the actual number of theoretical stages was estimated to be six. It can be observed

through Table 6 that under both batch and continuous operation when no salts are present within the rich MEG

feed, a lean MEG purity above 80% can be achieved when operating the reboiler above 135°C. Although as

expected, under batch operation the achieved MEG concentration within the distillate water product was

significantly higher than under continuous operation.

Estimation of the number of transfer units for each continuous trial as per Table 10, provides a measure of the

performance of the column under varying operating conditions. For each trial the number of transfer units

indicates the difficulty of the separation and was estimated via numerical integration of Equation (4) based upon

vapour phase compositions calculated along the stripping and rectifying operating lines and at equilibrium by

the VLE curve. The concept of transfer units is considered to be the most accurate way of estimating a columns

performance and required height of packing in comparison to other methods including HETP. However, a major

problem faced in analysing the experimental results reported using transfer units was the steep nature of the

NTU curve as a result of the low mass fraction of MEG in the distillate product (100ppm). The NTU curve for

Continuous Trial (6) is displayed in Figure 16 exhibiting the steep NTU curve as the vapour composition reaches

one. Due to the steep curve produced, estimation of the number of transfer units by calculation of the area

under the curve by both graphical and numerical integration was highly dependent on the step size chosen. As

such it was difficult to estimate the number of transfer units accurately and was thus considered a poor

representation of the columns performance in comparison to the number of theoretical stages estimated by the

FUG shortcut method.

Figure 16: Continuous Trial (6) NTU Graphical Integration

0.0

5.0

10.0

15.0

20.0

25.0

30.0

35.0

40.0

45.0

50.0

0.0 0.1 0.2 0.3 0.4 0.5 0.6 0.7 0.8 0.9 1.0

1/(

y*-Y

)

y

NTU Graphical Integration

Additional calculations were then performed in order to estimate the overall height of the gas phase transfer

unit to assess the effectiveness of the packing in separating MEG from water. It was found for continuous trials

with no dissolved salts that the average HTU was approximately 0.306 metres, however, when dissolved salts

were introduced the HTU decreased to between 0.229-0.217 metres suggesting an increase in packing

performance. This directly contradicts what was believed to occur upon the introduction of salts into the rich

MEG feed, where the presence of salts was thought to decrease the packings performance. However, through

calculation it was observed that the effect of dissolved salts, primarily through increased density and viscosity

of the liquid within the reboiler had only a minor impact upon the estimated HTU. Instead, the HTU was primarily

influenced by the fraction of MEG within the feed and the relative difference between MEG feed fraction and

the final fraction of MEG within the lean MEG product. A lower mass fraction of water within the feed directly

resulted in a decreased amount of water boiled within the reboiler and returned to the column as boil up. This

was compounded when conducting salt trials due to the lower lean MEG product purity achieved as per Table

6. This further reduced the boil up returned to the column as more water was retained within the bottoms

product. The combination of these factors ultimately reduced the vapour and liquid throughput of the column

and by extension the vapour and liquid superficial velocities utilised in Equations (6) and (7) reducing the

estimated HTU. Overall, it can be assumed that the column was not operating at maximum capacity and a lower

rate of mass transfer between the liquid and vapour phase occurred.

The HTU for each trial was then used as a basis to estimate the HETP by application of Equation (9). It was

observed for salt free trials the packing achieved a HETP of approximately 0.33-0.35 metres, slightly lower than

that estimated using the known height of packing and estimated number of theoretical plates for each trial by

Equation (8). From the estimated HETPs the expected height of packing can be calculated, and was estimated at

approximately 1.7 metres. This is slightly lower than the height of packing utilised within the column but with

additional safety margins and rounding up to the next standard height of a packing section a height of 1.8 metres

(900mm×2) is realistic. Again, it was observed that for trials involving dissolved salts within the rich MEG feed

the HETP decreased significantly suggesting an increase in column performance when salts are present. However

similar to the HTUs estimated, the reduced HETP can be attributed to the reduced liquid and vapour flow rates

within the column. Furthermore, estimation of the HTU and HETP for batch trials was not conducted as the

column will primarily be operated under continuous conditions.

To further evaluate the operation of the pilot MEG distillation column, simulations were performed using Aspen

HYSYS and Plus to investigate how closely simulations conformed to the experimentally determined lean MEG

purities. Initial simulations performed using the Peng Robinson fluid package available within Aspen HYSYS was

found to provide an accurate estimation of lean MEG purity in comparison to the respective salt free operational

trials. As can be seen visually through Figure 11, the lean MEG purities estimated through HYSYS simulation

closely matched those obtained through experimental means with the estimated trend lines of both the salt free

experiments and simulated data points in close agreement. Furthermore, as can be expected, a clear relationship

between the operating temperature of the reboiler and the purity of the lean MEG is evident. However, no clear

relationship between the fraction of MEG in the feed and experimental lean MEG purities was observed in Figure

12 with Aspen HYSYS and Plus both suggesting the lean MEG purity is independent of the feed fraction. This can

be attributed to the nature of MEG distillation where there is a large difference in volatility between MEG and

water resulting in an almost 100% pure water distillate. As such, although the salt trials outlined in Table 11

were conducted with higher MEG feed fractions, the difference in the lean MEG purities observed in comparison

to the salt free trials can be attributed to the presence of dissolved salts.

Likewise, the default ELECNRTL fluid package within Aspen Plus was found to be able to predict the

experimentally lean MEG with reasonable but lower accuracy than the HYSYS Peng Robinson EOS. However,

with adjustment of the property package’s binary parameters, the accuracy of the ELECNRTL package for

simulating the MEG-Water system was able to be significantly improved surpassing that of the HYSYS Peng

Robinson EOS. Furthermore, the ELECNRTL package includes the capability of simulating the impact of

electrolytes such as dissolved salts that are common in industrial MEG processing after the production of

formation water during hydrocarbon production. The NRTL binary parameters found to be suitable for

simulating salt free MEG-Water distillation are reported in Table 13.

VLE data for the simulated MEG-Water system was also generated using the capabilities of Aspen HYSYS and

Plus using the HYSYS Peng Robinson and modified ELECNRTL fluid packages respectively. Figure 14 graphically

compares the MEG-Water VLE data of that calculated through Antione coefficients as per Figure 7, simulation

by Aspen HYSYS and Plus and the literature VLE data reported by Kamihama et al. (2012) that was used as the

basis for NRTL binary parameter regression. It is clear that the VLE data estimated by simulation within this study

deviates significantly from that reported in literature and graphed within Figure 7. This can be attributed to the

different test conditions at which the literature MEG-Water binary VLE data was reported at. These test

conditions are not representative of the typical operating conditions at which an industrial MEG distillation

column typically operates, namely atmospheric pressure and 120-160°C Psarrou et al (2011). The VLE data

generated within this study was matched to experimental data of a real MEG pilot plant, operating at typical

industry conditions and thus can be considered more accurate for future design of such systems compared to

previous literature data.

The primary outcome observed during analysis of the experimental results by simulation was the impact of

dissolved salts within the rich MEG feed upon the purity of the final lean MEG product. The purity of lean MEG

in trials including dissolved salts deviated significantly from both corresponding salt free trials with similar

reboiler operating temperatures and expected results derived from initial simulations when salts were

unaccounted for. This phenomenon is observed through the experimentally obtained lean MEG purities

reported in Table 7 and Figure 11 where the purity of salt trials is observed to be notably less than the produced

trend lines for both experimental and simulated results. Furthermore, the HETP estimated for trials involving

dissolved salts were also noticeably less indicating a poorer separation performance of the column. However,

the impact of dissolved salts upon the achieved lean MEG purity during operation was able to be predicted

within an average deviation of 1.61% from the experimental results as indicated by Table 15. The introduction

of Na+ and K+ ions into the simulated rich MEG feed based on experimental concentrations showed noticeable

impact upon the lean MEG purity reported during simulation. On average, the inclusion of monovalent cations

within the simulation reduced the achieved lean MEG purity by 7.65% for trials with total monovalent

concentrations between 10000-12000 ppm.

The impact of the dissolved salts analysed within this work upon the operation of both the pilot MEG column

and simulation models can be attributed to the boiling-point elevation of the MEG-Water solution due to the

presence of the mono-valent cations, Na+ and K+. The presence of such non-volatile solute within the solution

directly reduces the overall vapour pressure of the MEG-Water solution thus requiring a greater reboiler

operating temperature for boiling to occur. The effects of various salts on the boiling point of aqueous solutions

has been documented by various authors including Bialik, Sedin, and Theliander (2008) and Meranda and Furter

(1977). Furthermore, the presence of dissolved salts within the MEG-Water solution can have pronounced

effects upon the VLE curve of the system. The impact of dissolve salts upon the VLE curve of various binary

systems and methods to predict such impacts have been outlined by Aznar and Telles (2001), Chou and Tanioka

(1999) and Kumar (1993).

The impact of salts on the MEG distillation process was primarily thought to occur through oversaturation of

soluble salts, primarily divalent salts including CaCO3 and FeCO3 leading to salt deposition within processing

equipment (Latta, Seiersten, and Bufton 2013, Bikkina et al. 2012). The process of salt precipitation in industrial

regeneration of MEG is a major contributor to poor separation performance due to fouling and the accumulation

of suspended solids within the reboiler unit causing reduced heat transfer efficiency. However, the presence of

dissolved mono-valent salt cations within the rich MEG was also found to have significant impact on the

achievable lean MEG purity during both experimental operation of the pilot MEG plant and simulated models.

To accommodate the impact of dissolved salts a higher reboiler temperature would be required to maintain a

constant boil up rate and lean MEG purity compared to salt free operation. However, operating the reboiler at

too high of a temperature can lead to thermal degradation of the MEG as per the research performed by

AlHarooni et al. (2015). Alternatively, a greater lean MEG purity can be achieved by the reduction of reboiler

operating pressure but is generally avoided due to increased operating costs associated with vacuum operation.

In addition, due to the inverse soluble nature of some salts including CaCO3 one of the primary salt precipitants

experienced in MEG processing, higher operating temperatures may directly lead to increased salt precipitation

and reboiler fouling, further reducing separation efficiency.

10.0 Conclusions

The distillation column utilised within this study was designed for the separation of water from MEG when

dissolved salts common in MEG systems are present. The primary aim of the initial experimental trials conducted

was to verify the design of the column and to assess its performance in recovering MEG for water. It was

estimated through the experimental data obtained through operation of the column that it consists of six

equilibrium stages under continuous operation. Under total reflux the minimum number of equilibrium

corresponds to two. Further analysis of the column through the concept of HETP evaluated the columns packing

as having a HETP of approximately 0.34 metres. Through the estimated HETP in conjunction with the estimated

number of theoretical stages for each trial, an estimated height of packing required to achieve separation was

found to be approximately 1.7 metres. This corresponds closely with the 1.8 metres of packing utilised within

the column thus verifying its design. Secondary estimation of the required packing height was also be made

through the estimated HTU and NTUs for each trial, through this method the packing was estimated to be

roughly 1.9-2.1 metres. However due to the inaccuracies in estimating the NTU discussed, this estimation is less

reliable than that made using the HETP.

The secondary objective of this study was to investigate the impact of dissolved salts upon the recovery of MEG

and upon the operational performance of the column. Estimation of the HTU and HETP of the packing for both

salt and salt free trials were inconclusive in assessing the columns performance. It was observed that the

presence of salts had a significant impact on the perceived performance of the column through the estimated

HTUs and HETPs. However, the mass fraction of MEG in the feed and relative difference between feed and lean

MEG mass fraction was found to be the underlying factor. Overall the presence of dissolved salts in the rich MEG

feed primarily influenced the lean MEG purity that could be achieved during operation. It was observed that for

salt trials, the experimentally achieved lean MEG purity was approximately 7.2% less than corresponding salt

free trials at equal reboiler operating temperatures.

The conclusions drawn from experimental data were then further investigated through the development of

distillation models using Aspen HYSYS and Plus. Of the models developed, the Peng Robinson EOS in HYSYS and

the ELECNRTL package with modified binary parameters were found to generate product MEG purities in close

agreement with experimental trials when no dissolved salts were present. However, upon the introduction of

salts into the feed, the experimental lean MEG purities deviated significantly from the trend lines developed

from simulated results for both fluid packages. It was concluded that the impact of dissolved salts upon the MEG

distillation process occurred due to an increase in solution boiling point and the resulting impact on the MEG-

Water systems VLE. The impact of dissolved salts within the rich MEG feed was able to be predicted with an

average deviation of 1.61% from experimental trials using the Aspen Plus ELECNRTL electrolyte simulation

capabilities by the inclusion of monovalent cations. Overall, it was established that the impact of dissolved salts

is not only limited to the effects of salt precipitation and accumulation within the reboiler unit of a distillation

column but also through its impact on the VLE of the system. Therefore, the unexpected presence of dissolved

salts within the rich MEG feed stream may require greater reboiler temperature to maintain a constant boil up

rate potentially leading to unwanted thermal degradation of the MEG.

11.0 Nomenclature

𝑎, 𝑏, 𝑐 NRTL Binary parameters

ae Effective interfacial area of packing, 1/m

ap Packing specific surface area, 1/m

deq Equivalent diameter of flow channel, m

DL Liquid diffusivity, 𝑚2/𝑠

DG Gas diffusivity, 𝑚2/𝑠

g Gravitational constant, 𝑚/𝑠2

G Binary constant of the NRTL equation

Gm Gas flowrate within the column, kgmole/hr

HETP Height Equivalent to a Theoretical Plate, m

HG Height of gas phase transfer unit, m

HL Height of liquid phase transfer unit, m

HOG Overall height of transfer unit in gas phase, m

HTU Height of mass-transfer unit, m

kG Gas-side mass-transfer coefficient, m/s

kL Liquid-side mass-transfer coefficient, m/s

Lm Liquid flow rate within column, kgmole/hr

m Average slope of the VLE curve

M Molecular weight, g/gmole

N Number of theoretical stages

Nmin Minimum number of theoretical stages

NTU Number of transfer units

P Operating pressure, kPa

Rmin Minimum reflux ratio

s Corrugation side length, m

T Temperature °K

u Superficial fluid velocity, 𝑚/𝑠

V Molar volume at normal boiling point

x Mole fraction of component in liquid phase

𝑥𝑖𝑗 Local molar fraction of compound 𝑖 around the central molecule 𝑗

xA, xB Mole fraction of the more volatile and less volatile component respectively

y Mole fraction of component in vapour phase

y∗ Equilibrium vapour phase composition

Z Height of packing

Greek Letters

α Relative volatility Corrugation inclination angle, °deg

𝛼𝑖𝑗 Non randomness parameter of the NRTL equation

Γ Liquid flow rate based on perimeter, 𝑘𝑔/𝑚. 𝑠

ϵ Packing void fraction

ε/kB(°K) Lennard-Jones potential parameters

λ Ratio of gas to liquid molar flow rates Stripping factor

μ Viscosity of vapour or liquid kg/m.s

ν Kinematic viscosity of vapour of liquid 𝑚2/𝑠

ρ Density of vapour or liquid, 𝑘𝑔/𝑚3

σ Surface tension of fluid, 𝑁/𝑚

collision diameter of particle (Å)

𝜏 NRTL temperature dependant parameter

ψ Molokanov variable in Equation (3)

Ω Collision integral

Subscripts

1 or 2 Component 1 or 2

𝑖𝑗 Component 𝑖 or 𝑗

B Bottoms stream

D Distillate stream

e Effective

F Feed stream

g Gas phase

L Liquid phase

12.0 References

AlHarooni, Khalifa, Ahmed Barifcani, David Pack, Rolf Gubner, and Varun Ghodkay. 2015. "Inhibition effects of thermally degraded MEG on hydrate formation for gas systems." Journal of Petroleum Science and Engineering 135:608-617. doi: http://dx.doi.org/10.1016/j.petrol.2015.10.001.

ATAGO. Digital Hand-held "Pocket" Ethylene Glycol refractometer PAL-91S. http://www.atago.net/product/?l=en&k=ADT59550.

Aznar, M., and A.S. Telles. 2001. "Prediction of electrolyte vapor-liquid equilibrium by UNIFAC-Dortmund." Brazilian Journal of Chemical Engineering 18:127-137.

Babu, D. R., M. Hosseinzadeh, A. Ehsaninejad, R. Babaei, M. R. Kashkooli, and H. Akbary. 2015. "Carbonates precipitation in MEG loops – A comparative study of South Pars and Bass Strait gas fields." Journal of Natural Gas Science and Engineering 27, Part 2:955-966. doi: http://dx.doi.org/10.1016/j.jngse.2015.09.035.

Ben-Amotz, Dor, and Dudley R. Herschbach. 1990. "Estimation of effective diameters for molecular fluids." The Journal of Physical Chemistry 94 (3):1038-1047. doi: 10.1021/j100366a003.

Bialik, Marta, Peter Sedin, and Hans Theliander. 2008. "Boiling Point Rise Calculations in Sodium Salt Solutions." Industrial & Engineering Chemistry Research 47 (4):1283-1287. doi: 10.1021/ie070564c.

Bikkina, Chaitanya, Narayanan Radhakrishnan, Sumit Jaiswal, Ryan Harrington, and Mark Charlesworth. 2012. "Development of MEG Regeneration Unit Compatible Corrosion Inhibitor for Wet Gas Systems." 2012/1/1/.

Bravo, Jose L., and James R. Fair. 1990. "Distillation columns containing structured packing." Chemical Engineering Progress 86 (1):19-29.

Bravo, Jose L., J. A. Rocha, and J. R. Fair. 1985. "MASS TRANSFER IN GAUZE PACKINGS." Hydrocarbon Processing 64 (1):91-95.

Brustad, S., K. P. Løken, and J. G. Waalmann. 2005. "Hydrate Prevention using MEG instead of MeOH: Impact of experience from major Norwegian developments on technology selection for injection and recovery of MEG." 2005/1/1/.

Carroll, John J. 2003. Natural gas hydrates : a guide for engineers / John J. Carroll. Amsterdam, Boston: Gulf Professional Pub. Chapman, Sydney. 1970. The mathematical theory of non-uniform gases / Sydney Chapman and T.G. Cowling. Edited by David

Burnett and T. G. Cowling. 3rd ed / prepared in co-operation with D. Burnett.. ed. Cambridge: Cambridge : Cambridge University Press.

Chou, T. J., and A. Tanioka. 1999. "Predicting the Effect of Dissolved Salt on the Vapour-Liquid Equilibria for Alcohol-Water-Salt Systems." Chemical Engineering Research and Design 77 (4):329-334. doi: http://dx.doi.org/10.1205/026387699526269.

Coker, A. Kayode. 2010. "Chapter 14 - Packed Towers." In Ludwig's Applied Process Design for Chemical and Petrochemical Plants (Fourth Edition), 483-678. Boston: Gulf Professional Publishing.

Cussler, E. L. 1997. Diffusion : mass transfer in fluid systems / E.L. Cussler. 2nd ed.. ed. Cambridge, New York: Cambridge University Press.

Diba, K.D., M. Guglielminetti, and S. Schiavo. 2003. "Glycol reclaimer." The Offshore Mediterranean Conference and Exhibition, Ravenna.

Dong, Liu, Chen ZhenYu, and Guo XingPeng. 2008. "The effect of acetic acid and acetate on CO2 corrosion of carbon steel." Anti-Corrosion Methods and Materials 55 (3):130-134. doi: 10.1108/00035590810870437.

Dutta, Binay K. 2007. Principles of mass transfer and separation processes / Binay K. Dutta. New Delhi: New Delhi : Prentice-Hall of India.

Figueiredo, Cms, A. G. Barreto, Em Flaten, R. Beck, and M. Seiersten. 2015. "Crystal growth of FeCO3 in mixed monoethylene glycol and water solvent." Cryst. Res. Technol. 50 (5):354-361. doi: 10.1002/crat.201400420.

Flaten, Ellen Marie, Xiaoguang Ma, Marion Seiersten, Charlotte Aanonsen, Ralf Beck, and Jens-Petter Andreassen. 2015. "Impact of Monoethylene Glycol and Fe2+ on Crystal Growth of CaCO3." 2015/5/12/.

Flaten, Ellen Marie, Marion Seiersten, and Jens-Petter Andreassen. 2010. "Growth of the calcium carbonate polymorph vaterite in mixtures of water and ethylene glycol at conditions of gas processing." Journal of Crystal Growth 312 (7):953-960. doi: 10.1016/j.jcrysgro.2010.01.015.

Gonzalez, J.J., M.E. Alfonso, and G. Pellegrino. 2000. "Corrosion of carbon steels in mono ethylene glycol." Corrosion 2000 NACE International.

Haghighi, Hooman, Antonin Chapoy, Rod Burgess, and Bahman Tohidi. 2009. "Experimental and thermodynamic modelling of systems containing water and ethylene glycol: Application to flow assurance and gas processing." Fluid Phase Equilibria 276 (1):24-30. doi: http://dx.doi.org/10.1016/j.fluid.2008.10.006.

Haque, Md. Emdadul. 2012. "Ethylene Glycol Regeneration Plan: A Systematic Approach to Troubleshoot the Common Problems." Journal of Chemical Engineering 27 (1):21-26.

Ikeh, Lesor, G. C. Enyi, and G. G. Nasr. 2016. "Inhibition Performance of Mild Steel Corrosion in the Presence of Co2, HAc and MEG." 2016/5/9/.

Kaasa, Baard, Kristian Sandengen, and Terje Ostvold. 2005. "Thermodynamic Predictions of Scale Potential, pH and Gas Solubility in Glycol Containing Systems." 2005/1/1/.

Kamihama, Naoki, Hiroyuki Matsuda, Kiyofumi Kurihara, Katsumi Tochigi, and Shigeo Oba. 2012. "Isobaric Vapor–Liquid Equilibria for Ethanol + Water + Ethylene Glycol and Its Constituent Three Binary Systems." Journal of Chemical & Engineering Data 57 (2):339-344. doi: 10.1021/je2008704.

Kister, Henry Z. 1992. Distillation design / Henry Z. Kister. New York: New York : McGraw-Hill. Kumar, Anil. 1993. "A Simple Model for Predicting the Effect of Electrolytes on the Vapor-Liquid Equilibrium Data of Solvent

Mixtures." Separation Science and Technology 28 (5):1203-1210. doi: 10.1080/01496399308018030. Latta, T. M., A. A. Palejwala, S. K. Tipson, and N. P. Haigh. 2016. "Design Considerations for Mitigating the Impact of

Contaminants in Rich MEG on Monoethylene Glycol Recovery Unit MRU Performance." 2016/3/22/. Latta, Thomas Michael, Marion Elisabeth Seiersten, and Scott A. Bufton. 2013. "Flow Assurance Impacts on Lean/Rich MEG

Circuit Chemistry and MEG Regenerator/Reclaimer Design." 2013/5/6/. Lu, Haiping, Amy T. Kan, and Mason B. Tomson. 2010. "Effects of Monoethylene Glycol on Carbonate Equilibrium and Calcite

Solubility in Gas/Monoethylene Glycol/NaCl/Water Mixed Systems." doi: 10.2118/121562-PA. McCabe, Warren L. 1993. Unit operations of chemical engineering / Warren L. McCabe, Julian C. Smith, Peter Harriott. Edited

by Julian C. Smith and Peter Harriott. 5th ed.. ed. New York: New York : McGraw-Hill. Meranda, David, and William F. Furter. 1977. "Elevation of the boiling point of water by salts at saturation: data and

correlation." Journal of Chemical & Engineering Data 22 (3):315-317. doi: 10.1021/je60074a023. Molokanov, Yu, T. Korablina, N. Mazurina, and G. Nikiforov. 1971. "An approximate method of calculating the basic

parameters of a multicomponent fractionation." Chemistry and Technology of Fuels and Oils 7 (2):129-133. doi: 10.1007/BF00718702.

Montazaud, Thomas. 2011. "Precipitation of carbonates in the pretreatment process for regeneration of ethylene glycol."Master Thesis, Chemical Engineering and Biotechnology, Norwegian University of Science and Technology.

Psarrou, Maria N., Leif O. Jøsang, Kristian Sandengen, and Terje Østvold. 2011. "Carbon Dioxide Solubility and Monoethylene Glycol (MEG) Degradation at MEG Reclaiming/Regeneration Conditions." Journal of Chemical & Engineering Data 56 (12):4720-4724. doi: 10.1021/je200709h.

Rossiter Jr, Walter J., McClure Godette, Paul W. Brown, and Kevin G. Galuk. 1985. "An investigation of the degradation of aqueous ethylene glycol and propylene glycol solutions using ion chromatography." Solar Energy Materials 11 (5–6):455-467. doi: http://dx.doi.org/10.1016/0165-1633(85)90016-4.

Smith, J. S., and J. D. A. Miller. 1975. "Nature of Sulphides and their Corrosive Effect on Ferrous Metals: A Review." British Corrosion Journal 10 (3):136-143. doi: 10.1179/000705975798320701.

Son, Kerry van, and Charlie Wallace. 2000. "Reclamation/Regeneration of Glycols Used for Hydrate Inhibition." Deep Offshore Technology Conference, New Orleans, LA.

Trimble, H. M., and Walter Potts. 1935. "Glycol-Water Mixtures Vapor Pressure-Boiling Point-Composition Relations." Industrial & Engineering Chemistry 27 (1):66-68. doi: 10.1021/ie50301a015.

Wang, Gq, Xg Yuan, and Kt Yu. 2005. Review of mass-transfer correlations for packed columns. In Ind. Eng. Chem. Res. Wilke, C. R., and Pin Chang. 1955. "Correlation of diffusion coefficients in dilute solutions." AIChE Journal 1 (2):264-270. doi:

10.1002/aic.690010222.


Recommended