RECOVERY OF RECOMBINANT AND NATIVE PROTEINS FROM RICE AND CORN SEED A Dissertation by LISA RACHELLE WILKEN Submitted to the Office of Graduate Studies of Texas A&M University in partial fulfillment of the requirements for the degree of DOCTOR OF PHILOSOPHY August 2009 Major Subject: Biological & Agricultural Engineering
Transcript
RECOVERY OF RECOMBINANT AND NATIVE PROTEINS FROM RICE
AND CORN SEED
A Dissertation
by
LISA RACHELLE WILKEN
Submitted to the Office of Graduate Studies of Texas A&M University
in partial fulfillment of the requirements for the degree of
DOCTOR OF PHILOSOPHY
August 2009
Major Subject: Biological & Agricultural Engineering
RECOVERY OF RECOMBINANT AND NATIVE PROTEINS FROM RICE
AND CORN SEED
A Dissertation
by
LISA RACHELLE WILKEN
Submitted to the Office of Graduate Studies of Texas A&M University
in partial fulfillment of the requirements for the degree of
DOCTOR OF PHILOSOPHY
Approved by:
Chair of Committee, Zivko L. Nikolov Committee Members, M. Elena Castell-Perez Cady R. Engler Martin B. Dickman Head of Department, Gary Riskowski
August 2009
Major Subject: Biological & Agricultural Engineering
iii
ABSTRACT
Recovery of Recombinant and Native Proteins from Rice and Corn Seed. (August 2009)
Lisa Rachelle Wilken, B.S., Kansas State University
Chair of Advisory Committee: Dr. Zivko L. Nikolov
Plants are potential sources of valuable recombinant and native proteins that can
be purified for pharmaceutical, nutraceutical, and food applications. Transgenic rice and
corn germ were evaluated for the production of novel protein products. This dissertation
addresses: 1) the extraction and purification of the recombinant protein, human
lysozyme (HuLZ), from transgenic rice and 2) the processing of dry-milled corn germ
for the production of high protein germ and corn protein concentrate (CPC).
The factors affecting the extraction and purification of HuLZ from rice were
evaluated. Ionic strength and pH was used to optimize HuLZ extraction and cation
exchange purification. The selected conditions, pH 4.5 with 50 mM NaCl, were a
compromise between HuLZ extractability and binding capacity, resulting in 90% purity.
Process simulation was used to assess the HuLZ purification efficiency and showed that
the processing costs were comparable to native lysozyme purification from egg-white,
the current predominant lysozyme source.
Higher purity HuLZ (95%) could be achieved using pH 4.5 extraction followed
by pH 6 adsorption, but the binding capacity was unexpectedly reduced by 80%. The
rice impurity, phytic acid, was identified as the potential cause of the unacceptably low
iv
capacity. Enzymatic (phytase) treatment prior to adsorption improved purification,
implicating phytic acid as the primary culprit. Two processing methods were proposed
to reduce this interference: 1) pH 10 extraction followed by pH 4.5 precipitation and pH
6 adsorption and 2) pH 4.5 extraction and pH 6 adsorption in the presence of TRIS
counter-ions. Both methods improved the binding capacity from 8.6 mg/mL to >25
mg/mL and maintained HuLZ purity.
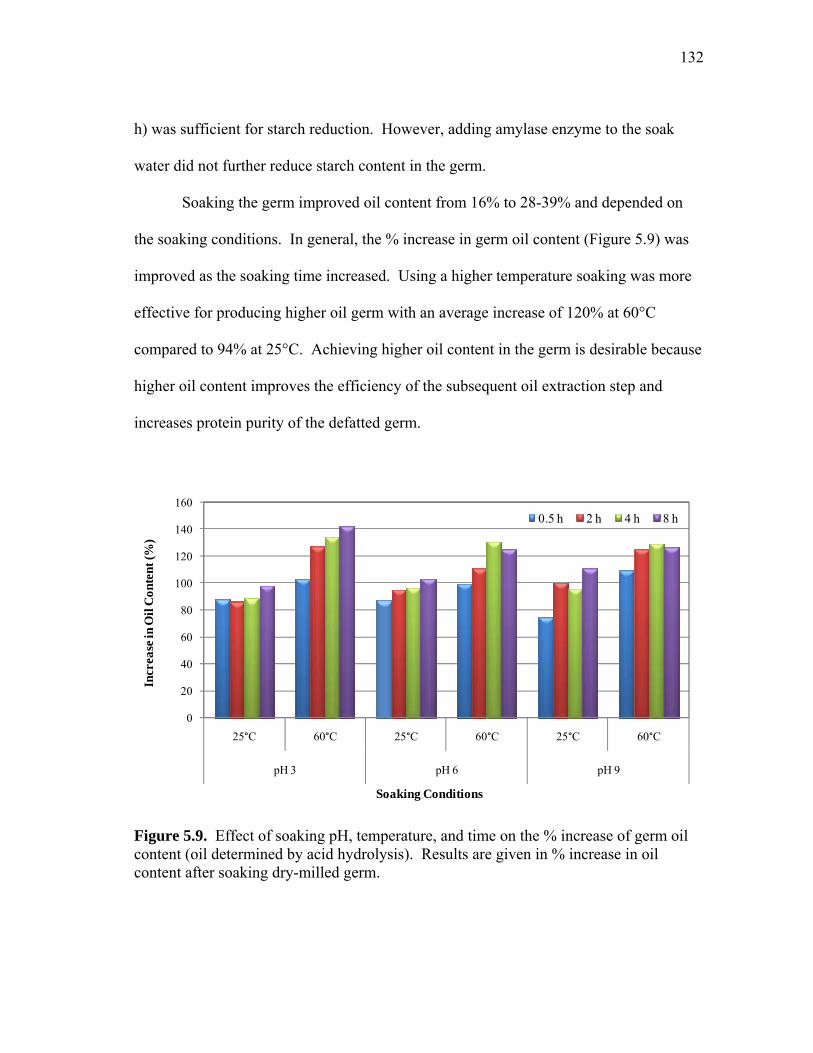
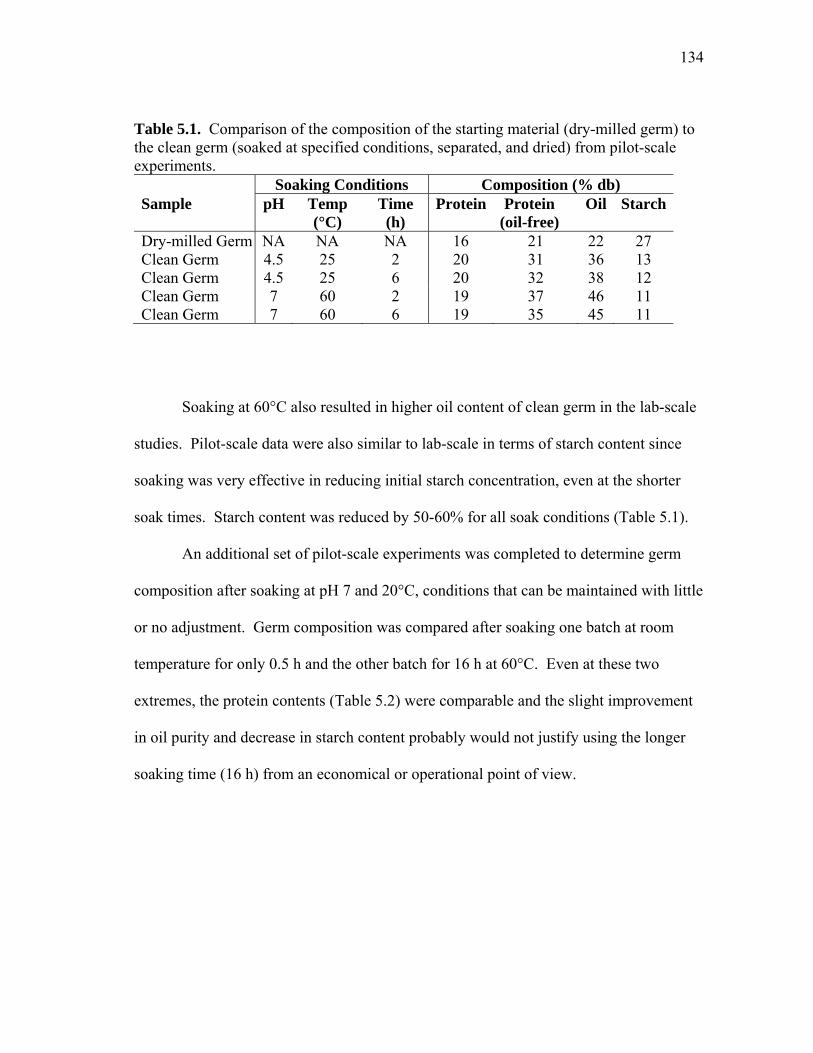
Processing of dry-milled corn germ to increase protein and oil content was
evaluated using germ wet milling. In this novel method, dry-milled germ is soaked and
wet processed to produce higher value protein products. Lab-scale and pilot-scale
experiments identified soaking conditions that reduced germ starch content, enhanced
protein and oil content, and maintained germ PDI (protein dispersibility index). Soaking
at neutral pH and 25°C maintained germ PDI and improved CPC yield from defatted
germ flour. CPC with >75% protein purity was produced using protein precipitation or
membrane filtration.
v
DEDICATION
To all the exceptional teachers and mentors I have had throughout my education and to
my family who waited a long time for the end but cheered for me from the start.
vi
ACKNOWLEDGEMENTS
I thank my committee chair, Dr. Nikolov, for inspiring me to pursue a Ph.D.,
guiding my professional development, and for providing invaluable research and
teaching opportunities. I am sincerely grateful for all the time he invested in my
education and for allowing and encouraging me to pursue new challenges. I feel very
fortunate to have such a wonderful role model and mentor. I also thank my committee
members: Dr. Elena Castell, Dr. Cady Engler, and Dr. Marty Dickman for supporting
this endeavor. I thank Susan Woodard and Steve White whose experience and guidance
in the Bioseparations Lab have been very valuable to me. Thanks also to all the other
past and present members of the Bioseparations Lab.
I am also thankful for my friends and colleagues in the Department of Biological
& Agricultural Engineering at Texas A&M University. Thanks also to the department
for providing funding as a teaching assistant; I enjoyed my teaching experiences and I
learned a lot from both the students and professors. I am especially thankful for the
continual support and advice of Dr. Phil Barnes from Kansas State University.
Finally, thanks to my parents, brothers, sisters, nieces, and nephews for their
patience and understanding.
vii
NOMENCLATURE
CM Carboxymethyl
CPC Corn protein concentrate
CV Column volumes
db Dry base
DBC Dynamic binding capacity
DCG Defatted corn germ
DFC Direct fixed cost
DDGS Distillers dried grains with solubles
EXT Extract
HCl Hydrochloric acid
HewLZ Hen egg-white lysozyme
HuLZ Human lysozyme
kDa Kilodalton
MW Molecular weight
mS milliSiemens
NaAcetate Sodium acetate
NaCl Sodium chloride
NaOH Sodium hydroxide
PA Phytic acid
PDI Protein dispersibility index
viii
pI Isoelectric point
Ppt Precipitate
PO4 Phosphate
RO Reverse osmosis
RT Room temperature (25°C)
SBC Saturation binding capacity
SDS-PAGE Sodium dodecyl sulfate polyacrylamide gel electrophoresis
SP Sulfopropyl
TCI Total capital investment
TSP Total soluble protein
UF/DF Ultrafiltration/diafiltration
ix
TABLE OF CONTENTS
Page
ABSTRACT .............................................................................................................. iii
DEDICATION .......................................................................................................... v
ACKNOWLEDGEMENTS ...................................................................................... vi
NOMENCLATURE .................................................................................................. vii
TABLE OF CONTENTS .......................................................................................... ix
LIST OF FIGURES ................................................................................................... xi
LIST OF TABLES .................................................................................................... xv
CHAPTER
I INTRODUCTION ................................................................................ 1 Background Introduction ................................................................ 1 Literature Review ........................................................................... 3 Objectives ....................................................................................... 18 Dissertation Organization ............................................................... 19
II FACTORS INFLUENCING RECOMBINANT HUMAN LYSOZYME EXTRACTION AND CATION EXCHANGE
Results and Discussion ................................................................... 89 Summary ........................................................................................ 107 V PROCESS DEVELOPMENT OF HIGH PROTEIN PRODUCTS FROM DRY-MILLED CORN GERM ............................ 109
Results and Discussion ................................................................... 121 Summary ........................................................................................ 145 VI CONCLUSIONS ................................................................................... 147 REFERENCES .......................................................................................................... 152
VITA ......................................................................................................................... 166
xi
LIST OF FIGURES
FIGURE Page
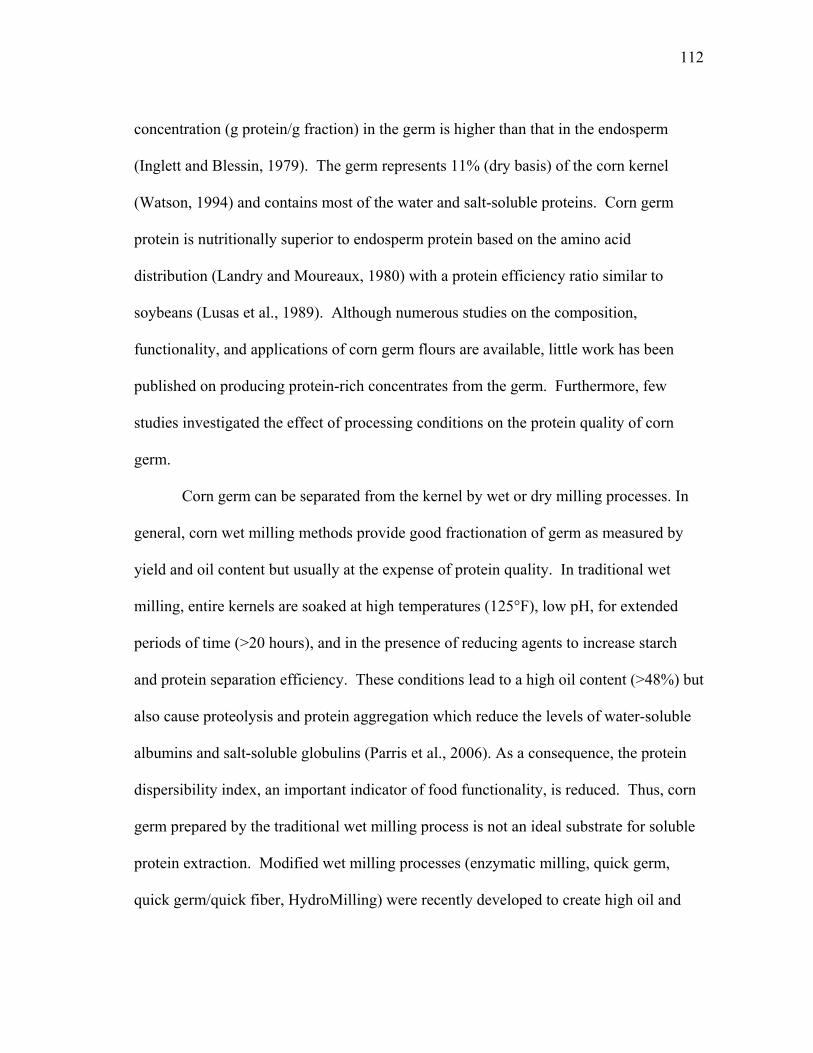
1.1 General processing strategy for protein purification from seed crops ....... 8
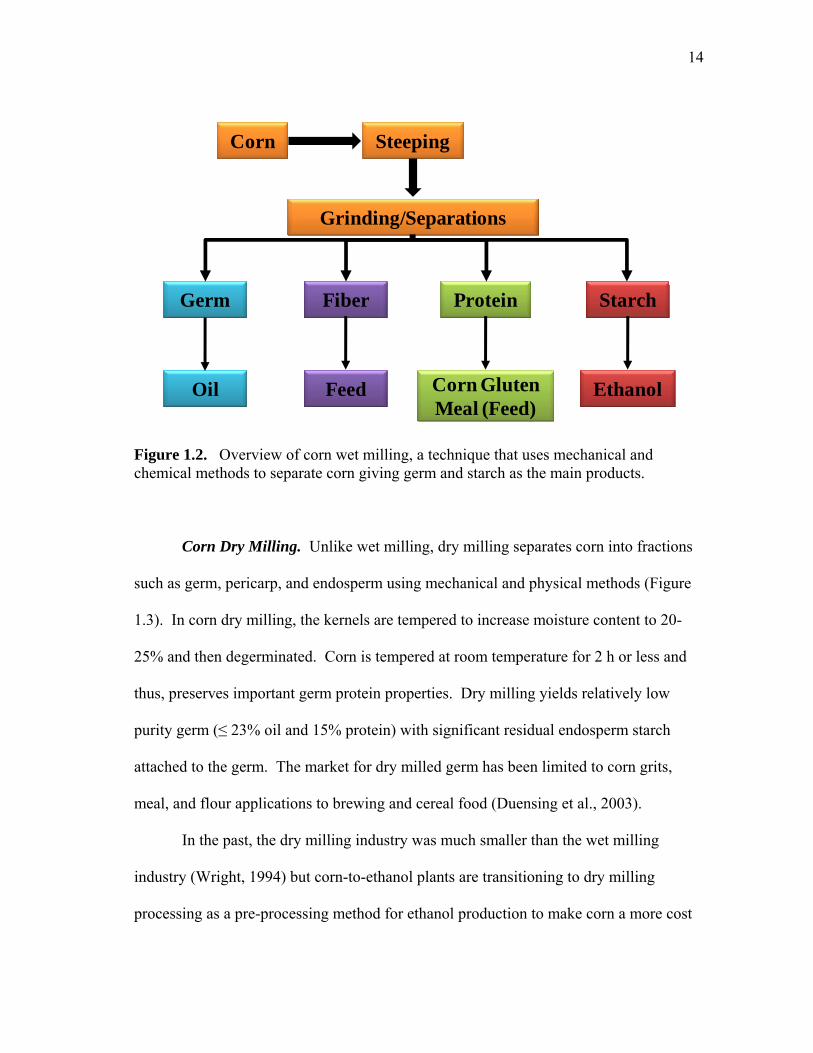
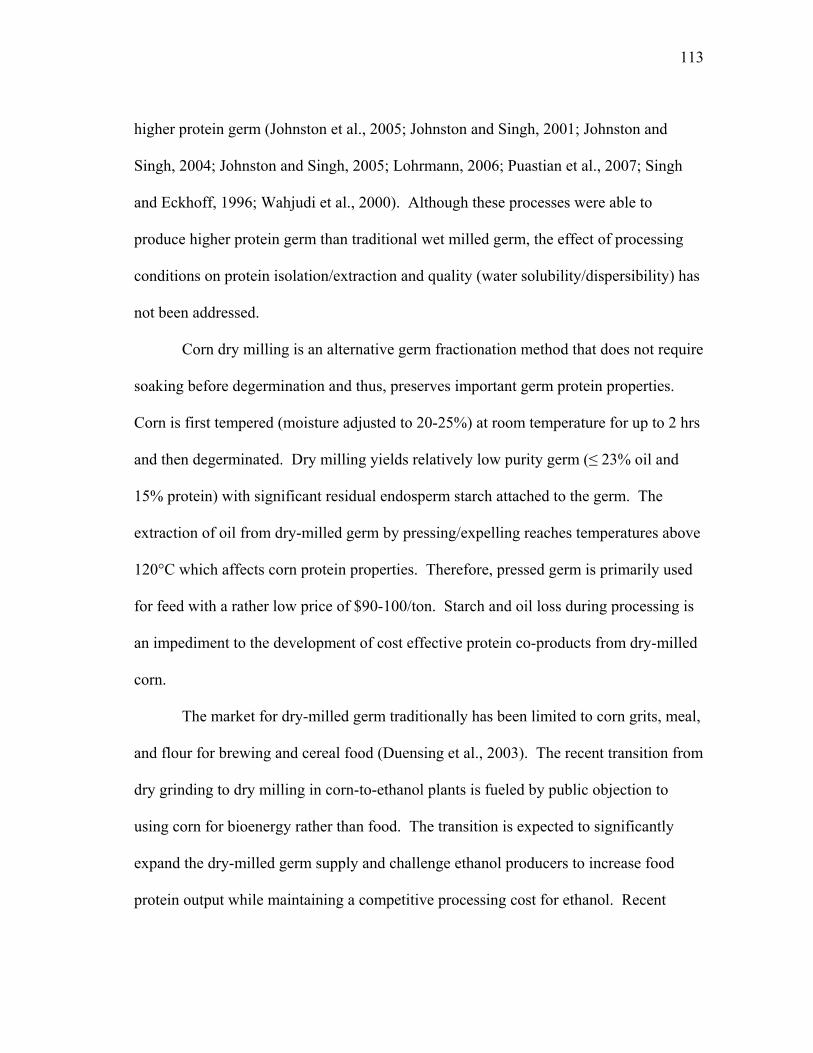
1.2 Overview of corn wet milling, a technique that uses mechanical and chemical methods to separate corn giving germ and starch as the main products ...................................................................................................... 14
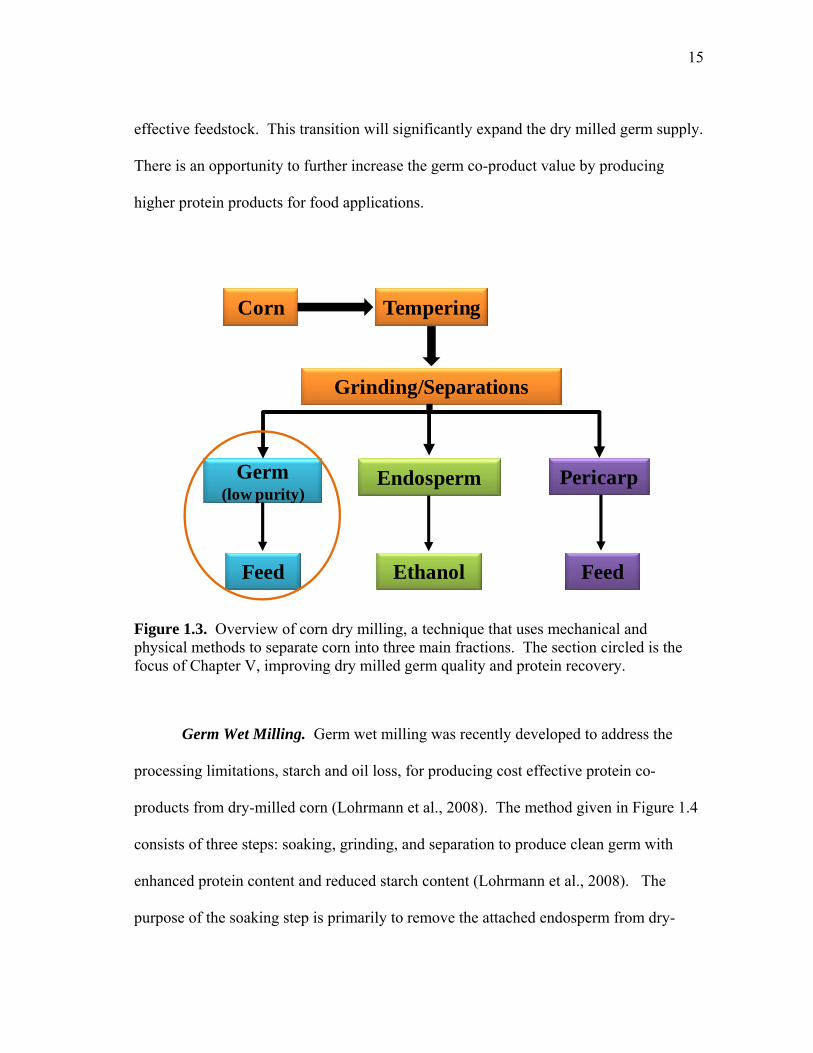
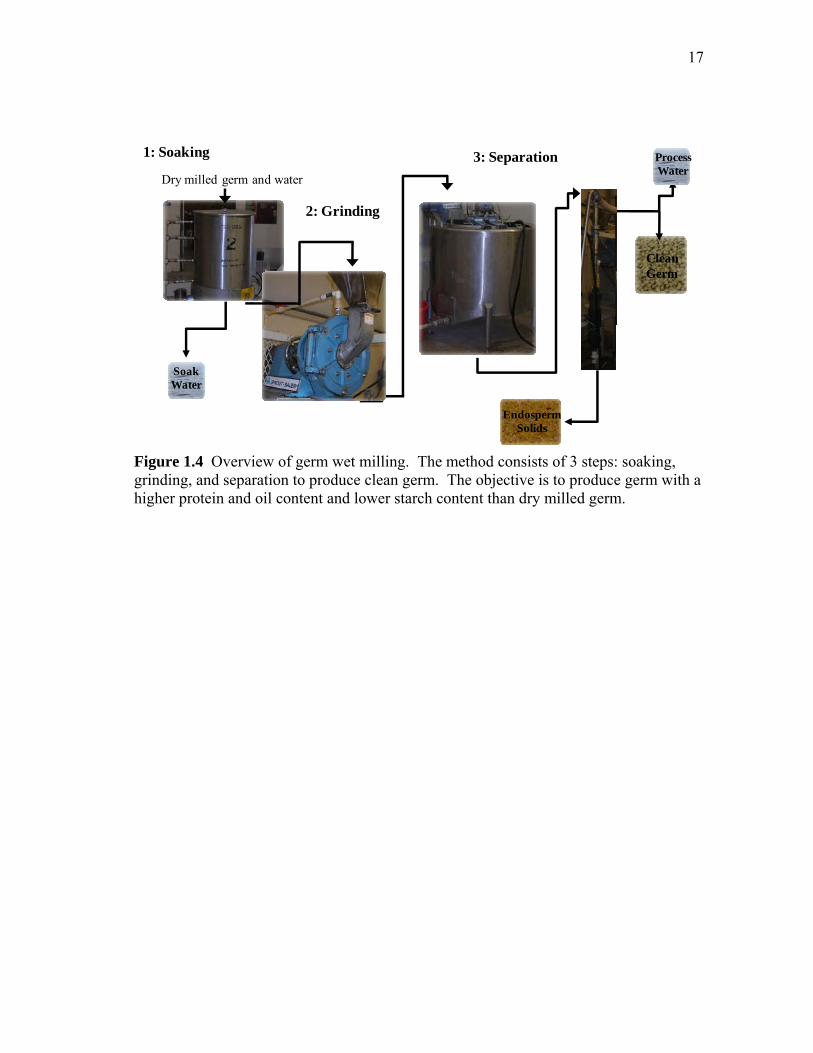
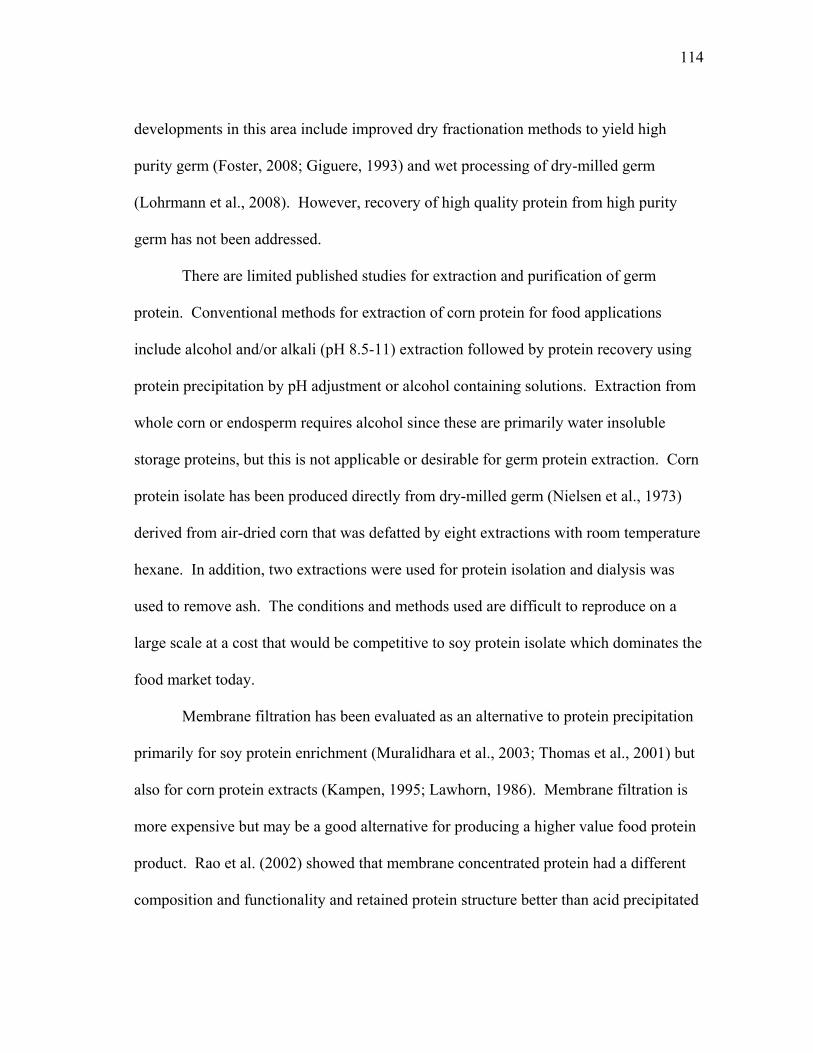
1.3 Overview of corn dry milling, a technique that uses mechanical and physical methods to separate corn into three main fractions ..................... 15 1.4 Overview of germ wet milling ................................................................... 17
2.1 Effect of pH and ionic strength on the extraction of human lysozyme (mg lysozyme/g flour) from transgenic rice ............................................... 30 2.2 Effect of pH and ionic strength on total soluble protein extraction (TSP) from transgenic rice .................................................................................... 31 2.3 Comparison of soluble rice protein in control extracts (C) and transgenic extracts (T) as a function of ionic strength and pH .................................... 33 2.4 Effect of pH and ionic strength on protein composition of extracts .......... 34
2.5 Effect of pH and ionic strength on the saturation binding capacity (SBC) of purified human lysozyme (0.5 mg/mL) on SP-SepharoseTM FF ............ 36 2.6 Chromatogram with pH 4.5 elution profile (a) showing peak fractions analyzed by SDS-PAGE (b) ....................................................................... 38 2.7 Chromatogram with pH 6 elution profile (a) showing peak fractions analyzed by SDS-PAGE (b) ....................................................................... 40 2.8 Elution profile comparison for pH 4.5 control extract and pH 4.5 control extract adjusted to pH 6 showing the reduction of bound protein at pH 6 ........................................................................................................ 42 2.9 Elution peak profile (a) showing fractions analyzed by SDS-PAGE (b) ... 43
xii
FIGURE Page
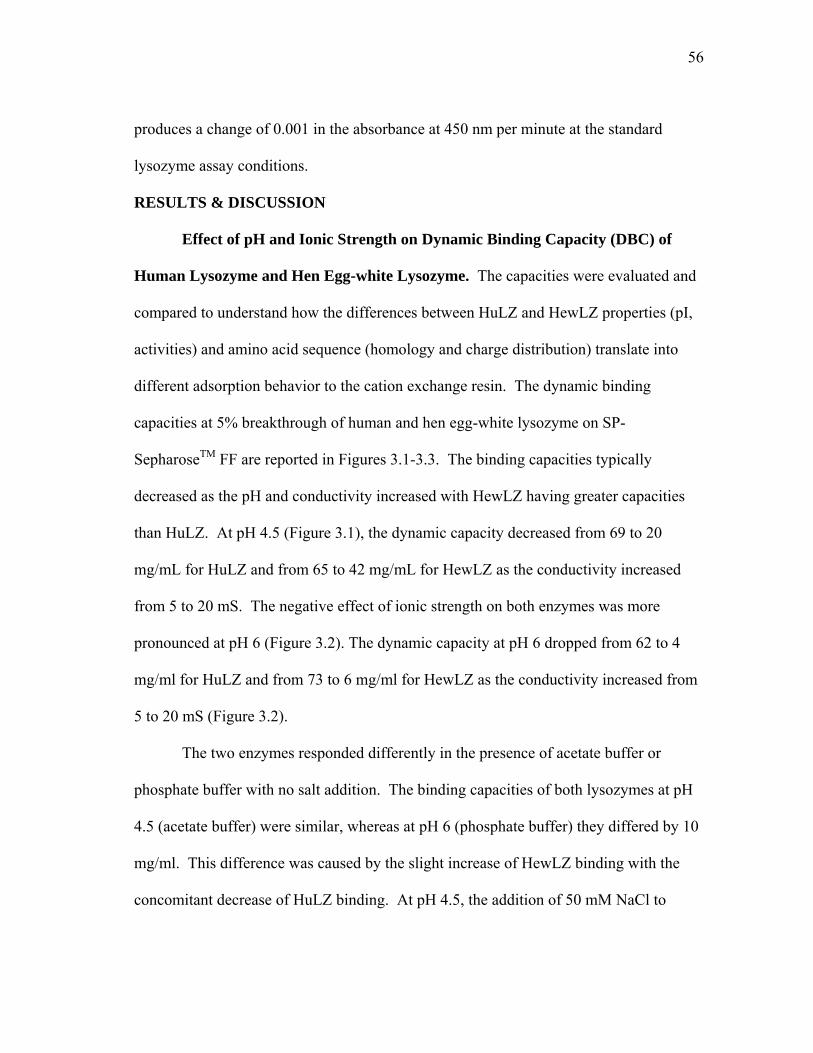
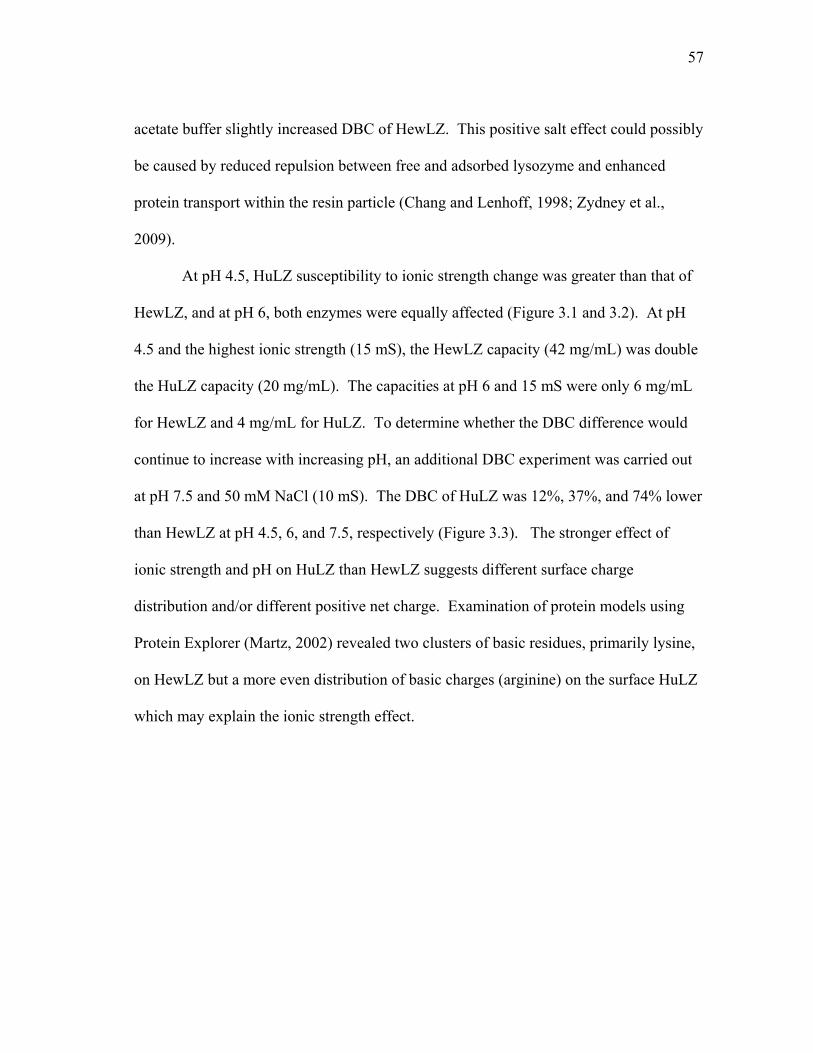
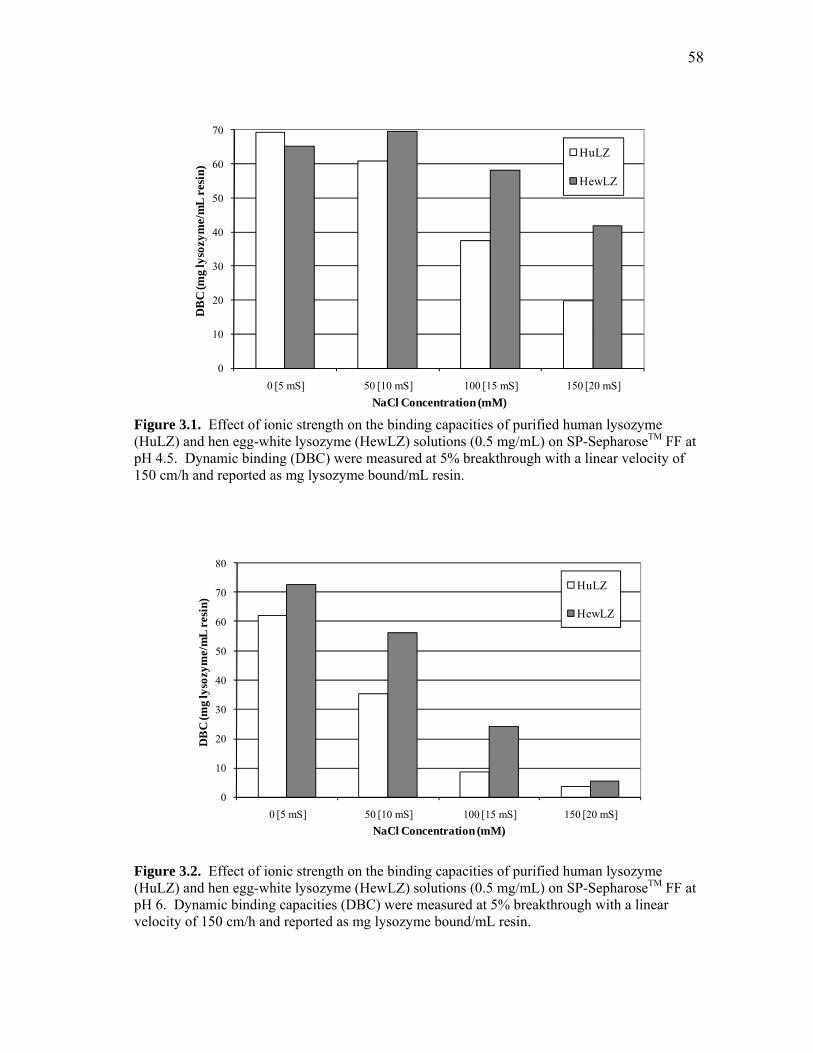
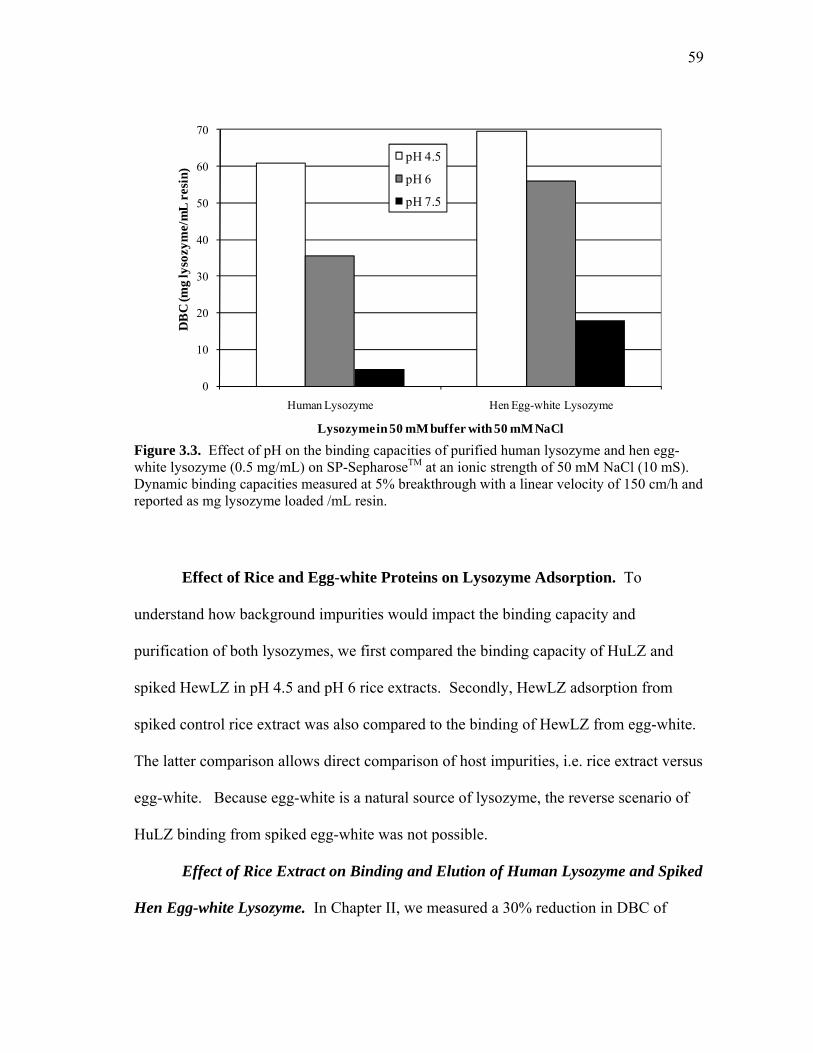
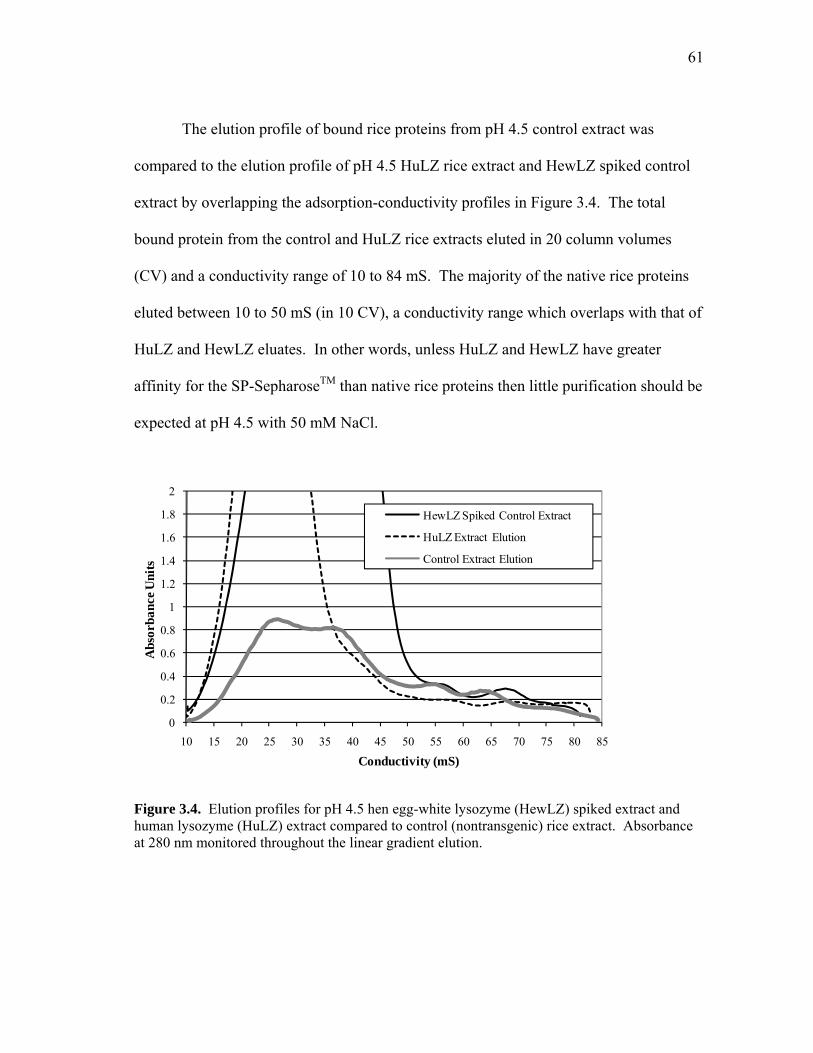
3.1 Effect of ionic strength on the binding capacities of purified human lysozyme (HuLZ) and hen egg-white lysozyme (HewLZ) solutions (0.5 mg/mL) on SP-SepharoseTM FF at pH 4.5 .......................................... 58 3.2 Effect of ionic strength on the binding capacities of purified human lysozyme (HuLZ) and hen egg-white lysozyme (HewLZ) solutions (0.5 mg/mL) on SP-SepharoseTM FF at pH 6 ............................................. 58 3.3 Effect of pH on the binding capacities of purified human lysozyme and hen egg-white lysozyme (0.5 mg/mL) on SP-SepharoseTM FF at an ionic strength of 50 mM NaCl (10 mS) ...................................................... 59 3.4 Elution profiles for pH 4.5 hen egg-white lysozyme (HewLZ) spiked
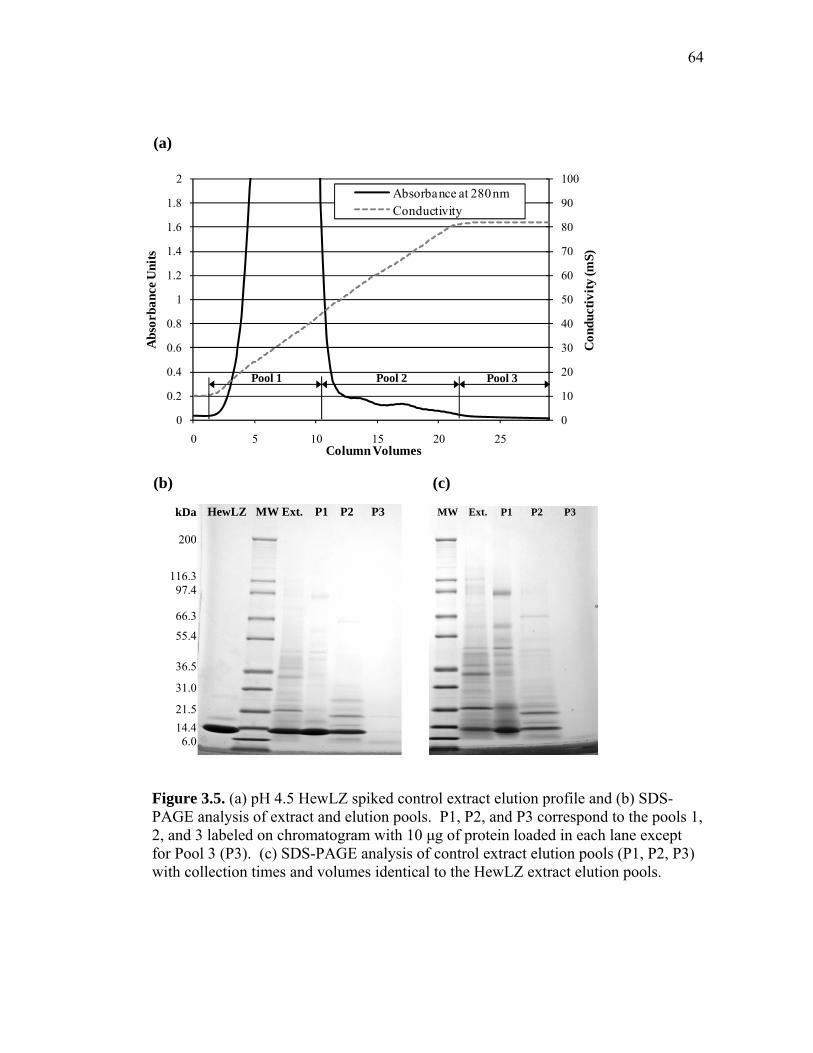
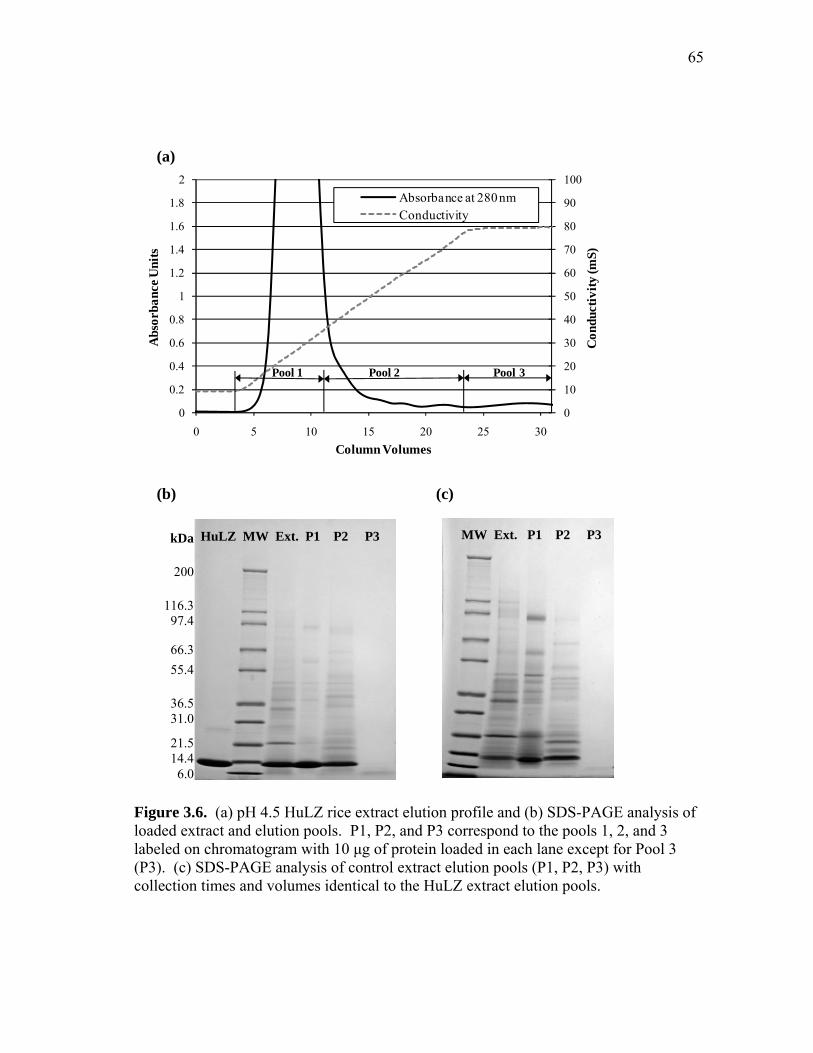
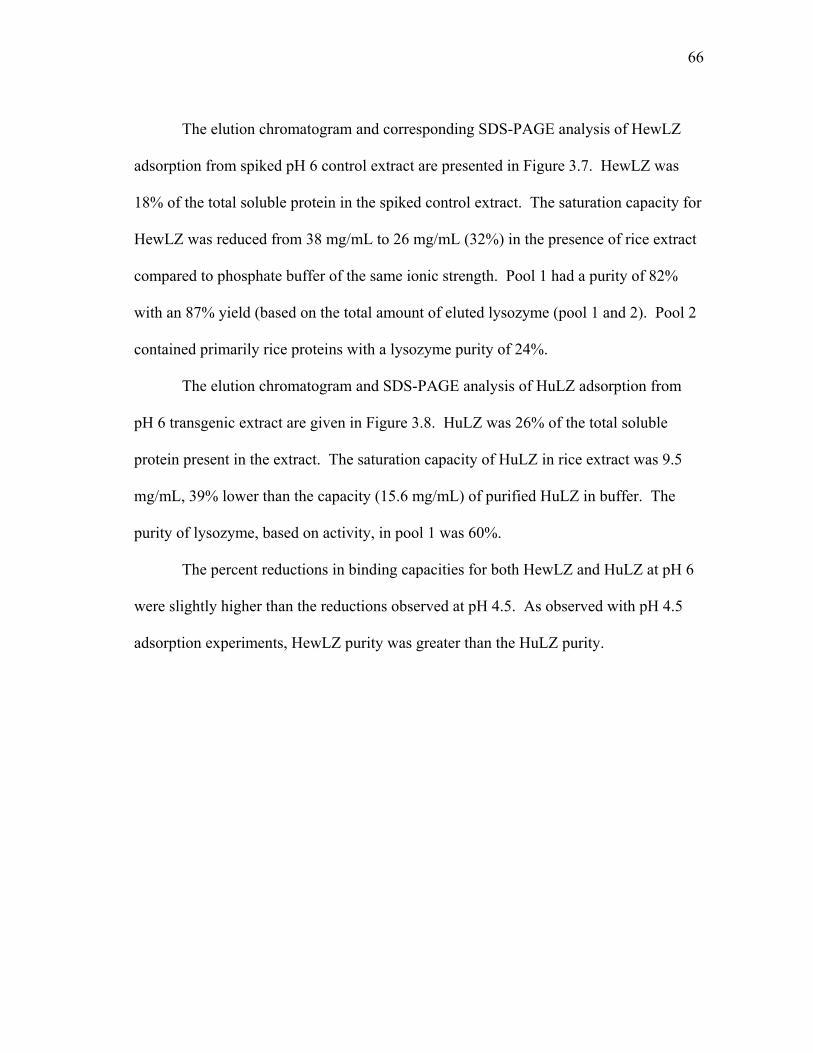
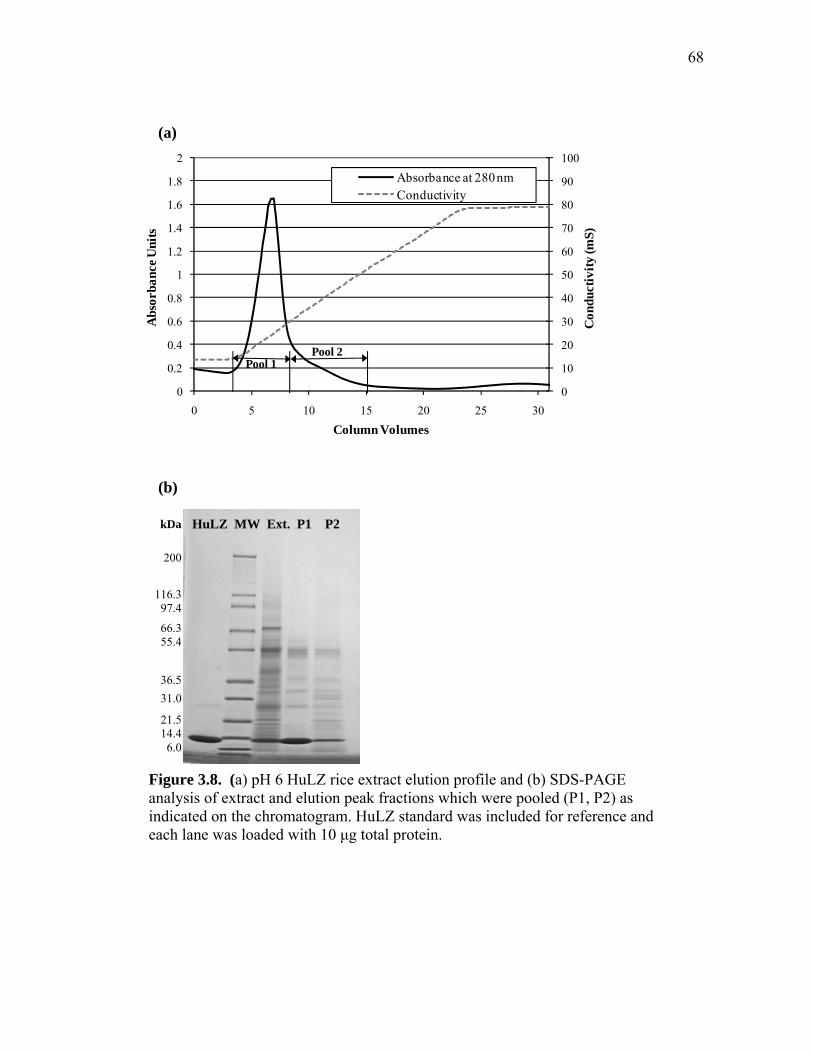
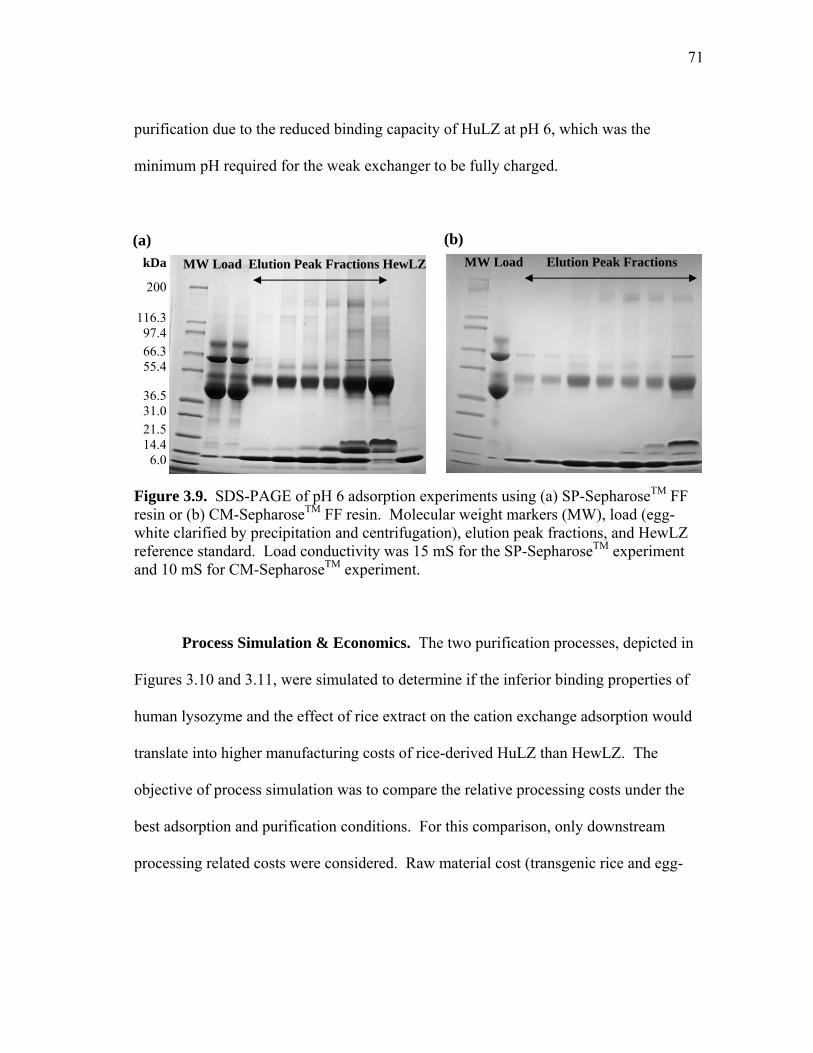
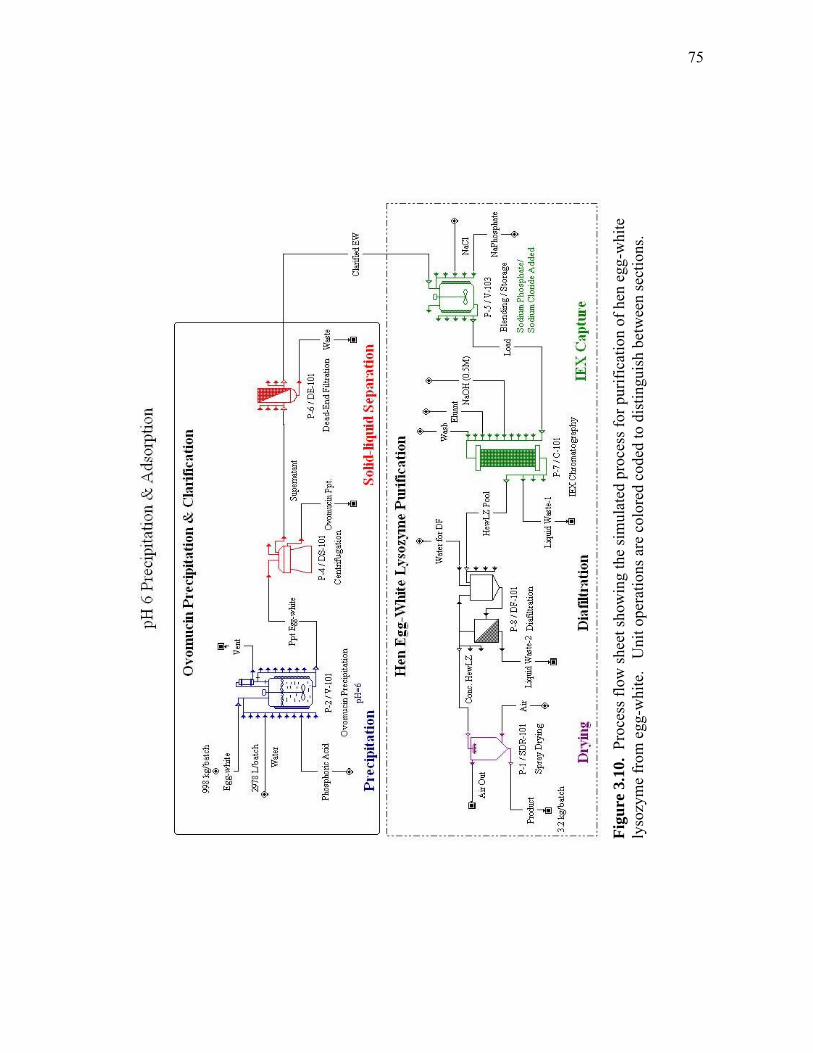
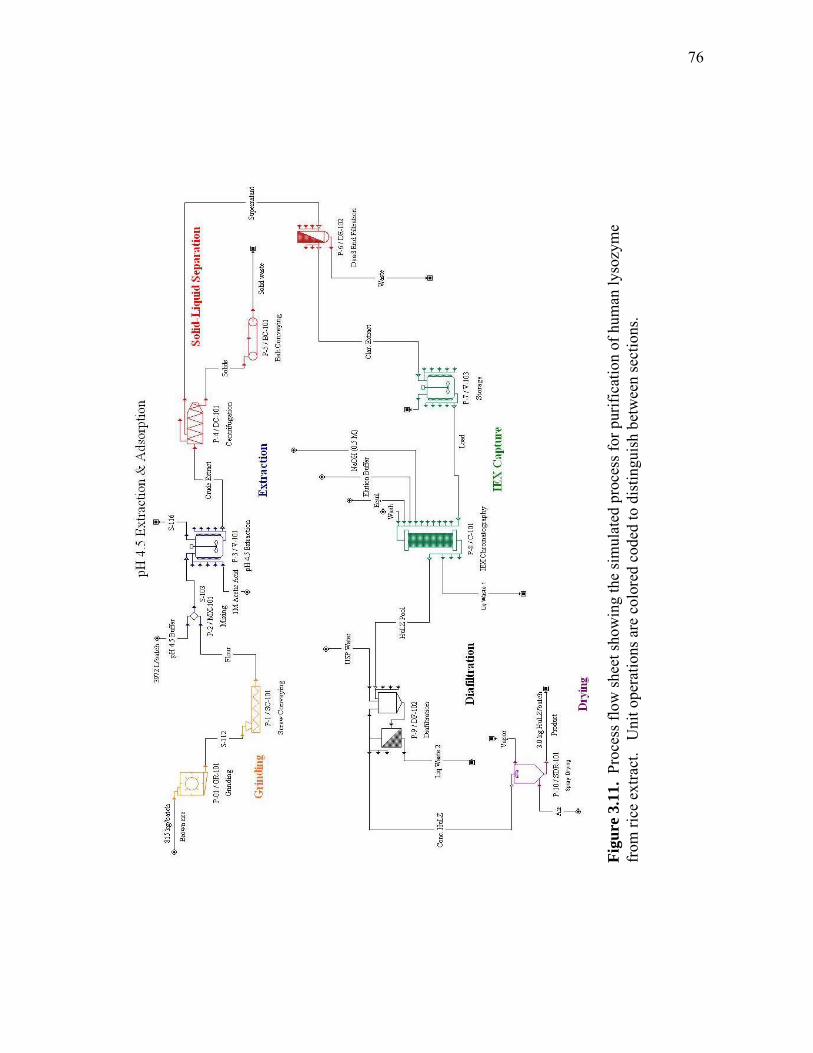
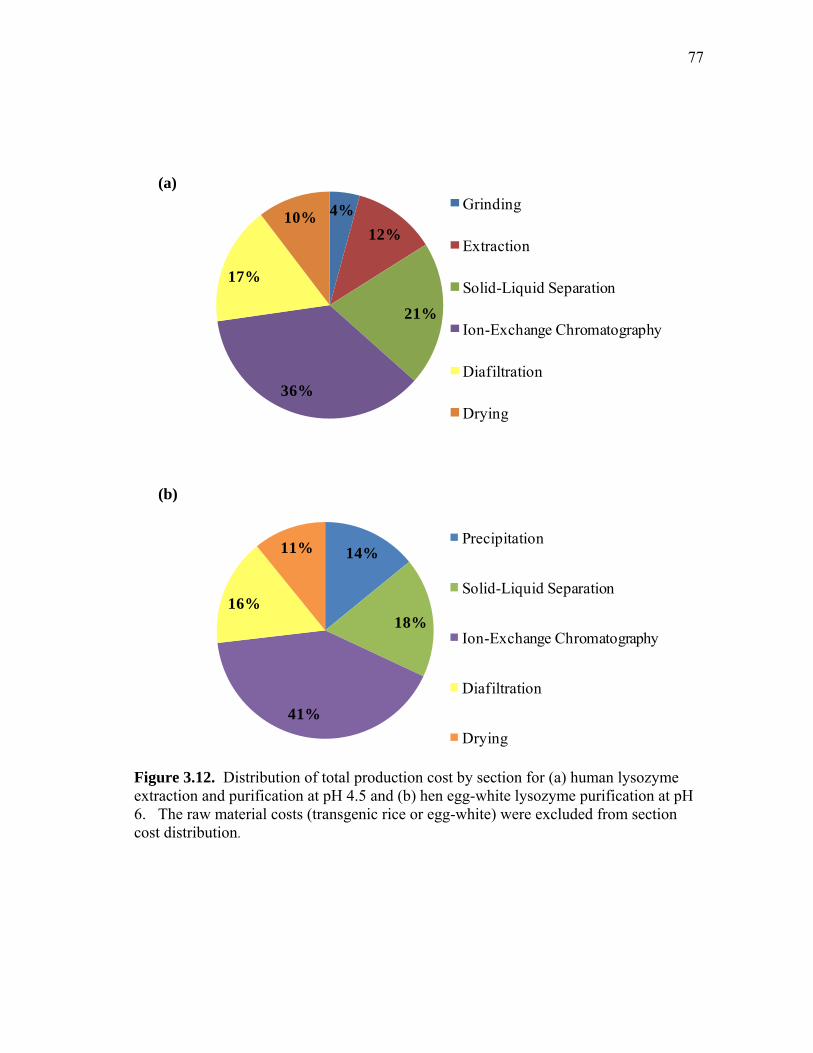
extract and human lysozyme (HuLZ) extract compared to control (nontransgenic) rice extract ........................................................................ 61 3.5 (a) pH 4.5 HewLZ spiked control extract elution profile and (b) SDS-PAGE analysis of extract and elution pools ...................................... 64 3.6 (a) pH 4.5 HuLZ rice extract elution profile and (b) SDS-PAGE analysis of loaded extract and elution pools ............................................................ 65 3.7 (a) pH 6 HewLZ spiked control extract elution profile and (b) SDS-PAGE analysis of extract (ext.) and elution peak fractions which were pooled (P1, P2) as indicated on the chromatogram ................................................ 67 3.8 (a) pH 6 HuLZ rice extract elution profile and (b) SDS-PAGE analysis of extract and elution peak fractions which were pooled (P1, P2) as indicated on the chromatogram .................................................................. 68 3.9 SDS-PAGE of pH 6 adsorption experiments using (a) SP-SepharoseTM FF resin or (b) CM-SepharoseTM FF resin ....................................................... 71 3.10 Process flow sheet showing the simulated process for purification of hen egg-white lysozyme from egg-white ............................................... 75 3.11 Process flow sheet showing the simulated process for purification of human lysozyme from rice extract ......................................................... 76 3.12 Distribution of total production cost by section for (a) human lysozyme extraction and purification at pH 4.5 and (b) hen egg-white lysozyme purification at pH 6 .................................................................................... 77
xiii
FIGURE Page
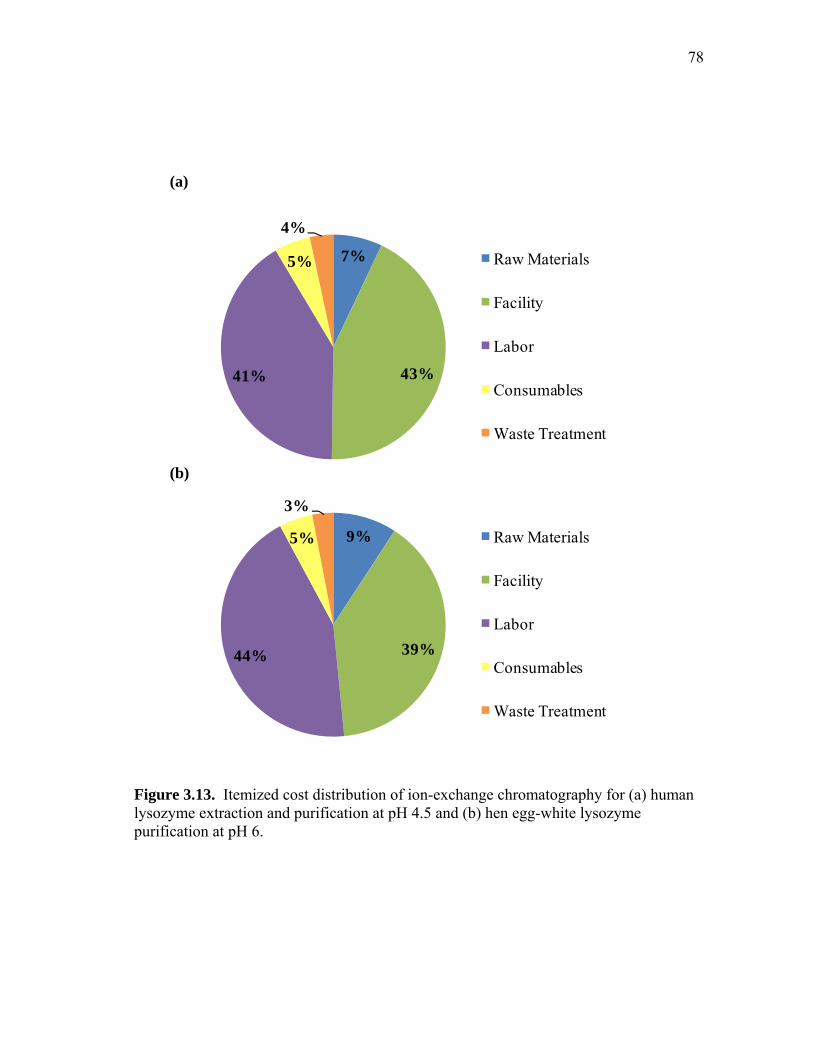
3.13 Itemized cost distribution of ion-exchange chromatography for (a) human lysozyme extraction and purification at pH 4.5 and (b) hen egg-white lysozyme purification at pH 6 ................................................... 78
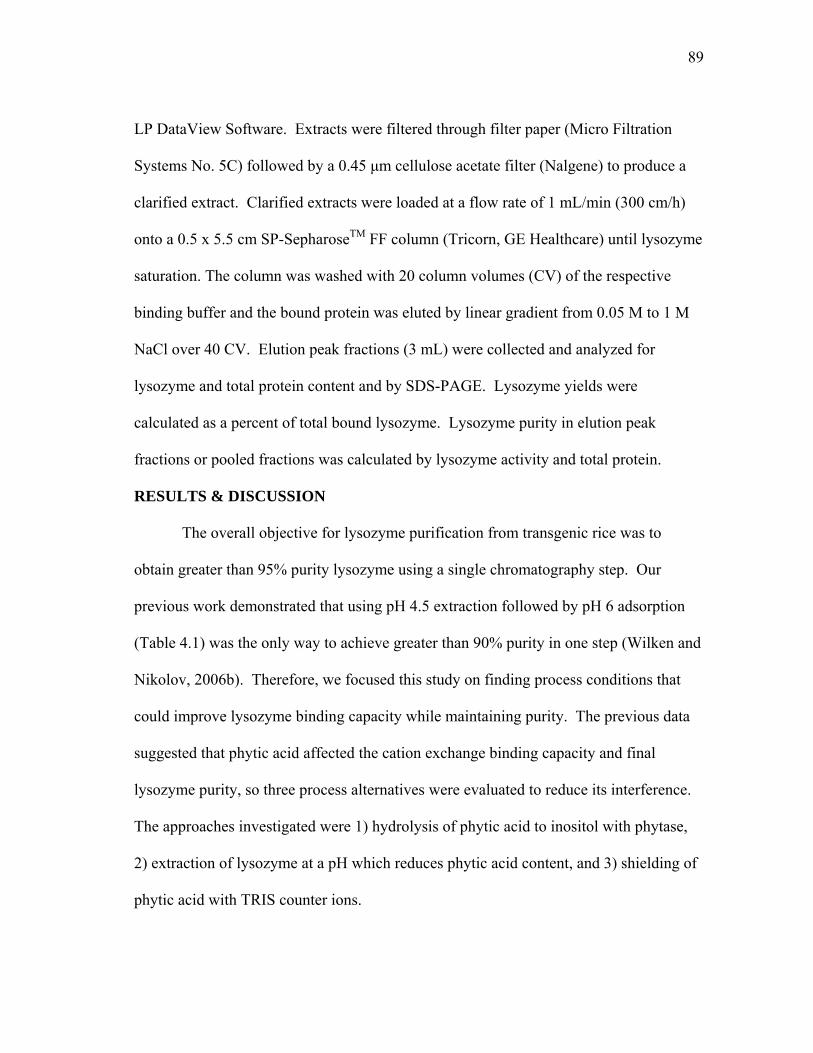
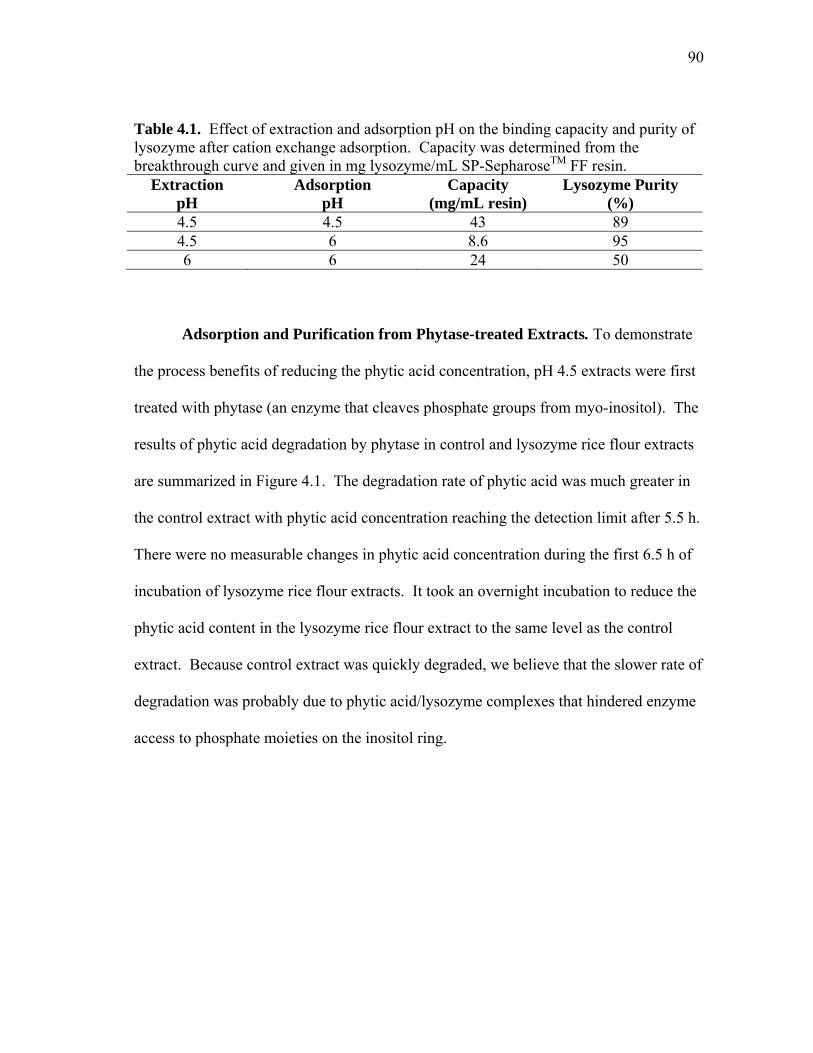
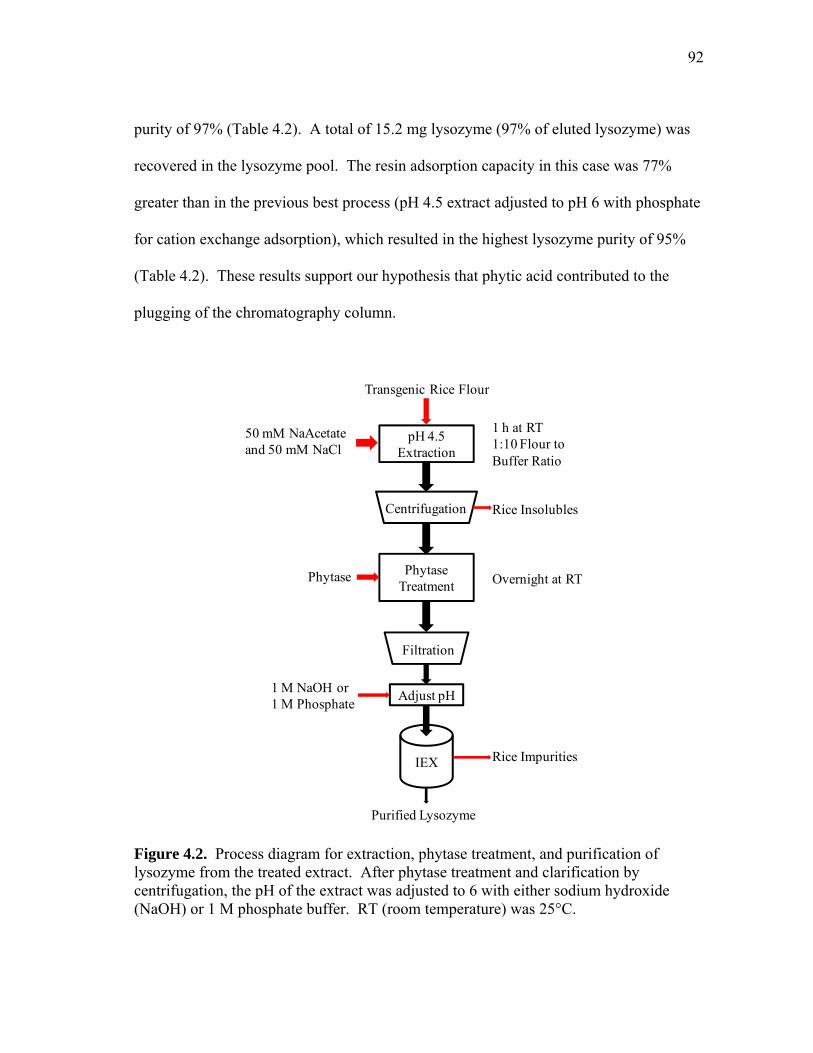
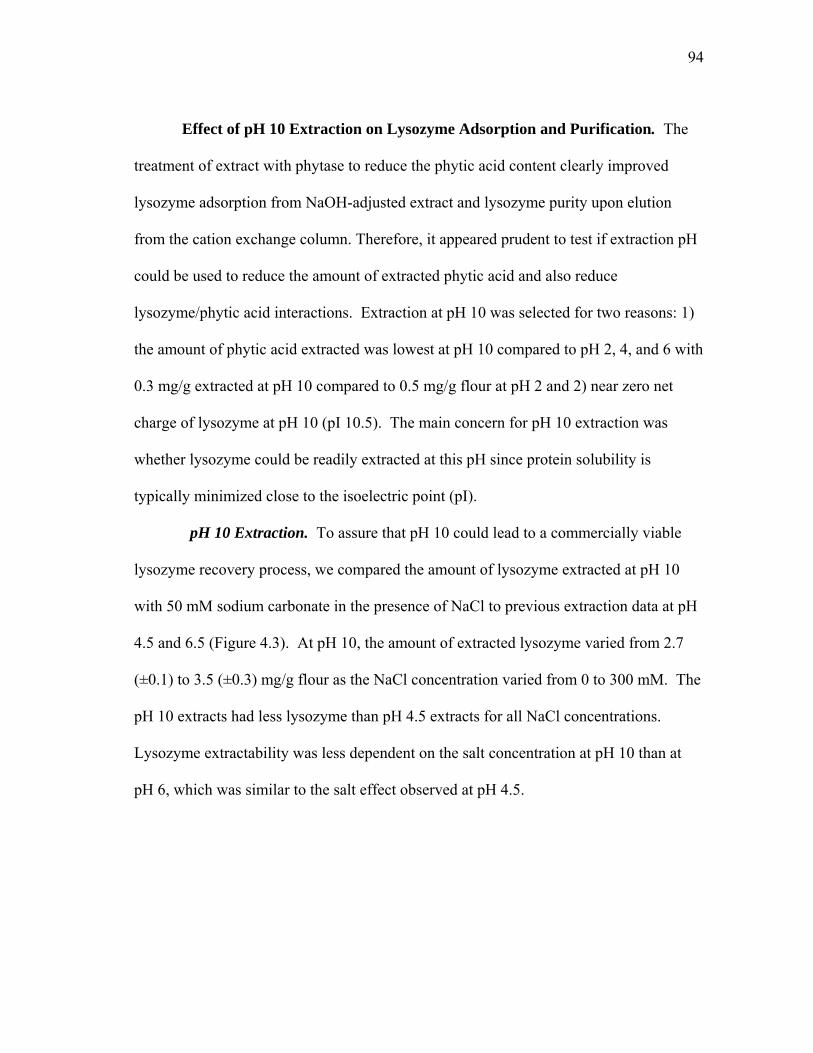
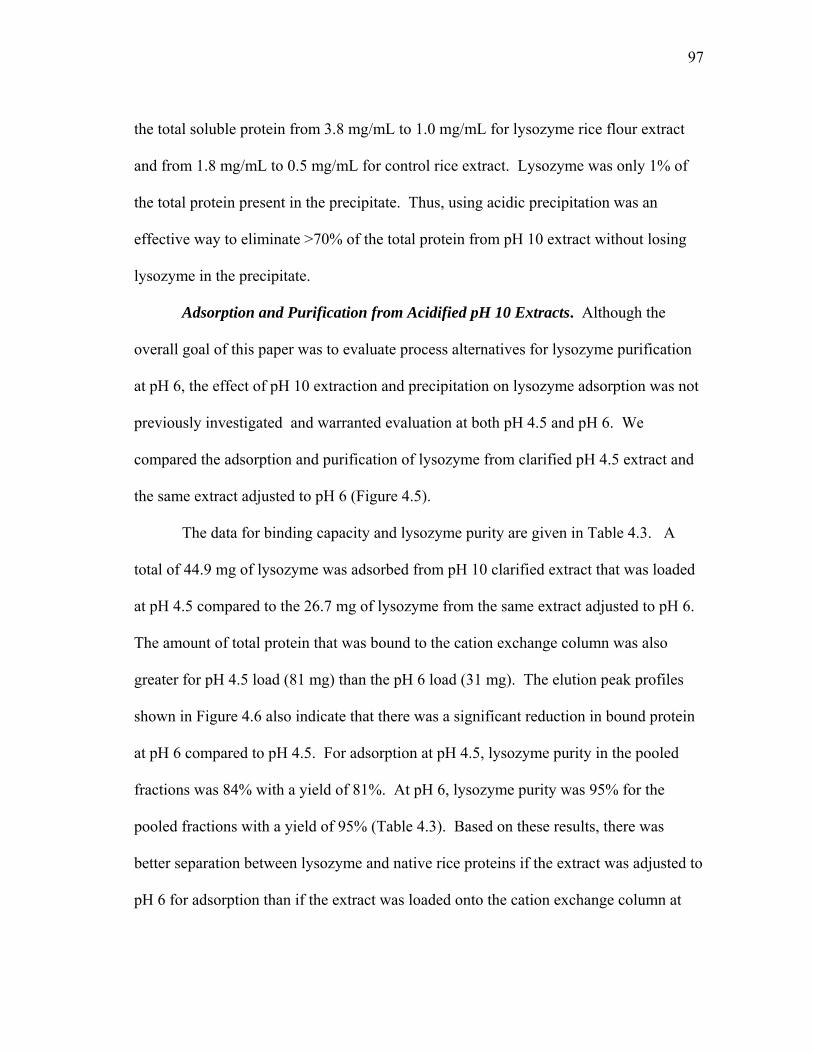
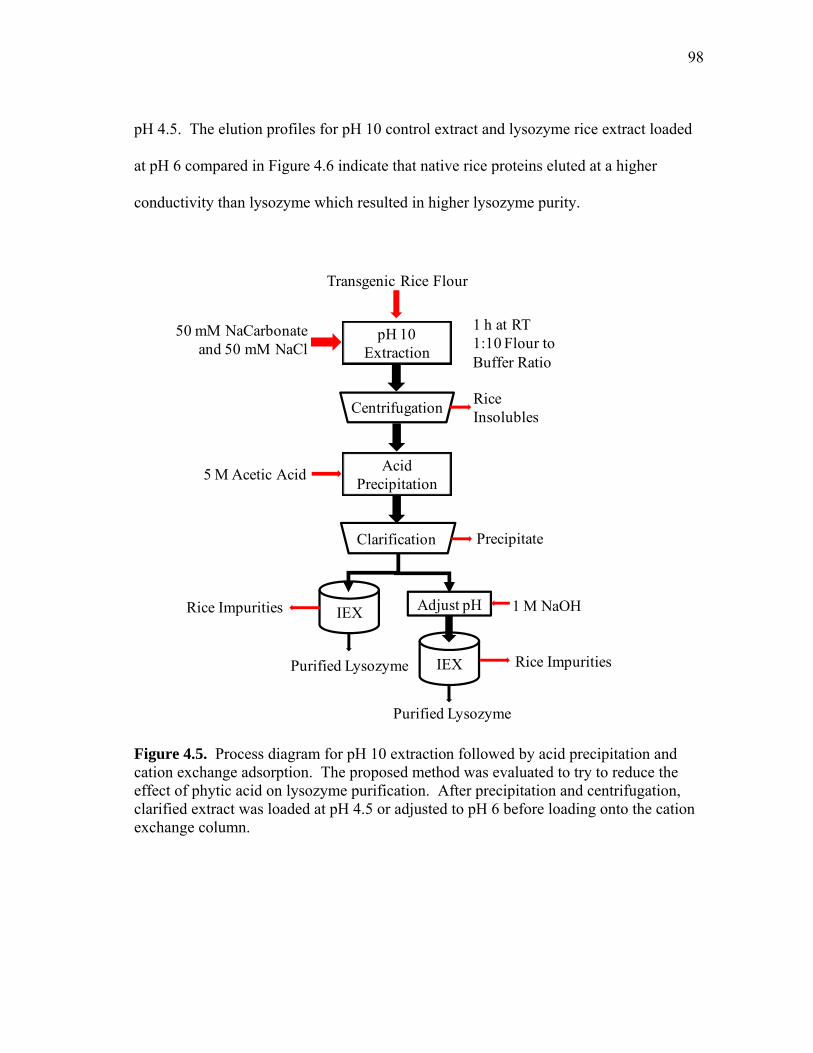
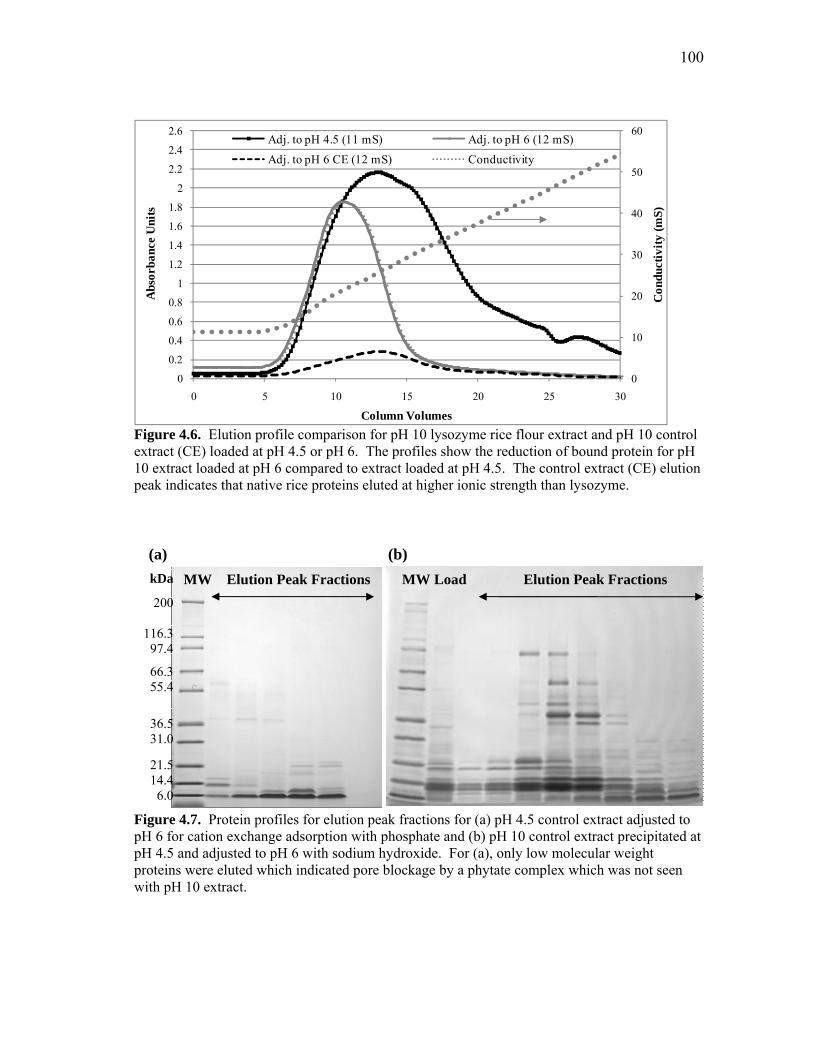
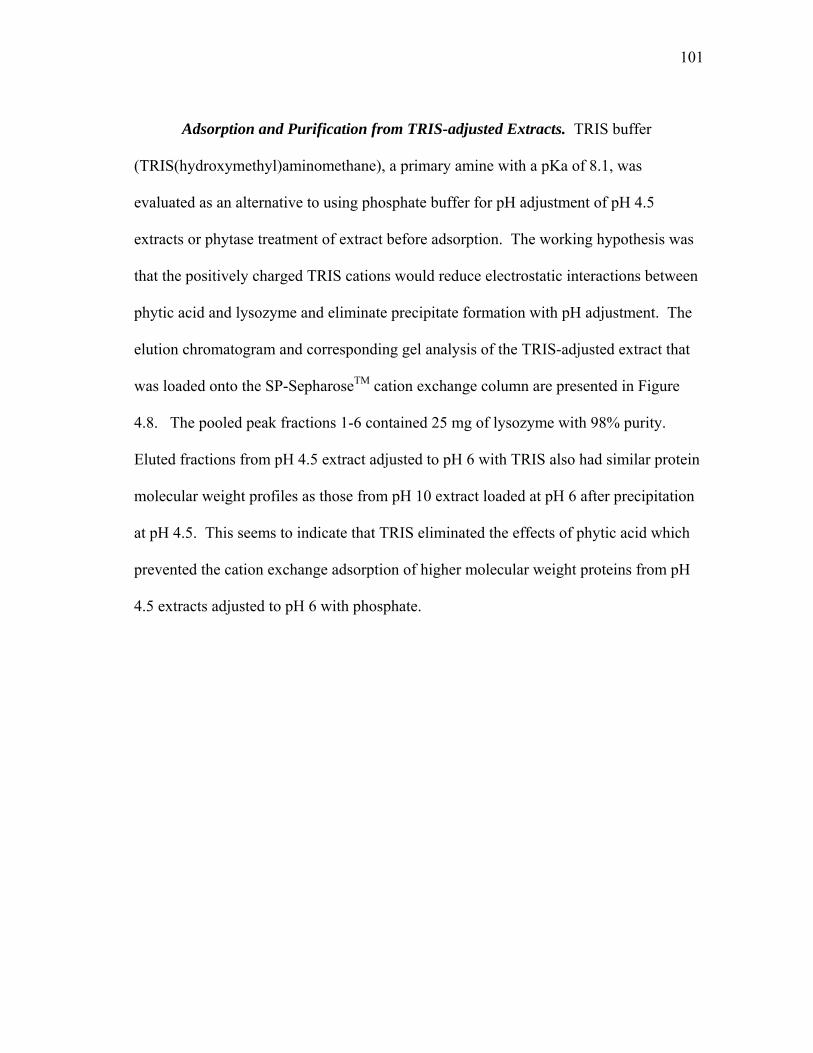
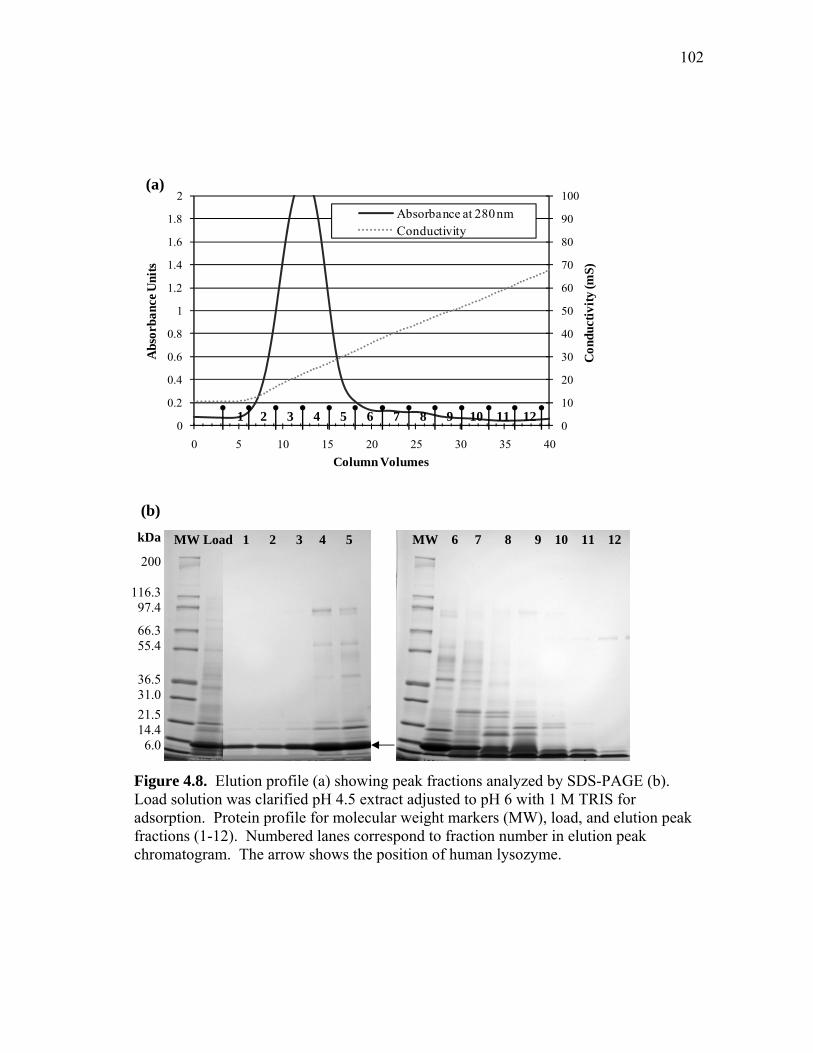
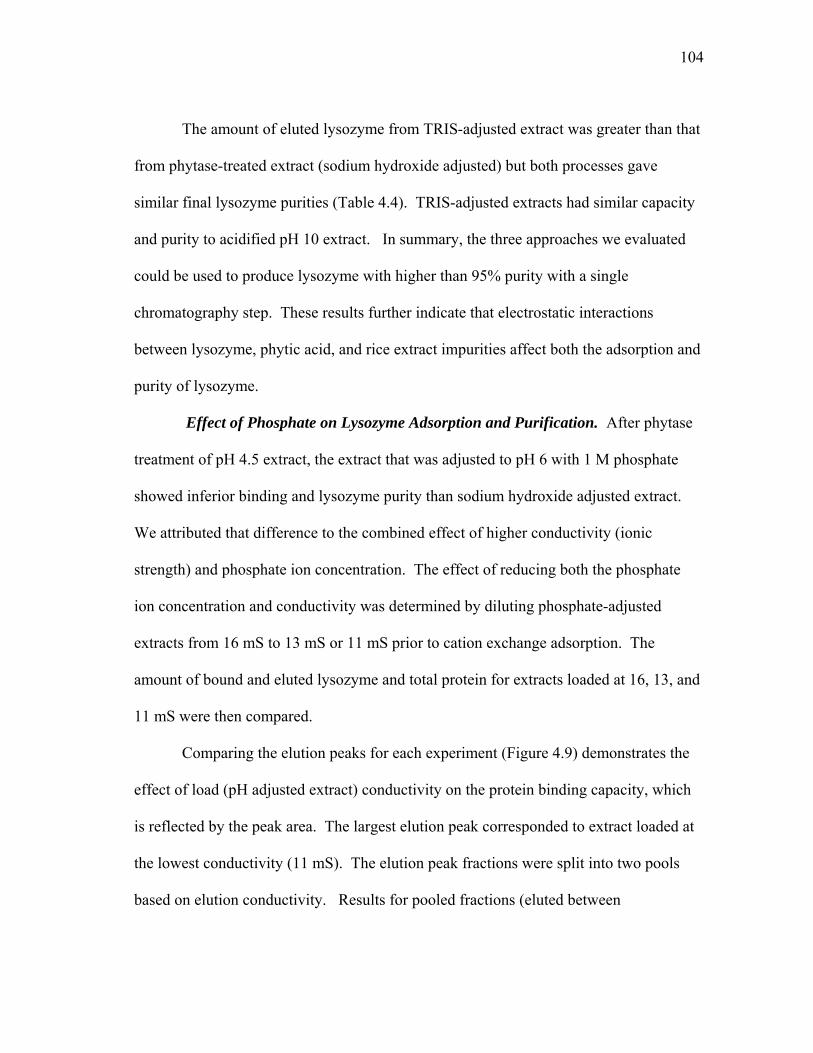
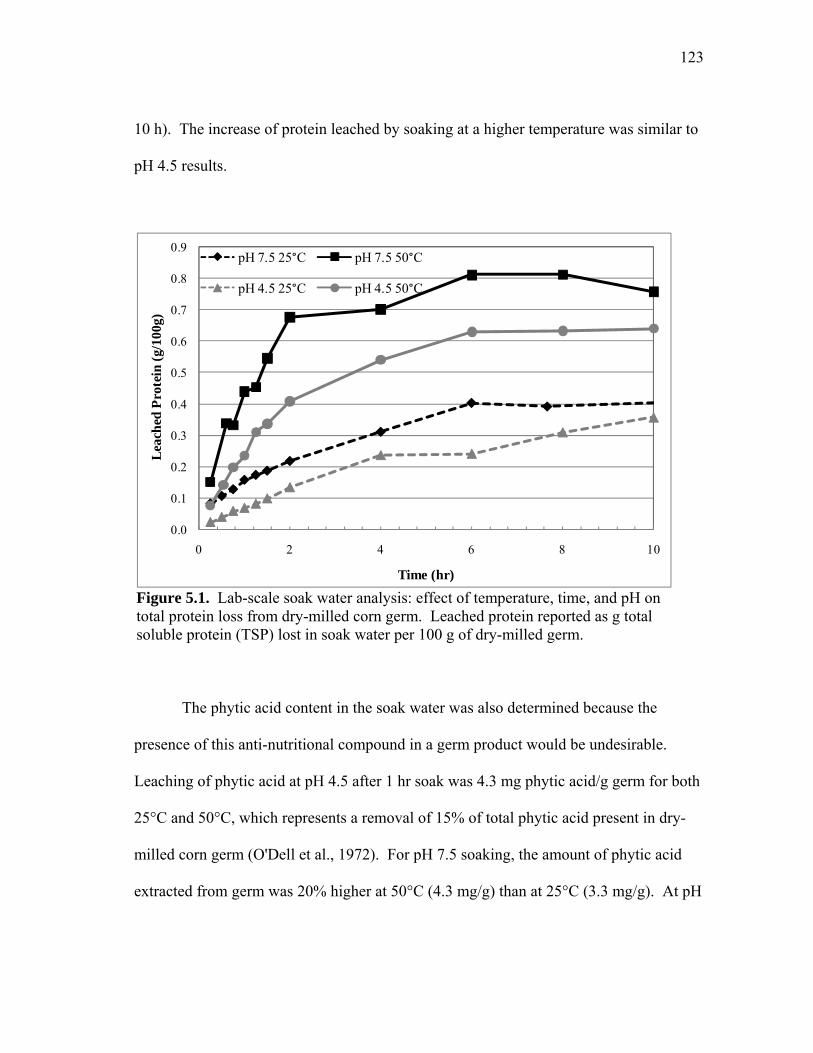
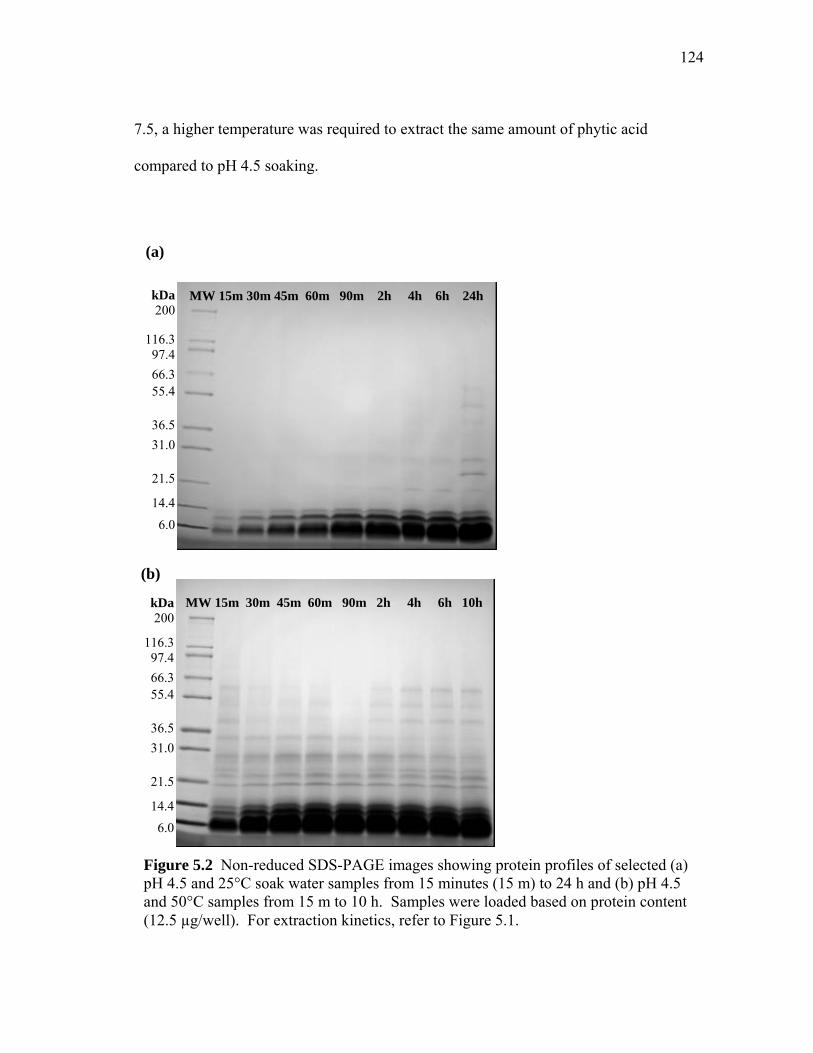
4.1 Kinetics of phytic acid (µg phytic acid/mL extract) degradation by phytase in pH 4.5 lysozyme rice flour extract and pH 4.5 control rice flour extract ................................................................................................ 91 4.2 Process diagram for extraction, phytase treatment, and purification of lysozyme from the treated extract .......................................................... 92 4.3 Extraction of human lysozyme at pH 10 as a function of salt concentration compared to previous data reported in Chapter II ............... 95 4.4 Effect of pH on the extraction of human lysozyme and total soluble protein from transgenic rice ....................................................................... 96 4.5 Process diagram for pH 10 extraction followed by acid precipitation and cation exchange adsorption ................................................................. 98 4.6 Elution profile comparison for pH 10 lysozyme rice flour extract and pH 10 control extract (CE) loaded at pH 4.5 or pH 6 ................................ 100 4.7 Protein profiles for elution peak fractions for (a) pH 4.5 control extract adjusted to pH 6 for cation exchange adsorption with phosphate and (b) pH 10 control extract precipitated at pH 4.5 and adjusted to pH 6 with sodium hydroxide ............................................................................... 100 4.8 Elution profile (a) showing peak fraction analyzed by SDS-PAGE (b) .... 102 4.9 Elution peak comparison for phytase-treated pH 4.5 extracts adjusted to pH 6 with NaOH or phosphate which shows the effect of load conductivity on protein binding capacity ................................................... 106 5.1 Lab-scale soak water analysis: effect of temperature, time, and pH on total protein loss from dry-milled corn germ .................................. 123 5.2 Non-reduced SDS-PAGE images showing protein profiles of selected (a) pH 4.5 and 25°C soak water samples from 15 minutes (15 m) to 24 h and (b) pH 4.5 and 50°C samples from 15 m to 10 h ................................. 124
xiv
FIGURE Page
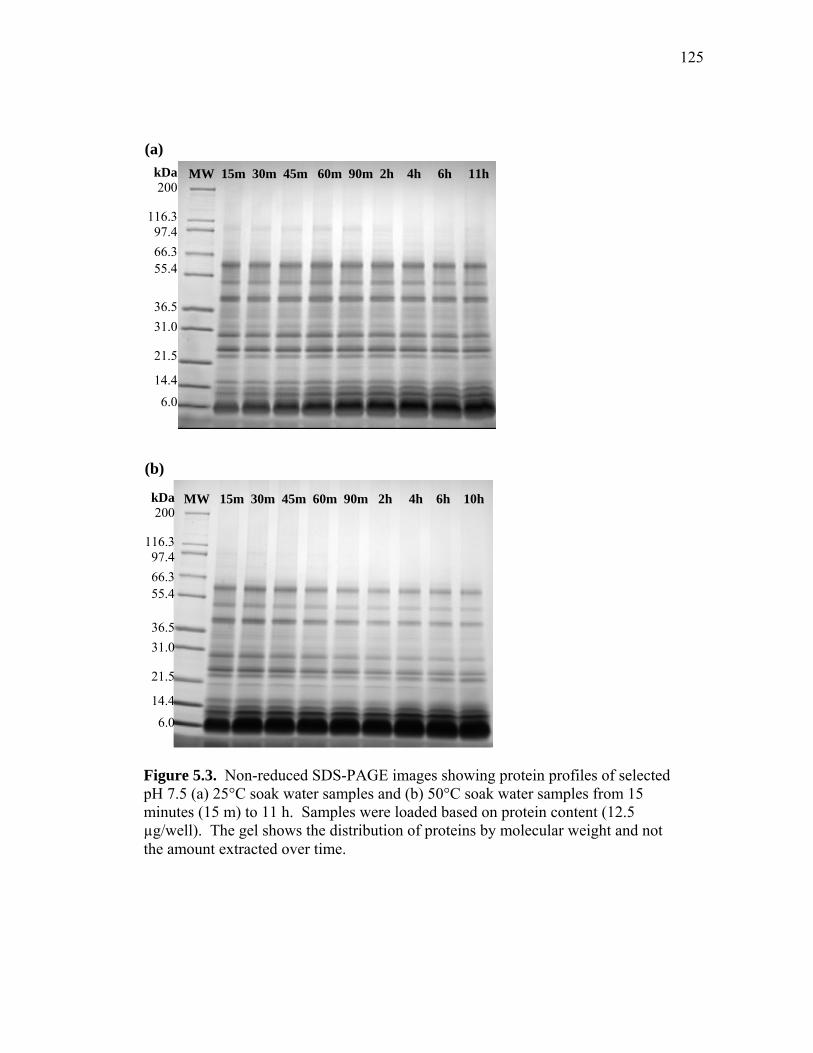
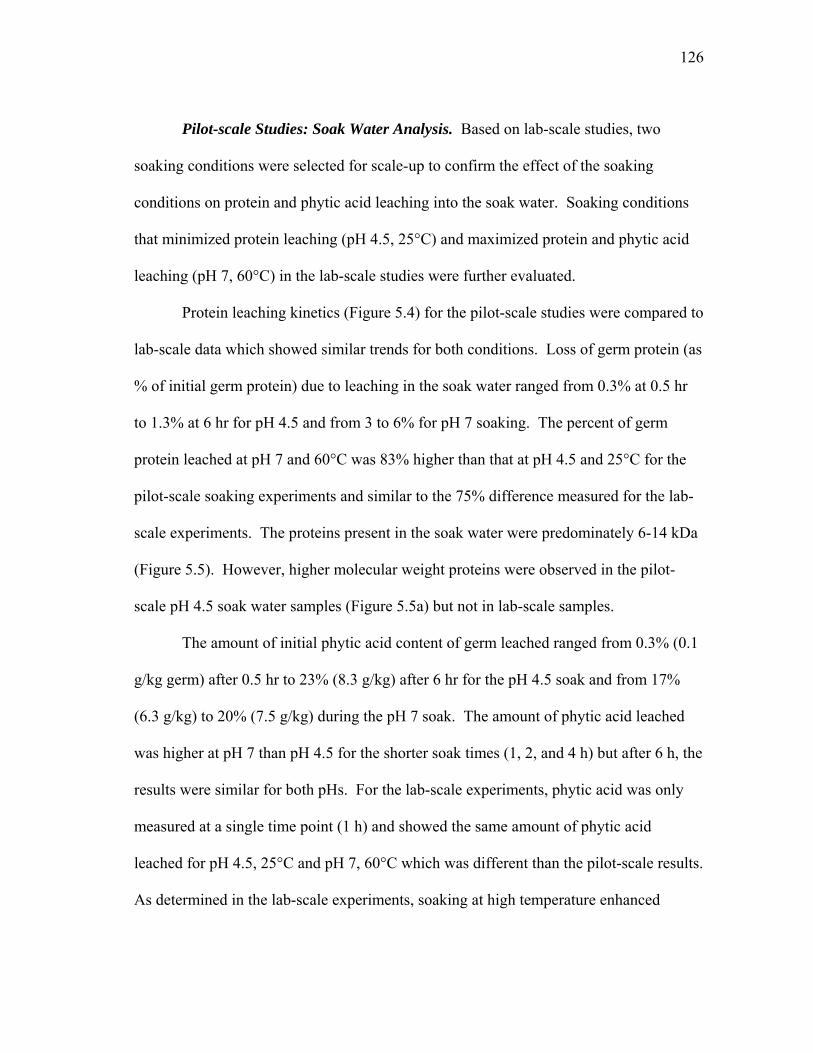
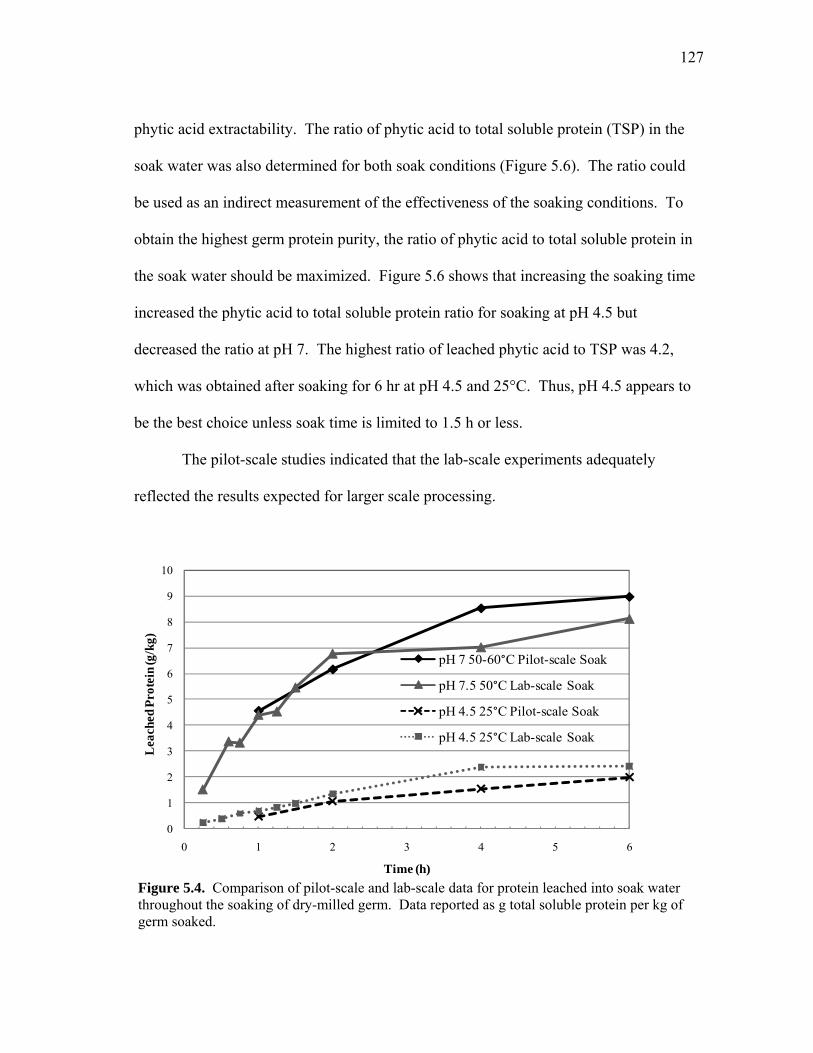
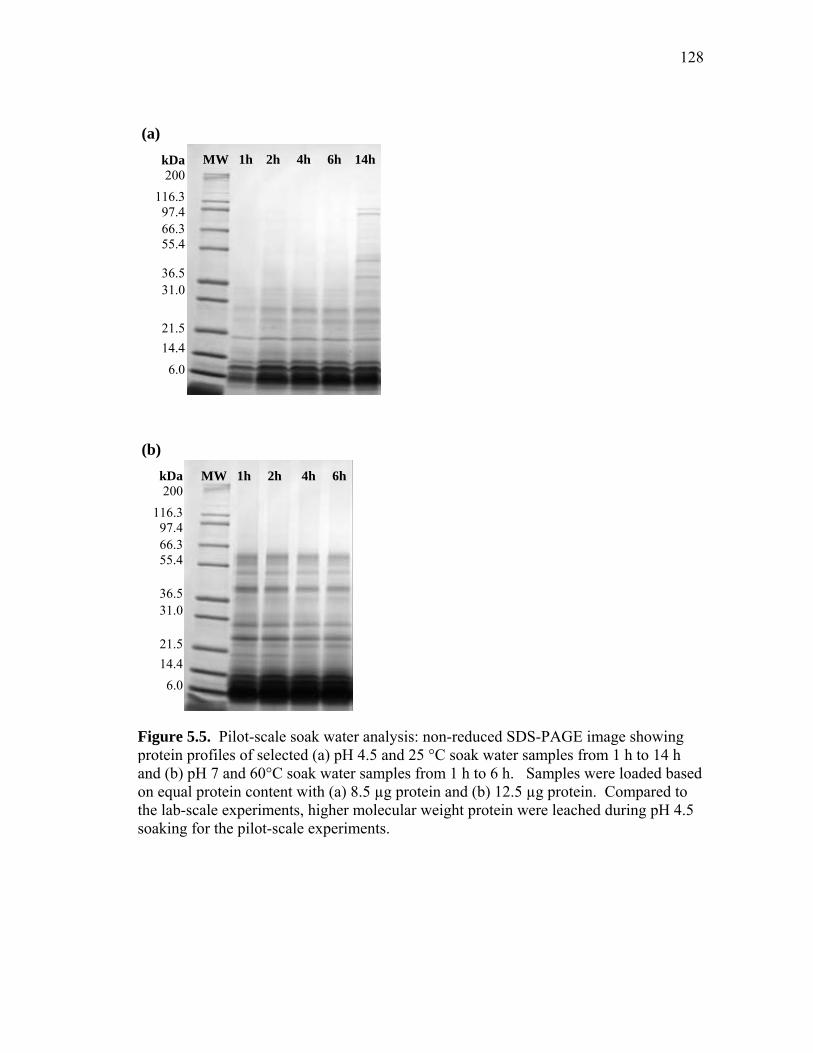
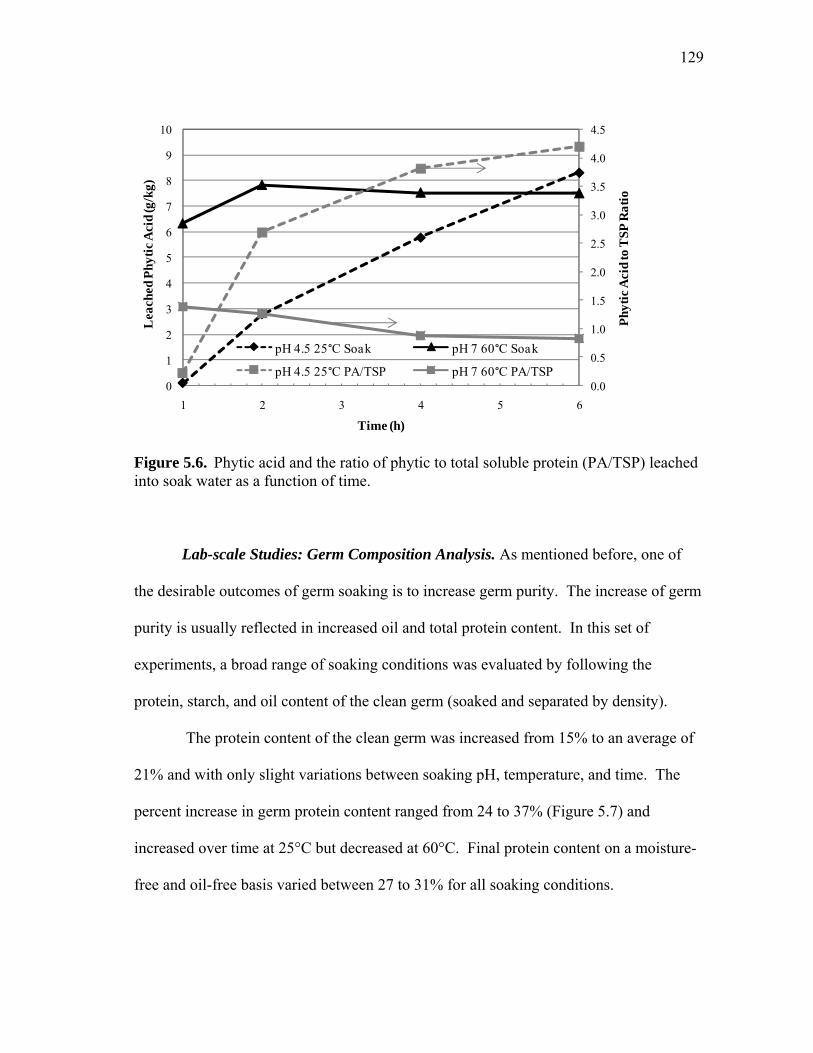
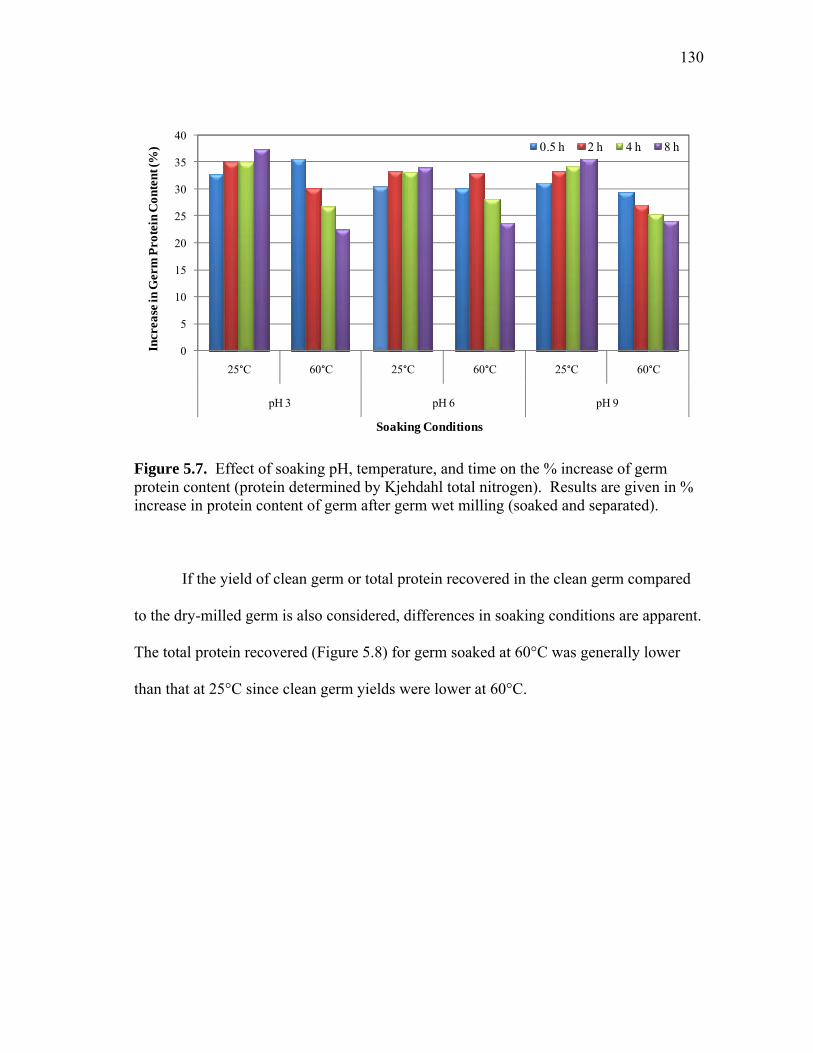
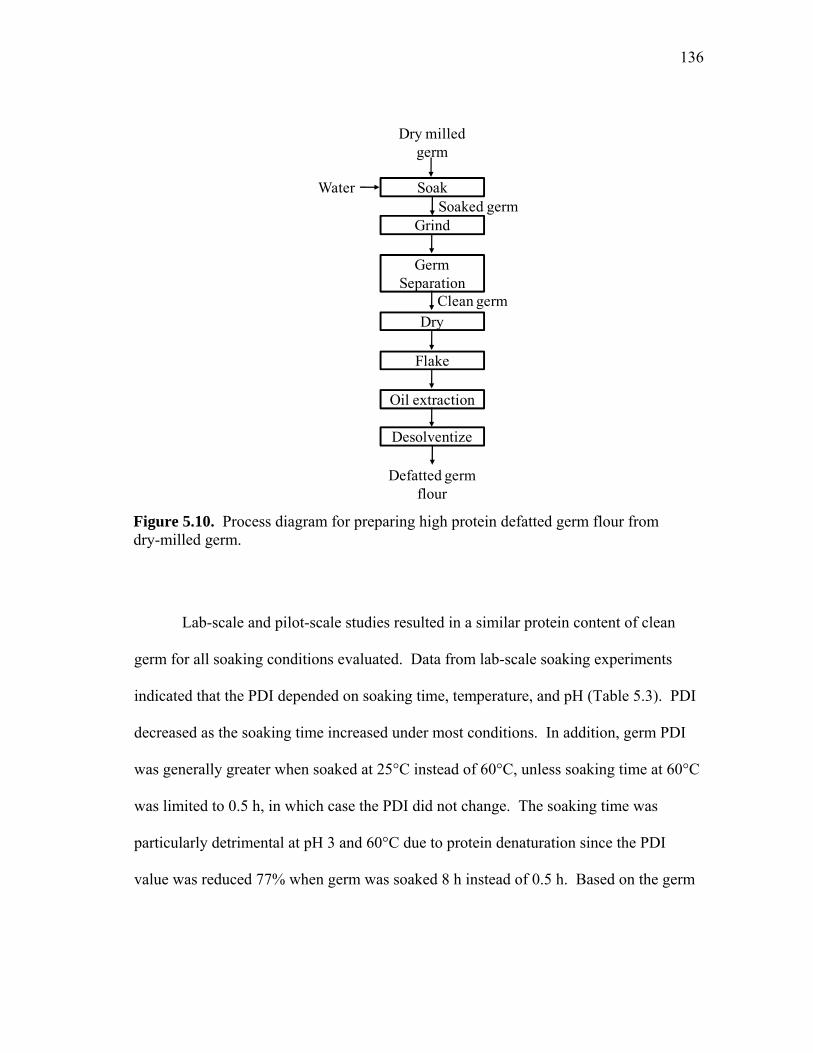
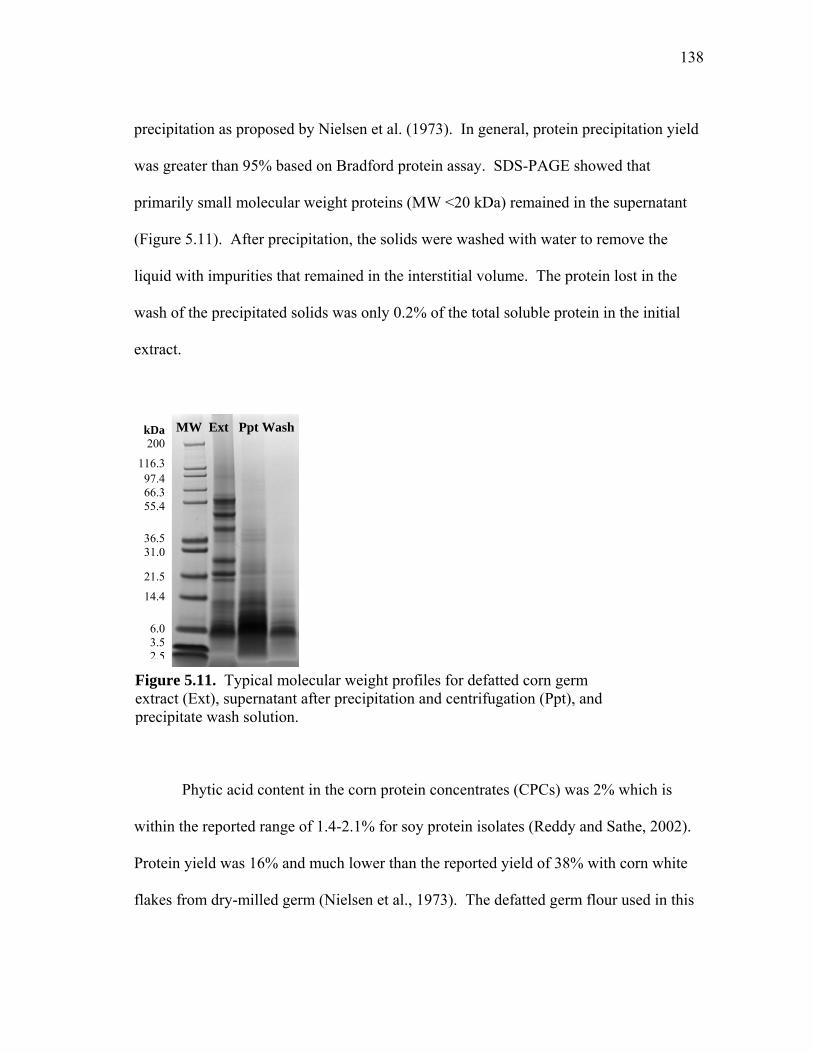
5.3 Non-reduced SDS-PAGE images showing protein profiles of selected pH 7.5 (a) 25°C soak water samples and (b) 50°C soak water samples from 15 minutes (15m) to 11 h ................................................................... 125 5.4 Comparison of pilot-scale and lab-scale data for protein leached into soak water throughout the soaking of dry-milled germ ............................. 127 5.5 Pilot-scale soak water analysis: non-reduced SDS-PAGE image showing protein profiles of selected (a) pH 4.5 and 25 °C soak water samples from 1 h to 14 h and (b) pH 7 and 60°C soak water samples from 1 h to 6 h ............................................................................................ 128 5.6 Phytic acid and the ratio of phytic to total soluble protein (PA/TSP) leached into soak water as a function of time ............................................ 129 5.7 Effect of soaking pH, temperature, and time on the % increase of germ protein content (protein determined by Kjehdahl total nitrogen)...... 130 5.8 Effect of soaking conditions (temperature, pH, time) on germ protein yield (%) ............................................................................... 131 5.9 Effect of soaking pH, temperature, and time on the % increase of germ oil content (oil determined by acid hydrolysis) ................................ 132 5.10 Process diagram for preparing high protein defatted germ flour from dry-milled germ ................................................................................. 136 5.11 Typical molecular weight profiles for defatted corn germ extract (Ext),
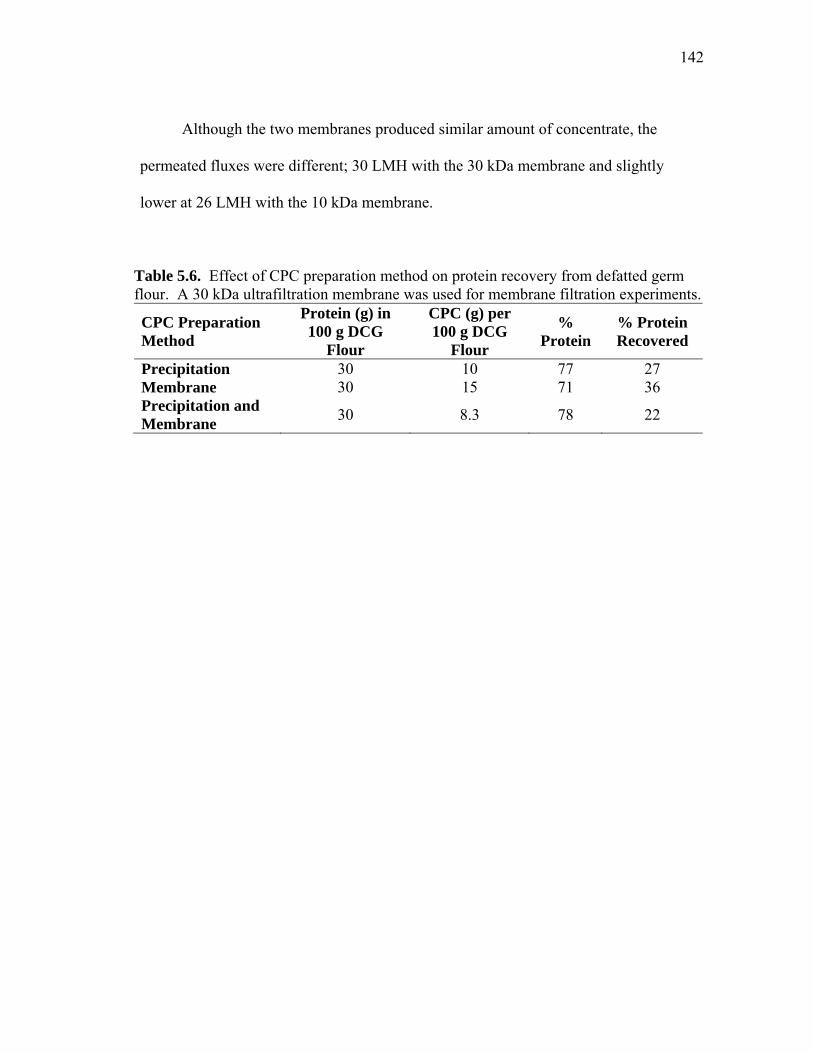
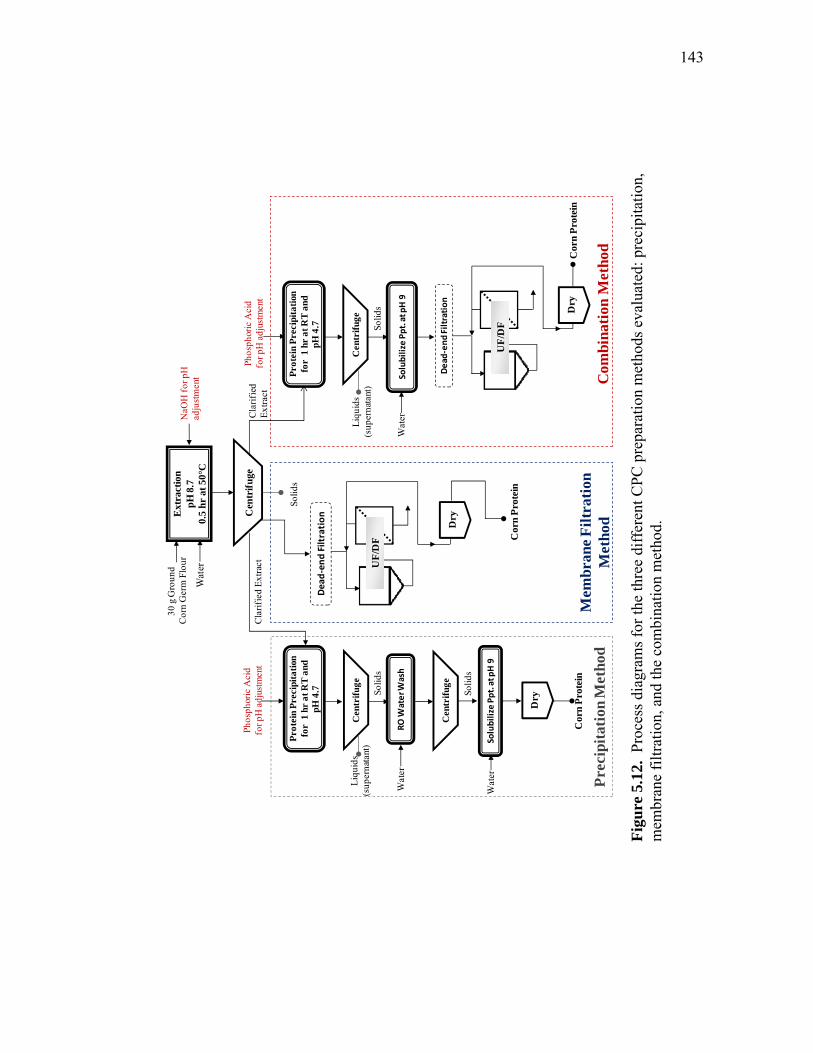
supernatant after precipitation and centrifugation (Ppt), and precipitate wash solution .............................................................................................. 138 5.12 Process diagrams for the three different CPC preparation methods evaluated: precipitation, membrane filtration, and the combination method ................................................................................... 143
xv
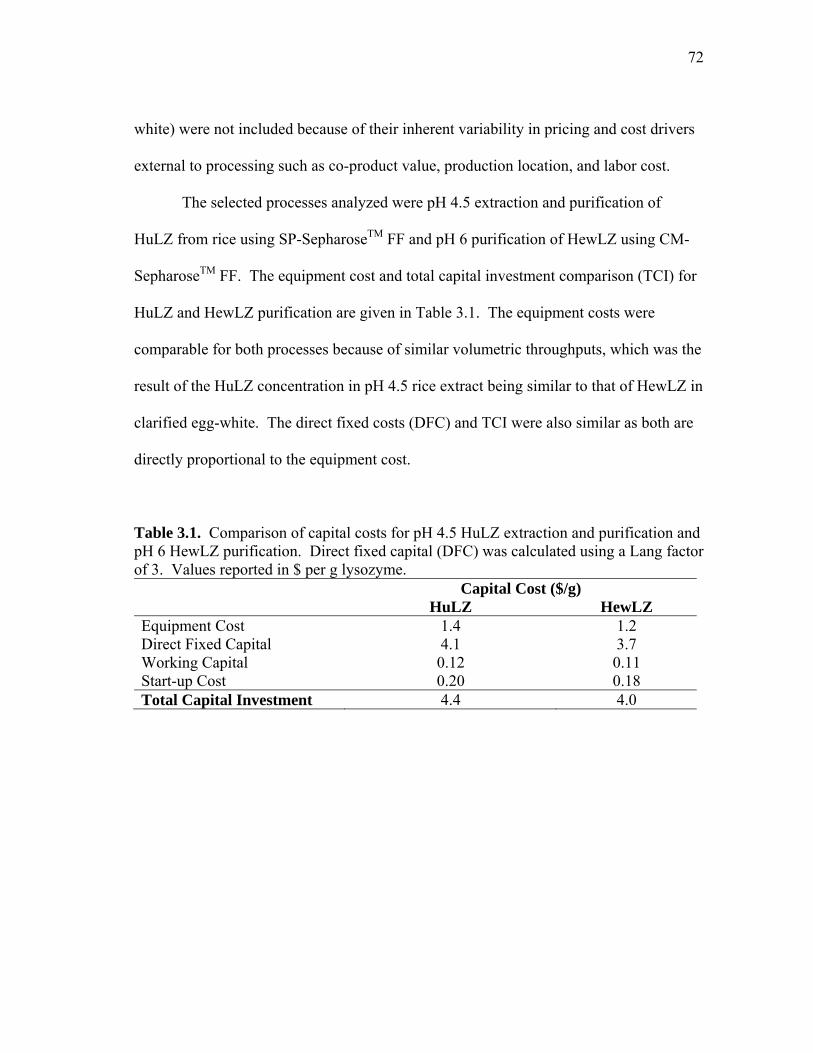
LIST OF TABLES
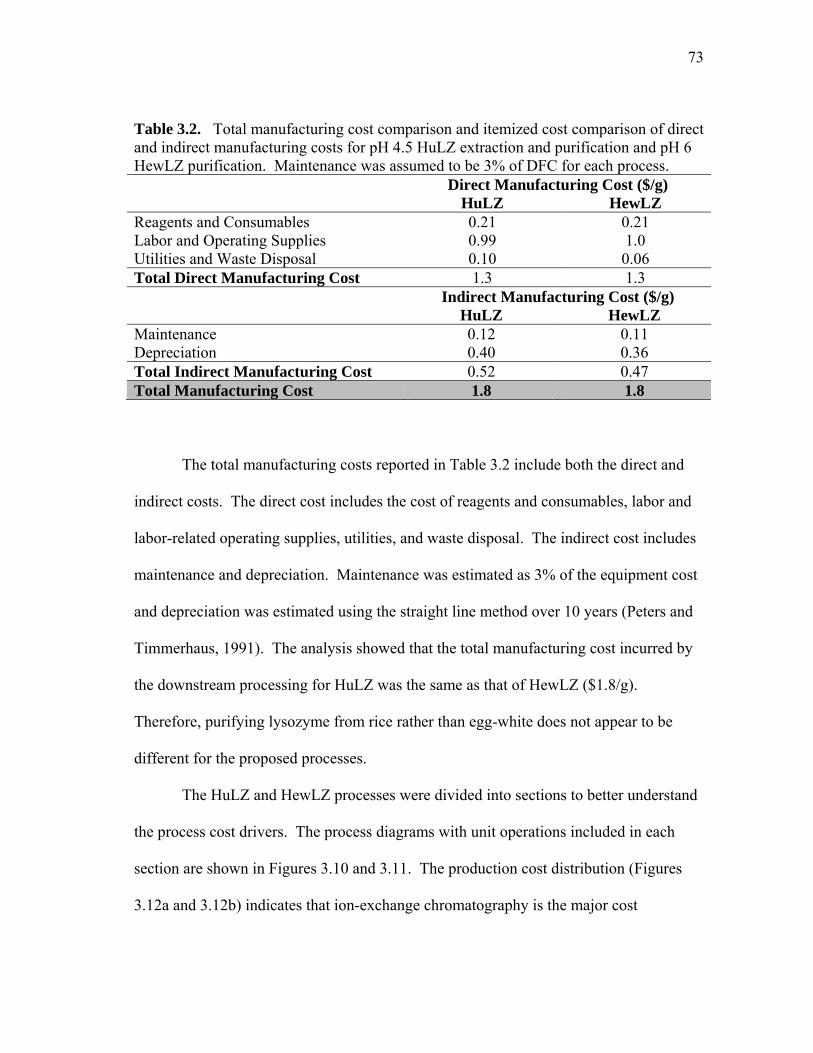
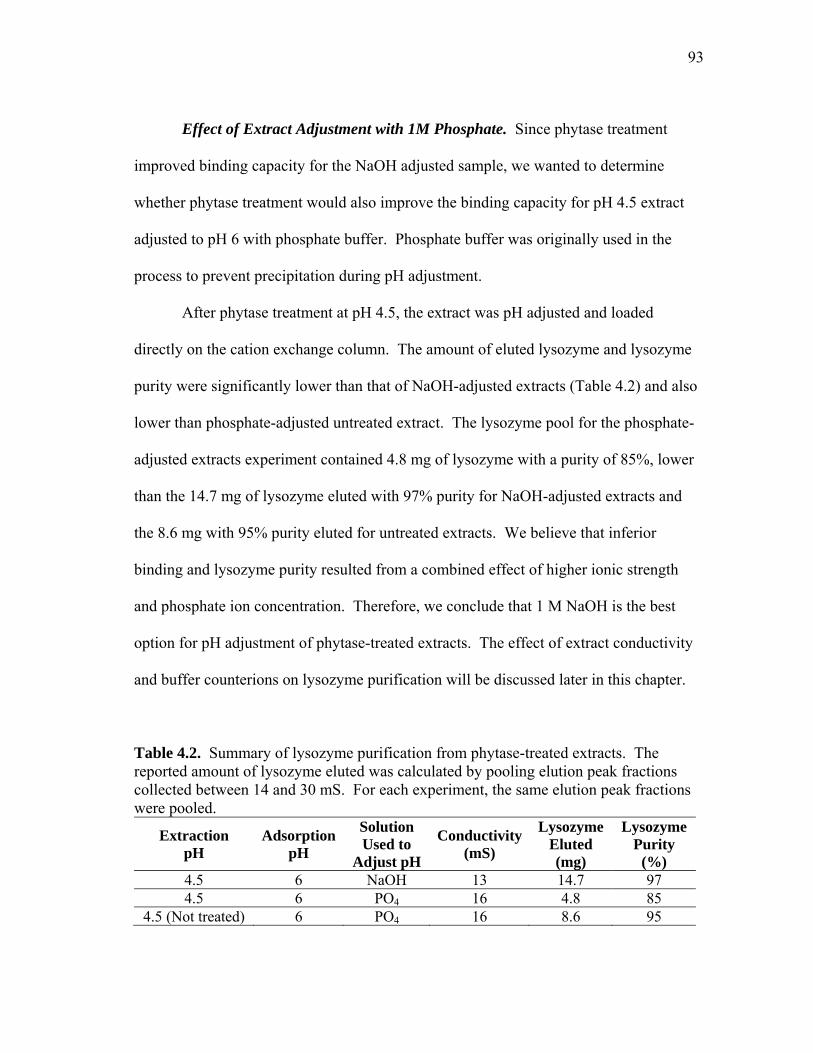
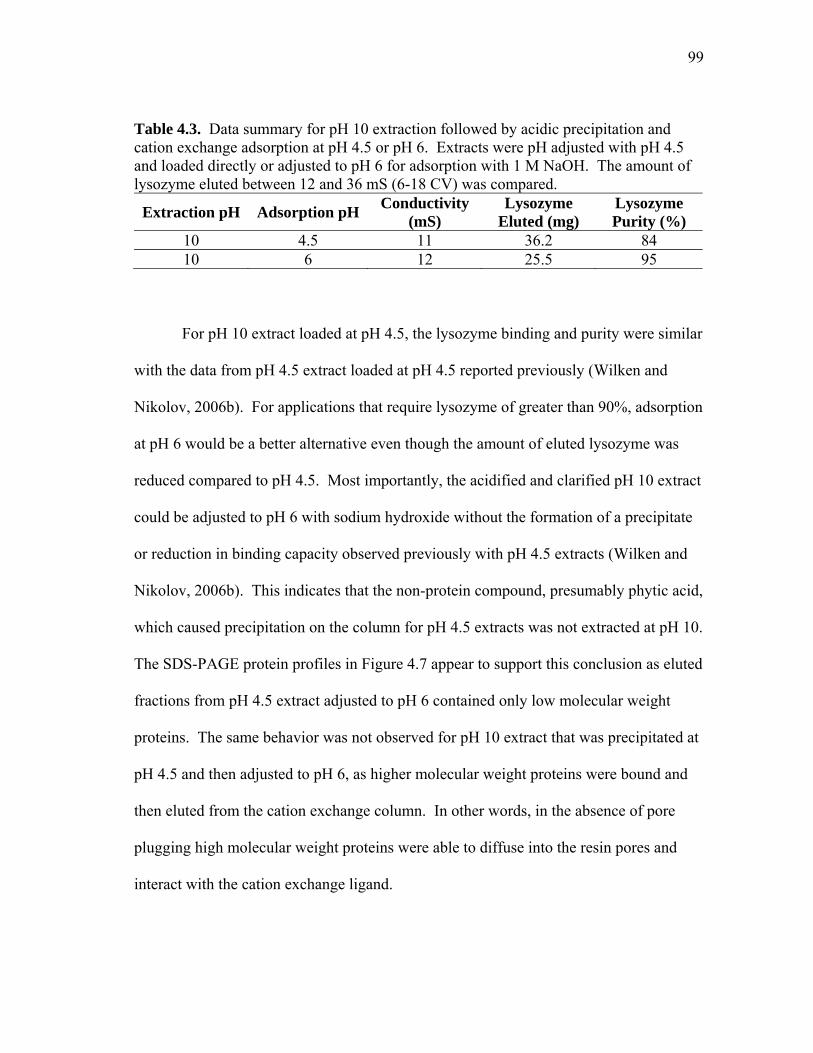
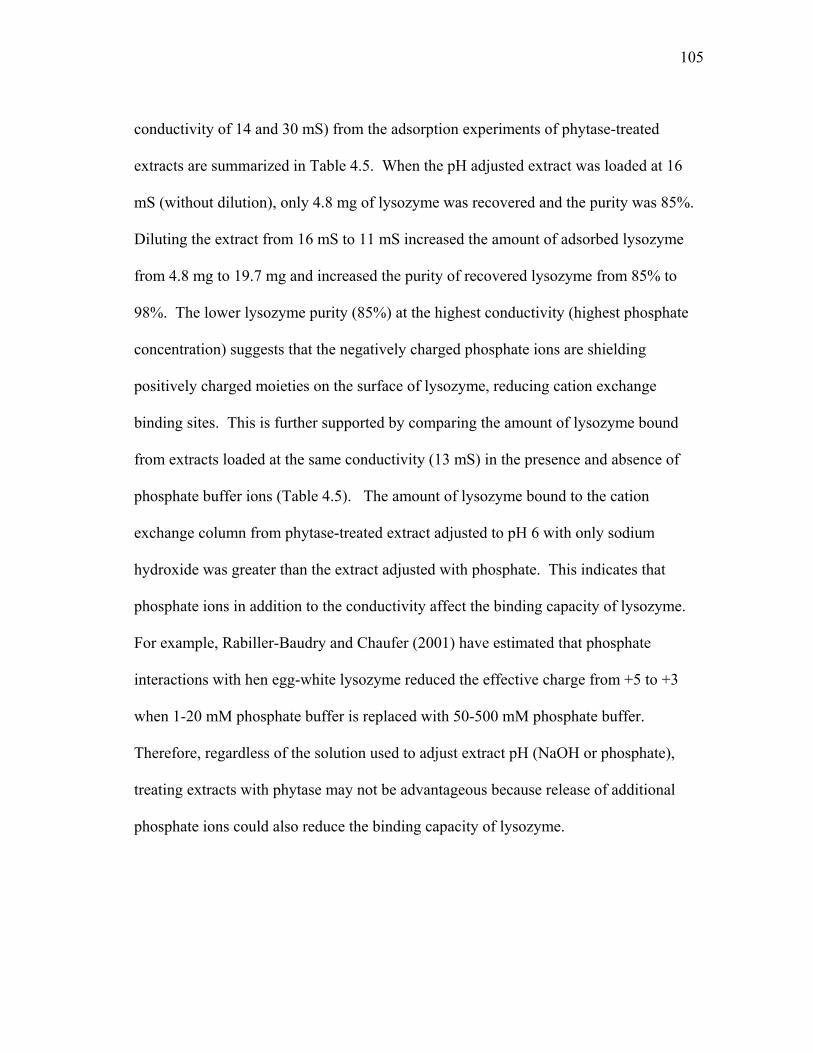
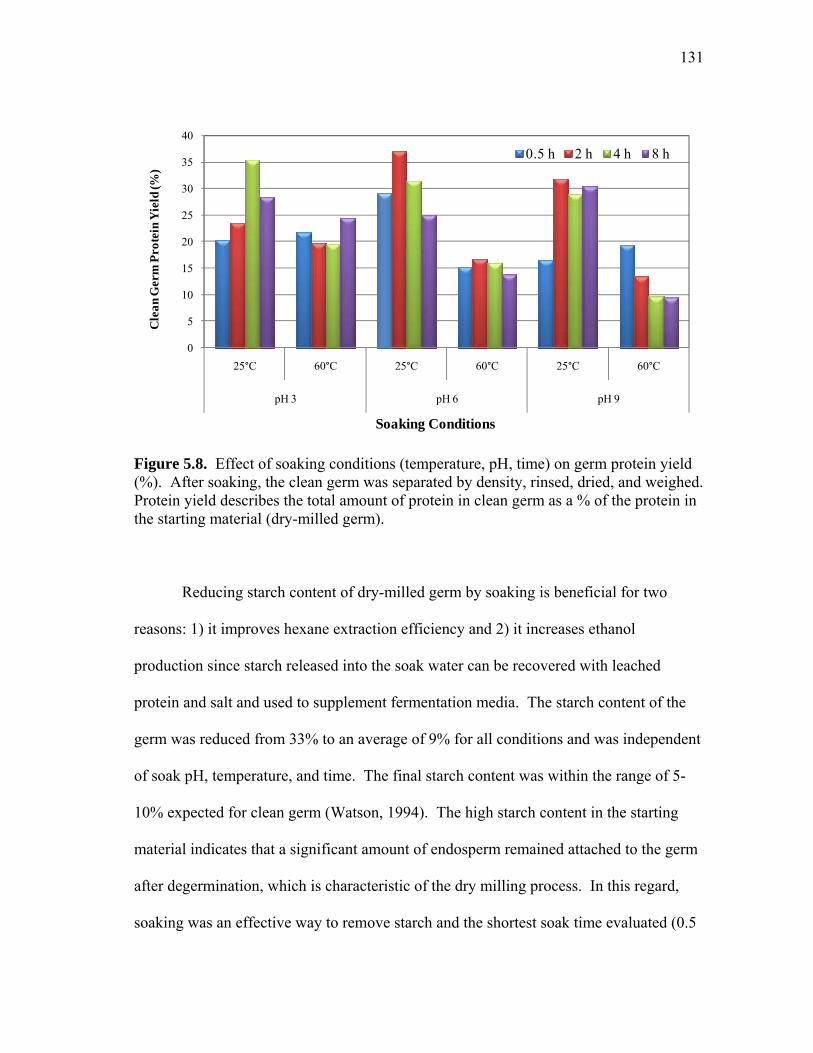
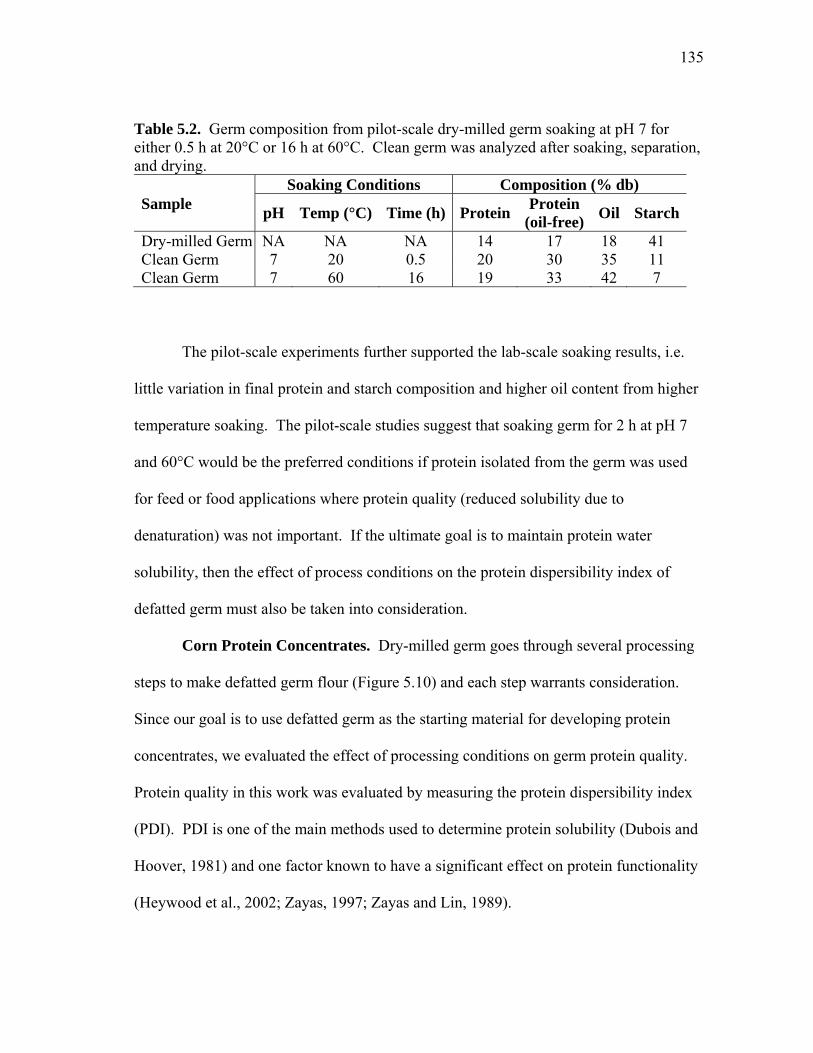
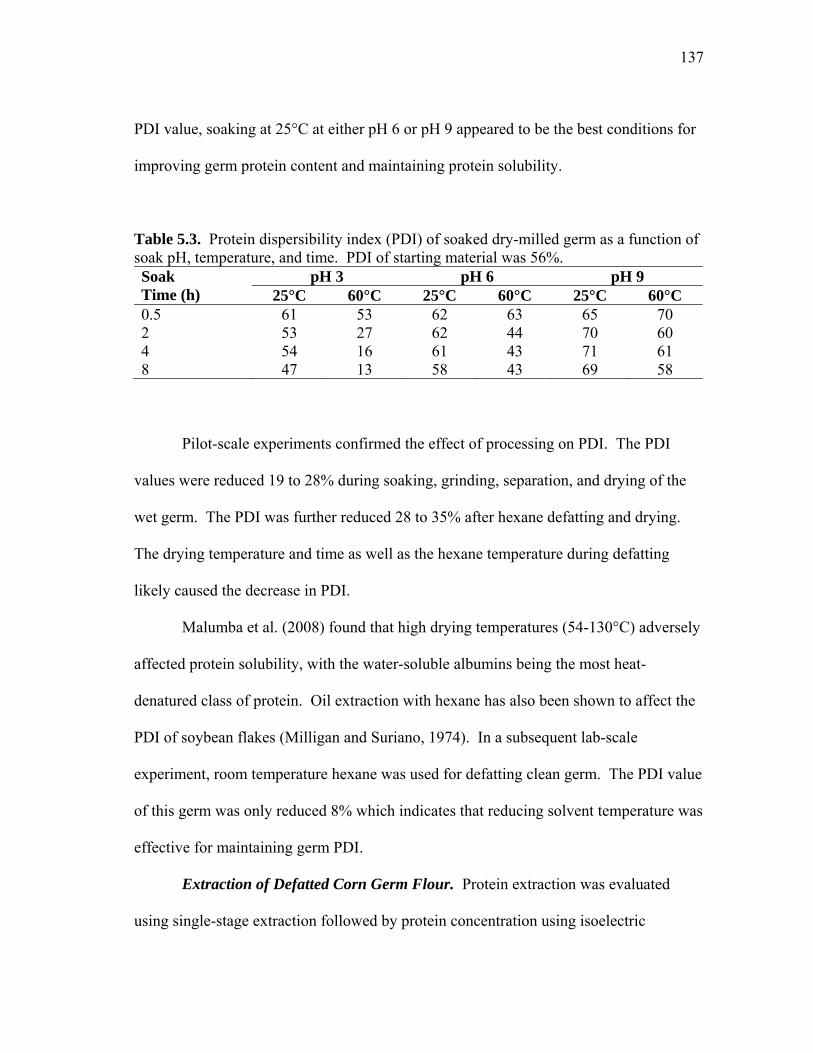
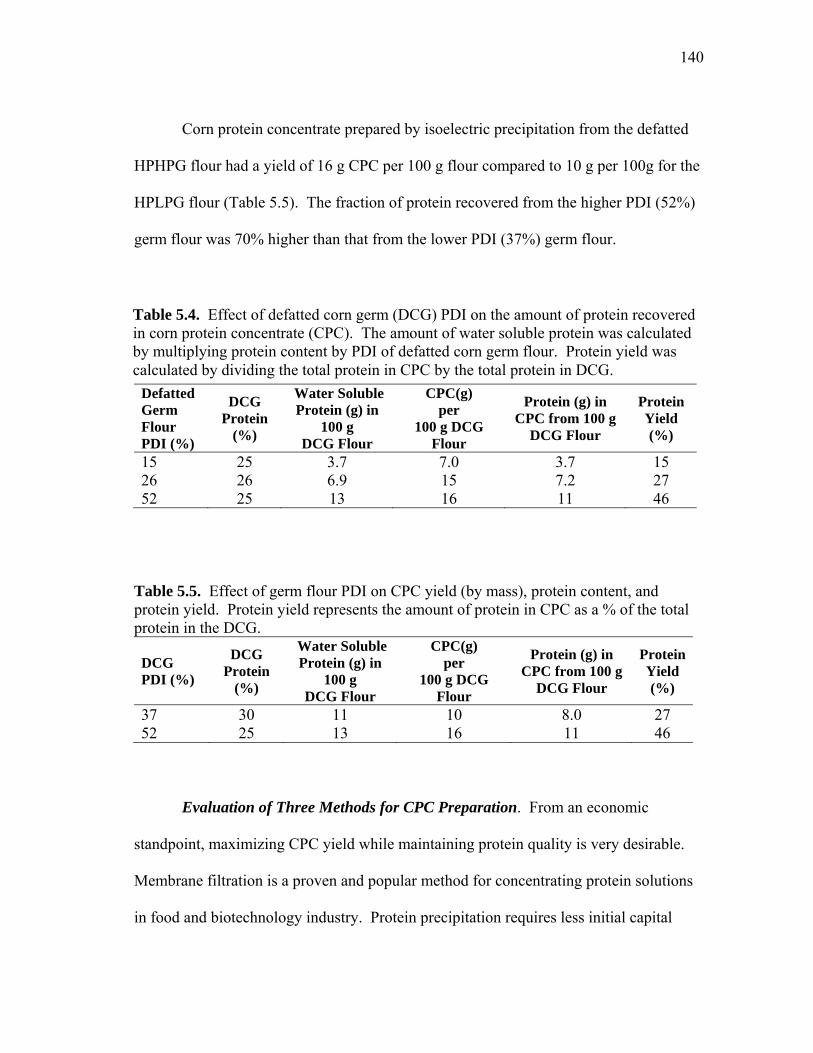
TABLE Page 3.1 Comparion of capital costs for pH 4.5 HuLZ extraction and purification and pH 6 HewLZ purification .................................................................... 72 3.2 Total manufacturing cost comparison and itemized cost comparison of direct and indirect manufacturing costs for pH 4.5 HuLZ extraction and purification and pH 6 HewLZ purification .......................................... 73 4.1 Effect of extraction and adsorption pH on the binding capacity and purity of lysozyme after cation exchange adsorption .......................... 90 4.2 Summary of lysozyme purification from phytase-treated extracts ............ 93 4.3 Data summary for pH 10 extraction followed by acidic precipitation and cation exchange adsorption at pH 4.5 or pH 6 .................................... 99 4.4 Summary of lysozyme purification from extracts adjusted from pH 4.5 to pH 6 for cation exchange adsorption on SP-SepharoseTM FF ................ 103 4.5 Summary of lysozyme purification from phytase-treated extracts (NaOH or phosphate adjusted) as a function of load conductivity ............ 106 5.1 Comparison of the composition of the starting material (dry-milled germ) to the clean germ (soaked at specified conditions, separated, and dried) from pilot-scale experiments ........................................................... 134 5.2 Germ composition from pilot-scale dry-milled germ soaking at pH 7 for either 0.5 h at 20°C or 16 h at 60°C ........................................................... 135 5.3 Protein dispersibility index (PDI) of soaked dry-milled germ as a function of soak pH, temperature, and time ............................................... 137 5.4 Effect of defatted corn germ (DCG) PDI on the amount of protein recovered in corn protein concentrate (CPC) ............................................. 140 5.5 Effect of germ flour PDI on CPC yield (by mass), protein content, and protein yield ................................................................................................ 140
xvi
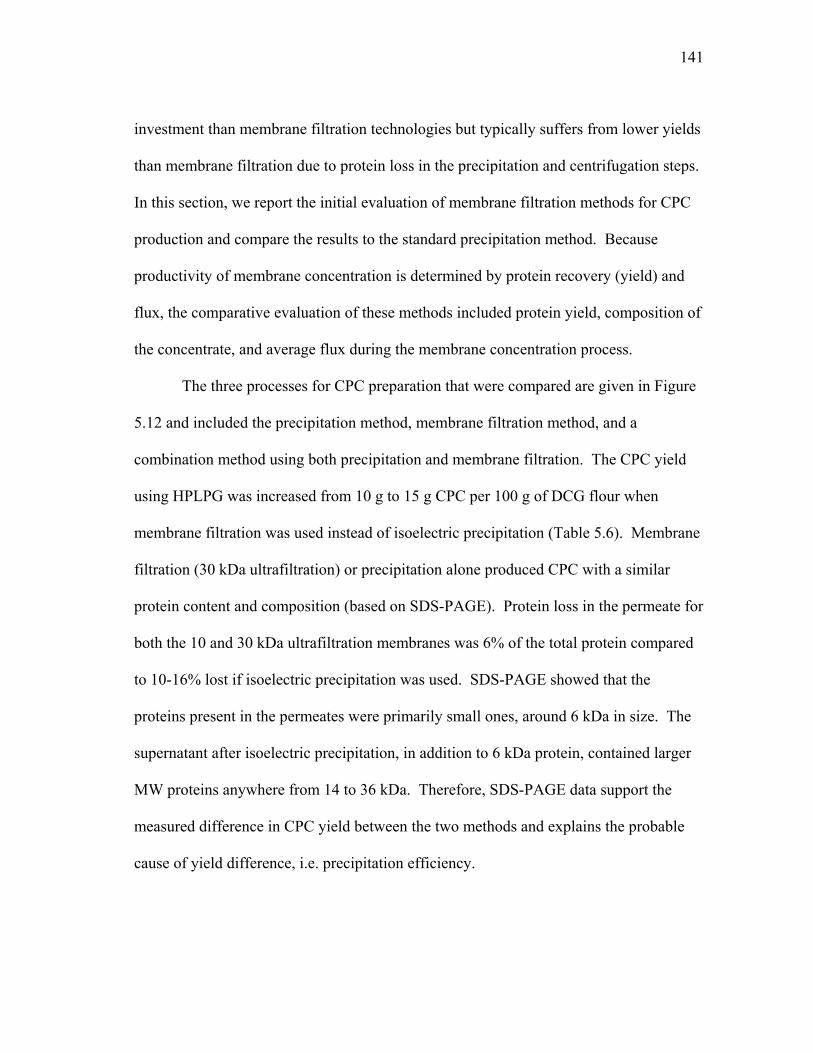
TABLE Page 5.6 Effect of CPC preparation method on protein recovery from defatted germ flour ..................................................................................... 142
1
CHAPTER I
INTRODUCTION
BACKGROUND INTRODUCTION
Plants have been used as a source of natural products throughout history, dating
back thousands of years. Plant-based products have numerous, diverse industrial
applications that continue to expand with the development of new bioprocess and
genetic engineering technologies. One such technology was the development of plant
transformation which led to the use of plant systems for the production of recombinant
proteins for pharmaceutical, nutraceutical, and industrial applications.
A significant amount of effort has been dedicated to various crops, including
rice, as a platform for recombinant protein production. Several recombinant proteins
have successfully been expressed in rice, including human lysozyme, which has recently
reached commercial levels and the field release of transgenic rice seed was approved by
the USDA in 2007. Although InVitria (a rice biotechnology company) is producing
small amounts of human lysozyme as a cell culture reagent, comparative process
analysis of the existing hen egg-white lysozyme product currently on the market has not
been done.
Each plant system presents different processing challenges because each has a
unique composition based on the recombinant protein properties and the host system
____________ This dissertation follows the style of Biotechnology and Bioengineering.
2
dictate extract composition and may need to be optimized to reduce impurities that
interfere with subsequent purification steps. Specific impurities may dictate the
sequence of unit operations and operating conditions for extraction and purification.
Once the critical extract impurities have been identified, the extraction conditions can be
manipulated to minimize their impact on selected recovery and purification steps.
Therefore, further understanding of the rice system components and their interactions
would facilitate process development. The first objective of this dissertation was to
develop a process for the extraction and purification of recombinant human lysozyme
from rice using a single chromatography step and to evaluate rice extract impurities that
may interfere with purification. Cation exchange chromatography was used for
purification based on the highly basic nature of lysozyme and also compared to hen egg-
white lysozyme purification.
The use of plants to produce biofuels also provides new and exciting
opportunities for traditional food crops that have expanded significantly in the past
decade. Ethanol plants are seeking novel fractionation methods for pre-processing due
to increasing pressure to make ethanol from corn, the common feedstock in the United
States, more cost-competitive while also addressing concerns about using a food crop for
fuel.
Corn germ is a non-fermentable corn kernel fraction that is a promising source
of higher value food protein based on its protein composition, amino acid distribution,
and functional properties. To capture the potential value of germ protein, carefully
designed fractionation and extraction processes are required to preserve the protein
3
quality for food applications. The effect of processing conditions on the germ protein
quality has not been addressed and few studies for producing protein-rich concentrates
from corn germ are available. Typical methods used for germ processing may need to
be modified to prevent protein loss and denaturation throughout fractionation, defatting,
grinding, and protein extraction. The second objective of this dissertation was to
determine the effect of processing conditions on germ protein quality and to develop a
process for producing high protein products from dry-milled corn germ.
LITERATURE REVIEW
Plants as Recombinant Protein Production Systems. Since the first successful
transformation of a higher plant in 1983 (Fraley et al., 1983), numerous heterologous
proteins have been produced in a wide variety of plant systems. Seed crops, green-tissue
plants, and aquatic plants have been used for the expression of human
biopharmaceuticals (Giddings et al., 2000), nutraceuticals (Adkins and Lönnerdal,
2004), antibodies (Nikolov et al., 2009; Stöger et al., 2002), industrial enzymes
(Ponstein et al., 1996), and vaccine antigens (Sala et al., 2003). Plants have a low cost of
production and a relatively simple transition to large-scale production by increasing
acreage instead of adding expensive, specialized manufacturing facilities. The cost of
producing recombinant proteins in plants has been estimated to be 2-10% of the cost
using traditional microbial fermentation systems and 0.01% of the cost of using
mammalian cell culture (Hood et al., 2002). Plants are also advantageous because they
are efficient protein producers, free from human pathogens, capable of post-translational
modifications, and many have natural protein storage organelles. Disadvantages include
4
the long development time for transformation, regeneration, and production of
transgenic plants (Twyman, 2004), regulatory uncertainty (Doran, 2000), and recovery
and purification challenges.
Rice as a Host System for Recombinant Proteins. Several recombinant proteins
have been successful expressed in rice seed including α-interferon (Zhu et al., 1994),
human lactoferrin (Nandi et al., 2002), human serum albumin (Huang et al., 2005),
human lysozyme (Huang et al., 2002a), antibodies (Stöger et al., 2000), vaccine antigens
(Nochi et al., 2007; Wu et al., 2007), and allergens (Takaiwa et al., 2007; Yang et al.,
2008a). Recently, the USDA (2007) approved field release of transgenic rice expressing
human lysozyme, lactoferrin, and serum albumin in Kansas and clinical trials using rice-
dervied human lysozyme and lactoferrin in oral rehydration solutions have been
successfully completed (Zavaleta et al., 2007).
As a seed crop, rice offers many advantages over microbial fermentations,
mammalian cell cultures, and transgenic animals as a host system including an extensive
knowledge base regarding its cultivation, harvesting, storage, and processing (Kusnadi et
al., 1997). Rice is also advantageous because seeds allow for long-term storage and
have low concentrations of phenolic compounds which pose problems in downstream
processing of green tissues (Ma et al., 2003; Twyman, 2004). Rice is a self-pollinating
crop so there is a low rate of gene transfer (Huang, 2004). Rice is also generally
regarded as safe (GRAS) and rice-based foods are considered hypoallergenic so products
in rice also have the option of oral delivery without extensive purification (Nandi et al.,
2002; Yang et al., 2008b). The presence of endogenous protease inhibitors should
5
ensure the stability of the recombinant protein throughout extraction and purification
(Menkhaus et al., 2004a). The use of rice as a platform for recombinant protein
production is promising, but high expression levels and efficient downstream processing
are needed.
Recombinant Human Lysozyme Expression in Rice. The highest expression of
recombinant human lysozyme, 0.5-0.9% dry weight, has been achieved in rice (Oryza
sativa) seed (Hennegan et al., 2005; Huang, 2004). The tissue-specific rice storage
protein promoter, glutelin-1, was used to maximize the expression level and to direct
human lysozyme accumulation into the endosperm in type II protein bodies (Hennegan
et al., 2005; Hwang et al., 2002). Recombinant human lysozyme expressed in rice has
identical physical and biological characteristics as the native form (Huang et al., 2006b).
This includes the isoelectric point (pI) , overall charge, N-terminal sequence, specific
activities, and surface structure (Huang et al., 2002b).
Properties of Human Lysozyme. Human lysozyme (EC 3.2.1.17), N-
acetylmuramoyl-hydrolase, found in tears, saliva, nasal secretions, and breast milk,
consists of 130 amino acids with a molecular weight of 15 kDa and isoelectric point (pI)
of 10.2 Lysozyme has the ability to hydrolyze the β-(1-4) linkages between N-
acetylglucosamine and N-acetylmuramic acid of peptidoglycan (Jollès, 1996), giving the
enzyme its antibacterial properties. Human lysozyme also has antiviral, antifungal, and
antiinflammatory properties and numerous potential therapeutic applications to a broad
spectrum of human diseases.
6
The unglycosylated protein is present in human milk at concentrations of 50-400
μg/mL but its use is restricted by the limited supply and risk of viral and microbial
contamination. To increase the supply of human lysozyme, various production systems
have been explored. Human lysozyme has been expressed in mouse milk (Maga et al.,
1995) as well as tobacco (Nakajima et al., 1997). However, recombinant human
lysozyme produced by these systems was not economically viable due to low expression
levels and processing constraints. With the high expression levels of human lysozyme in
rice, there is an opportunity to make lysozyme production viable for a variety of
applications. To a large degree, market penetration for pharmaceutical, nutraceutical,
and food applications hinges on the final product cost of which downstream processing
contributes a significant share.
Downstream Processing of Transgenic Seed Crops. Depending on product
type and application, downstream processing can account for greater than 80% of the
total operating costs (Evangelista et al., 1998) and thus, the full potential of transgenic
crops can only be realized with the development of efficient and selective extraction and
purification processes. As the transgenic plant platform matures, research and
development interest will shift from upstream to downstream processing to improve
overall productivity, which has been the case for more established biotechnology
(Gottschalk, 2008). Thus, the development of efficient downstream processes as early as
possible is essential for favorable economics (Basaran and Rodriguez-Cerezo, 2008).
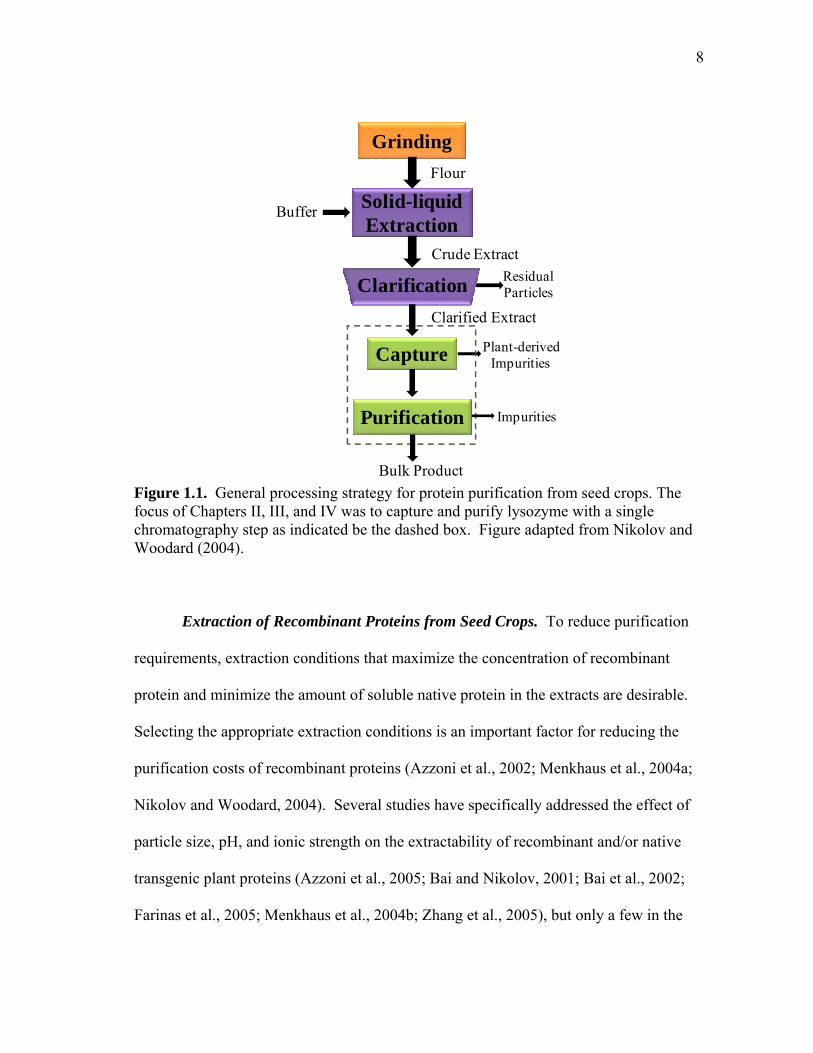
The general downstream processing strategy for seed crops is given in Figure
1.1. Grinding or fractionation is typically the first step for seed processing to reduce the
7
particle size for extraction. The extraction (solid-liquid separation) step uses water or
buffer to extract water soluble components from the flour containing the recombinant
protein. After extraction, the crude extract is clarified by separating the liquid (clarified
extract) from the spent solids. This is typically done using centrifugation and in some
cases includes an additional dead-end filtration step (Nikolov and Woodard, 2004). The
recombinant protein is then purified from the clarified extract by one or more steps
(capture and purification) using methods such as chromatography, membrane filtration,
and precipitation. The capture step is used to concentrate the product and partially
remove extract components and the purification is the final polishing step. In this study,
the goal was to develop a single chromatography step to replace the capture and
purification steps.
The processing of plant extracts is challenging because each transgenic plant
extract is a complex mixture that has unique characteristics based on the extract
composition (ions, proteins, sugars, phenolics) and recombinant protein properties
(charge, size, hydrophobicity). Therefore, further understanding of the plant system
components and their interactions is critical to designing an integrated, optimized
purification process.
8
Residual Particles
Plant-derived Impurities
Impurities
Grinding
Solid-liquid Extraction
Clarification
Capture
Purification
Flour
Crude Extract
Clarified Extract
Buffer
Bulk Product Figure 1.1. General processing strategy for protein purification from seed crops. The focus of Chapters II, III, and IV was to capture and purify lysozyme with a single chromatography step as indicated be the dashed box. Figure adapted from Nikolov and Woodard (2004).
Extraction of Recombinant Proteins from Seed Crops. To reduce purification
requirements, extraction conditions that maximize the concentration of recombinant
protein and minimize the amount of soluble native protein in the extracts are desirable.
Selecting the appropriate extraction conditions is an important factor for reducing the
purification costs of recombinant proteins (Azzoni et al., 2002; Menkhaus et al., 2004a;
Nikolov and Woodard, 2004). Several studies have specifically addressed the effect of
particle size, pH, and ionic strength on the extractability of recombinant and/or native
transgenic plant proteins (Azzoni et al., 2005; Bai and Nikolov, 2001; Bai et al., 2002;
Farinas et al., 2005; Menkhaus et al., 2004b; Zhang et al., 2005), but only a few in the
9
context of process integration, optimization, or cost analysis (Azzoni et al., 2002;
Kusnadi et al., 1998; Menkhaus et al., 2002; Menkhaus et al., 2004b; Nandi et al., 2005).
In general, pH and ionic strength had the greatest effect on protein extractability (Azzoni
et al., 2005; Balasubramaniam et al., 2003; Farinas et al., 2005). Extraction conditions
determine the extract volume and composition and can be optimized to improve the
efficacy of subsequent purification steps.
Capture and Purification by Cation Exchange. Regardless of the selected
platform, host system cell components and product- and process-related contaminates
must be removed to produce a purified product that meets product specifications
(Drossard, 2004). Ion-exchange chromatography is the most widely used purification
method in biotechnology due to its resolving power, versatility, high protein binding
capacity, robustness, reproducibility, and ease of scale-up (Jacob and Frech, 2007). Ion-
exchange is also a common method employed to capture and purify recombinant
proteins from plants (Huang et al., 2002a; Menkhaus et al., 2004a; Nandi et al., 2002;
Woodard et al., 2003). Cation exchange chromatography has been the preferred method
for lysozyme purification and other basic proteins. The strong cation exchange resin,
SP-Sepharose FF, was selected for this study since the sulfopropyl (SP) ligand is fully
charged from pH 4 to 8 and is commercially available and commonly used at a large
scale (Jacob and Frech, 2007).
Adsorption of a protein to a cation exchange resin occurs primarily through
Coulombic (electrostatic) interactions between the negatively charged ligand on the resin
(stationary phase) and positively charged groups on the protein surface. The solution
10
containing the protein of interest is loaded onto packed-bed (column) of cation exchange
resin, the column is washed to remove unbound material, and the bound protein is eluted
with a step gradient or linear gradient of increasing ionic strength. Step gradient is
typically used for capture operations and linear gradient is used for high-resolution
separations. Linear gradient was used in this study since the goal was to achieve highly
pure lysozyme with a single chromatography step.
The two most important resin attributes for preparative linear gradient separation
are resin selectivity and dynamic binding capacity (Jacob and Frech, 2007). Proper
selectivity leads to higher final purity of the product. The binding capacity influences
the operating costs of chromatography because a resin with a higher capacity results in a
(Strube et al., 2007). These two attributes, binding capacity and selectivity, were
considered for lysozyme purification.
Protein molecules are amphoteric so the actual protein charge will depend on pH,
ionic strength, and buffer type (Winzor, 2004). Factors that can contribute to or interfere
with electrostatic interactions between the resin, recombinant protein, or rice impurities
can alter the protein adsorption behavior. Therefore, identifying plant impurities and
understanding their interactions are critical to designing an integrated, optimized
purification process.
Rice Impurites: Proteins and Phytic Acid. Aqueous extracts of transgenic rice
contain rice protein and may also contain a mixture of starch, ash (phosphorus,
potassium, magnesium, chlorine, calcium), fiber, and lipids impurities which must be
11
removed during purification (Juliano, 1980). One of the objectives of this work was to
examine the effect of rice proteins and phytic acid on human lysozyme purification by
cation exchange chromatography so a brief introduction to each of these components is
provided.
Rice Proteins. The properties of rice proteins should be considered when
selecting extraction conditions and purification processes. The processing conditions
have to be selected based on the type and quantity of native proteins present in rice and
properties such as pI and molecular weight.
The protein content of brown rice is generally 8%, composed of about 80%
glutelin, 10% globulin, 5% albumin, and 5% prolamin. The primary protein groups that
would potentially be extracted using typical aqueous buffers would be the water-soluble
albumin and salt-soluble globulin. The major albumin fraction is a 60 kDa monomer
with an isoelectric point (pI) of 6.5 (Mawal et al., 1987). The reported pIs of globulin
range from pH 5 to 7 (Ellepola and Ma, 2006). Rice proteins are reportedly similar to
corn proteins based on pI and molecular weights, implying that purification studies for
corn may also be applicable to rice (Menkhaus et al., 2004a).
Phytic Acid. Phytic acid is the primary storage form of phosphate found in all
eurokaryotic cells, particularly cereal grains and legumes. Phytic acid is the phosphoric
ester of inositol (hexahydroxycyclohexane) with 12 ionizable protons with pKa values
from 1 to 12 (Turner et al., 2002). Nine dissociation sites are acidic making phytic acid
negatively charged when the pH is above 1 (Costello et al., 1976).
12
Brown rice contains between 0.84-0.99% phytic acid in the form of potassium,
magnesium, and calcium phytate salts that are concentrated in the germ and aluerone
layer (Reddy, 2002). The binding of magnesium and calcium to phytic acid and
solubility of phytate salts is highly dependent on pH, ionic strength, and the molar ratio
of the cation to phytic acid (Crea et al., 2008; Crea et al., 2006) so the behavior of phytic
acid in a complex extract is difficult to predict and will depend on the selected extraction
conditions.
Phytic acid can also form binary and tertiary complexes with proteins in the
extract. The type of complex and extent of interaction depends on pH, cation
concentration and charge, and protein properties (Cheryan, 1980). Generally, binary
complexes are formed at acidic pH and ternary complexes at neutral pH (Selle et al.,
2000). Basic proteins like human lysozyme could form binary complexes over a wide
pH range. Previous studies noted the formation of phytic acid and lysozyme complexes
between pH 6 and 9.5 (Okafo et al., 1994; Okafo et al., 1995; Rodriguez and Li, 1999).
Protein-phytic acid interactions have been shown to interfere with protein extraction
(Hussain and Bushuk, 1992) by shifting the isoelectric point and the solubility profile of
proteins (Wolf and Sathe, 1998).
Processing of Corn for Food, Feed, and Ethanol. Although corn processing
methods like wet milling, dry milling, and dry grinding have been well established, the
conversion from petroleum based fuels to corn-based biofuels resulted in the need for
expanding plant processing expertise. Novel processing strategies are needed to
maintain a competitive processing cost for ethanol by producing higher value co-
13
products. Recently proposed strategies include removal of non-fermentable seed parts
(germ and fiber) to increase fermentation efficiency (Ponnampalam et al., 2004; Wahjudi
et al., 2000) and the development of higher value co-products from fiber and germ.
Germ wet milling is one new processing strategy developed to produce protein products
from dry-milled germ, a co-product from ethanol plants (Lohrmann et al., 2008). This
strategy uses fundamental concepts of both dry milling and wet milling so an overview
of each process is provided.
Corn Wet Milling. Corn ethanol facilities using wet mills are capital-intensive
and operated primarily by large agri-business companies (Erickson and Carr, 2009).
Although this was the traditional fractionation method, only one new wet mill ethanol
facility has been constructed since 1997 (Erickson and Carr, 2009). As shown in Figure
1.2, wet milling was designed to fractionate corn into individual components (oil, fiber,
protein, and starch) using chemical and physical methods. The key for this highly
effective separation method is the steeping conditions. Corn wet milling provides good
fractionation of germ as measured by yield and oil content but usually at the expense of
protein quality. The corn kernels are soaked with sulfur dioxide (a reducing agent) at a
high temperature (45-50°C) and low pH for 24-36 h to increase starch and protein
separation efficiency. These conditions cause proteolysis and protein aggregation (Parris
et al., 2006) and a significant amount of albumin, globulin, and some glutelin proteins
are lost in soluble fractions (Wilson, 1994).
14
Corn Steeping
Grinding/Separations
StarchProteinGerm Fiber
Oil Feed EthanolCorn Gluten Meal (Feed)
Figure 1.2. Overview of corn wet milling, a technique that uses mechanical and chemical methods to separate corn giving germ and starch as the main products.
such as germ, pericarp, and endosperm using mechanical and physical methods (Figure
1.3). In corn dry milling, the kernels are tempered to increase moisture content to 20-
25% and then degerminated. Corn is tempered at room temperature for 2 h or less and
thus, preserves important germ protein properties. Dry milling yields relatively low
purity germ (≤ 23% oil and 15% protein) with significant residual endosperm starch
attached to the germ. The market for dry milled germ has been limited to corn grits,
meal, and flour applications to brewing and cereal food (Duensing et al., 2003).
In the past, the dry milling industry was much smaller than the wet milling
industry (Wright, 1994) but corn-to-ethanol plants are transitioning to dry milling
processing as a pre-processing method for ethanol production to make corn a more cost
15
effective feedstock. This transition will significantly expand the dry milled germ supply.
There is an opportunity to further increase the germ co-product value by producing
higher protein products for food applications.
EndospermGerm(low purity)
Grinding/Separations
Pericarp
Feed FeedEthanol
Corn Tempering
Figure 1.3. Overview of corn dry milling, a technique that uses mechanical and physical methods to separate corn into three main fractions. The section circled is the focus of Chapter V, improving dry milled germ quality and protein recovery.
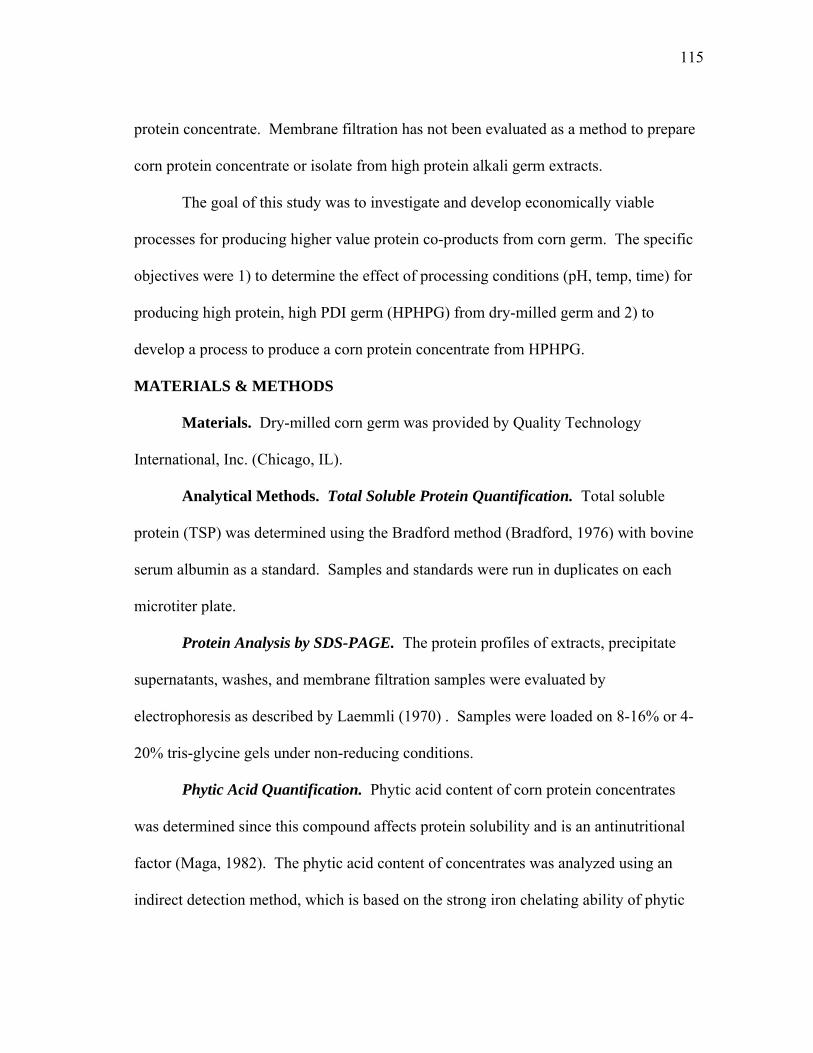
Germ Wet Milling. Germ wet milling was recently developed to address the
processing limitations, starch and oil loss, for producing cost effective protein co-
products from dry-milled corn (Lohrmann et al., 2008). The method given in Figure 1.4
consists of three steps: soaking, grinding, and separation to produce clean germ with
enhanced protein content and reduced starch content (Lohrmann et al., 2008). The
purpose of the soaking step is primarily to remove the attached endosperm from dry-
16
milled germ. After soaking, the water with starch can then be used for ethanol
fermentation. The soaked germ is then processed by grinding to remove attached
endosperm solids. The clean germ having higher protein and oil content and reduced
starch content than dry-milled germ is then recovered by density separation. The clean
germ is recovered as the light fraction and the endosperm solids as the heavy fraction.
Determining the effect of soaking conditions such as time, temperature, and pH on germ
composition is an important consideration since the germ will be used to prepare corn
protein concentrate.
Protein Concentrates. Currently, soy protein concentrates and isolates
dominate the food market so literature discussing extraction and purification of germ
protein is limited. Conventional methods for extraction of corn protein for food
applications include alcohol and/or alkali extraction. Protein precipitation by pH
adjustment or addition of alcohol has been used to recover and concentrate proteins from
extracts. Membrane filtration has been implemented instead of protein precipitation,
primarily for soy protein enrichment (Muralidhara et al., 2003; Thomas et al., 2001) but
also for protein recovery from whole corn extracts (Kampen, 1995; Lawhorn, 1986).
Rao et al. (2002) showed that the composition, protein structure, and functionality of
membrane concentrated soy protein differed from precipitated protein concentrate.
Membrane filtration has not been considered before as a method to prepare corn protein
concentrate or isolate from high protein alkali germ extracts.
17
Clean Germ
Endosperm Solids
Process Water
1: Soaking
Soak Water
Dry milled germ and water
2: Grinding
3: Separation
Figure 1.4 Overview of germ wet milling. The method consists of 3 steps: soaking, grinding, and separation to produce clean germ. The objective is to produce germ with a higher protein and oil content and lower starch content than dry milled germ.
18
OBJECTIVES
Process Analysis of Human Lysozyme Purification from Transgenic Rice.
To take advantage of the high-expressing human lysozyme source and to make lysozyme
production viable for a variety of applications, several objectives for downstream
processing were addressed as listed below:
1. To determine the effect of pH and ionic strength on human lysozyme
extraction and cation exchange adsorption.
2. To study the effect of rice extract impurities (e.g. proteins and phytic acid) on
the cation exchange adsorption of human lysozyme.
3. To compare the adsorption of purified human lysozyme to hen egg-white
lysozyme and the competitive binding of host proteins (rice or egg-white).
4. To compare the downstream processing costs for the proposed human
lysozyme and hen egg-white lysozyme purification methods.
5. To identify rice impurities that interfere with purification, based on lysozyme
binding capacity and purity, and propose and evaluate alternative processing
trains that minimize interference.
Development of Protein Products from Dry-Milled Corn Germ. To produce
higher value protein products (high-protein germ and corn protein concentrate) from dry
milled corn germ, the following specific objectives were addressed:
1. To quantify the amount of protein and phytic acid leached during soaking of
dry milled corn germ based on soak time, temperature, and pH.
19
2. To determine the effect of the soaking conditions (pH, temperature, time) on
the composition of clean corn germ (soaked and separated dry milled germ).
3. To compare lab-scale and pilot-scale germ soaking studies.
4. To evaluate the effect of processing conditions on the protein dispersibility
index of corn germ.
5. To develop a method to produce corn protein concentrate from clean germ.
DISSERTATION ORGANIZATION
This dissertation is composed of six chapters and covers two separate processing
projects: 1) Process analysis of human lysozyme purification from transgenic rice and 2)
Development of protein products from dry-milled corn germ. Chapter I provides a
general overview of the use of plants for recovery of protein products, including the use
transgenic rice as a platform for recombinant human lysozyme production and a brief
introduction to corn processing.
Chapters II-V are written in journal article format (Biotechnology and
Bioengineering) and report the experimental work for both projects. The objectives for
the first study, process analysis of human lysozyme purification, are addressed in
Chapters II-IV. The first paper (Chapter II) examines the factors influencing the
extraction and cation exchange adsorption of human lysozyme. The effect of pH and
ionic strength on lysozyme and total soluble protein extraction were investigated to
identify conditions that would potentially reduce the purification burden in the
subsequent adsorption step. The saturation binding capacity of human lysozyme was
evaluated as a function of pH and ionic strength to determine whether the optimal
20
extraction conditions would be compatible with cation exchange adsorption. The
second paper (Chapter III) expands the adsorption studies to include hen egg-white
lysozyme and egg-white as a benchmark to assess human lysozyme purification
efficiency from rice extract. The third paper (Chapter IV) studies the interference of
rice extract (as measured by binding capacity and lysozyme purity) on human lysozyme
purification and the methods evaluated to identify the interfering component.
Alternative purification schemes were proposed and tested to alleviate the interference.
The fourth paper (Chapter V) presents the experimental work for the second
study, which was the development of protein products (high protein germ and corn
protein concentrate) from dry-milled corn germ. The effects of processing conditions
(pH, temperature, time, and process-scale) on corn germ quality were addressed and a
method was developed to produce corn protein concentrate.
The general conclusions are given in Chapter VI along with future research needs
for both projects.
21
CHAPTER II
FACTORS INFLUENCING RECOMBINANT HUMAN LYSOZYME
EXTRACTION AND CATION EXCHANGE ADSORPTION*
OVERVIEW
Human lysozyme has numerous potential therapeutic applications to a broad
spectrum of human diseases. This glycosidic enzyme is present in tears, saliva, nasal
secretions, and milk - sources not amendable for commercial development. Recently
however, a high expression level of recombinant human lysozyme (0.5% dry weight)
was achieved in transgenic rice seed. This paper evaluates the effects of pH and ionic
strength on rice protein and lysozyme extractability, as well as their interactions with the
strong cation exchange resin, SP-SepharoseTM FF. The extraction conditions that
maximized lysozyme yield and the ratio of extracted human lysozyme to native rice
protein were not optimal for lysozyme adsorption. The conditions that gave the highest
extracted lysozyme-to-native protein ratio were pH 4.5 and 100 mM NaCl in 50 mM
sodium acetate buffer. At pH 4.5, salt concentrations above 100 mM NaCl reduced the
lysozyme to protein ratio. The best conditions for lysozyme adsorption were pH 4.5 and
50 mM sodium acetate buffer. Lysozyme extraction and subsequent adsorption at pH
4.5 and 50 mM NaCl was an acceptable compromise between lysozyme extractability,
adsorption, and purity. The primary recovery of human lysozyme from pH 6 extracts,
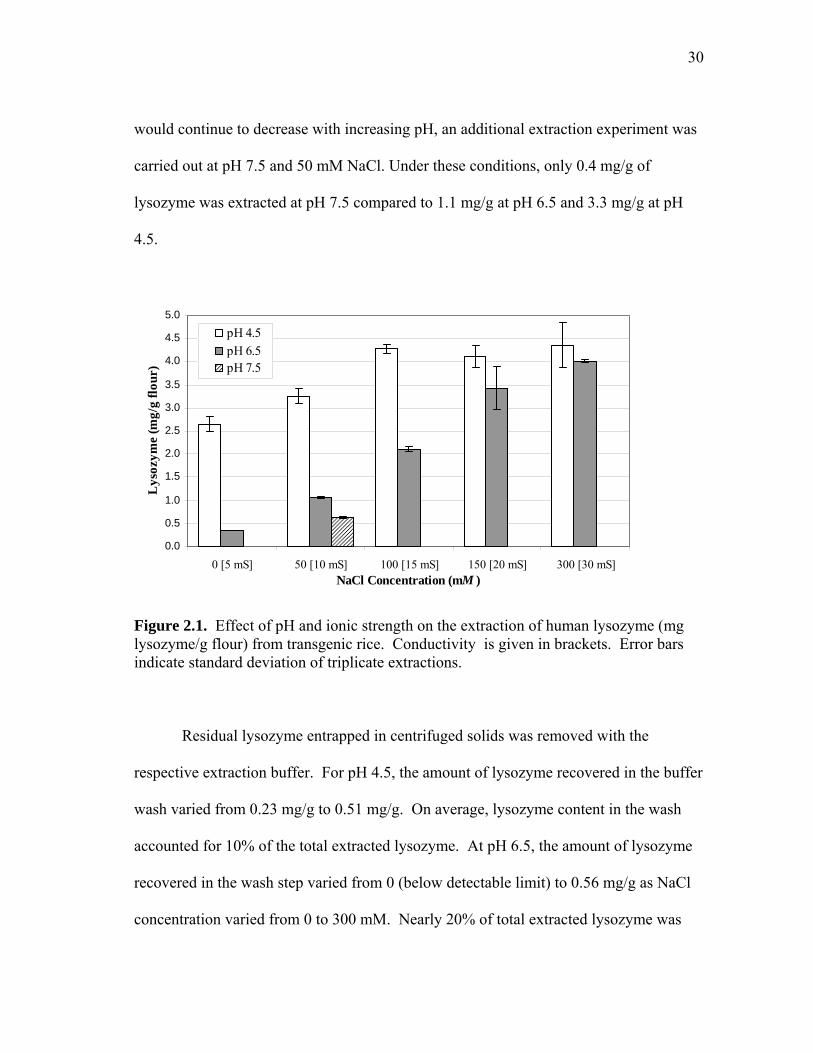
Figure 2.1. Effect of pH and ionic strength on the extraction of human lysozyme (mg lysozyme/g flour) from transgenic rice. Conductivity is given in brackets. Error bars indicate standard deviation of triplicate extractions.
Residual lysozyme entrapped in centrifuged solids was removed with the
respective extraction buffer. For pH 4.5, the amount of lysozyme recovered in the buffer
wash varied from 0.23 mg/g to 0.51 mg/g. On average, lysozyme content in the wash
accounted for 10% of the total extracted lysozyme. At pH 6.5, the amount of lysozyme
recovered in the wash step varied from 0 (below detectable limit) to 0.56 mg/g as NaCl
concentration varied from 0 to 300 mM. Nearly 20% of total extracted lysozyme was
31
recovered from the centrifuged solids for the pH 6.5 extracts containing 50-300 mM
NaCl.
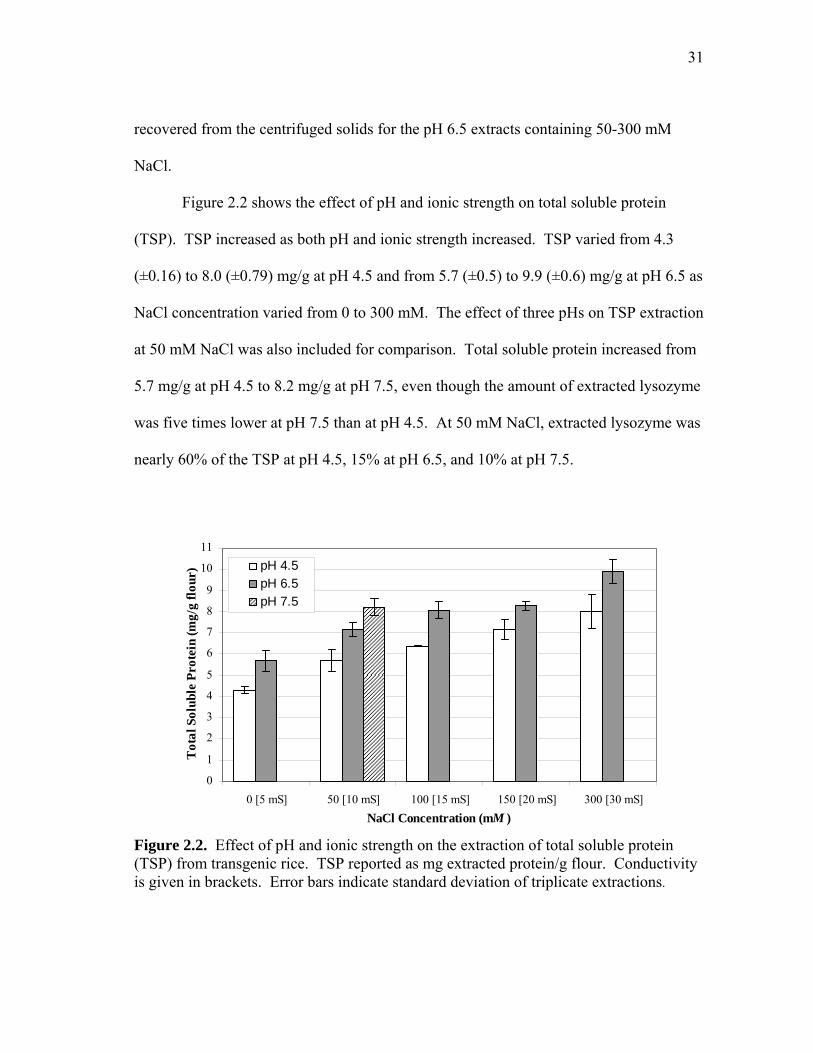
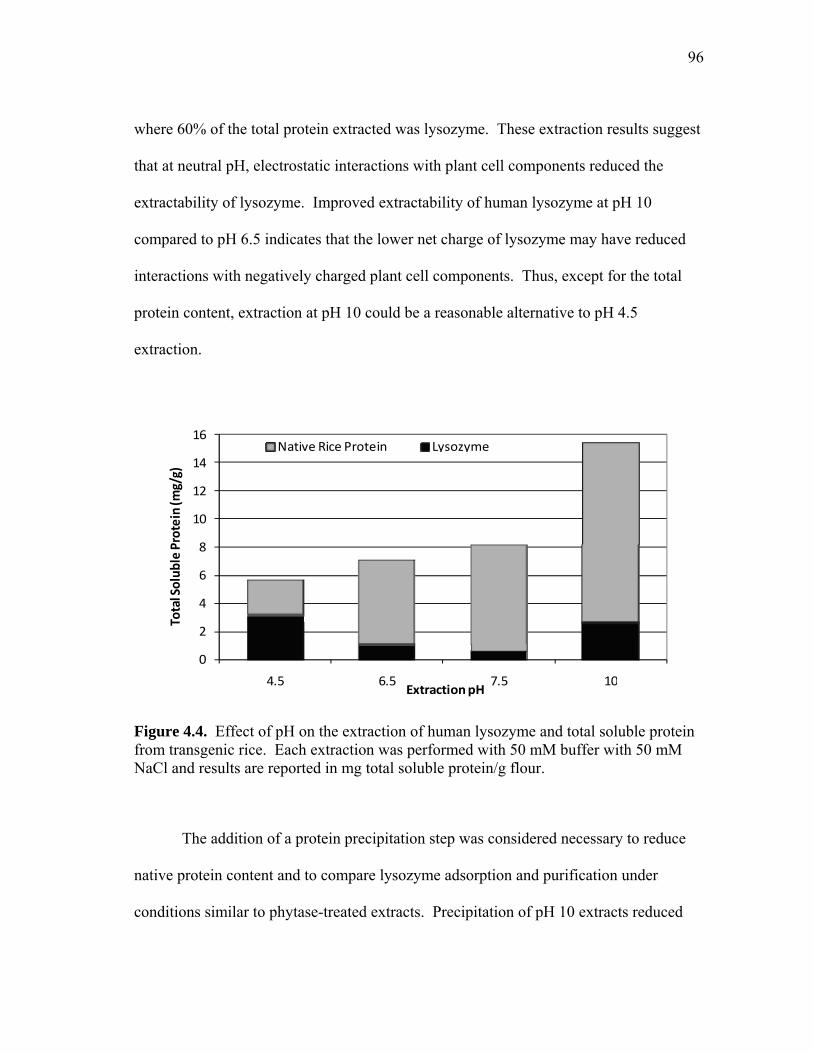
Figure 2.2 shows the effect of pH and ionic strength on total soluble protein
(TSP). TSP increased as both pH and ionic strength increased. TSP varied from 4.3
(±0.16) to 8.0 (±0.79) mg/g at pH 4.5 and from 5.7 (±0.5) to 9.9 (±0.6) mg/g at pH 6.5 as
NaCl concentration varied from 0 to 300 mM. The effect of three pHs on TSP extraction
at 50 mM NaCl was also included for comparison. Total soluble protein increased from
5.7 mg/g at pH 4.5 to 8.2 mg/g at pH 7.5, even though the amount of extracted lysozyme
was five times lower at pH 7.5 than at pH 4.5. At 50 mM NaCl, extracted lysozyme was
nearly 60% of the TSP at pH 4.5, 15% at pH 6.5, and 10% at pH 7.5.
Figure 2.2. Effect of pH and ionic strength on the extraction of total soluble protein (TSP) from transgenic rice. TSP reported as mg extracted protein/g flour. Conductivity is given in brackets. Error bars indicate standard deviation of triplicate extractions.
32
Since lysozyme was a substantial fraction of TSP that varied broadly with
extraction conditions, soluble rice protein content in transgenic extracts was calculated
by subtracting lysozyme concentration from TSP (Figure 2.3). The extracted soluble
rice protein at pH 4.5 varied from 1.6 to 3.6 mg/g and was significantly lower than that
at pH 6.5, which ranged from 5.3 to 6.1 mg/g (Figure 2.3). The largest difference in
soluble rice protein between pH 4.5 and 6.5 was measured at the lowest ionic strength
(3.3-fold) and smallest at 300 mM NaCl (1.6-fold). The same trend in the solubilization
of rice proteins with NaCl concentration was observed with control (nontransgenic) flour
(Figure 2.3). Interestingly, the concentration of soluble rice protein was greater in the
control extracts than in the transgenic extracts for all ionic strengths at both pHs.
Soluble rice protein was 6% to 42% lower in transgenic rice extracts than control rice
extracts. The largest difference (mg/g basis) between the two rice flours was measured
at pH 6.5 and 300 mM NaCl, where the amount of extracted rice protein was 8.3 mg/g
for the control flour and 5.9 mg/g for transgenic flour. This experimental observation of
substantially lower amounts of extracted rice protein from transgenic flour than control
flour supports the reported reduction of salt-soluble globulins in high-lysozyme-
Figure 2.3. Comparison of soluble rice protein in control extracts (C) and transgenic extracts (T) as a function of ionic strength and pH. For transgenic flour extract, lysozyme was subtracted from total soluble protein extracted to determine the amount of rice protein extracted. Soluble rice protein reported as mg extracted rice protein/g flour. Conductivity is given in brackets.
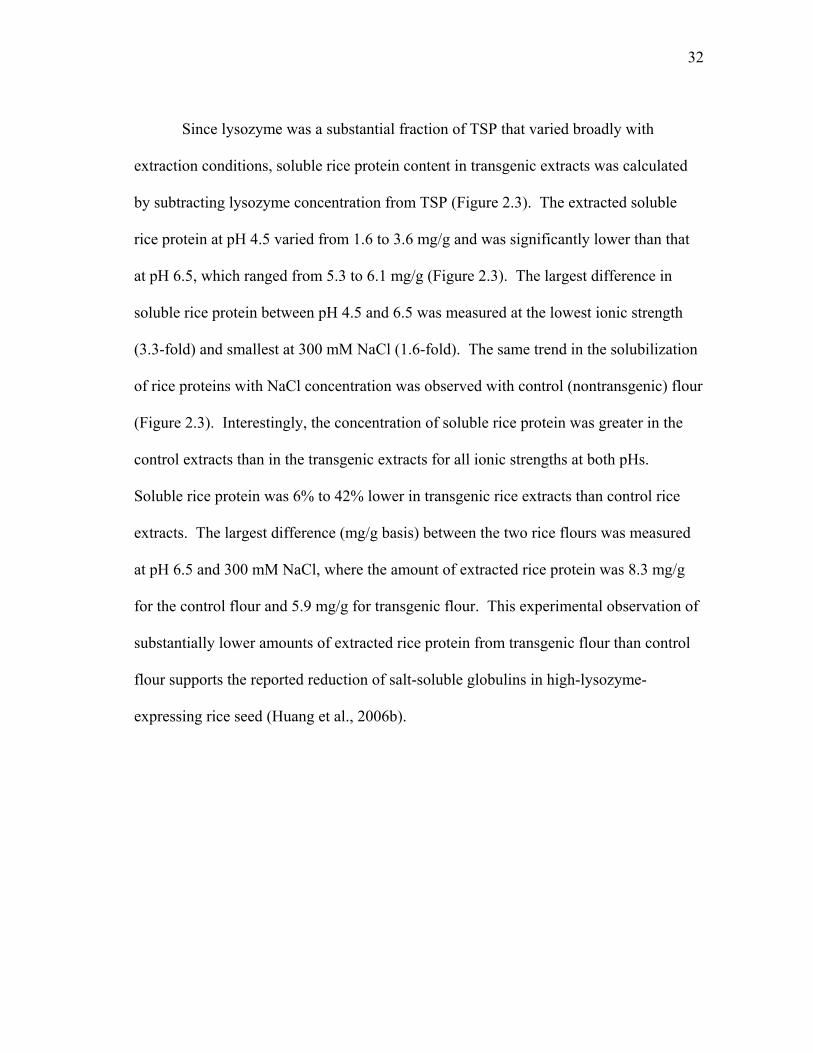
To reduce purification requirements, extraction conditions that maximize
lysozyme concentration and minimize the amount of soluble rice protein in the extracts
were identified by plotting the ratio of extracted lysozyme to solubilized rice protein
(Figure 2.4). This ratio provides a better measure of optimal extraction conditions for
high-expressing plants because it is based upon extracted rice protein instead of TSP,
Figure 2.4. Effect of pH and ionic strength on protein composition of extracts. Protein composition expressed as ratio of lysozyme to native rice protein in extract. Conductivity is given in brackets.
As Figure 2.4 shows, this ratio indicates that pH 4.5 was more favorable
lwilknethan pH 6.5 and 7.5 for all ionic strengths investigated. The extraction
conditions that gave the most favorable protein composition were at pH 4.5 with 100
mM NaCl (15 mS) followed by 0 mM NaCl (5 mS). However, the latter condition was
significantly inferior to 100 mM NaCl because the extracted lysozyme drops from 4.5
mg/g to 2.6 mg/g (Figure 2.1). The consistently lower rice protein concentration at pH
4.5 compared with those at 6.5 and 7.5 indicates that the majority of extractable rice
proteins are in the acidic pI range. The need to add sodium hydroxide to maintain pH
during the pH 6.5 and 7.5 extraction experiments supports this conclusion. The
properties of rice proteins given in the Rice Proteome Database
(http://gene64.dna.affrc.go.jp/RPD/main_en.html) further support this observation. The
35
reduced extractability of lysozyme at pH 6.5 and 7.5 (Figure 2.1) was unexpected since
lysozyme is highly water-soluble and positively charged (pI~10) in this pH range. The
negative pH effect on lysozyme extractability from pH 4.5 to 7.5 could be a consequence
of ionic interactions between acidic proteins and negatively charged phytic acid with
positively charged human lysozyme. The difference in lysozyme content between pH
4.5 and 6.5 extracts decreased as ionic strength increased (Figure 2.1), which also
supports this ionic interaction hypothesis.
Effect of pH and Ionic Strength on Dynamic Saturation Binding Capacity
(SBC) of Human Lysozyme. To assess the effect of extract pH and ionic strength on
the adsorption of lysozyme to a cation exchange resin, the SBC of purified lysozyme as
a function of pH and salt concentration was measured. For this investigation, pH 6
solutions were used instead of pH 6.5 because preliminary adsorption data with purified
human lysozyme indicated a stronger than expected negative pH effect on the SBC.
The saturation capacities of human lysozyme on SP-SepharoseTM FF are shown
in Figure 2.5. The SBC of human lysozyme decreased proportionally as the pH and
conductivity increased. At pH 4.5, the saturation capacity increased from 25 to 77
mg/mL resin as the conductivity decreased from 20 to 5 mS. Similarly, the capacity at
pH 6 varied from 6 to 63 mg/mL. The effect of pH on the SBC was more pronounced at
the higher sodium chloride concentrations. The saturation capacities at pH 4.5 and 6
differed by only 20% at the lowest ionic strength (5 mS), but the difference increased to
80% at the highest ionic strength (20 mS). The saturation capacities at pH 4.5, 6, and
36
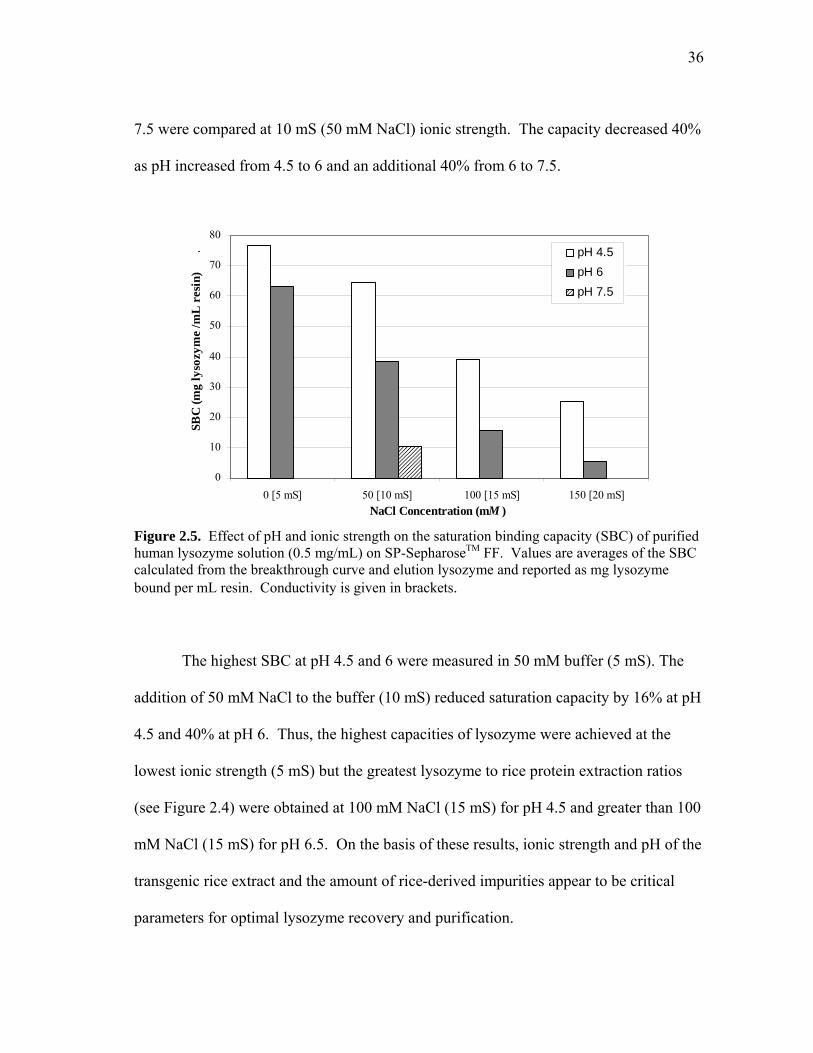
7.5 were compared at 10 mS (50 mM NaCl) ionic strength. The capacity decreased 40%
as pH increased from 4.5 to 6 and an additional 40% from 6 to 7.5.
Figure 2.5. Effect of pH and ionic strength on the saturation binding capacity (SBC) of purified human lysozyme solution (0.5 mg/mL) on SP-SepharoseTM FF. Values are averages of the SBC calculated from the breakthrough curve and elution lysozyme and reported as mg lysozyme bound per mL resin. Conductivity is given in brackets.
The highest SBC at pH 4.5 and 6 were measured in 50 mM buffer (5 mS). The
addition of 50 mM NaCl to the buffer (10 mS) reduced saturation capacity by 16% at pH
4.5 and 40% at pH 6. Thus, the highest capacities of lysozyme were achieved at the
lowest ionic strength (5 mS) but the greatest lysozyme to rice protein extraction ratios
(see Figure 2.4) were obtained at 100 mM NaCl (15 mS) for pH 4.5 and greater than 100
mM NaCl (15 mS) for pH 6.5. On the basis of these results, ionic strength and pH of the
transgenic rice extract and the amount of rice-derived impurities appear to be critical
parameters for optimal lysozyme recovery and purification.
37
Binding and Elution of Transgenic Rice Extracts. To investigate the effect of
rice proteins and other extract impurities on the SBC of human lysozyme, extracts were
prepared with 50 mM NaCl (10 mS). The selected ionic strength was a compromise
between the conditions needed to achieve the highest binding capacity and the
conditions that maximized the lysozyme to rice protein extraction ratio.
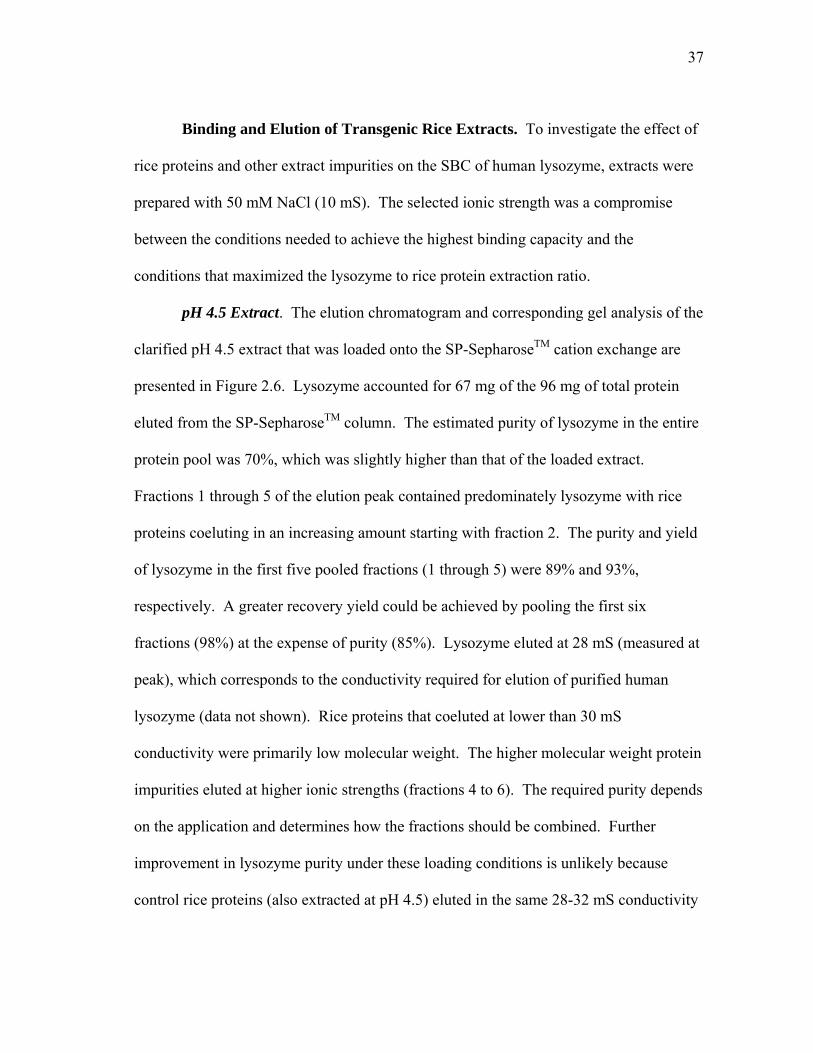
pH 4.5 Extract. The elution chromatogram and corresponding gel analysis of the
clarified pH 4.5 extract that was loaded onto the SP-SepharoseTM cation exchange are
presented in Figure 2.6. Lysozyme accounted for 67 mg of the 96 mg of total protein
eluted from the SP-SepharoseTM column. The estimated purity of lysozyme in the entire
protein pool was 70%, which was slightly higher than that of the loaded extract.
Fractions 1 through 5 of the elution peak contained predominately lysozyme with rice
proteins coeluting in an increasing amount starting with fraction 2. The purity and yield
of lysozyme in the first five pooled fractions (1 through 5) were 89% and 93%,
respectively. A greater recovery yield could be achieved by pooling the first six
fractions (98%) at the expense of purity (85%). Lysozyme eluted at 28 mS (measured at
peak), which corresponds to the conductivity required for elution of purified human
lysozyme (data not shown). Rice proteins that coeluted at lower than 30 mS
conductivity were primarily low molecular weight. The higher molecular weight protein
impurities eluted at higher ionic strengths (fractions 4 to 6). The required purity depends
on the application and determines how the fractions should be combined. Further
improvement in lysozyme purity under these loading conditions is unlikely because
control rice proteins (also extracted at pH 4.5) eluted in the same 28-32 mS conductivity
38
range. The SBC of the crude lysozyme was 43 mg/mL, a 30% capacity reduction
compared to purified human lysozyme (Figure 2.5). Reducing the loading linear flow
rate to 100 cm/h would only potentially increase lysozyme binding capacity but would
not improve its purity.
0
0.2
0.4
0.6
0.8
1
1.2
1.4
1.6
1.8
2
0 5 10 15 20Column Volumes
Abs
orba
nce
Uni
ts
0
10
20
30
40
50
60
70
80
90
100
Con
duct
ivity
(mS)
Absorbance at 280nm
Conductivity
1 2 3 4 5 6
Figure 2.6. Chromatogram with pH 4.5 elution profile (a) showing peak fractions analyzed by SDS-PAGE (b). Load solution was pH 4.5 clarified lysozyme flour extract. Protein profile for load, molecular weight markers (MW), and elution peak fractions (1-6). Numbered lanes correspond to fraction number in elution peak chromatogram. The arrow shows the position of human lysozyme.
(a)
(b)
Load MW 1 2 3 4 5 6 kDa
200 116.3 97.4 66.3
55.4
36.5
31.0
21.5
14.4
6.0
39
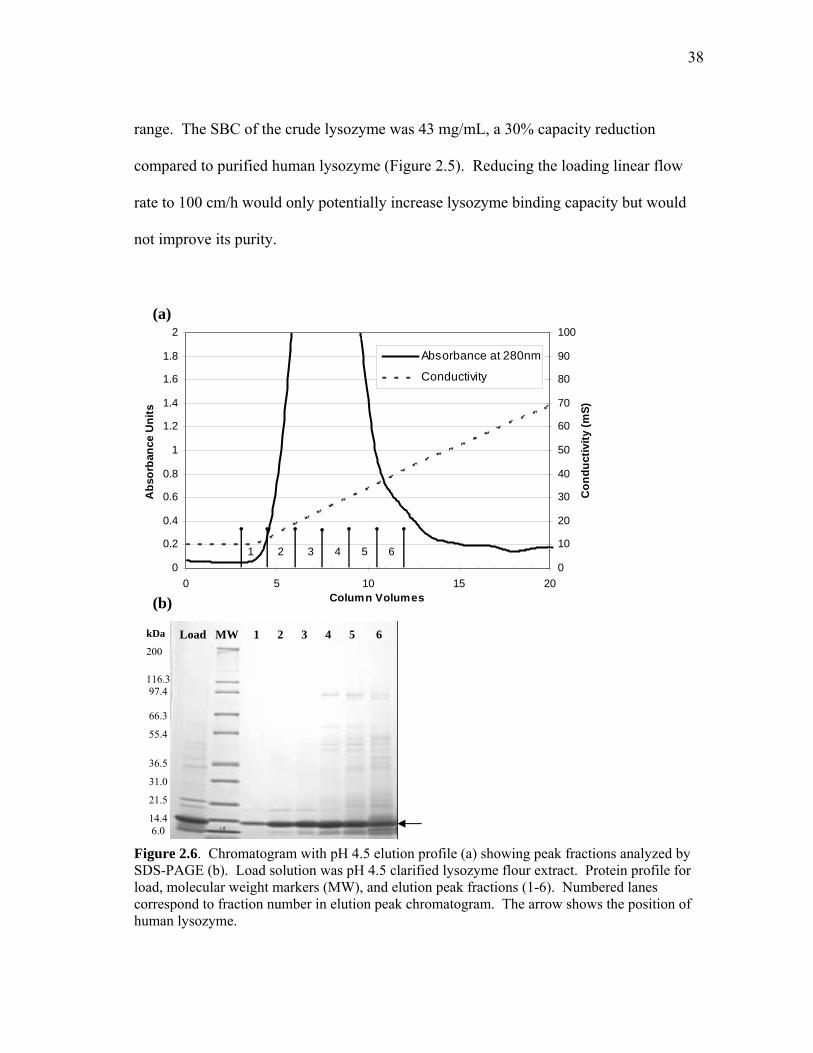
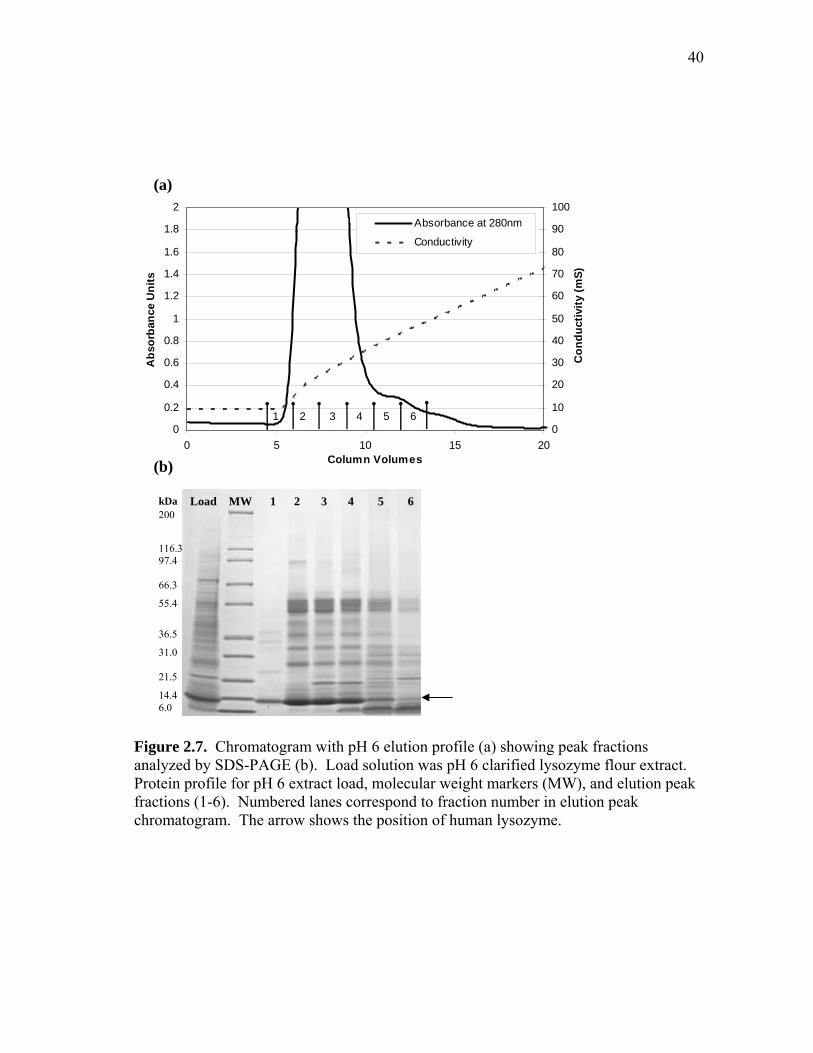
pH 6 Extract. Figure 2.7 shows the elution chromatogram and SDS-PAGE
analysis of eluted fractions for pH 6 extract. The loaded pH 6 extract (initial purity of
25%) contained less lysozyme and more soluble rice protein than the pH 4.5 extract.
Most of the rice proteins coeluted with lysozyme in fractions 2 through 4, with observed
enrichment in both lysozyme and rice protein at 55 kDa. The low molecular weight
proteins (ca. 6 kDa) that were present in both pH 6 and 4.5 extracts eluted in similar
conductivity ranges (30-50 mS). These low molecular weight rice proteins were soluble
at both pHs and are probably more basic than human lysozyme, which eluted at a lower
conductivity (12-40 mS).
Fraction 1 had the highest lysozyme purity (85%) but contained only 1.5% of the
total bound lysozyme. Subsequent fractions (2-4) also contained lysozyme, but had low
purity (40-50%) since several native rice proteins coeluted with lysozyme. The purity
and yield of the lysozyme pool (fractions 1 through 4) were 47% and 99%, respectively.
This evidence suggests that pH 6 extract would require an additional purification step to
achieve 90% purity. The SBC of the crude lysozyme was 24 mg/mL, which was 30%
lower than the SBC measured with the purified human lysozyme at pH 6 and 50 mM
NaCl (Figure 2.5).
40
0
0.2
0.4
0.6
0.8
1
1.2
1.4
1.6
1.8
2
0 5 10 15 20Column Volumes
Abs
orba
nce
Uni
ts
0
10
20
30
40
50
60
70
80
90
100
Con
duct
ivity
(mS)
Absorbance at 280nm
Conductivity
1 2 3 4 5 6
Figure 2.7. Chromatogram with pH 6 elution profile (a) showing peak fractions analyzed by SDS-PAGE (b). Load solution was pH 6 clarified lysozyme flour extract. Protein profile for pH 6 extract load, molecular weight markers (MW), and elution peak fractions (1-6). Numbered lanes correspond to fraction number in elution peak chromatogram. The arrow shows the position of human lysozyme.
Load MW 1 2 3 4 5 6
(a)
(b) kDa
200
116.3 97.4 66.3
55.4
36.5
31.0
21.5
14.4 6.0
41
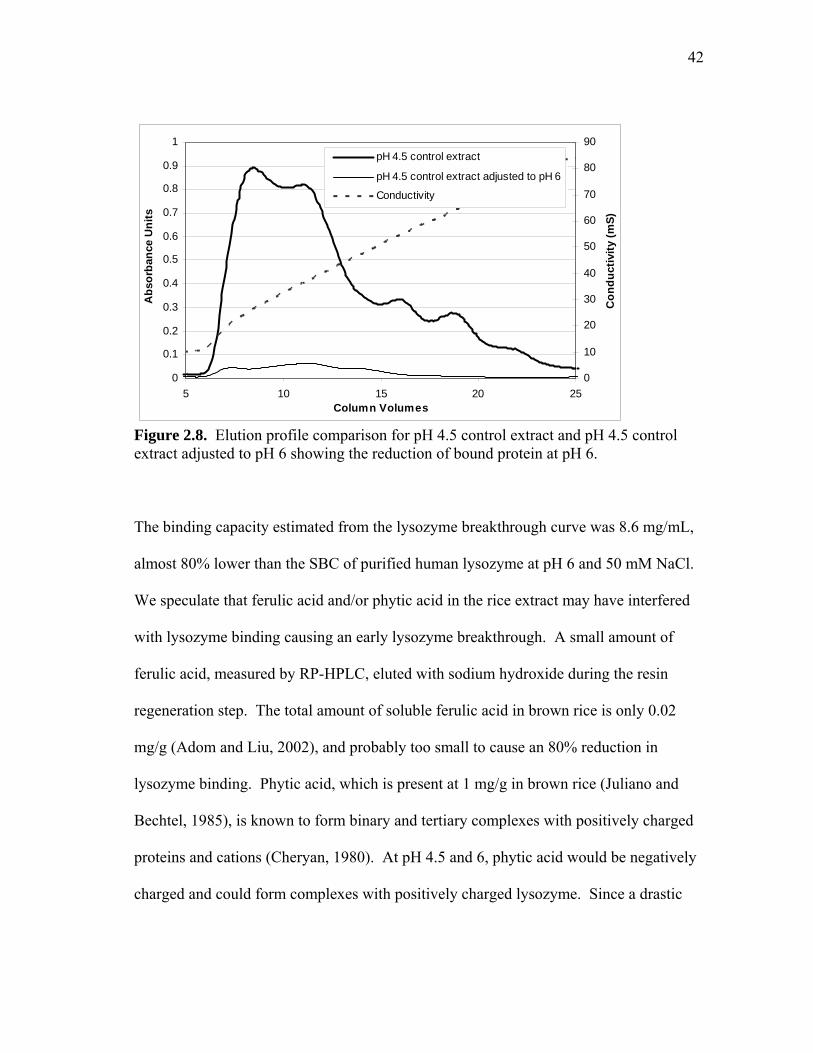
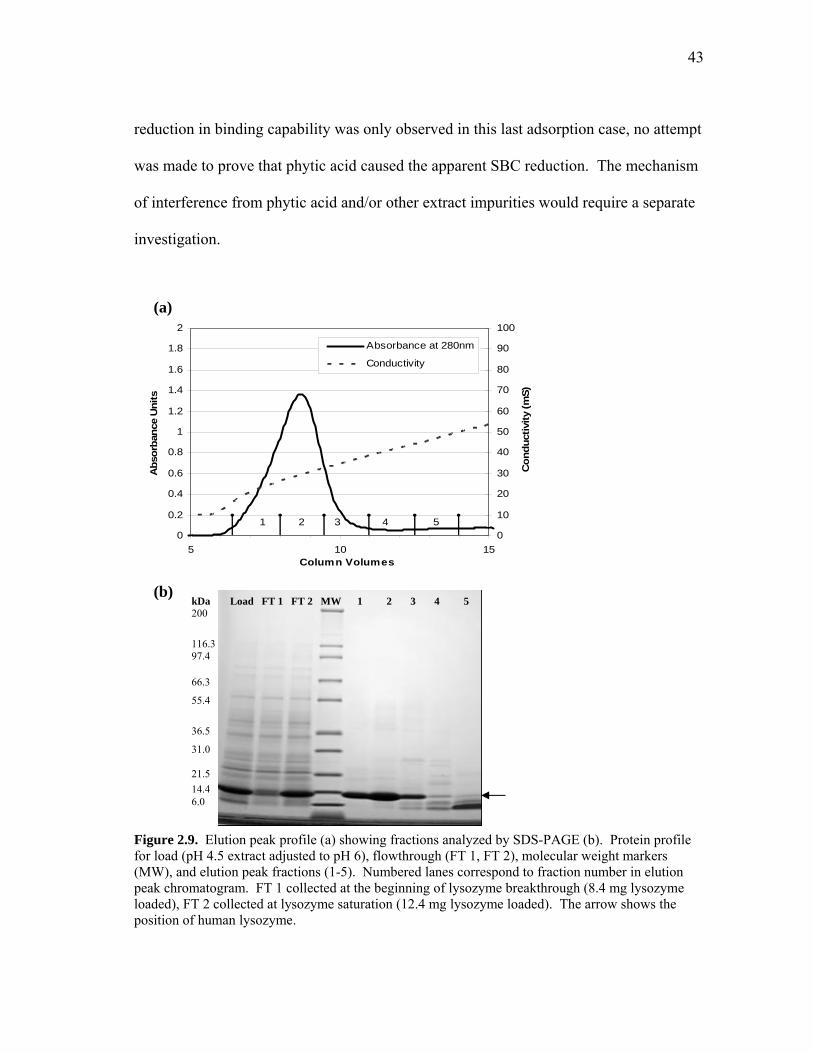
pH 4.5 Extract Adjusted to pH 6 for Binding. The analysis of eluted rice
proteins at pH 4.5 suggested that by combining extraction at pH 4.5 with extract loading
at pH 6, a higher lysozyme yield and purity could potentially be achieved. The working
hypothesis was that the slightly acidic and neutral proteins (pI 6-7) extracted at pH 4.5
do not bind to SP-SepharoseTM resin at pH 6 and 10 mS conductivity.
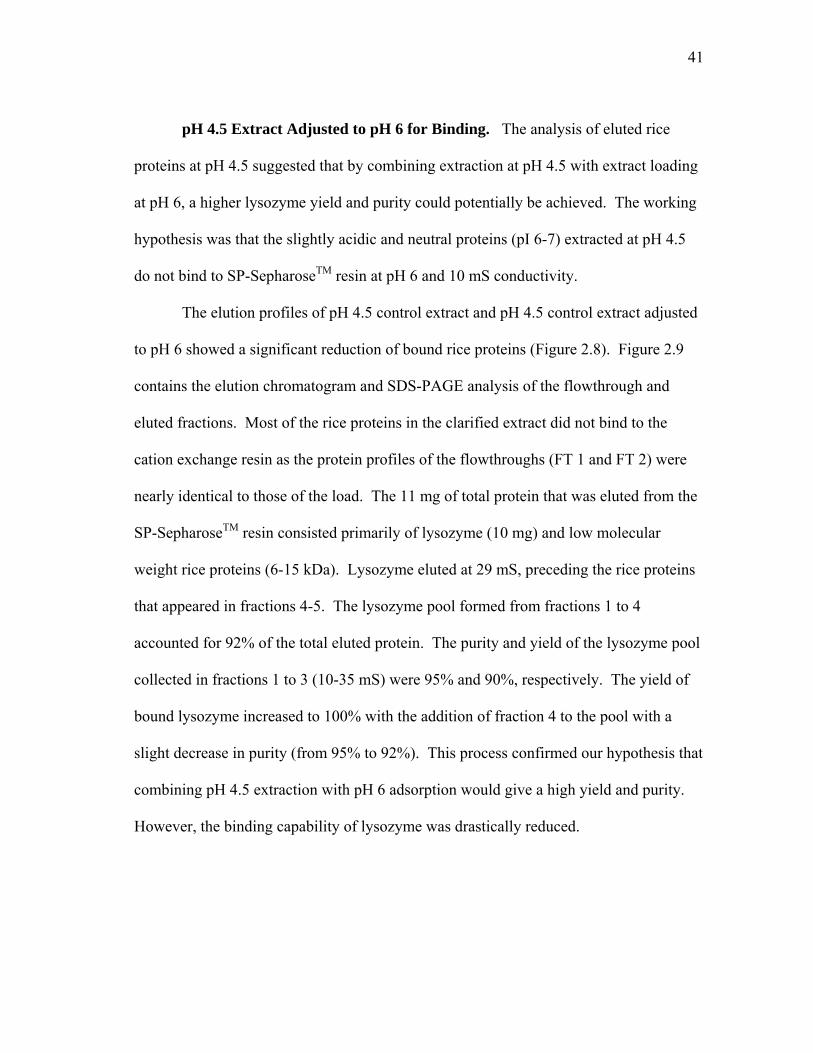
The elution profiles of pH 4.5 control extract and pH 4.5 control extract adjusted
to pH 6 showed a significant reduction of bound rice proteins (Figure 2.8). Figure 2.9
contains the elution chromatogram and SDS-PAGE analysis of the flowthrough and
eluted fractions. Most of the rice proteins in the clarified extract did not bind to the
cation exchange resin as the protein profiles of the flowthroughs (FT 1 and FT 2) were
nearly identical to those of the load. The 11 mg of total protein that was eluted from the
SP-SepharoseTM resin consisted primarily of lysozyme (10 mg) and low molecular
weight rice proteins (6-15 kDa). Lysozyme eluted at 29 mS, preceding the rice proteins
that appeared in fractions 4-5. The lysozyme pool formed from fractions 1 to 4
accounted for 92% of the total eluted protein. The purity and yield of the lysozyme pool
collected in fractions 1 to 3 (10-35 mS) were 95% and 90%, respectively. The yield of
bound lysozyme increased to 100% with the addition of fraction 4 to the pool with a
slight decrease in purity (from 95% to 92%). This process confirmed our hypothesis that
combining pH 4.5 extraction with pH 6 adsorption would give a high yield and purity.
However, the binding capability of lysozyme was drastically reduced.
42
0
0.1
0.2
0.3
0.4
0.5
0.6
0.7
0.8
0.9
1
5 10 15 20 25Column Volumes
Abs
orba
nce
Uni
ts
0
10
20
30
40
50
60
70
80
90
Con
duct
ivity
(mS)
pH 4.5 control extract
pH 4.5 control extract adjusted to pH 6
Conductivity
Figure 2.8. Elution profile comparison for pH 4.5 control extract and pH 4.5 control extract adjusted to pH 6 showing the reduction of bound protein at pH 6.
The binding capacity estimated from the lysozyme breakthrough curve was 8.6 mg/mL,
almost 80% lower than the SBC of purified human lysozyme at pH 6 and 50 mM NaCl.
We speculate that ferulic acid and/or phytic acid in the rice extract may have interfered
with lysozyme binding causing an early lysozyme breakthrough. A small amount of
ferulic acid, measured by RP-HPLC, eluted with sodium hydroxide during the resin
regeneration step. The total amount of soluble ferulic acid in brown rice is only 0.02
mg/g (Adom and Liu, 2002), and probably too small to cause an 80% reduction in
lysozyme binding. Phytic acid, which is present at 1 mg/g in brown rice (Juliano and
Bechtel, 1985), is known to form binary and tertiary complexes with positively charged
proteins and cations (Cheryan, 1980). At pH 4.5 and 6, phytic acid would be negatively
charged and could form complexes with positively charged lysozyme. Since a drastic
43
reduction in binding capability was only observed in this last adsorption case, no attempt
was made to prove that phytic acid caused the apparent SBC reduction. The mechanism
of interference from phytic acid and/or other extract impurities would require a separate
investigation.
0
0.2
0.4
0.6
0.8
1
1.2
1.4
1.6
1.8
2
5 10 15Column Volumes
Abs
orba
nce
Uni
ts
0
10
20
30
40
50
60
70
80
90
100
Con
duct
ivity
(mS)
Absorbance at 280nm
Conductivity
1 2 3 4 5
Figure 2.9. Elution peak profile (a) showing fractions analyzed by SDS-PAGE (b). Protein profile for load (pH 4.5 extract adjusted to pH 6), flowthrough (FT 1, FT 2), molecular weight markers (MW), and elution peak fractions (1-5). Numbered lanes correspond to fraction number in elution peak chromatogram. FT 1 collected at the beginning of lysozyme breakthrough (8.4 mg lysozyme loaded), FT 2 collected at lysozyme saturation (12.4 mg lysozyme loaded). The arrow shows the position of human lysozyme.
kDa
200 116.3 97.4
66.3
55.4
36.5
31.0
21.5
14.4 6.0
Load FT 1 FT 2 MW 1 2 3 4 5
(a)
(b)
44
SUMMARY
This study demonstrated that the best conditions for extraction are not necessarily
optimal for lysozyme adsorption. The most favorable extraction conditions for
maximizing lysozyme concentration and achieving the highest ratio of lysozyme to
native protein were pH 4.5 and 100 mM NaCl (15 mS). In terms of lysozyme
adsorption, pH 4.5 extract with low ionic strength (5 mS) had the highest binding
capacity. Data indicate that direct application of pH 4.5 extract containing 100 mM
NaCl (15 mS) would not be as effective on a large scale for capturing and purifying
human lysozyme because the SBC of 40 mg/mL was rather modest compared with the
75 mg/mL SBC at 5 mS. The 15 mS extract could be diluted with water to 10 mS or 5
mS to improve binding capacity, but dilution would increase the extract volume 2- to 3-
fold, resulting in a longer loading time on the cation exchanger. Removal of NaCl by
diafiltration is an alternative but at a cost. For applications where 90% purity of
lysozyme is satisfactory, pH 4.5 and 10 mS extraction and adsorption appears to be an
acceptable compromise. For greater than 95% purity, the adjustment of pH 4.5 extract to
pH 6 before ion exchange adsorption offers an exciting opportunity providing the
binding capacity is increased from 8 to 30-40 mg/mL. The identification of interfering
extract impurities would be critical for the design of an optimal downstream process
with a single adsorption chromatography step.
45
CHAPTER III
EVALUATION AND ECONOMIC ANALYSIS OF RECOMBINANT HUMAN
LYSOZYME AND HEN EGG-WHITE LYSOZYME PURIFICATION
OVERVIEW
Human lysozyme and hen egg-white lysozyme have antibacterial, antiviral, and
antifungal properties with numerous potential commercial applications. Currently, hen
egg-white lysozyme dominates low cost applications but the recent high-level expression
of human lysozyme in rice could provide an economical source of lysozyme if
purification costs were comparable. This study evaluates human lysozyme and hen egg-
white lysozyme adsorption to the cation exchange resin, SP-SepharoseTM FF, and the
effect of rice extract on lysozyme purification. The dynamic binding capacities of
human lysozyme were lower, except in one case, than those of hen egg-white at pH 4.5,
6, and 7.5 with ionic strengths from 0 to 100 mM (5-20 mS). Ionic strength and pH had
similar effects on the capacities, but human lysozyme was more sensitive to these factors
than hen egg-white lysozyme. At pH 4.5 and in the presence of rice extract, the dynamic
binding capacities of human and hen egg-white lysozymes were reduced by 20-30%.
Similarly, in the presence of rice extract the capacities were reduced 32-39% at pH 6.
Hen egg-white lysozyme was purified from egg-white using two major steps (protein
precipitation and ion-exchange chromatography). The hen egg-white purification data
was then used as a benchmark to assess the effectiveness of human lysozyme recovery
and purification from transgenic rice. Process simulation for human lysozyme
46
purification from rice and hen lysozyme purification from egg-white demonstrated that
production costs would be comparable on a manufacturing scale.
INTRODUCTION
Lysozyme (EC 3.2.1.17) is a glycosidic enzyme and bioactive protein found in
hen egg-white and human tears and milk (Jollès, 1996). All lysozymes have the same
enzyme specificity but can have different physico-chemical properties (isoelectric point,
molecular weight), amino acid composition, and specific activity. For example, there is
only a 60% homology between hen egg-white lysozyme (HewLZ) and human lysozyme
(HuLZ) which results in slightly different isoelectric points (pI) and substantially
different specific activities against a cell wall suspension of Micrococcus luteus (Huang
et al., 2002b). In addition, antibodies against HewLZ and HuLZ do not cross-react
(Faure and Jollès, 1970) signifying important structural differences (Huang et al.,
2006b). Human lysozyme, found in tears, saliva, nasal secretions, and breast milk,
consists of 130 amino acids with a molecular weight of 15 kDa and an isoelectric point
of 10.2 (Huang et al., 2002a). HewLZ contains 129 amino acids with a molecular
weight of 14 kDa, similar pI (≈11), but 3-4 fold lower N-acetylmuramoyl specific
activity than human lysozyme.
Depending on the application and purity level, hen egg-white lysozyme can be
produced at a relatively low cost of $150/kg (Cook, 2004) and dominates lower cost
applications. HewLZ is used in the U.S. to control bacterial growth in food/wine
production and as a feed antibacterial agent (Proctor and Cunningham, 1988). In 1998,
hen egg-white lysozyme was given GRAS (generally recognized as safe) status by the
47
FDA. In Europe, hen egg-white lysozyme has been approved under the EU Additive
Directive 95/2/EC and is used extensively as a chemical-free preservative in the cheese
making industry instead of nitrate and as a sulfate substitute in wine making. Lysozyme
is also used for pharmaceutical applications (Sava, 1996) and is present in many over the
counter medications in Asia and Europe.
Depending on the application, rice-derived human lysozyme may be
advantageous in situations where non-animal source protein and product
hypoallergenicity are required (Huang et al., 2002a). Potential applications of HuLZ
include an anti-infective agent for oral infections (Huang et al., 2006a), as a baby
formula additive to reduce gastrointestinal tract infections (Huang et al., 2002b), and as a
cell lysing agent (InVitriaTM, Fort Collins, CO). The recent high-level expression of
HuLZ in transgenic rice combined with inherently higher specific activity provides an
inexpensive source of human lysozyme for applications similar to those of HewLZ (i.e.
where animal source and hypoallergenicity have no marketing/application advantage). If
one can demonstrate that the downstream processing cost for HuLZ was comparable to
HewLZ then pricing and market penetration of HuLZ would primarily be driven by the
unique market and product requirements such as specific activity, hypoallergenicity and
non-animal source protein.
Various purification strategies have been employed for purification of both
lysozymes with cation-exchange chromatography being one of the prevailing methods
(Guérin-Dubiard et al., 2005; Li-Chan et al., 1986). HewLZ is commercially purified
either by direct salt precipitation (Alderton and Fevold, 1946; Alderton et al., 1945) or
48
by cation exchange adsorption (Guérin-Dubiard et al., 2005; Li-Chan et al., 1986) and
can be used as a benchmark to assess the effectiveness of cation exchange-based
purification processes of HuLZ. Although the adsorption behavior of purified hen egg-
white lysozyme has been thoroughly investigated (Carta et al., 2005; Chang and
Lenhoff, 1998; Dismer and Hubbuch, 2007; Dziennik et al., 2005; Ladiwala et al., 2005;
Nash and Chase, 1998; Skidmore et al., 1990; Whitley et al., 1989), the conditions
presented by rice extract components and human lysozyme are unique and require
additional evaluation. In Chapter II, we established the effect of pH and ionic strength
on adsorption capacity of HuLZ to the cation exchanger, SP-SepharoseTM FF, and
identified potential process bottlenecks that required further investigation (Wilken and
Nikolov, 2006b). For example, the saturation binding capacity data showed a stronger
than expected negative pH and salt effect, even though binding studies were conducted
at pHs well below the reported pI of human lysozyme. In this paper we further examine
the effect of rice extract on human lysozyme and hen egg white purification and
compare manufacturing costs of simulated downstream processing trains for HuLZ and
native HewLZ.
MATERIALS & METHODS
Materials. Recombinant human lysozyme (>93% purity), human lysozyme
(HuLZ) expressing rice flour (transgenic flour), and control rice flour were provided by
Ventria Bioscience (Sacramento, CA). The transgenic and control flour were from the
same genetic background. Hen egg-white lysozyme (HewLZ) was obtained from
49
Calbiochem (LaJolla, CA). Grade A large eggs were purchased from a local grocery
store.
Analytical Methods. Total Protein and Lysozyme Quantification. Total soluble
protein (TSP) was determined using the Bradford method (Bradford, 1976) with bovine
serum albumin as a standard. Lysozyme concentrations were determined by enzymatic
assay for extracts and by UV absorbance at 280 nm for highly pure lysozyme solutions.
The enzymatic assay measures the decrease in turbidity of a M. luteus cell suspension
(Shugar, 1952). To measure lysozyme content, a modified microtiter plate method was
used with a 0.03% (w/v) cell suspension and either 0-15 μg/mL HuLZ standards or 0-50
μg/mL HewLZ standards. The range of lysozyme standards differed because HewLZ
has a 3-fold lower specific activity than HuLZ. Control flour extract was used in the
preparation of standards to account for the interference of extract components. Cell
suspension (250 μL) was added to each 50 μL sample and activity was monitored at 450
nm for 4 min with a Versamax plate reader (Molecular Devices). When lysozyme was
the only UV-absorbing solution component, lysozyme concentration was determined by
absorption at 280 nm (Beckman DU 600) using an extinction coefficient of 2.46 mL/mg-
cm for human lysozyme and 2.64 mL/mg-cm for hen egg-white lysozyme.
Protein Analysis by SDS-PAGE. The protein molecular weight profiles of
extracts and chromatography fractions were evaluated by electrophoresis as described by
Laemmli (1970). Samples were loaded on 8-16% tris-glycine gels under non-reducing
conditions with Mark12TM protein standards (Invitrogen).
50
Experimental Methods. Effect of pH and Ionic Strength on Dynamic Binding
Capacity (DBC) of Human Lysozyme and Hen Egg-white Lysozyme. The
breakthrough capacities of HuLZ and HewLZ on a strong cation exchange resin (SP-
SepharoseTM FF) were determined using a Bio-Rad (Hercules, CA) BioLogic LP
chromatography system interfaced with LP DataView Software. SP-SepharoseTM FF
resin (GE Healthcare, Piscataway, NJ) was packed to a height of 2.2 cm in a 1 cm x 10
cm column (Bio-Rad). HuLZ solutions (0.5 mg/mL) and HewLZ solutions (0.5 mg/mL)
were prepared with each respective binding buffer. Binding buffers of various ionic
strengths (0, 50, 100, and 150 mM NaCl) were prepared in 50 mM sodium acetate (pH
4.5 experiments) or 50 mM sodium phosphate (pH 6 experiments). At pH 7.5, the
breakthrough capacity was evaluated at a single sodium chloride concentration (50 mM)
using 50 mM sodium phosphate buffer.
For each experiment, the column was equilibrated with binding buffer and the
lysozyme solution was loaded at a flow rate of 2 mL/min (150 cm/h) until saturation.
Absorbance at 280 nm was monitored throughout loading. The absorbances were
converted to lysozyme concentrations using a path length of 2 mm and an extinction
coefficient of 2.64 mg/mL-cm for hen egg-white lysozyme or 2.46 mg/mL-cm for
human lysozyme. The 5% breakthrough capacity was calculated by determining the
amount of lysozyme bound to the column once the outlet concentration of lysozyme was
5% of the load concentration. The DBC values reported are expressed as milligrams
lysozyme bound per milliliter resin.
51
Preparation of Control and Lysozyme Rice Flour Extracts. To prepare extracts,
20 g of control or transgenic rice flour was added to 100 mL extraction buffer and mixed
continuously for 1 h. The extraction buffers used for extraction were 50 mM sodium
acetate, 50 mM NaCl (pH 4.5) or 50 mM sodium phosphate, 100 mM NaCl (pH 6).
Extracts were centrifuged at 12,000 x g for 15 min and then filtered through No. 5C
filter paper (Micro Filtration Systems) followed by a 0.45 μm cellulose acetate filter
(Corning) to produce a clarified extract. For HewLZ spiked extract, HewLZ was added
to clarified control extract and mixed. The concentration of HewLZ spiked into control
extract was comparable to the HuLZ concentration in transgenic extract at pH 4.5 (10
mS) or pH 6 (15 mS).
Effect of Rice Extract on the Binding and Elution of Human Lysozyme and
Spiked Hen Egg-white Lysozyme. The binding capacities of HuLZ and HewLZ in pH
4.5 and pH 6 rice extracts were determined to understand how background impurities
would impact the binding capacity and purification of both lysozymes.
pH 4.5 Binding and Elution. HuLZ rice flour and HewLZ spiked control rice
flour extracts were prepared as described previously. The column was equilibrated with
pH 4.5 50 mM sodium acetate with 50 mM NaCl and the clarified extract was loaded
onto a 2 mL (0.5 cm x 10 cm) SP-SepharoseTM FF column at a flow rate of 1 mL/min
(300 cm/h). The column was washed with 10 column volumes (CV) of equilibration
buffer and bound protein was eluted by a linear gradient from 0.05 to 1 M NaCl in pH
4.5 50 mM sodium acetate over 20 CV. Lysozyme breakthrough curves (HuLZ and
HewLZ) were generated by collecting 3 mL fractions throughout column loading and
52
measuring the lysozyme activity in each fraction. The DBC was determined by
calculating the amount of lysozyme loaded when the column outlet concentration was
5% of the load concentration. To determine if the eluted HewLZ would have greater
purity than the eluted HuLZ, the column was loaded to 80% of the saturation capacity
and elution peak fractions were analyzed for lysozyme and total protein content.
pH 6 Binding and Elution. The binding capacity and eluted lysozyme purities
were determined under saturation conditions at pH 6 to further evaluate and compare the
interactions of HuLZ and HewLZ with SP-SepharoseTM FF in rice extracts. The
saturation binding capacities (SBC) were determined instead of DBCs at 5%
breakthrough because very little protein was bound from pH 6 HuLZ rice extract at 15
mS in a preliminary experiment.
The column was equilibrated with pH 6 50 mM sodium phosphate with 50 mM
NaCl and the clarified extract was loaded onto a 2 mL (0.5 cm x 10 cm) SP-SepharoseTM
FF column at a flow rate of 1 mL/min (300 cm/h). The column was washed with 10
column volumes (CV) of equilibration buffer and bound protein was eluted over 20 CV
with a linear gradient from 0.05 to 1 M NaCl in pH 6 50 mM sodium phosphate. Elution
peak fractions (3 mL) were collected, analyzed for lysozyme and total soluble protein,
and pooled based on purity. The SBCs were determined by summing the lysozyme
content (activity assay) in all the elution peak fractions.
Binding and Elution of Control Extract. Control rice flour extract was prepared
as described previously with 50 mM NaCl in 50 mM sodium acetate, pH 4.5. Clarified
extract was loaded onto a 2 mL (0.5 cm x 10 cm) SP-SepharoseTM FF column at a flow
53
rate of 1 mL/min (300 cm/h). The volume of control extract loaded corresponded to the
volume of either transgenic or spiked control rice extract needed to reach lysozyme
saturation. The column was washed with 5 column volumes (CV) of the respective
binding buffer and the bound protein was eluted by linear gradient from 0 to 1 M NaCl
in 50 mM sodium acetate with 50 mM NaCl over 20 CV. Fractions (3 mL) were
collected throughout elution and analyzed for total soluble protein and by SDS-PAGE.
Effect of Egg-white Protein on Hen Egg-white Lysozyme Purification. Egg-
white was diluted 1:3 with RO water, adjusted to pH 6 with 5 M phosphoric acid, and
mixed for 1 h at room temperature to precipitate ovomucin (Nakamura et al., 1961).
After precipitation, the solution was centrifuged for 30 min at 12,000 x g and 25°C. The
liquid was recovered, sodium phosphate was added to get 50 mM buffer with 0, 50, or
100 mM NaCl, and the solution was filtered with a 0.2 μm surfactant-free cellulose
acetate filter system (Nalgene).
Three sodium chloride concentrations were evaluated to determine the effect of
conductivity on the binding capacity and lysozyme purity using SP-SepharoseTM FF.
The capacity of hen egg-white lysozyme on the weak cation exchanger, CM-
SepharoseTM FF (GE Healthcare), was evaluated at a single ionic strength (50 mM
sodium phosphate and 50 mM NaCl). For each experiment, the column was
equilibrated with 50 mM sodium phosphate buffer (pH 6) with 0, 50, or 100 mM NaCl
(buffer A) over 10 CV. The clarified egg-white solution was loaded at 1 mL/min (300
cm/h) onto a 2 mL SP-SepharoseTM FF column (0.5 cm x 10 cm) until saturation. The
column was washed with 10 CV of buffer A and the bound protein was eluted by linear
54
gradient from 0 to 1 M NaCl in buffer A. Fractions (3 mL) were collected throughout
elution and analyzed for lysozyme, total soluble protein, and by SDS-PAGE. The
lysozyme saturation capacity was calculated by measuring the activity in the elution
peak fractions.
Process Simulation & Economics. To estimate manufacturing costs, SuperPro
Designer 7.0 software (Intelligen Inc.) was used to simulate HuLZ extraction and
purification from transgenic rice and HewLZ purification from egg-white. The
simulated processes were: 1) pH 4.5 extraction and adsorption of HuLZ and 2) pH 6
adsorption of HewLZ. Using our experimental data and other published information, the
HuLZ process was assembled in six sections: 1) grinding to remove rice hull, 2) pH 4.5
extraction, 3) solid-liquid separation by decanter centrifuge, 4) ion-exchange capture at
pH 4.5, 5) ultrafiltration/diafiltration (UF/DF) buffer exchange and product
concentration, and 6) spray drying. HewLZ purification consisted of five sections: 1)
precipitation of ovomucin at pH 6, 2) solid-liquid separation by disk-stack centrifuge, 3)
ion-exchange capture at pH 6, 4) UF/DF, and 5) spray drying. The processes were
designed to produce 1000 kg lysozyme per year in 330 batches.
The equipment size was estimated by the simulation software using component
mass balance, operating time, and the required throughput. Equipment cost was
estimated using either SuperPro built-in models or user-define models based on vendor
price quotes. The total capital investment included equipment cost, direct fixed capital
(DFC), working capital, and start-up cost. The DFC was calculated from the total
55
equipment cost using a Lang factor of 3. Working capital and start-up costs were
assumed to be 3% and 5% of DFC (Peters and Timmerhaus, 1991).
Lysozyme purification by SP-SepharoseTM FF (HuLZ) and CM-SepharoseTM FF
(HewLZ) was simulated using experimentally determined capacities and yields and
assumed values for the resin cost of $500/L and lifespan of 500 cycles. Other
consumables used for each process include UF membranes ($1000/m2 with 150 cycle
lifespan) and dead-end filtration cartridge ($100/m2, 100 cycle lifespan). Operation data
such as buffer composition, column volumes, and linear velocities for the column wash,
elution, regeneration, and equilibration were consistent with experimental procedures
listed previously. The cost of chemicals was obtained from the ICIS Chemical Business
(www.icis.com) and SuperPro database.
The operating labor for each process was estimated by summing the allocated
operator hours required for each procedure per equipment operation time. Lab services
with QC/QA were assumed to be 15% of the operating labor (Harrison et al., 2003). The
total labor includes the operating and the labor-dependent costs.
The total operating cost for each downstream processing train was determined
from the direct process costs (reagents and consumables, labor and operating supplies,
and utilities and waste disposal) and indirect process costs (maintenance and
depreciation).
The lysozyme production cost on a mass basis was converted to a per unit
activity basis using specific activities of 150,000 units/mg for HuLZ and 50,000
units/mg for HewLZ. One unit activity is defined as the amount of lysozyme that
56
produces a change of 0.001 in the absorbance at 450 nm per minute at the standard
lysozyme assay conditions.
RESULTS & DISCUSSION
Effect of pH and Ionic Strength on Dynamic Binding Capacity (DBC) of
Human Lysozyme and Hen Egg-white Lysozyme. The capacities were evaluated and
compared to understand how the differences between HuLZ and HewLZ properties (pI,
activities) and amino acid sequence (homology and charge distribution) translate into
different adsorption behavior to the cation exchange resin. The dynamic binding
capacities at 5% breakthrough of human and hen egg-white lysozyme on SP-
SepharoseTM FF are reported in Figures 3.1-3.3. The binding capacities typically
decreased as the pH and conductivity increased with HewLZ having greater capacities
than HuLZ. At pH 4.5 (Figure 3.1), the dynamic capacity decreased from 69 to 20
mg/mL for HuLZ and from 65 to 42 mg/mL for HewLZ as the conductivity increased
from 5 to 20 mS. The negative effect of ionic strength on both enzymes was more
pronounced at pH 6 (Figure 3.2). The dynamic capacity at pH 6 dropped from 62 to 4
mg/ml for HuLZ and from 73 to 6 mg/ml for HewLZ as the conductivity increased from
5 to 20 mS (Figure 3.2).
The two enzymes responded differently in the presence of acetate buffer or
phosphate buffer with no salt addition. The binding capacities of both lysozymes at pH
4.5 (acetate buffer) were similar, whereas at pH 6 (phosphate buffer) they differed by 10
mg/ml. This difference was caused by the slight increase of HewLZ binding with the
concomitant decrease of HuLZ binding. At pH 4.5, the addition of 50 mM NaCl to
57
acetate buffer slightly increased DBC of HewLZ. This positive salt effect could possibly
be caused by reduced repulsion between free and adsorbed lysozyme and enhanced
protein transport within the resin particle (Chang and Lenhoff, 1998; Zydney et al.,
2009).
At pH 4.5, HuLZ susceptibility to ionic strength change was greater than that of
HewLZ, and at pH 6, both enzymes were equally affected (Figure 3.1 and 3.2). At pH
4.5 and the highest ionic strength (15 mS), the HewLZ capacity (42 mg/mL) was double
the HuLZ capacity (20 mg/mL). The capacities at pH 6 and 15 mS were only 6 mg/mL
for HewLZ and 4 mg/mL for HuLZ. To determine whether the DBC difference would
continue to increase with increasing pH, an additional DBC experiment was carried out
at pH 7.5 and 50 mM NaCl (10 mS). The DBC of HuLZ was 12%, 37%, and 74% lower
than HewLZ at pH 4.5, 6, and 7.5, respectively (Figure 3.3). The stronger effect of
ionic strength and pH on HuLZ than HewLZ suggests different surface charge
distribution and/or different positive net charge. Examination of protein models using
Protein Explorer (Martz, 2002) revealed two clusters of basic residues, primarily lysine,
on HewLZ but a more even distribution of basic charges (arginine) on the surface HuLZ
which may explain the ionic strength effect.
58
0
10
20
30
40
50
60
70
0 [5 mS] 50 [10 mS] 100 [15 mS] 150 [20 mS]
DB
C (m
g ly
sozy
me/
mL
resi
n)
NaCl Concentration (mM)
HuLZ
HewLZ
Figure 3.1. Effect of ionic strength on the binding capacities of purified human lysozyme (HuLZ) and hen egg-white lysozyme (HewLZ) solutions (0.5 mg/mL) on SP-SepharoseTM FF at pH 4.5. Dynamic binding (DBC) were measured at 5% breakthrough with a linear velocity of 150 cm/h and reported as mg lysozyme bound/mL resin.
0
10
20
30
40
50
60
70
80
0 [5 mS] 50 [10 mS] 100 [15 mS] 150 [20 mS]
DB
C (m
g ly
sozy
me/
mL
resi
n)
NaCl Concentration (mM)
HuLZ
HewLZ
Figure 3.2. Effect of ionic strength on the binding capacities of purified human lysozyme (HuLZ) and hen egg-white lysozyme (HewLZ) solutions (0.5 mg/mL) on SP-SepharoseTM FF at pH 6. Dynamic binding capacities (DBC) were measured at 5% breakthrough with a linear velocity of 150 cm/h and reported as mg lysozyme bound/mL resin.
59
0
10
20
30
40
50
60
70
Human Lysozyme Hen Egg-white Lysozyme
DB
C (m
g ly
sozy
me/
mL
resi
n)
Lysozyme in 50 mM buffer with 50 mM NaCl
pH 4.5
pH 6
pH 7.5
Figure 3.3. Effect of pH on the binding capacities of purified human lysozyme and hen egg-white lysozyme (0.5 mg/mL) on SP-SepharoseTM at an ionic strength of 50 mM NaCl (10 mS). Dynamic binding capacities measured at 5% breakthrough with a linear velocity of 150 cm/h and reported as mg lysozyme loaded /mL resin.
Effect of Rice and Egg-white Proteins on Lysozyme Adsorption. To
understand how background impurities would impact the binding capacity and
purification of both lysozymes, we first compared the binding capacity of HuLZ and
spiked HewLZ in pH 4.5 and pH 6 rice extracts. Secondly, HewLZ adsorption from
spiked control rice extract was also compared to the binding of HewLZ from egg-white.
The latter comparison allows direct comparison of host impurities, i.e. rice extract versus
egg-white. Because egg-white is a natural source of lysozyme, the reverse scenario of
HuLZ binding from spiked egg-white was not possible.
Effect of Rice Extract on Binding and Elution of Human Lysozyme and Spiked
Hen Egg-white Lysozyme. In Chapter II, we measured a 30% reduction in DBC of
60
HuLZ in rice extract compared to buffer and thought it would be prudent to compare the
effect of rice extract impurities (native protein, phytic acid, starch, etc.) on the binding
capacities of HuLZ and HewLZ. We were concerned about the presence of complexes
between HuLZ and extract components that may have reduced the ability of HuLZ to
effectively interact with the cation exchange. For this reason, HewLZ was spiked into
filtered rice extract.
pH 4.5 Binding and Elution. To assess the effect of pH 4.5 rice extract on the
adsorption of lysozyme to the cation exchange resin, the DBC of HuLZ and HewLZ was
determined in pH 4.5 and 50 mM NaCl rice extracts. For this investigation, 50 mM
NaCl (10 mS) was selected since this ionic strength was determined to be most
compatible for both extraction and adsorption (Wilken and Nikolov, 2006b). The DBC
of HuLZ was reduced from 61 mg/mL to 42 mg/mL (31%) in the presence of pH 4.5 rice
extract compared to purified HuLZ in acetate buffer of the same ionic strength
(conductivity). Similarly, the DBC for HewLZ was reduced from 69 to 55 mg/mL
(21%). The measured reduction of DBCs for the two enzymes seems to indicate similar
interference irrespective of the enzyme source (spiked or rice extracted). However, the
percent reduction of DBC for HuLZ was slightly greater which supports the findings
from our studies with pure lysozyme that HuLZ interactions with the cation exchange
resin are weaker than HewLZ interactions. This was also evident by overlapping the
adsorption-conductivity elution profiles from each experiment (Figure 3.4). HuLZ
started to elute at a slightly lower conductivity than HewLZ (14 mS compared to 16
mS), indicating weaker interaction with the cation exchange resin.
61
The elution profile of bound rice proteins from pH 4.5 control extract was
compared to the elution profile of pH 4.5 HuLZ rice extract and HewLZ spiked control
extract by overlapping the adsorption-conductivity profiles in Figure 3.4. The total
bound protein from the control and HuLZ rice extracts eluted in 20 column volumes
(CV) and a conductivity range of 10 to 84 mS. The majority of the native rice proteins
eluted between 10 to 50 mS (in 10 CV), a conductivity range which overlaps with that of
HuLZ and HewLZ eluates. In other words, unless HuLZ and HewLZ have greater
affinity for the SP-SepharoseTM than native rice proteins then little purification should be
expected at pH 4.5 with 50 mM NaCl.
0
0.2
0.4
0.6
0.8
1
1.2
1.4
1.6
1.8
2
10 15 20 25 30 35 40 45 50 55 60 65 70 75 80 85
Abs
orba
nce U
nits
Conductivity (mS)
HewLZ Spiked Control Extract
HuLZ Extract Elution
Control Extract Elution
Figure 3.4. Elution profiles for pH 4.5 hen egg-white lysozyme (HewLZ) spiked extract and human lysozyme (HuLZ) extract compared to control (nontransgenic) rice extract. Absorbance at 280 nm monitored throughout the linear gradient elution.
62
To test lysozyme purification, pH 4.5 HuLZ rice extract and HewLZ spiked
control rice extract were loaded on a SP-SepharoseTM FF column to 80% of the
saturation binding capacity. The purpose of this experiment was to determine if the
eluted HewLZ would have greater purity than the eluted HuLZ. The elution peak
fractions were individually analyzed and combined according to lysozyme purity into
three pools (Figure 3.5a and 3.6a) to assess purity and yield of eluted lysozyme as a
function of eluant conductivity. Pool 1 was formed from fractions that maximized yield
without sacrificing lysozyme purity. Pool 1 consisted of fractions that eluted from 2 to
11 CV for HewLZ extract which corresponded to the eluant conductivity range of 10 to
44 mS. For HuLZ extract, pool 1 consisted of eluted lysozyme fractions from 3 to 12
CV, corresponding to the eluant conductivity range of 9.4 to 40 mS. The elution
chromatogram and corresponding gel analysis of HewLZ spiked pH 4.5 control extract
(initial purity of 67%) are presented in Figure 3.5. HewLZ purity (based on activity) and
yield in pool 1 were >98% and 95%, respectively. Pool 2 contained primarily rice
proteins with a lysozyme purity of 35%. By comparing the SDS-PAGE analysis of the
pH 4.5 control extract elution pools (Figure 3.5c) with the three HewLZ elution pools
(Figure 3.5b), HewLZ was more competitive in interacting with SP-SepharoseTM than
native rice protein. Nearly 80% of the loaded total protein in the control extract was
bound under these conditions (pH 4.5 and 10 mS).
The elution chromatogram and corresponding gel analysis for adsorption from
pH 4.5 HuLZ rice extract are presented in Figure 3.6. Lysozyme content in the extract
was 70% of the total soluble protein. HuLZ purity (by HPLC) and yield in pool 1 were
63
91% and 87%, respectively. Pool 2 contained 19 mg of total protein with a lysozyme
purity of 50%. The achieved purity of 91% may not be sufficient for some applications
and additional improvement in lysozyme purity by optimization of the ion-exchange step
is unlikely since rice proteins eluted in the same conductivity range (Figure 3.6).
Compared to HewLZ purification from rice extract at pH 4.5, the purification of HuLZ
from rice resulted in a lower lysozyme purity and yield. The lower purity and yield of
HuLZ compared to HewLZ indicates that the interaction of HuLZ with the cation
exchange resin is weaker, a conclusion that was also made from the binding capacity
studies with purified lysozyme.
pH 6 Binding and Elution. The capacity and purities of lysozyme were evaluated
under saturation conditions at pH 6 to further evaluate and compare the interactions of
HuLZ and HewLZ with SP-SepharoseTM FF. Purification experiments (Chapter II) with
pH 6 HuLZ extract in the presence of 50 mM NaCl (10 mS) resulted in low lysozyme
purity. In this study, pH 6 extracts were loaded at a higher conductivity (15 mS) in an
attempt to reduce the amount of rice protein bound and improve lysozyme purity. Using
a higher ionic strength for HuLZ extraction was also beneficial because the extracted
lysozyme concentration increased 2-fold if 100 mM NaCl (15 mS) was used instead of
50 mM (10mS).
64
0
10
20
30
40
50
60
70
80
90
100
0
0.2
0.4
0.6
0.8
1
1.2
1.4
1.6
1.8
2
0 5 10 15 20 25
Con
duct
ivity
(mS)
Abs
orba
nce U
nits
Column Volumes
Absorbance at 280 nmConductivity
Pool 1 Pool 2 Pool 3
Figure 3.5. (a) pH 4.5 HewLZ spiked control extract elution profile and (b) SDS-PAGE analysis of extract and elution pools. P1, P2, and P3 correspond to the pools 1, 2, and 3 labeled on chromatogram with 10 μg of protein loaded in each lane except for Pool 3 (P3). (c) SDS-PAGE analysis of control extract elution pools (P1, P2, P3) with collection times and volumes identical to the HewLZ extract elution pools.
HewLZ MW Ext. P1 P2 P3
kDa
200
116.3 97.4
66.3
55.4
36.5
31.0
21.5
14.4 6.0
MW Ext. P1 P2 P3
(a)
(b) (c)
65
Figure 3.6. (a) pH 4.5 HuLZ rice extract elution profile and (b) SDS-PAGE analysis of loaded extract and elution pools. P1, P2, and P3 correspond to the pools 1, 2, and 3 labeled on chromatogram with 10 μg of protein loaded in each lane except for Pool 3 (P3). (c) SDS-PAGE analysis of control extract elution pools (P1, P2, P3) with collection times and volumes identical to the HuLZ extract elution pools.
kDa
200
116.3 97.4
66.3
55.4
36.5 31.0
21.5 14.4
6.0
0
10
20
30
40
50
60
70
80
90
100
0
0.2
0.4
0.6
0.8
1
1.2
1.4
1.6
1.8
2
0 5 10 15 20 25 30
Con
duct
ivity
(mS)
Abs
orba
nce U
nits
Column Volumes
Absorbance at 280 nmConductivity
Pool 1 Pool 2 Pool 3
(a)
(b) (c)
HuLZ MW Ext. P1 P2 P3
MW Ext. P1 P2 P3
66
The elution chromatogram and corresponding SDS-PAGE analysis of HewLZ
adsorption from spiked pH 6 control extract are presented in Figure 3.7. HewLZ was
18% of the total soluble protein in the spiked control extract. The saturation capacity for
HewLZ was reduced from 38 mg/mL to 26 mg/mL (32%) in the presence of rice extract
compared to phosphate buffer of the same ionic strength. Pool 1 had a purity of 82%
with an 87% yield (based on the total amount of eluted lysozyme (pool 1 and 2). Pool 2
contained primarily rice proteins with a lysozyme purity of 24%.
The elution chromatogram and SDS-PAGE analysis of HuLZ adsorption from
pH 6 transgenic extract are given in Figure 3.8. HuLZ was 26% of the total soluble
protein present in the extract. The saturation capacity of HuLZ in rice extract was 9.5
mg/mL, 39% lower than the capacity (15.6 mg/mL) of purified HuLZ in buffer. The
purity of lysozyme, based on activity, in pool 1 was 60%.
The percent reductions in binding capacities for both HewLZ and HuLZ at pH 6
were slightly higher than the reductions observed at pH 4.5. As observed with pH 4.5
adsorption experiments, HewLZ purity was greater than the HuLZ purity.
67
kDa
200
116.3 97.4
66.3
55.4
36.5 31.0
21.5 14.4
6.0
HewLZ MW Ext. P1 P2
0
10
20
30
40
50
60
70
80
90
100
0
0.2
0.4
0.6
0.8
1
1.2
1.4
1.6
1.8
2
0 5 10 15 20 25 30
Con
duct
ivity
(mS)
Abs
orba
nce U
nits
Column Volumes
Absorbance at 280 nmConductivity
Pool 1 Pool 2
Figure 3.7. (a) pH 6 HewLZ spiked control extract elution profile and (b) SDS-PAGE analysis of extract (ext.) and elution peak fractions which were pooled (P1, P2) as indicated on the chromatogram. HewLZ standard was included for reference and each lane was loaded with 10 μg total protein.
(a)
(b)
68
0
10
20
30
40
50
60
70
80
90
100
0
0.2
0.4
0.6
0.8
1
1.2
1.4
1.6
1.8
2
0 5 10 15 20 25 30
Con
duct
ivity
(mS)
Abs
orba
nce U
nits
Column Volumes
Absorbance at 280 nmConductivity
Pool 1Pool 2
kDa
200
116.3 97.4
66.3 55.4
36.5
31.0
21.5 14.4 6.0
HuLZ MW Ext. P1 P2
Figure 3.8. (a) pH 6 HuLZ rice extract elution profile and (b) SDS-PAGE analysis of extract and elution peak fractions which were pooled (P1, P2) as indicated on the chromatogram. HuLZ standard was included for reference and each lane was loaded with 10 μg total protein.
(a)
(b)
69
Effect of Egg-white Proteins on Binding and Elution of Hen Egg-white
Lysozyme. To understand the impact of native rice impurities (protein) on lysozyme
purification by ion-exchange, we compared the binding capacity and purity of HewLZ
purified from egg-white to HewLZ purified from spiked control rice extract. The
objective, as stated earlier, was to evaluate rice as a host system against egg-white and to
determine the processing conditions that will be used for process simulation of HewLZ.
The binding capacity and purity of hen egg-white lysozyme eluted from SP-
SepharoseTM FF were measured as a function of load (egg-white) conductivity to
determine the best adsorption conditions for cation exchange purification at pH 6.
Adsorption at pH 6 was advantageous for this system since ovomucin precipitation (first
step in egg-white process) is optimal at pH 6. In addition, the major protein impurity
(ovalbumin) present in egg-white has a pI of 5.1 and theoretically should not bind to the
cation exchange. After precipitation of ovomucin from egg-white, sodium phosphate
buffer was added with 0, 50, or 100 mM NaCl corresponding to conductivities of 5, 10,
and 15 mS. The HewLZ purity increased and binding capacity decreased as the
conductivity of the load solution increased. The highest lysozyme purity of 89% was
achieved when the load conductivity was 15 mS (50 mM buffer with 100 mM NaCl),
with a binding capacity of 24 mg/mL.
The average amount of total protein in the cation exchanger load (clarified egg-
white) was 21 mg/mL, which was significantly higher than the protein concentration of
1.4 mg/mL in pH 6 HewLZ spiked control rice extract. However, the lysozyme binding
capacities were comparable, i.e. 26 mg/mL for HewLZ spiked in the rice extract
70
compared to 24 mg/mL for HewLZ from egg-white. The initial HewLZ protein purity in
egg-white was 3% and 18% in control rice extract. The purity of eluted HewLZ was
66% for rice (3.9-fold purification) and 89% with egg-white (30-fold purification). The
higher purity of eluted lysozyme for the egg-white experiments suggests that egg-white
proteins are less competitive than rice ones for the cation exchange binding sites. Most
hen egg-white proteins have more acidic isoelectric points (Stevens, 1991) than rice
proteins (Menkhaus et al., 2004a) and thus, are less competitive under the conditions
evaluated.
To address the final objective of comparing downstream processing costs, we
also needed to determine best adsorption conditions for HewLZ purification from egg-
white. Since SP-SepharoseTM purification resulted in only 89% purity, we tested a weak
cation exchange resin, CM-SepharoseTM, which was reported as a resin of choice for
HewLZ. The binding capacity and HewLZ purity using the weak cation exchanger was
determined at a single ionic strength of 10 mS (50 mM NaCl). The HewLZ saturation
capacity was 30 mg/mL for CM-SepharoseTM. The elution fractions with the majority of
HewLZ were pooled and resulted in a purity of 94% and yield of 95%. The highest
purity achieved with SP-SepharoseTM FF was 89% at the highest ionic strength evaluated
(15 mS). Elution peak fractions from both exchangers had similar protein profiles, but
the lysozyme purity was higher using CM-SepharoseTM FF (Figure 3.9). CM-
SepharoseTM FF was selected for process simulation analysis because of the higher
SepharoseTM FF was evaluated as an option for HewLZ purification but not for HuLZ
71
purification due to the reduced binding capacity of HuLZ at pH 6, which was the
minimum pH required for the weak exchanger to be fully charged.
Figure 3.9. SDS-PAGE of pH 6 adsorption experiments using (a) SP-SepharoseTM FF resin or (b) CM-SepharoseTM FF resin. Molecular weight markers (MW), load (egg-white clarified by precipitation and centrifugation), elution peak fractions, and HewLZ reference standard. Load conductivity was 15 mS for the SP-SepharoseTM experiment and 10 mS for CM-SepharoseTM experiment.
Process Simulation & Economics. The two purification processes, depicted in
Figures 3.10 and 3.11, were simulated to determine if the inferior binding properties of
human lysozyme and the effect of rice extract on the cation exchange adsorption would
translate into higher manufacturing costs of rice-derived HuLZ than HewLZ. The
objective of process simulation was to compare the relative processing costs under the
best adsorption and purification conditions. For this comparison, only downstream
processing related costs were considered. Raw material cost (transgenic rice and egg-
(a) (b) MW Load Elution Peak Fractions
kDa
200
116.3 97.4
66.3 55.4
36.5
31.0
21.5 14.4
6.0
MW Load Elution Peak Fractions HewLZ
72
white) were not included because of their inherent variability in pricing and cost drivers
external to processing such as co-product value, production location, and labor cost.
The selected processes analyzed were pH 4.5 extraction and purification of
HuLZ from rice using SP-SepharoseTM FF and pH 6 purification of HewLZ using CM-
SepharoseTM FF. The equipment cost and total capital investment comparison (TCI) for
HuLZ and HewLZ purification are given in Table 3.1. The equipment costs were
comparable for both processes because of similar volumetric throughputs, which was the
result of the HuLZ concentration in pH 4.5 rice extract being similar to that of HewLZ in
clarified egg-white. The direct fixed costs (DFC) and TCI were also similar as both are
directly proportional to the equipment cost.
Table 3.1. Comparison of capital costs for pH 4.5 HuLZ extraction and purification and pH 6 HewLZ purification. Direct fixed capital (DFC) was calculated using a Lang factor of 3. Values reported in $ per g lysozyme. Capital Cost ($/g) HuLZ HewLZ Equipment Cost 1.4 1.2 Direct Fixed Capital 4.1 3.7 Working Capital 0.12 0.11 Start-up Cost 0.20 0.18 Total Capital Investment 4.4 4.0
73
Table 3.2. Total manufacturing cost comparison and itemized cost comparison of direct and indirect manufacturing costs for pH 4.5 HuLZ extraction and purification and pH 6 HewLZ purification. Maintenance was assumed to be 3% of DFC for each process. Direct Manufacturing Cost ($/g) HuLZ HewLZ Reagents and Consumables 0.21 0.21 Labor and Operating Supplies 0.99 1.0 Utilities and Waste Disposal 0.10 0.06 Total Direct Manufacturing Cost 1.3 1.3 Indirect Manufacturing Cost ($/g) HuLZ HewLZ Maintenance 0.12 0.11 Depreciation 0.40 0.36 Total Indirect Manufacturing Cost 0.52 0.47 Total Manufacturing Cost 1.8 1.8
The total manufacturing costs reported in Table 3.2 include both the direct and
indirect costs. The direct cost includes the cost of reagents and consumables, labor and
labor-related operating supplies, utilities, and waste disposal. The indirect cost includes
maintenance and depreciation. Maintenance was estimated as 3% of the equipment cost
and depreciation was estimated using the straight line method over 10 years (Peters and
Timmerhaus, 1991). The analysis showed that the total manufacturing cost incurred by
the downstream processing for HuLZ was the same as that of HewLZ ($1.8/g).
Therefore, purifying lysozyme from rice rather than egg-white does not appear to be
different for the proposed processes.
The HuLZ and HewLZ processes were divided into sections to better understand
the process cost drivers. The process diagrams with unit operations included in each
section are shown in Figures 3.10 and 3.11. The production cost distribution (Figures
3.12a and 3.12b) indicates that ion-exchange chromatography is the major cost
74
contributor that accounts for 41% of the total cost for HuLZ and 36% of the total
production cost for HewLZ. The solid-liquid separation and diafiltration sections are the
next most expensive steps for both processes.
Because the ion-exchange section dominated the production cost, we report the
individual cost items that contribute to the total production cost for this section. The
itemized cost distribution identified facility and labor costs as the dominant factors
(Figure 3.13). The cost of the ion-exchange step could be reduced by using a lower cost
resin, increasing the number of cycles the resin can be used, and improved the binding
capacity. The binding capacity dictates the size of the chromatography column and the
number of columns needed for a given process.
Ultimately, the use of a chromatography step such as the cation exchange in
HuLZ purification presents a barrier to further process cost reduction. A bind and elute
process such as packed-bed chromatography is volume driven with almost no economy
of scale (Gottschalk, 2008). The use protein precipitation combined with ultrafiltration
may further reduce manufacturing cost of recombinant human lysozyme from rice but
probably at the expense of yield and purity.
Sensitivity analysis by individually varying binding capacity (10-60 mg/mL),
purity (75-95%), and rice flour cost ($0.25-4/kg) was performed but the variation in total
production cost was minimal compared to effect of the production rate and the economy
of scale.
75
Figu
re 3
.10.
Pro
cess
flow
shee
t sho
win
g th
e si
mul
ated
pro
cess
for p
urifi
catio
n of
hen
egg
-whi
te
lyso
zym
e fr
om e
gg-w
hite
. U
nit o
pera
tions
are
col
ored
cod
ed to
dis
tingu
ish
betw
een
sect
ions
.
76
Figu
re 3
.11.
Pro
cess
flow
shee
t sho
win
g th
e si
mul
ated
pro
cess
for p
urifi
catio
n of
hum
an ly
sozy
me
from
rice
ext
ract
. U
nit o
pera
tions
are
col
ored
cod
ed to
dis
tingu
ish
betw
een
sect
ions
.
77
4%12%
21%
36%
17%
10%Grinding
Extraction
Solid-Liquid Separation
Ion-Exchange Chromatography
Diafiltration
Drying
14%
18%
41%
16%
11% Precipitation
Solid-Liquid Separation
Ion-Exchange Chromatography
Diafiltration
Drying
Figure 3.12. Distribution of total production cost by section for (a) human lysozyme extraction and purification at pH 4.5 and (b) hen egg-white lysozyme purification at pH 6. The raw material costs (transgenic rice or egg-white) were excluded from section cost distribution.
(a)
(b)
78
7%
43%41%
5%
4%
Raw Materials
Facility
Labor
Consumables
Waste Treatment
9%
39%44%
5%
3%
Raw Materials
Facility
Labor
Consumables
Waste Treatment
Figure 3.13. Itemized cost distribution of ion-exchange chromatography for (a) human lysozyme extraction and purification at pH 4.5 and (b) hen egg-white lysozyme purification at pH 6.
(a)
(b)
79
Transgenic rice will have an additional cost beyond the typical production cost
for nontransgenic rice, incurred by identity preservation and containment for regulatory
compliance. Estimation for raw material cost as a percent of the total manufacturing
cost can range from 5-10% for highly purified pharmaceutical protein to 35-40% for an
industrial protein (Nikolov and Hammes, 2002). If the cost of transgenic rice was
assumed to be 10 times greater than the production cost of nontransgenic rice, the raw
material cost would account for 13% of the total production cost for the simulated
process. For the egg-white process, the raw material cost was 6% of the total cost when
egg-white was assumed to be $0.33/kg. Human lysozyme would likely be sold on a unit
activity base which gives it a significant advantage since it has 3-fold higher N-
acetylmuramoyl specific activity compared to HewLZ. The downstream processing
costs per 1 x 10⁶ units of activity would be $0.039 for HuLZ and $0.013 for HewLZ.
Another consideration is that HuLZ from rice can be sold at a premium since it is from a
hypoallergenic and animal-free production system.
80
SUMMARY
This study demonstrated that even though human lysozyme (HuLZ) and hen egg-
white lysozyme (HewLZ) have similar physico-chemical properties, purified HuLZ has
inferior binding properties to SP-SepharoseTM FF. HuLZ DBCs were lower than hen
egg-white lysozyme DBCs at pH 4.5, 6, and 7.5 with ionic strengths from 0 to 100 mM
NaCl (5-20 mS), except at pH 4.5 and 5 mS. The DBC of HuLZ was 74% lower than
that of HewLZ at pH 7.5, even though the pH was well below the reported HuLZ pI of
10.2. Rice extract components present in pH 4.5 extract reduced the DBC 31% for
HuLZ and 21% for HewLZ compared to purified lysozyme in buffer of the same pH and
ionic strength. The effect of rice extract on the lysozyme binding capacity was slightly
higher at pH 6, with reductions of 39% for HuLZ and 32% for HewLZ. The effect of
egg-white proteins on HewLZ adsorption was compared to the effect of clarified rice
extract at the same pH and ionic strength. The lysozyme binding capacities were
comparable; a capacity of 26 mg/mL for HewLZ was measured from spiked control rice
extract compared to 24 mg/mL for HewLZ in egg-white. Thus, purification of lysozyme
from rice was similar to that from egg-white using the proposed cation exchange
method. Furthermore, process simulation of the best processes for HuLZ purification
from rice and HewLZ from egg-white showed that the downstream processing costs
were comparable. Therefore, in spite of somewhat weaker interactions with the cation
exchange resin and rice extract complexity, the overall process and product potential of
HuLZ are promising.
81
CHAPTER IV
EFFECT OF PHYTIC ACID ON RECOMBINANT HUMAN LYSOZYME
PURIFICATION FROM TRANSGENIC RICE
OVERVIEW
Recombinant human lysozyme derived from transgenic rice requires an
optimized single chromatography step process to produce an economically viable
product for non-pharmaceutical applications such as nutraceuticals or antimicrobial food
and processing agents. Developing a process with a single chromatography step requires
careful consideration of the compatibility of the extraction conditions with the
subsequent purification step and optimization of the processing conditions. Therefore,
identifying and understanding critical rice extract components and their interactions are
imperative to designing an optimized process. In Chapter II, the processing conditions
which gave the highest purity significantly reduced the cation exchange binding
capacity. We hypothesize that the rice impurity, phytic acid, was primarily responsible
for the unacceptably low binding capacity. In addition, our data suggests that phytic
acid may also affect the extraction efficiency of human lysozyme at neutral pH. In this
study, we evaluated alternative extraction and purification methods in an attempt to
reduce the interference of phytic acid on lysozyme purification. Degrading phytic acid
in extracts using phytase enzyme, adding buffer ions that minimize phytic acid
interactions with lysozyme, and applying extraction conditions which reduce phytic acid
extractability were all effective methods in reducing phytic acid interference. Besides
82
phytic acid, we also found that phosphate salts and extraction buffer ions can affect
human lysozyme purification by cation exchange chromatography.
INTRODUCTION
The use of plant systems to produce pharmaceutical and nutraceutical proteins is
novel with the first commercial plant-made pharmaceutical product projected to reach
the market in 2009 (Sparrow et al., 2007). Optimization of processing conditions is
imperative for purification of protein products for non-pharmaceutical applications and
requires careful consideration of the compatibility of the extraction conditions with the
subsequent purification step. Human lysozyme from transgenic rice is one example;
attractive pricing of human lysozyme would allow it to take a share of the current hen
egg-white lysozyme market and generate its own niche market.
Human lysozyme is a 15 kDa, glycosidic enzyme that has numerous potential
therapeutic applications (Huang et al., 2006a; Huang et al., 2006b) based on its
antibacterial, antiviral, and antiinflammatory properties (Jollès, 1996; Lee-Huang et al.,
2005). High expression levels of human lysozyme in transgenic rice have been achieved
(Hennegan et al., 2005; Huang et al., 2002a) so additional reduction of manufacturing
costs will likely come from improvements in the efficiency of downstream processing
(purification).
Aqueous extracts of transgenic rice can contain starch, protein, ash (phosphorus,
potassium, magnesium, chlorine, calcium), fiber, and lipid impurities which must be
removed during purification (Juliano, 1980). Previous work suggests that besides native
proteins, phytic acid, phosphate salts, and extraction buffer may be impediments to
83
human lysozyme purification by cation exchange chromatography (Menkhaus et al.,
2004b; Wilken and Nikolov, 2006a; Wilken and Nikolov, 2006b). In Chapter II,
lysozyme extraction and cation exchange adsorption were independently optimized. We
were able to obtain high purity human lysozyme with a single chromatography step by
combining extraction at pH 4.5 with extract loading at pH 6 so that the slightly acidic
and neutral proteins (pI 6-7) extracted at pH 4.5 would not bind to the cation exchange
resin, SP-SepharoseTM FF. Although lysozyme purity was as high as 95%, the binding
capacity was reduced by 80% compared to pure lysozyme. In other cases (pH 4.5
extraction and adsorption or pH 6 extraction and pH 6 adsorption), rice extract
impurities only reduced binding capacity by 30% but additional purification steps would
be required to achieve lysozyme purities greater than 95%.
On the basis of these data, we hypothesize that phytic acid was primarily
responsible for the unacceptably low capacity when pH 4.5 extract was adjusted to pH 6
for adsorption. Phytic acid (myo-inositol hexakisphosphate) is the primary storage form
of phosphate that accounts for at least 80% of the total phosphorus content of brown rice
(Juliano, 1980). Brown rice typically contains 0.84-0.99% of phytic acid which exists
primarily as potassium, magnesium, and calcium phytate salts that are concentrated in
the germ and aluerone layer (Reddy, 2002). Structurally, phytic acid is the phosphoric
ester of inositol (hexahydroxycyclohexane) with 12 ionizable protons with pKa values
from 1 to 12 (Turner et al., 2002). Therefore, negatively charged phytic acid could
electrostatically bind positively charged cations, amino acids, and proteins (Weaver and
Kannan, 2002) or indirectly associate with negatively charged proteins, minerals, and
84
starch through polyvalent cations (Dendougui and Schwedt, 2004). Phytic acid-
lysozyme complexes are known to form between pH 6 and pH 9.5. Therefore, phytic
acid has been used as a buffer additive to reduce electrostatic interactions of lysozyme
with negatively charged silanol groups of the column wall in capillary electrophoresis
(Okafo et al., 1994; Okafo et al., 1995; Rodriguez and Li, 1999). In pH 4.5 transgenic
rice extracts, human lysozyme is the major protein present (>50% of total soluble
protein) and its highly basic nature makes it particularly susceptible to complex
formation with phytic acid. By binding phytic acid, the overall surface charge of
lysozyme would be reduced affecting the extent of lysozyme interaction with the
negatively charged cation exchange resin.
We also observed a similar interference with nontransgenic (control) rice flour
extract which suggested that the reduction of capacity and differential protein binding
(SDS-PAGE data) was not solely due to lysozyme interactions with phytic acid.
Because only low molecular weight (6-14 kDa) rice proteins were adsorbed from pH 4.5
control flour extract adjusted to pH 6, a possible blockage of the resin pores by other
non-protein phytate complexes seemed plausible. Siener et al. (2001) observed the
formation of insoluble calcium phytate by buffering to pH 6 and a drastic decrease of
phytic acid solubility in rice at pH 6 compared to pH 4.5. Formation of insoluble
phytate salts may explain the reduced adsorption of higher molecular weight proteins by
the cation exchange column. The adsorption behavior could also be manipulated with
the addition of various buffers suggesting other ionic interactions. For example,
adjusting pH 4.5 lysozyme rice flour extract to pH 6 with 1 M NaOH led to the
85
immediate precipitation of an extract compound in the chromatography column. The
addition of sodium phosphate buffer reduced precipitation and slightly improved the
lysozyme binding capacity. We hypothesized that phytate salts and/or phytic
acid/lysozyme complexes formed during pH adjustment precipitated on top of the resin
during loading which resulted in column plugging. A sample of the precipitate removed
from the column was analyzed and confirmed the presence of phytic acid and a protein
band of the same molecular weight as lysozyme was detected by SDS-PAGE
(unpublished data).
In protein purification, the composition and concentration of buffer ions should
also be taken into consideration (Newcombe et al., 2008). The isoelectric point (pI),
calculated by the amino acid sequence, is often relied upon to select chromatography
conditions (resin charge, buffer type, pH). However, the actual protein charge depends
on pH, ionic strength, and buffer type (Winzor, 2004) and specifically adsorbed buffer
ions (by electrostatic and non-electrostatic interactions) could lead to a reduction of the
net protein charge or even a protein charge reversal.
From the evidence presented above, we believe that a further investigation of the
effect of the rice impurity, phytic acid, and buffer ions on the purification of human
lysozyme by cation exchange adsorption is warranted. In this study, we evaluate
alternative extraction and purification methods to determine if phytic acid and/or buffer
ions contribute to the reduction of lysozyme binding capacity and to identify the
conditions that minimize the interference of rice extract impurities and/or buffer ions on
lysozyme extraction and purification.
86
MATERIALS & METHODS
Materials. Transgenic rice flour, control rice flour, and purified recombinant
human lysozyme were provided by Ventria Biosciences (Sacramento, CA). The control
flour was of the same genetic background as the transgenic flour (cultivar Taipei 309).
Crude phytase from wheat, phytic acid dodecasodium hydrate from rice, 2,2`-bipyridal,
ammonium iron sulfate dodecahydrate, and thioglycolic acid were purchased from
Sigma-Aldrich (St. Louis, MO).
Analytical Methods. Total Protein and Lysozyme Quantification. Total soluble
protein (TSP) was determined using the Bradford method (Bradford, 1976) with bovine
serum albumin as a standard. Lysozyme concentrations were determined by enzyme
activity assay (for extracts) and UV absorbance (for highly pure lysozyme solutions).
The enzymatic assay measures the decrease in turbidity of a M. luteus cell suspension
(Shugar, 1952). To measure lysozyme content, a modified microtiter plate method was
used with a 0.03% (w/v) cell suspension and 0-15 μg/mL human lysozyme standards.
Control flour extract was used in the preparation of standards to account for the
interference of extract components. Cell suspension (250 μL) was added to each 50 μL
sample and activity was monitored at 450 nm for 4 min with a Versamax plate reader
(Molecular Devices). When lysozyme was the only UV absorbing solution component,
lysozyme content was determined by absorption at 280 nm (Beckman DU 600) using an
extinction coefficient of 2.46 mL/mg-cm.
Protein Analysis by SDS-PAGE. The protein molecular weight profiles of
chromatography fractions were evaluated by electrophoresis as described by Laemmli
87
(1970). Samples were loaded on 8-16% tris-glycine gels under non-reducing conditions
with Mark12TM protein standards (Invitrogen).
Phytic Acid Quantification. The phytic acid (myo-inositol hexakisphosphate)
content of rice extracts was analyzed using an indirect detection method, which is based
on the strong iron chelating ability of phytic acid and measures the amount free iron in
solution (Haug and Lantzsch, 1983; Reichwald and Hatzack, 2008). The method was
adapted for use in a microplate assay format using sodium phytate as a standard.
Experimental Methods. Preparation of Control and Lysozyme Rice Flour
Extracts. To prepare extracts, 20 g of control or transgenic rice flour was added to 100
mL extraction buffer and mixed continuously for 1 hr. The extraction buffers used were
50 mM sodium acetate (pH 4.5), 50 mM sodium phosphate (pH 6), or 50 mM sodium
carbonate (pH 10) with 50 mM NaCl. Extracts were centrifuged at 12,000 x g for 15
min and then filtered through No.5C filter paper (Micro Filtration Systems) followed by
a 0.45 μm cellulose acetate filter (Nalgene).
Phytase-treated Extracts. Lysozyme rice flour extract was prepared as described
above. After clarification by centrifugation and filtration, 177 mg of phytase in 25 mL of
pH 4.5 buffer was added to 250 mL of extract and mixed overnight. The amount of
phytase added and treatment time was selected based on phytase kinetics. After mixing,
the treated extract was filtered with 0.2 µm surfactant-free cellulose acetate filter
(Nalgene), adjusted to pH 6 with 1 N NaOH or 1 M sodium phosphate, and filtered with
a 0.2 µm Acrodisk syringe filter (Pall). In some cases, clarified extract was diluted with
RO water to reduce conductivity prior to cation exchange adsorption.
88
TRIS-adjusted Extract. Lysozyme rice flour extract was prepared as described.
After clarification by centrifugation and filtration, the extract was adjusted to pH 6 by
adding 5 mL of 1 M TRIS for each 95 mL of clarified extract (final TRIS concentration
was 50 mM) and 1 M NaOH. The pH adjusted extract was filtered with a 0.2 µm
surfactant-free cellulose acetate filter (Nalgene) prior to cation exchange adsorption.
Acidic Precipitation of pH 10 Extract. After extraction at pH 10, clarified
extracts were adjusted to pH 4.5 with 5 M acetic acid and mixed slowly for 45 min to
precipitate rice protein, centrifuged at 12,000 x g for 15 min at room temperature, and
then filtered through No. 5C filter paper (Micro Filtration Systems) followed by a 0.45
μm cellulose acetate filter (Nalgene). The clarified extract was either loaded directly at
pH 4.5 or adjusted to pH 6 with 3 N NaOH. For the extract adjusted to pH 6, RO water
was added to reduce the conductivity from 16 mS to 12 mS.
Binding and Elution of Transgenic Rice Extracts. The effect of various
alternative processing methods on the binding capacity, purity, and yield of lysozyme
was evaluated. Each lysozyme rice flour extract was prepared as described previously
with 50 mM NaCl in either 50 mM sodium acetate, pH 4.5, or 50 mM sodium carbonate,
pH 10. Extracts at pH 4.5 were adjusted to pH 6 using 1 N NaOH or 1 M sodium
phosphate, pH 7, before loading onto the ion exchange column. Extracts at pH 10 were
adjusted to pH 4.5 or pH 6 (with 1 M NaOH) before loading. Wash and elution buffers
were prepared and pH adjusted using the same procedures as the extracts to ensure the
same buffer composition and ionic strength. Chromatography experiments were
conducted using a Bio-Rad (Hercules, CA) BioLogic LP chromatography system with
89
LP DataView Software. Extracts were filtered through filter paper (Micro Filtration
Systems No. 5C) followed by a 0.45 μm cellulose acetate filter (Nalgene) to produce a
clarified extract. Clarified extracts were loaded at a flow rate of 1 mL/min (300 cm/h)
onto a 0.5 x 5.5 cm SP-SepharoseTM FF column (Tricorn, GE Healthcare) until lysozyme
saturation. The column was washed with 20 column volumes (CV) of the respective
binding buffer and the bound protein was eluted by linear gradient from 0.05 M to 1 M
NaCl over 40 CV. Elution peak fractions (3 mL) were collected and analyzed for
lysozyme and total protein content and by SDS-PAGE. Lysozyme yields were
calculated as a percent of total bound lysozyme. Lysozyme purity in elution peak
fractions or pooled fractions was calculated by lysozyme activity and total protein.
RESULTS & DISCUSSION
The overall objective for lysozyme purification from transgenic rice was to
obtain greater than 95% purity lysozyme using a single chromatography step. Our
previous work demonstrated that using pH 4.5 extraction followed by pH 6 adsorption
(Table 4.1) was the only way to achieve greater than 90% purity in one step (Wilken and
Nikolov, 2006b). Therefore, we focused this study on finding process conditions that
could improve lysozyme binding capacity while maintaining purity. The previous data
suggested that phytic acid affected the cation exchange binding capacity and final
lysozyme purity, so three process alternatives were evaluated to reduce its interference.
The approaches investigated were 1) hydrolysis of phytic acid to inositol with phytase,
2) extraction of lysozyme at a pH which reduces phytic acid content, and 3) shielding of
phytic acid with TRIS counter ions.
90
Table 4.1. Effect of extraction and adsorption pH on the binding capacity and purity of lysozyme after cation exchange adsorption. Capacity was determined from the breakthrough curve and given in mg lysozyme/mL SP-SepharoseTM FF resin.
Extraction pH
Adsorption pH
Capacity (mg/mL resin)
Lysozyme Purity (%)
4.5 4.5 43 89 4.5 6 8.6 95 6 6 24 50 Adsorption and Purification from Phytase-treated Extracts. To demonstrate
the process benefits of reducing the phytic acid concentration, pH 4.5 extracts were first
treated with phytase (an enzyme that cleaves phosphate groups from myo-inositol). The
results of phytic acid degradation by phytase in control and lysozyme rice flour extracts
are summarized in Figure 4.1. The degradation rate of phytic acid was much greater in
the control extract with phytic acid concentration reaching the detection limit after 5.5 h.
There were no measurable changes in phytic acid concentration during the first 6.5 h of
incubation of lysozyme rice flour extracts. It took an overnight incubation to reduce the
phytic acid content in the lysozyme rice flour extract to the same level as the control
extract. Because control extract was quickly degraded, we believe that the slower rate of
degradation was probably due to phytic acid/lysozyme complexes that hindered enzyme
access to phosphate moieties on the inositol ring.
91
0
10
20
30
40
50
60
70
80
0 2 4 6 8 10
Phyt
ic A
cid
(µg/
mL
)
Time (h)
Lysozyme Rice Flour Extract
Control Rice Flour Extract
Figure 4.1. Kinetics of phytic acid (µg phytic acid/mL extract) degradation by phytase in pH 4.5 lysozyme rice flour extract and pH 4.5 control rice flour extract.
Phytase-treated extracts were then adjusted to pH 6 with either 1 M sodium
hydroxide or 1 M sodium phosphate (Figure 4.2). These two cases were of particular
interest because their impact on lysozyme binding was significant and would allow us to
quantify process-relevant changes (binding capacity and purity).
Effect of Extract Adjustment with 1 M NaOH. When loading lysozyme rice
flour extracts without phytase pretreatment, a white precipitate formed on the top of the
cation exchange resin and plugged the column. Overnight treatment of the extract with
phytase, prevented column plugging during loading of the extract (adjusted to pH 6 with
sodium hydroxide). The mere fact that no precipitate was seen and no column plugging
occurred confirmed our suspicion that phytate was the cause of precipitation. Elution
peak fractions with the greatest amount of lysozyme were pooled, resulting in a pool
92
purity of 97% (Table 4.2). A total of 15.2 mg lysozyme (97% of eluted lysozyme) was
recovered in the lysozyme pool. The resin adsorption capacity in this case was 77%
greater than in the previous best process (pH 4.5 extract adjusted to pH 6 with phosphate
for cation exchange adsorption), which resulted in the highest lysozyme purity of 95%
(Table 4.2). These results support our hypothesis that phytic acid contributed to the
plugging of the chromatography column.
Transgenic Rice Flour
50 mM NaAcetateand 50 mM NaCl
pH 4.5 Extraction
Filtration
PhytaseTreatment
Phytase Overnight at RT
Adjust pH
Rice ImpuritiesIEX
1 M NaOH or 1 M Phosphate
Purified Lysozyme
1 h at RT1:10 Flour to Buffer Ratio
Centrifugation Rice Insolubles
Figure 4.2. Process diagram for extraction, phytase treatment, and purification of lysozyme from the treated extract. After phytase treatment and clarification by centrifugation, the pH of the extract was adjusted to 6 with either sodium hydroxide (NaOH) or 1 M phosphate buffer. RT (room temperature) was 25°C.
93
Effect of Extract Adjustment with 1M Phosphate. Since phytase treatment
improved binding capacity for the NaOH adjusted sample, we wanted to determine
whether phytase treatment would also improve the binding capacity for pH 4.5 extract
adjusted to pH 6 with phosphate buffer. Phosphate buffer was originally used in the
process to prevent precipitation during pH adjustment.
After phytase treatment at pH 4.5, the extract was pH adjusted and loaded
directly on the cation exchange column. The amount of eluted lysozyme and lysozyme
purity were significantly lower than that of NaOH-adjusted extracts (Table 4.2) and also
lower than phosphate-adjusted untreated extract. The lysozyme pool for the phosphate-
adjusted extracts experiment contained 4.8 mg of lysozyme with a purity of 85%, lower
than the 14.7 mg of lysozyme eluted with 97% purity for NaOH-adjusted extracts and
the 8.6 mg with 95% purity eluted for untreated extracts. We believe that inferior
binding and lysozyme purity resulted from a combined effect of higher ionic strength
and phosphate ion concentration. Therefore, we conclude that 1 M NaOH is the best
option for pH adjustment of phytase-treated extracts. The effect of extract conductivity
and buffer counterions on lysozyme purification will be discussed later in this chapter.
Table 4.2. Summary of lysozyme purification from phytase-treated extracts. The reported amount of lysozyme eluted was calculated by pooling elution peak fractions collected between 14 and 30 mS. For each experiment, the same elution peak fractions were pooled.
Extraction pH
Adsorption pH
Solution Used to
Adjust pH
Conductivity (mS)
Lysozyme Eluted (mg)
Lysozyme Purity
(%) 4.5 6 NaOH 13 14.7 97 4.5 6 PO4 16 4.8 85
4.5 (Not treated) 6 PO4 16 8.6 95
94
Effect of pH 10 Extraction on Lysozyme Adsorption and Purification. The
treatment of extract with phytase to reduce the phytic acid content clearly improved
lysozyme adsorption from NaOH-adjusted extract and lysozyme purity upon elution
from the cation exchange column. Therefore, it appeared prudent to test if extraction pH
could be used to reduce the amount of extracted phytic acid and also reduce
lysozyme/phytic acid interactions. Extraction at pH 10 was selected for two reasons: 1)
the amount of phytic acid extracted was lowest at pH 10 compared to pH 2, 4, and 6 with
0.3 mg/g extracted at pH 10 compared to 0.5 mg/g flour at pH 2 and 2) near zero net
charge of lysozyme at pH 10 (pI 10.5). The main concern for pH 10 extraction was
whether lysozyme could be readily extracted at this pH since protein solubility is
typically minimized close to the isoelectric point (pI).
pH 10 Extraction. To assure that pH 10 could lead to a commercially viable
lysozyme recovery process, we compared the amount of lysozyme extracted at pH 10
with 50 mM sodium carbonate in the presence of NaCl to previous extraction data at pH
4.5 and 6.5 (Figure 4.3). At pH 10, the amount of extracted lysozyme varied from 2.7
(±0.1) to 3.5 (±0.3) mg/g flour as the NaCl concentration varied from 0 to 300 mM. The
pH 10 extracts had less lysozyme than pH 4.5 extracts for all NaCl concentrations.
Lysozyme extractability was less dependent on the salt concentration at pH 10 than at
pH 6, which was similar to the salt effect observed at pH 4.5.
95
0.0
0.5
1.0
1.5
2.0
2.5
3.0
3.5
4.0
4.5
5.0
0 50 100 150 200 250 300 350
Lyso
zym
e (m
g/g
flour
)
NaCl Concentration (mM)
pH 4.5 pH 6.5 pH 10
Since human lysozyme adsorption to SP-SepharoseTM FF was highly dependent
on load conductivity, 50 mM NaCl was typically the maximum salt concentration
acceptable for adsorption at pH 6 (Wilken and Nikolov, 2006b). Therefore, the lower
salt dependency at pH 10 provides more flexibility in selecting optimal conditions for
adsorption (50 mM NaCl ) without sacrificing the extraction yield. Interestingly,
lysozyme extractability at 50 mM NaCl (10 mS) was higher at pH 10 than at pH 6.5 and
pH 7.5 (Figure 4.4). This was unexpected because protein extractability is typically
lowest when the pH is close to the pI of a protein. A disadvantage of pH 10 extraction
was the drastic increase in total protein extracted compared to the other extraction pHs
evaluated (Figure 4.4). For pH 10 and 50 mM NaCl (10 mS), the amount of total soluble
protein extracted was 15.4 (±0.6) mg/g flour. Lysozyme only accounted for 17% of total
soluble protein, which was comparable to pH 6.5 but significantly lower than pH 4.5
Figure 4.3. Extraction of human lysozyme at pH 10 as a function of salt concentration compared to previous data reported in Chapter II. Error bars indicate standard deviation of triplicate extractions.
96
where 60% of the total protein extracted was lysozyme. These extraction results suggest
that at neutral pH, electrostatic interactions with plant cell components reduced the
extractability of lysozyme. Improved extractability of human lysozyme at pH 10
compared to pH 6.5 indicates that the lower net charge of lysozyme may have reduced
interactions with negatively charged plant cell components. Thus, except for the total
protein content, extraction at pH 10 could be a reasonable alternative to pH 4.5
extraction.
0
2
4
6
8
10
12
14
16
4.5 6.5 7.5 10
Total Solub
le Protein (m
g/g)
Extraction pH
Native Rice Protein Lysozyme
Figure 4.4. Effect of pH on the extraction of human lysozyme and total soluble protein from transgenic rice. Each extraction was performed with 50 mM buffer with 50 mM NaCl and results are reported in mg total soluble protein/g flour.
The addition of a protein precipitation step was considered necessary to reduce
native protein content and to compare lysozyme adsorption and purification under
conditions similar to phytase-treated extracts. Precipitation of pH 10 extracts reduced
97
the total soluble protein from 3.8 mg/mL to 1.0 mg/mL for lysozyme rice flour extract
and from 1.8 mg/mL to 0.5 mg/mL for control rice extract. Lysozyme was only 1% of
the total protein present in the precipitate. Thus, using acidic precipitation was an
effective way to eliminate >70% of the total protein from pH 10 extract without losing
lysozyme in the precipitate.
Adsorption and Purification from Acidified pH 10 Extracts. Although the
overall goal of this paper was to evaluate process alternatives for lysozyme purification
at pH 6, the effect of pH 10 extraction and precipitation on lysozyme adsorption was not
previously investigated and warranted evaluation at both pH 4.5 and pH 6. We
compared the adsorption and purification of lysozyme from clarified pH 4.5 extract and
the same extract adjusted to pH 6 (Figure 4.5).
The data for binding capacity and lysozyme purity are given in Table 4.3. A
total of 44.9 mg of lysozyme was adsorbed from pH 10 clarified extract that was loaded
at pH 4.5 compared to the 26.7 mg of lysozyme from the same extract adjusted to pH 6.
The amount of total protein that was bound to the cation exchange column was also
greater for pH 4.5 load (81 mg) than the pH 6 load (31 mg). The elution peak profiles
shown in Figure 4.6 also indicate that there was a significant reduction in bound protein
at pH 6 compared to pH 4.5. For adsorption at pH 4.5, lysozyme purity in the pooled
fractions was 84% with a yield of 81%. At pH 6, lysozyme purity was 95% for the
pooled fractions with a yield of 95% (Table 4.3). Based on these results, there was
better separation between lysozyme and native rice proteins if the extract was adjusted to
pH 6 for adsorption than if the extract was loaded onto the cation exchange column at
98
pH 4.5. The elution profiles for pH 10 control extract and lysozyme rice extract loaded
at pH 6 compared in Figure 4.6 indicate that native rice proteins eluted at a higher
conductivity than lysozyme which resulted in higher lysozyme purity.
pH 10 Extraction
Centrifugation
Acid Precipitation
Clarification
IEX
Adjust pH
50 mM NaCarbonateand 50 mM NaCl
Rice Insolubles
1 h at RT1:10 Flour to Buffer Ratio
IEX
Purified Lysozyme
Purified Lysozyme Rice Impurities
1 M NaOH
Transgenic Rice Flour
5 M Acetic Acid
Precipitate
Rice Impurities
Figure 4.5. Process diagram for pH 10 extraction followed by acid precipitation and cation exchange adsorption. The proposed method was evaluated to try to reduce the effect of phytic acid on lysozyme purification. After precipitation and centrifugation, clarified extract was loaded at pH 4.5 or adjusted to pH 6 before loading onto the cation exchange column.
99
Table 4.3. Data summary for pH 10 extraction followed by acidic precipitation and cation exchange adsorption at pH 4.5 or pH 6. Extracts were pH adjusted with pH 4.5 and loaded directly or adjusted to pH 6 for adsorption with 1 M NaOH. The amount of lysozyme eluted between 12 and 36 mS (6-18 CV) was compared.
Extraction pH Adsorption pH Conductivity (mS)
Lysozyme Eluted (mg)
Lysozyme Purity (%)
10 4.5 11 36.2 84 10 6 12 25.5 95
For pH 10 extract loaded at pH 4.5, the lysozyme binding and purity were similar
with the data from pH 4.5 extract loaded at pH 4.5 reported previously (Wilken and
Nikolov, 2006b). For applications that require lysozyme of greater than 90%, adsorption
at pH 6 would be a better alternative even though the amount of eluted lysozyme was
reduced compared to pH 4.5. Most importantly, the acidified and clarified pH 10 extract
could be adjusted to pH 6 with sodium hydroxide without the formation of a precipitate
or reduction in binding capacity observed previously with pH 4.5 extracts (Wilken and
Nikolov, 2006b). This indicates that the non-protein compound, presumably phytic acid,
which caused precipitation on the column for pH 4.5 extracts was not extracted at pH 10.
The SDS-PAGE protein profiles in Figure 4.7 appear to support this conclusion as eluted
fractions from pH 4.5 extract adjusted to pH 6 contained only low molecular weight
proteins. The same behavior was not observed for pH 10 extract that was precipitated at
pH 4.5 and then adjusted to pH 6, as higher molecular weight proteins were bound and
then eluted from the cation exchange column. In other words, in the absence of pore
plugging high molecular weight proteins were able to diffuse into the resin pores and
interact with the cation exchange ligand.
100
0
10
20
30
40
50
60
0
0.2
0.4
0.6
0.8
1
1.2
1.4
1.6
1.8
2
2.2
2.4
2.6
0 5 10 15 20 25 30
Con
duct
ivity
(mS)
Abs
orba
nce
Uni
ts
Column Volumes
Adj. to pH 4.5 (11 mS) Adj. to pH 6 (12 mS)Adj. to pH 6 CE (12 mS) Conductivity
Figure 4.6. Elution profile comparison for pH 10 lysozyme rice flour extract and pH 10 control extract (CE) loaded at pH 4.5 or pH 6. The profiles show the reduction of bound protein for pH 10 extract loaded at pH 6 compared to extract loaded at pH 4.5. The control extract (CE) elution peak indicates that native rice proteins eluted at higher ionic strength than lysozyme.
Figure 4.7. Protein profiles for elution peak fractions for (a) pH 4.5 control extract adjusted to pH 6 for cation exchange adsorption with phosphate and (b) pH 10 control extract precipitated at pH 4.5 and adjusted to pH 6 with sodium hydroxide. For (a), only low molecular weight proteins were eluted which indicated pore blockage by a phytate complex which was not seen with pH 10 extract.
Adsorption and Purification from TRIS-adjusted Extracts. TRIS buffer
(TRIS(hydroxymethyl)aminomethane), a primary amine with a pKa of 8.1, was
evaluated as an alternative to using phosphate buffer for pH adjustment of pH 4.5
extracts or phytase treatment of extract before adsorption. The working hypothesis was
that the positively charged TRIS cations would reduce electrostatic interactions between
phytic acid and lysozyme and eliminate precipitate formation with pH adjustment. The
elution chromatogram and corresponding gel analysis of the TRIS-adjusted extract that
was loaded onto the SP-SepharoseTM cation exchange column are presented in Figure
4.8. The pooled peak fractions 1-6 contained 25 mg of lysozyme with 98% purity.
Eluted fractions from pH 4.5 extract adjusted to pH 6 with TRIS also had similar protein
molecular weight profiles as those from pH 10 extract loaded at pH 6 after precipitation
at pH 4.5. This seems to indicate that TRIS eliminated the effects of phytic acid which
prevented the cation exchange adsorption of higher molecular weight proteins from pH
4.5 extracts adjusted to pH 6 with phosphate.
102
0
10
20
30
40
50
60
70
80
90
100
0
0.2
0.4
0.6
0.8
1
1.2
1.4
1.6
1.8
2
0 5 10 15 20 25 30 35 40
Con
duct
ivity
(mS)
Abs
orba
nce U
nits
Column Volumes
Absorbance at 280 nmConductivity
Figure 4.8. Elution profile (a) showing peak fractions analyzed by SDS-PAGE (b). Load solution was clarified pH 4.5 extract adjusted to pH 6 with 1 M TRIS for adsorption. Protein profile for molecular weight markers (MW), load, and elution peak fractions (1-12). Numbered lanes correspond to fraction number in elution peak chromatogram. The arrow shows the position of human lysozyme.
MW 6 7 8 9 10 11 12
1 2 3 4 5 6 7 8 9 10 11 12
kDa
200
116.3 97.4
66.3 55.4
36.5 31.0
21.5 14.4
6.0
(a)
(b)
MW Load 1 2 3 4 5
103
Table 4.4. Summary of lysozyme purification from extracts adjusted from pH 4.5 to pH 6 for cation exchange adsorption on SP-SepharoseTM FF. For pH 10 extract, an acidic precipitation (Ppt) step was used before adsorption.
Extraction pH
Adsorption pH
Solution Used to Adjust pH
Lysozyme Eluted (mg)
Lysozyme Purity (%)
4.5 Phytase-treated 6 NaOH 14.7 97
4.5 6 TRIS 25.0 98 4.5 6 PO4 8.6 95 10
Acidic Ppt 6 NaOH 25.5 95
Lysozyme adsorption data presented in Table 4.4 compare TRIS-adjusted extract
to phytase-treated and acidified pH 10 extracts. TRIS adjustment was clearly
advantageous for human lysozyme purification from rice extract, as we measured an
almost 3-fold increase in eluted lysozyme from extract adjusted to pH 6 in the presence
of 50 mM TRIS instead of 50 mM sodium phosphate. The 3-fold improvement by
substituting phosphate buffer with TRIS buffer was somewhat surprising. TRIS cations
are not typically used in cation exchange chromatography since the buffer cations can
shield the negatively charged resin binding sites (Jacob and Frech, 2007). However,
Azzoni et al. (2005) also found that the binding capacity of another basic protein,
aprotinin (pI=10.5), on SP-SepharoseTM FF was higher in 20 mM TRIS than in 30 mM
sodium phosphate. Thus, TRIS ions at a concentration of 50 mM or less have a
beneficial effect on lysozyme adsorption. Apparently, positively charged TRIS ions at
pH 6 reduce the effective phosphate charge of phytic acid and, thus, reduce the
formation of lysozyme-phytic acid binary complexes.
104
The amount of eluted lysozyme from TRIS-adjusted extract was greater than that
from phytase-treated extract (sodium hydroxide adjusted) but both processes gave
similar final lysozyme purities (Table 4.4). TRIS-adjusted extracts had similar capacity
and purity to acidified pH 10 extract. In summary, the three approaches we evaluated
could be used to produce lysozyme with higher than 95% purity with a single
chromatography step. These results further indicate that electrostatic interactions
between lysozyme, phytic acid, and rice extract impurities affect both the adsorption and
purity of lysozyme.
Effect of Phosphate on Lysozyme Adsorption and Purification. After phytase
treatment of pH 4.5 extract, the extract that was adjusted to pH 6 with 1 M phosphate
showed inferior binding and lysozyme purity than sodium hydroxide adjusted extract.
We attributed that difference to the combined effect of higher conductivity (ionic
strength) and phosphate ion concentration. The effect of reducing both the phosphate
ion concentration and conductivity was determined by diluting phosphate-adjusted
extracts from 16 mS to 13 mS or 11 mS prior to cation exchange adsorption. The
amount of bound and eluted lysozyme and total protein for extracts loaded at 16, 13, and
11 mS were then compared.
Comparing the elution peaks for each experiment (Figure 4.9) demonstrates the
effect of load (pH adjusted extract) conductivity on the protein binding capacity, which
is reflected by the peak area. The largest elution peak corresponded to extract loaded at
the lowest conductivity (11 mS). The elution peak fractions were split into two pools
based on elution conductivity. Results for pooled fractions (eluted between
105
conductivity of 14 and 30 mS) from the adsorption experiments of phytase-treated
extracts are summarized in Table 4.5. When the pH adjusted extract was loaded at 16
mS (without dilution), only 4.8 mg of lysozyme was recovered and the purity was 85%.
Diluting the extract from 16 mS to 11 mS increased the amount of adsorbed lysozyme
from 4.8 mg to 19.7 mg and increased the purity of recovered lysozyme from 85% to
98%. The lower lysozyme purity (85%) at the highest conductivity (highest phosphate
concentration) suggests that the negatively charged phosphate ions are shielding
positively charged moieties on the surface of lysozyme, reducing cation exchange
binding sites. This is further supported by comparing the amount of lysozyme bound
from extracts loaded at the same conductivity (13 mS) in the presence and absence of
phosphate buffer ions (Table 4.5). The amount of lysozyme bound to the cation
exchange column from phytase-treated extract adjusted to pH 6 with only sodium
hydroxide was greater than the extract adjusted with phosphate. This indicates that
phosphate ions in addition to the conductivity affect the binding capacity of lysozyme.
For example, Rabiller-Baudry and Chaufer (2001) have estimated that phosphate
interactions with hen egg-white lysozyme reduced the effective charge from +5 to +3
when 1-20 mM phosphate buffer is replaced with 50-500 mM phosphate buffer.
Therefore, regardless of the solution used to adjust extract pH (NaOH or phosphate),
treating extracts with phytase may not be advantageous because release of additional
phosphate ions could also reduce the binding capacity of lysozyme.
106
0
0.2
0.4
0.6
0.8
1
1.2
1.4
1.6
1.8
2
2.2
10 15 20 25 30 35 40 45 50
Abs
orba
nce U
nits
Gradient Elution Conductivity (mS)
NaOH Adjusted Extract (13 mS)
Phosphate Adjusted Extract (16 mS)
Diluted Phosphate Adjusted Extract (13 mS)
Diluted Phosphate Adjusted Extract (11 mS)
Figure 4.9. Elution peak comparison for phytase-treated pH 4.5 extracts adjusted to pH 6 with NaOH or phosphate which shows the effect of load conductivity on protein binding capacity. Conductivity given in parenthesis represents the extract conductivity after pH adjustment. Table 4.5. Summary of lysozyme purification from phytase-treated extracts (NaOH or phosphate adjusted) as a function of load conductivity. The reported amounts of lysozyme were calculated by pooling elution peak fractions collected between 14 and 30 mS. For each experiment, the same elution peak fractions were pooled.
were conducted at the Bioseparations Lab at Texas A&M University. Dry-milled germ
(SunRich Food, Cresco, IA) with 33% starch, 15% protein (PDI of 56%), 16% oil, and
3.8% fiber (% db) was used as the starting material for all experiments. The germ was
from corn that was field dried to maintain a high PDI. The effect of three different soak
water pHs (pH 3, 6, 9), two temperatures (25°C, 60°C), and four soaking times (0.5, 2, 4,
117
and 8 hr) on the composition of the soaked germ was determined. Another set of
experiments was conducted at pH 6 and 60°C with 0.01% α-amylase to determine if the
addition of this enzyme would reduce starch.
For each experiment, 200 g of the dry-milled germ was added to a 1 L
Erlenmeyer flask and either 400 mL (25°C soaking) or 425 mL (60°C soaking) of tap
water was added to the flask and placed in a water bath. The pH of the soak water was
adjusted with either 1 M NaOH or 2 M HCl and once the desired pH was reached, the
soak time started. The suspension was mixed periodically by shaking and the pH was
maintained at the respective value throughout soaking. After soaking, the wet germ
mass and soak water mass were individually measured. The germ was rinsed with tap
water and then fresh water was added for grinding (sufficient water to cover the germ in
the flask). The germ was mixed with an overhead mixer (Arrow 850, Arrow
Engineering Co.) to knock off any loosened starch. After grinding, the germ was
removed with a mesh strainer and placed in a starch solution (8 Bé) to separate the clean
germ from the low purity germ. The clean germ (floaters) was recovered with a strainer,
rinsed with water, and weighed. The clean germ was placed in an aluminum dish and
dried at a temperature of 37-43°C to avoid protein denaturation. The mass of the germ
was measured throughout drying and once the mass was constant, the germ was removed
and stored at 4°C for later analysis. The germ samples were analyzed for protein, PDI,
starch, ash, and crude fat.
Pilot-scale Studies: Soak Water Analysis. Pilot plant trials were conducted at the
Food Protein Research & Development Center at Texas A&M University (College
118
Station, TX). Dry-milled germ, prepared by Didion Milling (Cambria, WI), was used as
the starting material and had 16.4% protein (58.3% PDI), 26.9% starch, 22.3% oil, and
4.9% crude fiber (% db).
For each pH 4.5 and 25°C soaking experiment, 10 kg of germ was added to 33 L
of water (with 0.01% α-amylase) in a stainless steel tank equipped with a pump and
circulating loop. The pH was adjusted to 4.5 with 1.5 M phosphoric acid and soak
water circulation started immediately. For pH 7.5 and 60°C (50°C ≤ T ≤ 60°C)
experiments, the same soaking procedure was used except the germ was added to 39 L
of preheated water. The additional 6 L of water was needed at the higher temperature to
completely submerge the germ. Soak water samples were taken at 1, 2, 4, and 6 h for
total soluble protein, SDS-PAGE, and phytic acid analyses.
Pilot-scale: Germ Composition Analysis. After soaking, the steep water and
germ were transferred to a Bauer hammer mill. After grinding, the Baumé level of the
steep water was checked and then a hydroclone (Dorr-Oliver) was used to separate the
clean germ (low-density) from the high-density fraction (lower oil purity germ and germ
fractions). The high-density fraction was passed through the Bauer hammer mill until no
additional clean germ was recovered. The clean germ and high-density fraction were
rinsed, dried, and weighed. After drying, the clean germ was aspirated to remove fiber
and reweighed.
Extraction of Defatted Corn Germ Flour. Extraction and precipitation methods
were based on those proposed by Nielsen et al. (1973). Defatted corn germ flour (30 g)
was gradually added to 300 mL pre-heated water (T ≤ 50°C) as pH was adjusted to 8.7
119
with 1 N NaOH. The mixture was blended with a Silverson L4RT high shear mixer at
4500 rpm until the temperature reached 50°C. Once this temperature was reached, the
extraction time of 30 min was started. The required temperature and pH were
maintained throughout the extraction. The extract was then clarified by centrifugation
(Beckman Coulter Allegra 25R) at 10,000 x g and 20°C for 15 min. Exhaustive
extraction experiments (3-stage and 5-stage) of defatted corn germ (DCG) flour were
performed. In this study, only a single stage extraction was used because the main
objective was to determine the effect of multiple processing steps and conditions on
protein recovery.
Corn Protein Concentrates by Precipitation. The protein was precipitated from
the clarified extract by adjusting the pH to 4.7 with 1.5 M phosphoric acid or 1 M HCl
and mixing slowly for 1 hr. The protein precipitated was removed by centrifugation at
10,000 x g and 20°C for 15 min and then washed with 50 mL of water. After 15 min
centrifugation (10,000 x g at 20°C), the wash water was decanted, and the precipitate
washing procedure was repeated. To resolubilize the precipitate, RO water was added
and the pH was adjusted to 7 with 1 M NaOH. The slurry was added to a glass baking
dish, placed in a freezer overnight, and freeze dried (Labconco Freezedry 5) for 72 h.
The clarified extract, the precipitate supernatant, and the wash supernatants were
analyzed for total soluble protein and by SDS-PAGE.
Corn Protein Concentrate by Membrane Filtration. HPHPG (high protein, high
PDI germ) was prepared at Iowa State University (Ames, IA) by soaking dry-milled
germ (SunRich Food, Cresco, IA) for 30 min at neutral pH and room temperature.
120
Conditions to prepare HPHPG were selected to maintain PDI during soaking and drying
of germ. Full-fat germ flakes were ground and defatted at the Bioseparations Lab (Texas
A&M University) using 5, 30 min hexane extractions (1:5 germ flour: hexane) at room
temperature. The defatted germ flakes were dried at room temperature. HPLPG (high
protein, low PDI germ) was used to prepare corn protein concentrate by membrane
filtration. The wet HPHPG was stored for 4 months in the freezer, dried, and then
defatted using liquid propane (Ambient Temperature Extraction Partners, Santa Barbara,
CA).
Clarified corn germ extracts were prepared as described previously. All extracts
were pre-filtered (VWR Grade 410 filter paper) prior to membrane filtration. The
extracts were then processed by cross-flow filtration using a Millipore Labscale TFF
System with a 0.45µm PVDF, 10 kDa PES, or 30 kDa PES membrane (Millipore
Pellicon XL) with a surface area of 50 cm2. For the 10 kDa membrane experiments,
filtration was performed with clarified corn germ extract and also with resolubilized
protein precipitate (after isoelectric precipitation of extract at pH 4.7). Constant volume
diafiltration was done using 1-2 volumes of RO water followed by UF concentration.
Corn protein concentrate was also prepared by direct membrane filtration of clarified
extract with a 30 kDa membrane and also by a 2-stage process (membrane filtration
followed by isoelectric precipitation of 30 kDa retentate at pH 4.7). After the 1 hr
precipitation step, the solution was clarified for 15 min by centrifugation at 10,000 x g
and 20°C. The precipitate was washed with 50 mL RO water, centrifuged (15 min at
121
10,000 x g), resolubilized with 100 mL of RO water (adjusted to pH 7.5 with 3 N
NaOH), and freeze dried.
Another option evaluated for preparing CPC involved a 2-stage membrane
filtration process that started with a 0.45 µm membrane to remove higher molecular
weight impurities from the clarified extract. Permeate from the 0.45 µm filtration was
diafiltered and concentrated using a 30 kDa membrane.
Clarified extract, retentates, and permeates were analyzed by Bradford and SDS-
PAGE and the conductivity and pHs were monitored throughout filtration. The
permeate flux was also measured throughout filtration. The retentates (corn protein
concentrates) were freeze dried and sent to Eurofins Scientific Inc. (Des Moines, IA) for
analysis.
RESULTS & DISCUSSION
Producing a protein product using germ wet milling consists of soaking dry-
milled germ to enhance protein and oil content (% basis) by reducing starch content and
recovery of protein from the germ. To produce an economical protein product using
germ wet milling requires 1) optimization of germ soaking conditions and 2)
development of an efficient protein extraction and concentration recovery method.
Optimization of Germ Soaking. The primary objective of germ soaking is to
increase germ purity by releasing or leaching undesirable impurities such as phytic acid,
starch, and salts while retaining both the quantity and quality of germ oil and protein.
One concern that we initially had was the potential for excessive protein loss during
soaking on a pilot-scale since the feasibility of soaking dry-milled germ had not been
122
previously reported. For this reason, we investigated the effect of soak water
temperature, time, and pH on protein content in the soak water. Leaching kinetics were
determined to further optimize the soaking conditions, and the molecular weight
distribution of leached protein was analyzed to evaluate the potential use of soak water
for other applications including as a nitrogen source for ethanol fermentation.
Lab-scale Studies: Soak Water Analysis. The amount of germ protein leached
into the soak water at two temperatures (25°C, 50°C) and pHs (4.5 and 7.5) was
determined over a 10 h period. The amount of protein leached was the lowest in the pH
4.5 and 25°C soak and highest in the pH 7.5 and 50°C soak water (Figure 5.1). For all
soak conditions, the amount of protein leached over the first 2 h increased linearly with
time and leveled off by 6 h of soaking. After 6 h, no additional protein was leached for
all conditions except for pH 4.5 and 25°C. At pH 4.5 and 25°C (Figure 5.2a), the soak
water contained primarily low molecular weight proteins (6-14 kDa). Some higher
molecular weight proteins can be seen in the 24 h sample, but they only represent a small
fraction of the total protein present in the soak water. Increasing the soak temperature to
50°C increased the amount of higher molecular weight proteins and total protein lost in
the soak water (Figure 5.2b). Based on Bradford assay, leached protein was 65% higher
at 50°C than 25°C (average difference over 10 h) at pH 4.5. Soaking at pH 7.5 resulted
in the loss of proteins with molecular weights from 6 to 60 kDa in the 25°C soak (Figure
5.3a) and 50°C soak (Figure 5.3b). Loss of lower molecular weight proteins into the
soak water increased with soak temperature and time. The amount of protein solubilized
in the soak water was almost 60% higher at 50°C than at 25°C (average difference over
123
0.0
0.1
0.2
0.3
0.4
0.5
0.6
0.7
0.8
0.9
0 2 4 6 8 10
Leac
hed
Prot
ein
(g/1
00g)
Time (hr)
pH 7.5 25°C pH 7.5 50°C
pH 4.5 25°C pH 4.5 50°C
10 h). The increase of protein leached by soaking at a higher temperature was similar to
pH 4.5 results.
The phytic acid content in the soak water was also determined because the
presence of this anti-nutritional compound in a germ product would be undesirable.
Leaching of phytic acid at pH 4.5 after 1 hr soak was 4.3 mg phytic acid/g germ for both
25°C and 50°C, which represents a removal of 15% of total phytic acid present in dry-
milled corn germ (O'Dell et al., 1972). For pH 7.5 soaking, the amount of phytic acid
extracted from germ was 20% higher at 50°C (4.3 mg/g) than at 25°C (3.3 mg/g). At pH
Figure 5.1. Lab-scale soak water analysis: effect of temperature, time, and pH on total protein loss from dry-milled corn germ. Leached protein reported as g total soluble protein (TSP) lost in soak water per 100 g of dry-milled germ.
124
7.5, a higher temperature was required to extract the same amount of phytic acid
compared to pH 4.5 soaking.
Figure 5.2 Non-reduced SDS-PAGE images showing protein profiles of selected (a) pH 4.5 and 25°C soak water samples from 15 minutes (15 m) to 24 h and (b) pH 4.5 and 50°C samples from 15 m to 10 h. Samples were loaded based on protein content (12.5 µg/well). For extraction kinetics, refer to Figure 5.1.
kDa 200
116.3 97.4
66.3
55.4
36.5
31.0
21.5
14.4
6.0
MW 15m 30m 45m 60m 90m 2h 4h 6h 10h
MW 15m 30m 45m 60m 90m 2h 4h 6h 24h
(a)
(b)
kDa 200
116.3 97.4
66.3
55.4
36.5
31.0
21.5
14.4
6.0
125
MW 15m 30m 45m 60m 90m 2h 4h 6h 11h
Figure 5.3. Non-reduced SDS-PAGE images showing protein profiles of selected pH 7.5 (a) 25°C soak water samples and (b) 50°C soak water samples from 15 minutes (15 m) to 11 h. Samples were loaded based on protein content (12.5 µg/well). The gel shows the distribution of proteins by molecular weight and not the amount extracted over time.
kDa 200
116.3 97.4
66.3
55.4
36.5
31.0
21.5
14.4
6.0
MW 15m 30m 45m 60m 90m 2h 4h 6h 10h
(a)
kDa 200
116.3 97.4
66.3
55.4
36.5
31.0
21.5
14.4
6.0
(b)
126
Pilot-scale Studies: Soak Water Analysis. Based on lab-scale studies, two
soaking conditions were selected for scale-up to confirm the effect of the soaking
conditions on protein and phytic acid leaching into the soak water. Soaking conditions
that minimized protein leaching (pH 4.5, 25°C) and maximized protein and phytic acid
leaching (pH 7, 60°C) in the lab-scale studies were further evaluated.
Protein leaching kinetics (Figure 5.4) for the pilot-scale studies were compared to
lab-scale data which showed similar trends for both conditions. Loss of germ protein (as
% of initial germ protein) due to leaching in the soak water ranged from 0.3% at 0.5 hr
to 1.3% at 6 hr for pH 4.5 and from 3 to 6% for pH 7 soaking. The percent of germ
protein leached at pH 7 and 60°C was 83% higher than that at pH 4.5 and 25°C for the
pilot-scale soaking experiments and similar to the 75% difference measured for the lab-
scale experiments. The proteins present in the soak water were predominately 6-14 kDa
(Figure 5.5). However, higher molecular weight proteins were observed in the pilot-
scale pH 4.5 soak water samples (Figure 5.5a) but not in lab-scale samples.
The amount of initial phytic acid content of germ leached ranged from 0.3% (0.1
g/kg germ) after 0.5 hr to 23% (8.3 g/kg) after 6 hr for the pH 4.5 soak and from 17%
(6.3 g/kg) to 20% (7.5 g/kg) during the pH 7 soak. The amount of phytic acid leached
was higher at pH 7 than pH 4.5 for the shorter soak times (1, 2, and 4 h) but after 6 h, the
results were similar for both pHs. For the lab-scale experiments, phytic acid was only
measured at a single time point (1 h) and showed the same amount of phytic acid
leached for pH 4.5, 25°C and pH 7, 60°C which was different than the pilot-scale results.
As determined in the lab-scale experiments, soaking at high temperature enhanced
127
phytic acid extractability. The ratio of phytic acid to total soluble protein (TSP) in the
soak water was also determined for both soak conditions (Figure 5.6). The ratio could
be used as an indirect measurement of the effectiveness of the soaking conditions. To
obtain the highest germ protein purity, the ratio of phytic acid to total soluble protein in
the soak water should be maximized. Figure 5.6 shows that increasing the soaking time
increased the phytic acid to total soluble protein ratio for soaking at pH 4.5 but
decreased the ratio at pH 7. The highest ratio of leached phytic acid to TSP was 4.2,
which was obtained after soaking for 6 hr at pH 4.5 and 25°C. Thus, pH 4.5 appears to
be the best choice unless soak time is limited to 1.5 h or less.
The pilot-scale studies indicated that the lab-scale experiments adequately
reflected the results expected for larger scale processing.
Figure 5.4. Comparison of pilot-scale and lab-scale data for protein leached into soak water throughout the soaking of dry-milled germ. Data reported as g total soluble protein per kg of germ soaked.
0
1
2
3
4
5
6
7
8
9
10
0 1 2 3 4 5 6
Lea
ched
Pro
tein
(g/k
g)
Time (h)
pH 7 50-60°C Pilot-scale Soak
pH 7.5 50°C Lab-scale Soak
pH 4.5 25°C Pilot-scale Soak
pH 4.5 25°C Lab-scale Soak
128
Figure 5.5. Pilot-scale soak water analysis: non-reduced SDS-PAGE image showing protein profiles of selected (a) pH 4.5 and 25 °C soak water samples from 1 h to 14 h and (b) pH 7 and 60°C soak water samples from 1 h to 6 h. Samples were loaded based on equal protein content with (a) 8.5 µg protein and (b) 12.5 µg protein. Compared to the lab-scale experiments, higher molecular weight protein were leached during pH 4.5 soaking for the pilot-scale experiments.
kDa 200
116.3 97.4
66.3 55.4
36.5
31.0
21.5
14.4
6.0
(a) MW 1h 2h 4h 6h 14h
MW 1h 2h 4h 6h kDa 200
116.3 97.4
66.3 55.4
36.5
31.0
21.5
14.4
6.0
(b)
129
0.0
0.5
1.0
1.5
2.0
2.5
3.0
3.5
4.0
4.5
0
1
2
3
4
5
6
7
8
9
10
1 2 3 4 5 6
Phyt
ic A
cid
to T
SP R
atio
Lea
ched
Phy
tic A
cid
(g/k
g)
Time (h)
pH 4.5 25°C Soak pH 7 60°C Soak
pH 4.5 25°C PA/TSP pH 7 60°C PA/TSP
Figure 5.6. Phytic acid and the ratio of phytic to total soluble protein (PA/TSP) leached into soak water as a function of time.
Lab-scale Studies: Germ Composition Analysis. As mentioned before, one of
the desirable outcomes of germ soaking is to increase germ purity. The increase of germ
purity is usually reflected in increased oil and total protein content. In this set of
experiments, a broad range of soaking conditions was evaluated by following the
protein, starch, and oil content of the clean germ (soaked and separated by density).
The protein content of the clean germ was increased from 15% to an average of
21% and with only slight variations between soaking pH, temperature, and time. The
percent increase in germ protein content ranged from 24 to 37% (Figure 5.7) and
increased over time at 25°C but decreased at 60°C. Final protein content on a moisture-
free and oil-free basis varied between 27 to 31% for all soaking conditions.
130
0
5
10
15
20
25
30
35
40
25°C 60°C 25°C 60°C 25°C 60°C
pH 3 pH 6 pH 9
Incr
ease
in G
erm
Pro
tein
Con
tent
(%)
Soaking Conditions
0.5 h 2 h 4 h 8 h
Figure 5.7. Effect of soaking pH, temperature, and time on the % increase of germ protein content (protein determined by Kjehdahl total nitrogen). Results are given in % increase in protein content of germ after germ wet milling (soaked and separated).
If the yield of clean germ or total protein recovered in the clean germ compared
to the dry-milled germ is also considered, differences in soaking conditions are apparent.
The total protein recovered (Figure 5.8) for germ soaked at 60°C was generally lower
than that at 25°C since clean germ yields were lower at 60°C.
131
0
5
10
15
20
25
30
35
40
25°C 60°C 25°C 60°C 25°C 60°C
pH 3 pH 6 pH 9
Cle
an G
erm
Pro
tein
Yie
ld (%
)
Soaking Conditions
0.5 h 2 h 4 h 8 h
Figure 5.8. Effect of soaking conditions (temperature, pH, time) on germ protein yield (%). After soaking, the clean germ was separated by density, rinsed, dried, and weighed. Protein yield describes the total amount of protein in clean germ as a % of the protein in the starting material (dry-milled germ).
Reducing starch content of dry-milled germ by soaking is beneficial for two
reasons: 1) it improves hexane extraction efficiency and 2) it increases ethanol
production since starch released into the soak water can be recovered with leached
protein and salt and used to supplement fermentation media. The starch content of the
germ was reduced from 33% to an average of 9% for all conditions and was independent
of soak pH, temperature, and time. The final starch content was within the range of 5-
10% expected for clean germ (Watson, 1994). The high starch content in the starting
material indicates that a significant amount of endosperm remained attached to the germ
after degermination, which is characteristic of the dry milling process. In this regard,
soaking was an effective way to remove starch and the shortest soak time evaluated (0.5
132
h) was sufficient for starch reduction. However, adding amylase enzyme to the soak
water did not further reduce starch content in the germ.
Soaking the germ improved oil content from 16% to 28-39% and depended on
the soaking conditions. In general, the % increase in germ oil content (Figure 5.9) was
improved as the soaking time increased. Using a higher temperature soaking was more
effective for producing higher oil germ with an average increase of 120% at 60°C
compared to 94% at 25°C. Achieving higher oil content in the germ is desirable because
higher oil content improves the efficiency of the subsequent oil extraction step and
increases protein purity of the defatted germ.
0
20
40
60
80
100
120
140
160
25°C 60°C 25°C 60°C 25°C 60°C
pH 3 pH 6 pH 9
Incr
ease
in O
il C
onte
nt (%
)
Soaking Conditions
0.5 h 2 h 4 h 8 h
Figure 5.9. Effect of soaking pH, temperature, and time on the % increase of germ oil content (oil determined by acid hydrolysis). Results are given in % increase in oil content after soaking dry-milled germ.
133
Pilot-scale Studies: Germ Composition Analysis. Two soaking conditions (pH
4.5 at 25°C and pH 7 at 60°C) were selected for scale-up to confirm the effect of the
soaking conditions on germ protein and oil content and to produce germ for subsequent
corn protein concentrate (CPC) development. The germ soaking conditions (pH 4.5 and
25°C) were selected to minimize the amount of protein lost in the soak water. Two
different soaking times (2 h and 6 h) were evaluated since we wanted to reduce the total
processing time and still get high germ protein content. Dry-milled germ was also
soaked at neutral pH (pH 7) and high temperature (60°C) for either 2 h or 6 h and
compared to the pH 4.5 soaking experiments.
The composition of the dry-milled germ used as the starting material and clean
germ (soaked and separated) are given in Table 5.1. Soaking improved the germ protein
content from 16% to 19-20% protein (db) and was independent of soak time,
temperature, and pH. Although the pH 7 and 60°C soaking conditions resulted in 75%
more protein leached than at pH 4.5 and 25°C, the loss was not sufficient to reduce final
protein content of the clean germ. However, differences could be seen if protein content
was expressed on an oil-free basis. Since defatted corn germ flour is used for preparing
corn protein concentrate, protein content on an oil-free basis is good way to determine
the best starting material (highest protein content). Germ protein content (oil-free basis)
was 31% (2 h) and 32% (6 h) for pH 4.5 and 25°C samples and 35% (2 h) and 37% (6 h)
for pH 7 and 60°C samples. The higher protein content (oil-free basis) at pH 7 and 60°C
was primarily a reflection of the higher germ oil content which was 46% compared to
37% for germ soaked at pH 4.5 and 25°C.
134
Table 5.1. Comparison of the composition of the starting material (dry-milled germ) to the clean germ (soaked at specified conditions, separated, and dried) from pilot-scale experiments. Soaking Conditions Composition (% db) Sample pH Temp
Soaking at 60°C also resulted in higher oil content of clean germ in the lab-scale
studies. Pilot-scale data were also similar to lab-scale in terms of starch content since
soaking was very effective in reducing initial starch concentration, even at the shorter
soak times. Starch content was reduced by 50-60% for all soak conditions (Table 5.1).
An additional set of pilot-scale experiments was completed to determine germ
composition after soaking at pH 7 and 20°C, conditions that can be maintained with little
or no adjustment. Germ composition was compared after soaking one batch at room
temperature for only 0.5 h and the other batch for 16 h at 60°C. Even at these two
extremes, the protein contents (Table 5.2) were comparable and the slight improvement
in oil purity and decrease in starch content probably would not justify using the longer
soaking time (16 h) from an economical or operational point of view.
135
Table 5.2. Germ composition from pilot-scale dry-milled germ soaking at pH 7 for either 0.5 h at 20°C or 16 h at 60°C. Clean germ was analyzed after soaking, separation, and drying. Soaking Conditions Composition (% db) Sample pH Temp (°C) Time (h) Protein Protein
(oil-free) Oil Starch
Dry-milled Germ NA NA NA 14 17 18 41 Clean Germ 7 20 0.5 20 30 35 11 Clean Germ 7 60 16 19 33 42 7
The pilot-scale experiments further supported the lab-scale soaking results, i.e.
little variation in final protein and starch composition and higher oil content from higher
temperature soaking. The pilot-scale studies suggest that soaking germ for 2 h at pH 7
and 60°C would be the preferred conditions if protein isolated from the germ was used
for feed or food applications where protein quality (reduced solubility due to
denaturation) was not important. If the ultimate goal is to maintain protein water
solubility, then the effect of process conditions on the protein dispersibility index of
defatted germ must also be taken into consideration.
Corn Protein Concentrates. Dry-milled germ goes through several processing
steps to make defatted germ flour (Figure 5.10) and each step warrants consideration.
Since our goal is to use defatted germ as the starting material for developing protein
concentrates, we evaluated the effect of processing conditions on germ protein quality.
Protein quality in this work was evaluated by measuring the protein dispersibility index
(PDI). PDI is one of the main methods used to determine protein solubility (Dubois and
Hoover, 1981) and one factor known to have a significant effect on protein functionality
(Heywood et al., 2002; Zayas, 1997; Zayas and Lin, 1989).
136
Grind
GermSeparation
Dry
Soak
Flake
Oil extraction
Dry milled germ
Water
Defatted germ flour
Desolventize
Clean germ
Soaked germ
Lab-scale and pilot-scale studies resulted in a similar protein content of clean
germ for all soaking conditions evaluated. Data from lab-scale soaking experiments
indicated that the PDI depended on soaking time, temperature, and pH (Table 5.3). PDI
decreased as the soaking time increased under most conditions. In addition, germ PDI
was generally greater when soaked at 25°C instead of 60°C, unless soaking time at 60°C
was limited to 0.5 h, in which case the PDI did not change. The soaking time was
particularly detrimental at pH 3 and 60°C due to protein denaturation since the PDI
value was reduced 77% when germ was soaked 8 h instead of 0.5 h. Based on the germ
Figure 5.10. Process diagram for preparing high protein defatted germ flour from dry-milled germ.
137
PDI value, soaking at 25°C at either pH 6 or pH 9 appeared to be the best conditions for
improving germ protein content and maintaining protein solubility.
Table 5.3. Protein dispersibility index (PDI) of soaked dry-milled germ as a function of soak pH, temperature, and time. PDI of starting material was 56%. Soak Time (h)
Table 5.5. Effect of germ flour PDI on CPC yield (by mass), protein content, and protein yield. Protein yield represents the amount of protein in CPC as a % of the total protein in the DCG.
DCG PDI (%)
DCG Protein
(%)
Water Soluble Protein (g) in
100 g DCG Flour
CPC(g) per
100 g DCG Flour
Protein (g) in CPC from 100 g
DCG Flour
Protein Yield (%)
37 30 11 10 8.0 27 52 25 13 16 11 46
Evaluation of Three Methods for CPC Preparation. From an economic
standpoint, maximizing CPC yield while maintaining protein quality is very desirable.
Membrane filtration is a proven and popular method for concentrating protein solutions
in food and biotechnology industry. Protein precipitation requires less initial capital
Table 5.4. Effect of defatted corn germ (DCG) PDI on the amount of protein recovered in corn protein concentrate (CPC). The amount of water soluble protein was calculated by multiplying protein content by PDI of defatted corn germ flour. Protein yield was calculated by dividing the total protein in CPC by the total protein in DCG.
141
investment than membrane filtration technologies but typically suffers from lower yields
than membrane filtration due to protein loss in the precipitation and centrifugation steps.
In this section, we report the initial evaluation of membrane filtration methods for CPC
production and compare the results to the standard precipitation method. Because
productivity of membrane concentration is determined by protein recovery (yield) and
flux, the comparative evaluation of these methods included protein yield, composition of
the concentrate, and average flux during the membrane concentration process.
The three processes for CPC preparation that were compared are given in Figure
5.12 and included the precipitation method, membrane filtration method, and a
combination method using both precipitation and membrane filtration. The CPC yield
using HPLPG was increased from 10 g to 15 g CPC per 100 g of DCG flour when
membrane filtration was used instead of isoelectric precipitation (Table 5.6). Membrane
filtration (30 kDa ultrafiltration) or precipitation alone produced CPC with a similar
protein content and composition (based on SDS-PAGE). Protein loss in the permeate for
both the 10 and 30 kDa ultrafiltration membranes was 6% of the total protein compared
to 10-16% lost if isoelectric precipitation was used. SDS-PAGE showed that the
proteins present in the permeates were primarily small ones, around 6 kDa in size. The
supernatant after isoelectric precipitation, in addition to 6 kDa protein, contained larger
MW proteins anywhere from 14 to 36 kDa. Therefore, SDS-PAGE data support the
measured difference in CPC yield between the two methods and explains the probable
cause of yield difference, i.e. precipitation efficiency.
142
Although the two membranes produced similar amount of concentrate, the
permeated fluxes were different; 30 LMH with the 30 kDa membrane and slightly
lower at 26 LMH with the 10 kDa membrane.
Table 5.6. Effect of CPC preparation method on protein recovery from defatted germ flour. A 30 kDa ultrafiltration membrane was used for membrane filtration experiments.
To further improve protein purity and/or flux two additional process variations
were tested 1) microfiltration (0.45µm) followed by a 30 kDa ultrafiltration step and 2) a
combination of 30 kDa ultrafiltration and isoelectric precipitation. The attempt to
remove higher molecular weight impurities with a 0.45µm microfiltration membrane
before concentration of the permeate on a 30 kDa membrane failed. The microfiltration
membrane was severely fouled resulting in only 53% product recovery. The fouling
likely occurred by protein plugging of membrane pores. SDS-PAGE analysis of the
microfiltration retentate showed that retained proteins were 6 to 60 kDa in size which
should not be retained by this membrane.
Precipitation prior to membrane filtration did not increase flux with a 10 kDa
membrane. Using precipitation after membrane filtration did improve protein purity of
the CPC but at the expense of total yield. The yield using precipitation alone was 10 g
/100 g DCG flour but only 8 g/100 g for membrane filtration plus precipitation.
The membrane filtration permeates and supernatant from precipitation were
analyzed by reversed-phase high performance liquid chromatography (RP-HPLC) as a
way to compare extract impurities removed. HPLC showed that the membrane filtration
process did remove phenolic compounds which are known to give unpleasant taste to
corn germ protein flour products (Huang and Zayas, 1991).
145
SUMMARY
Soaking dry-milled germ was an effective method for improving germ protein
and oil contents and reducing attached endosperm starch. In the lab-scale experiments,
starch was reduced from 33% to 9% and protein content (moisture-free, oil-free basis)
was increased from 18% to an average of 29% for all soak conditions. Oil content
increased from 16% to 28-39%. In general, 60°C soaking was more effective than 25°C
for producing germ with higher oil content. Pilot-scale experiments were consistent with
the lab-scale studies with little variation in final protein and starch composition and
higher oil content with higher temperature soaking. Compared to the lab-scale
experiments, the pilot-scale studies resulted in higher oil contents of clean germ. The oil
content of clean germ after soaking at pH 7 and 60°C for 2 h was within the range (42 to
50% db) typically seen in traditional wet milling (Johnson and May, 2003) which uses
24 h soaking of whole kernels. Clearly, soaking germ instead of the entire kernel was
advantageous since the same oil content could be achieved in only 2 h.
Protein dispersibility index (PDI) was affected by soaking temperature, pH, and
time. High temperature (60°C) and longer soaking times (≥ 2 h) reduced PDI values,
especially for pH 3. Based on the germ PDI value, soaking at 25°C at either pH 6 or pH
9 appear to be the best conditions for improving germ protein content and maintaining
protein solubility. Controlling the temperature during the germ drying and defatting
processes was also important for maintaining the PDI throughout processing.
The protein recovery was greater from defatted germ flour with a high PDI
(52%). Corn protein concentrate (CPC) with >75% protein purity could be achieved
146
using isoelectric precipitation or membrane filtration. Corn protein concentrate prepared
by both methods had similar protein composition and content, but membrane filtration
had a higher product yield.
Based on these results, neutral pH soaking (pH 6-7) at 25°C for a maximum of 2
h would be the best conditions for preparing high protein, high PDI germ that could be
used for protein recovery. After extraction of the defatted corn germ flour, the
recommended method for preparing corn protein concentrate would include diafiltration
and concentration using a 30 kDa ultrafiltration membrane.
147
CHAPTER VI
CONCLUSIONS
The use of plant systems for the production of recombinant proteins offers many
advantages over traditional production systems but also presents new processing
challenges as the introduction of a non-native protein reduces the applicability of
established processing methods. The use of plant systems to produce biofuels also
introduces new downstream processing opportunities. In separate studies, the
downstream processing of transgenic rice and dry-milled corn germ, a co-product of
corn-to-ethanol processing, were evaluated for the production of novel protein products.
In the first study, the extraction and purification of human lysozyme from
transgenic rice were investigated. The optimum extraction conditions and the effect of
rice extract impurities on cation exchange adsorption of lysozyme were determined and
the rice extract component that interfered with purification was identified as phytic acid.
A combination of pH and ionic strength was used to optimize the extraction of
lysozyme and cation exchange adsorption using SP-SepharoseTM FF. Lysozyme
extraction was highly dependent on pH as the amount of lysozyme (expressed as a % of
total soluble protein) in crude extract was 60% at pH 4.5, 15% at pH 6.5, and 10% at pH
7.5 with 50 mM NaCl. Extraction at pH 4.5 with 100 mM NaCl (15 mS) resulted in the
highest lysozyme to total soluble protein ratio, but the saturation binding capacity (SBC)
at 15 mS was modest compared to the highest SBC at 5 mS. The selected conditions for
extraction and purification, pH 4.5 with 50 mM NaCl (10 mS), were a compromise
148
between lysozyme extractability and SBC. These conditions are recommended for
applications where 90% lysozyme purity is sufficient. A new method was developed
(pH 4.5 extraction followed by pH 6 adsorption) to get a lysozyme purity of 95% in a
single chromatography step. However, rice extract impurities reduced the SBC almost
80% compared to the SBC of purified human lysozyme at the same pH and ionic
strength.
To assess the effectiveness of human lysozyme (HuLZ) adsorption and
purification from rice, the adsorption of HuLZ was compared to hen egg-white lysozyme
(HewLZ). Except in one case, dynamic binding capacities (DBCs) of HuLZ were lower
than HewLZ DBCs at pH 4.5 and 6 with ionic strengths from 5-15 mS (0-300 mM
NaCl). The lower DBCs for HuLZ indicated that HuLZ interactions with the cation
exchange resin were weaker overall despite similar protein properties. In the presence of
rice extract, the capacities of HuLZ was reduced 31% in pH 4.5 extract to 39% in pH 6
extract compared to purified HuLZ. The effect on HewLZ capacities was slightly lower
with reductions of 21% and 32% for pH 4.5 and pH 6 extracts, respectively. The
purification of HewLZ from rice extract was similar to that from egg-white with similar
binding capacities. Process simulation of the best processes for HuLZ (from rice) and
HewLZ (from egg-white) showed that the downstream processing costs were similar.
The apparent interference of rice extract impurities on HuLZ adsorption,
especially for pH 4.5 extract adjusted to pH 6 for adsorption, indicated that identification
of the interfering impurity was critical to designing an integrated, optimized purification
process. The rice impurity, phytic acid, was suspected so enzymatic (phytase) treatment
149
prior to cation exchange adsorption was evaluated. Phytase treatment eliminated column
fouling and improved the binding capacity of HuLZ, implicating phytic acid as the
primary culprit. The two approaches tested to reduce phytic acid interference were: 1)
reducing the amount of phytic acid extracted and 2) shielding phytic acid with counter-
ions to reduce interactions between phytic acid and HuLZ. The method for the first
approach was pH 10 extraction followed by acidic precipitation and pH 6 adsorption.
The second approach was pH 4.5 extraction followed by pH 6 adsorption in the presence
of TRIS counter-ions. The binding capacity using either method was ≥ 25 mg/mL, a
significant improvement in capacity compared to the previous best process of 8.6
mg/mL. The lysozyme purity with both processes was also ≥ 95%. By reducing the
interference of phytic acid with cation-exchange purification, HuLZ could be purified
from rice in a single chromatography step with an improved binding capacity.
Based on data presented, the recommended extraction and purification method
for obtaining human lysozyme with a purity of 95% would be pH 4.5 extraction (50 mM
sodium acetate with 50 mM NaCl) with pH 6 adsorption in the presence of TRIS
counter-ions. Unlike the pH 10 process, the TRIS process does not require an acidic
precipitation step which would increase the equipment and labor costs and total
processing time.
These studies using transgenic rice revealed that purification of HuLZ using a
single chromatography step is possible and identified bottlenecks that need to be
considered in the future. One bottleneck identified was the packed-bed chromatography
step which is the major cost contributor to the downstream processing cost of HuLZ.
150
Testing the feasibility of using lower cost alternatives such as batch adsorption,
precipitation, or ultrafiltration would also be beneficial. Other future work should
include the scale-up of the best purification process to demonstrate the process
robustness on a production scale. To further address phytic acid, one potential option
that could be evaluated would be to remove the aleurone layer through abrasive milling
to reduce the phytic acid content 50-80%. Finally, development of general guidelines or
heuristics for the purification of basic proteins expressed in transgenic rice could be
tested by evaluating the extraction and purification of another basic recombinant protein.
The second study was aimed at improving the value of traditional dry-milled
germ by increasing the protein and oil content through germ wet milling and to develop
a process to produce corn protein concentrate (CPC) from the higher protein germ.
Soaking dry-milled germ for as little as 0.5 h reduced starch content from 33% to ≤ 9%
and increased protein content from 18% to ≥ 27% (moisture-free, oil-free basis) for all
soak pHs and temperatures in lab-scale experiments. Pilot-scale experiments were
consistent with the lab-scale studies and showed the same trends, i.e. little variation in
final protein and starch composition between soaking conditions. Germ oil content
increased from 16% to as high as 39% in lab-scale experiments and 46% for pilot-scale
studies using a high temperature soaking (60°C). High temperature (60°C) and longer
soaking times (≥ 2 h) reduced the PDI of soaked germ as much as 75%. Germ soaked
using these conditions would be undesirable for CPC preparation since CPC yield was
highest using high PDI defatted germ flour. Concentrating and purifying germ protein
151
using membrane filtration instead of protein precipitation also resulted in higher CPC
yields.
The recommended soaking conditions for preparing high protein, high PDI germ
that could be used for protein recovery are neutral pH (pH 6-7) at 25°C for a maximum
of 2 h. The recommended method for preparing CPC from defatted corn germ flour
extract would include diafiltration and concentration using a 30 kDa ultrafiltration
membrane. If the protein content of CPC is not sufficient using membrane filtration
alone, a protein precipitation step prior to membrane filtration could be added but would
reduce the protein yield.
Future work in this area should include optimizing membrane filtration and
scaling-up CPC production using the precipitation and/or membrane filtration methods.
Larger scale production would be important for producing sufficient CPC to evaluate the
functional properties and to identify the best process for the intended application.
152
REFERENCES
Adkins YB, Lönnerdal B. 2004. Proteins and peptides. In: Neeser JR, German BJ, editors. Biotechnology for performance foods, functional foods, and nutraceuticals. New York, NY: Marcel Dekker, Inc. p 167-196.
Adom KK, Liu RH. 2002. Antioxidant activity of grains. J Agric Food Chem 50(21):6182-6187.
Alderton G, Fevold HL. 1946. Direct crystallization of lysozyme from egg white and some crystalline salts of lysozyme. J Biol Chem 164(1):1-5.
Alderton G, Ward WH, Fevold HL. 1945. Isolation of lysozyme from egg white. J Biol Chem 157(1):43-58.
Azzoni AR, Farinas CS, Miranda EA. 2005. Transgenic corn seed for recombinant protein production: Relevant aspects on the aqueous extraction of native components. J Sci Food Agric 85(4):609-614.
Azzoni AR, Kusnadi AR, Miranda EA, Nikolov ZL. 2002. Recombinant aprotinin produced transgenic corn seed: Extraction and purification studies. Biotechnol Bioeng 80(3):268-276.
Bai Y, Nikolov ZL. 2001. Effect of processing on the recovery of recombinant beta-glucuronidase (rGUS) from transgenic canola. Biotechnol Prog 17(1):168-174.
Bai Y, Nikolov ZL, Glatz CE. 2002. Aqueous extraction of beta-glucuronidase from transgenic canola: Kinetics and microstructure. Biotechnol Prog 18(6):1301-1305.
Balasubramaniam D, Wilkinson C, Van Cott K, Zhang CM. 2003. Tobacco protein separation by aqueous two-phase extraction. J Chromatogr 989(1):119-129.
Basaran P, Rodriguez-Cerezo E. 2008. Plant molecular farming: Opportunities and challenges. Crit Rev Biotechnol 28(3):153-172.
Boesman-Finkelstein M, Finkelstein RA. 1982. Sequential purification of lactoferrin, lysozyme and secretory immunoglobulin A from human milk. FEBS Lett 144(1):1-5.
Bradford MM. 1976. Rapid and sensitive method for quantitation of microgram quantities of protein utilizing principle of protein-dye binding. Anal Biochem 72(1-2):248-254.
153
Carta G, Ubiera AR, Pabst TM. 2005. Protein mass transfer kinetics in ion exchange media: Measurements and interpretations. Chem Eng Technol 28(11):1252-1264.
Chang C, Lenhoff AM. 1998. Comparison of protein adsorption isotherms and uptake rates in preparative cation-exchange materials. J Chromatogr A 827(2):281-93.
Cheryan M. 1980. Phytic acid interactions in food systems. CRC Crit Rev Food Sci Nutr 13(4):297-335.
Cook ME. 2004. Antibodies: Alternatives to antibiotics in improving growth and feed efficiency. J Appl Poult Res 13(1):106-119.
Costello AJ, Glonek T, Myers TC. 1976. 31P nuclear magnetic resonance-pH titrations of myo-inositol hexaphosphate. Carbohydr Res 46:159-171.
Crea F, de Stefano C, Milea D, Sammartano S. 2008. Formation and stability of phytate complexes in solution. Coord Chem Rev 252(10-11):1108-1120.
Crea P, de Robertis A, de Stefano C, Sammartano S. 2006. Speciation of phytate ion in aqueous solution. Sequestration of magnesium and calcium by phytate at different temperatures and ionic strengths, in NaClaq. Biophys Chem 124(1):18-26.
Davis K. 2001. Corn milling, processing and generation of co-products. Minnesota Nutrition Conference and Minnesota Corn Growers Association Technical Symposium. Bloomington, MN. p 1-7.
Dendougui F, Schwedt G. 2004. In vitro analysis of binding capacities of calcium to phytic acid in different food samples. Eur Food Res Technol 219(4):409-415.
Dien BS, Johnston DB, Hicks KB, Cotta MA, Singh V. 2005. Hydrolysis and fermentation of pericarp and endosperm fibers recovered from enzymatic corn dry-grind process. Cereal Chem 82(5):616-620.
Dismer F, Hubbuch J. 2007. A novel approach to characterize the binding orientation of lysozyme on ion-exchange resins. J Chromatogr 1149(2):312-320.
Doran PM. 2000. Foreign protein production in plant tissue cultures. Curr Opin Biotechnol 11(2):199-204.
Drossard J. 2004. Downstream processing of plant-derived recombinant therapeutic proteins. In: Fischer R, Schillberg S, editors. Molecular farming: Plant-made pharmaceuticals and technical proteins. Weinheim, Germany: Wiley-VCH. p 217-231.
154
Dubois DK, Hoover WJ. 1981. Soya protein products in cereal grain foods. J Am Oil Chem Soc 58(3):343-346.
Duensing WJ, Roskens AB, Alexander RJ. 2003. Corn dry milling: Processes, products, and applications. In: White PJ, Johnson LA, editors. Corn: Chemistry and technology. 2nd ed. St. Paul, MN: American Association of Cereal Chemists, Inc. p 407-447.
Dziennik SR, Belcher EB, Barker GA, Lenhoff AM. 2005. Effects of ionic strength on lysozyme uptake rates in cation exchangers. I: Uptake in SP Sepharose FF. Biotechnol Bioeng 91(2):139-153.
Ellepola SW, Ma CY. 2006. Thermal properties of globulin from rice (Oryza sativa) seeds. Food Res Int 39(3):257-264.
Erickson B, Carr MT. 2009. Bio-ethanol development in the USA. In: Soetart W, Vandamme E, editors. Biofuels. Chichester, U.K.: Wiley. p 39-54.
Evangelista RL, Kusnadi AR, Howard JA, Nikolov ZL. 1998. Process and economic evaluation of the extraction and purification of recombinant beta-glucuronidase from transgenic corn. Biotechnol Prog 14(4):607-614.
Farinas CS, Leite A, Miranda EA. 2005. Aqueous extraction of recombinant human proinsulin from transgenic maize endosperm. Biotechnol Prog 21(5):1466-1471.
Faure A, Jollès P. 1970. Lack of concordance between primary structure and antigenicity in the case of various lysozymes and of bovine alpha-lactalbumin. FEBS Lett 10(4):237-240.
Foster G; 2008. Corn fractionation process. U.S. patent 7,419,108.
Giddings G, Allison G, Brooks D, Carter A. 2000. Transgenic plants as factories for biopharmaceuticals. Nat Biotechnol 18(11):1151-1155.
Giguere RJ; Cereal Enterprises, Inc., assignee. 1993. Grain milling and degermination process. U.S. patent 5,250,313.
Goldstein DA, Thomas JA. 2004. Biopharmaceuticals derived from genetically modified plants. Q J Med 97(11):705-716.
155
Gottschalk U. 2008. Bioseparation in antibody manufacturing: The good, the bad and the ugly. Biotechnol Prog 24(3):496-503.
Guérin-Dubiard C, Pasco M, Hietanen A, del Bosque AQ, Nau F, Croguennec T. 2005. Hen egg white fractionation by ion-exchange chromatography. J Chromatogr 1090(1-2):58-67.
Harrison RG, Todd P, Rudge SR, Petrides DP. 2003. Bioseparations science and engineering. Gubbins KE, editor. New York, NY: Oxford University Press, Inc.
Haug W, Lantzsch HJ. 1983. Sensitive method for the rapid-determination of phytate in cereals and cereal products. J Sci Food Agric 34(12):1423-1426.
Hennegan K, Yang DC, Nguyen D, Wu LY, Goding J, Huang JM, Guo FL, Huang N, Watkins S. 2005. Improvement of human lysozyme expression in transgenic rice grain by combining wheat (Triticum aestivum) puroindoline b and rice (Oryza sativa) Gt1 promoters and signal peptides. Transgenic Res 14(5):583-592.
Heywood AA, Myers DJ, Bailey TB, Johnson LA. 2002. Functional properties of extruded-expelled soybean flours from value-enhanced soybeans. J Am Oil Chem Soc 79(7):699-702.
Hicks P. 1998. Cholesterol-lowering plant oil products: pharmaceutical and nutritional companies stake out market positions. Genet Eng News 18(16):1, 14, 18.
Huang CJ, Zayas JF. 1991. Phenolic acid contributions to taste characteristics of corn germ protein flour products. J Food Sci 56(5):1308-&.
Huang JM, Nandi S, Wu LY, Yalda D, Bartley G, Rodriguez R, Lonnerdal B, Huang N. 2002a. Expression of natural antimicrobial human lysozyme in rice grains. Mol Breed 10(1-2):83-94.
Huang JM, Wu LY, Yalda D, Adkins Y, Kelleher SL, Crane M, Lonnerdal B, Rodriguez RL, Huang N. 2002b. Expression of functional recombinant human lysozyme in transgenic rice cell culture. Transgenic Res 11(3):229-239.
Huang LF, Liu YK, Lu CA, Hsieh SL, Yu SM. 2005. Production of human serum albumin by sugar starvation induced promoter and rice cell culture. Transgenic Res 14(5):569-581.
Huang N. 2004. High-level protein expression system uses self-pollinating crops as hosts. BioProcess Int 2(1):54-59.
156
Huang N, Huang J, Bethell DR; Ventria Bioscience, assignee. 2006a. Method of making anti-infective composition for treating oral infections. U.S. patent 7,138,150.
Huang N, Rodriguez RL, Hagie FE; Ventria Bioscience, assignee. 2006b. Expression of human milk proteins in transgenic plants. U.S. patent 6,991,824.
Hussain A, Bushuk W. 1992. Interference of phytic acid with extraction of proteins from grain legumes and wheat with acetic acid. J Agric Food Chem 40(10):1938-1942.
Hwang YS, Yang D, McCullar C, Wu L, Chen L, Pham P, Nandi S, Huang N. 2002. Analysis of the rice endosperm-specific globulin promoter in transformed rice cells. Plant Cell Rep 20(9):842-847.
Inglett GE, Blessin CW. 1979. Food applications of corn germ protein products. J Am Oil Chem Soc 56(3):479-481.
Jacob L, Frech C. 2007. Ion-exchange chromatography in bopharmaceutical manufacturing. In: Subramanian G, editor. Bioseparation and bioprocessing. Weinheim, Germany: Wiley-VCH. p 127-149.
Johnson LA, May JB. 2003. Wet milling: The basis for corn biorefineries. In: White PJ, Johnson LA, editors. Corn: Chemistry and technology. 2nd ed. St. Paul, MN: American Association of Cereal Chemists, Inc. p 449-494.
Johnston DB, McAloon AJ, Moreau RA, Hicks KB, Singh V. 2005. Composition and economic comparison of germ fractions from modified corn processing technologies. J Am Oil Chem Soc 82(8):603-608.
Johnston DB, Singh V. 2001. Use of proteases to reduce steep time and SO2 requirements in a corn wet-milling process. Cereal Chem 78(4):405-411.
Johnston DB, Singh V. 2004. Enzymatic milling of corn: Optimization of soaking, grinding, and enzyme incubation steps. Cereal Chem 81(5):626-632.
Johnston DB, Singh V. 2005. Enzymatic milling product yield comparison with reduced levels of bromelain and varying levels of sulfur dioxide. Cereal Chem 82(5):523-527.
Jollès J, Jollès P. 1967. Human tear and human milk lysozymes. Biochem 6(2):411-417.
Jollès P. 1996. Lysozymes: Model enzymes in biochemistry and biology. Basel, Switzerland: Birkhäuser Verlag. 449 p.
Juliano BO. 1980. Properties of rice caryopsis. In: Luh BS, editor. Rice: Production & utilization. Westpore, CN: AVI Publishing Co., Inc. p 403-438.
157
Juliano BO, Bechtel DB. 1985. The rice grain and its gross composition. In: Juliano BO, editor. Rice: Chemistry and technology. St. Paul, MN: American Association of Cereal Chemists, Inc. p 17-57.
Kampen WH; Energenetics, Inc., assignee. 1995. Recovery of protein, protein isolate and/or starch from cereal grains. U.S. patent 5,410,021.
Kim Y, Mosier NS, Hendrickson R, Ezeji T, Blaschek H, Dien B, Cotta M, Dale B, Ladisch MR. 2008. Composition of corn dry-grind ethanol by-products: DDGS, wet cake, and thin stillage. Bioresour Technol 99(12):5165-5176.
Kusnadi AR, Evangelista RL, Hood EE, Howard JA, Nikolov ZL. 1998. Processing of transgenic corn seed and its effect on the recovery of recombinant beta-glucuronidase. Biotechnol Bioeng 60(1):44-52.
Kusnadi AR, Nikolov ZL, Howard JA. 1997. Production of recombinant proteins in transgenic plants: Practical considerations. Biotechnol Bioeng 56(5):473-484.
Ladiwala A, Rege K, Breneman CM, Cramer SM. 2003. Investigation of mobile phase salt type effects on protein retention and selectivity in cation-exchange systems using quantitative structure retention relationship models. Langmuir 19(20):8443-8454.
Ladiwala A, Rege K, Breneman CM, Cramer SM. 2005. A priori prediction of adsorption isotherm parameters and chromatographic behavior in ion-exchange systems. Proc Natl Acad Sci USA 102(33):11710-11715.
Laemmli UK. 1970. Cleavage of structural proteins during assembly of head of bacteriophage T4. Nature 227(5259):680-685.
Landry J, Moureaux T. 1980. Distribution and amino acid composition of protein groups located in different histological parts of maize grain. J Agric Food Chem 28(6):1186-1191.
Lawhorn JT; The Texas A&M University System, assignee. 1986. Process for recovery of protein from agricultural commodities prior to alcohol production U.S. patent 4,624,805.
Lee-Huang S, Maiorov V, Huang PL, Ng A, Lee HC, Chang YT, Kallenbach N, Huang PL, Chen HC. 2005. Structural and functional modeling of human lysozyme reveals a unique nonapeptide, HL9, with anti-HIV activity. Biochem 44(12):4648-4655.
Li-Chan E, Nakai S, Sim J, Bragg DB, Lo KV. 1986. Lysozyme separation from egg-white by cation-exchange column chromatography. J Food Sci 51(4):1032-1036.
158
Lohrmann T. 2006. Rethinking ethanol coproducts. Distillers Grains Quarterly 4(1):23.
Lohrmann T, Paustian D, Hammes D, Nikolov Z; Corn Value Products, assignee. 2008. Process for improving products of dry milling. U.S. patent application 20080279983.
Lusas EW, Rhee KC, Koseoglu SS. 1989. Status of vegetable food protein from lesser used sources. In: Applewhite TH, editor. Proceedings of the world congress on vegetable protein utilization in human foods and animal feedstuffs. Champaign, IL: AOCS Press. p 175-203.
Ma JKC, Drake PMW, Christou P. 2003. The production of recombinant pharmaceutical proteins in plants. Nat Rev Genet 4(10):794-805.
Maga EA, Anderson GB, Murray JD. 1995. The effect of mammary gland expression of human lysozyme on the properties of milk from transgenic mice. J Dairy Sci 78(12):2645-2652.
Maga JA. 1982. Phytate: its chemistry, occurrence, food interactions, nutritional significance, and methods of analysis. J Agric Food Chem 30(1):1-9.
Malumba P, Vanderghem C, Deroanne C, Bera F. 2008. Influence of drying temperature on the solubility, the purity of isolates and the electrophoretic patterns of corn proteins. Food Chem 111(3):564-572.
Martz E. 2002. Protein Explorer: easy yet powerful macromolecular visualization. Trends Biochem Sci 27(2):107-109.
Maullu C, Lampis G, Desogus A, Ingianni A, Rossolini GM, Pompei R. 1999. High-level production of heterologous protein by engineered yeasts grown in cottage cheese whey. Appl Environ Microbiol 65(6):2745-2747.
Mawal YR, Mawal MR, Ranjekar PK. 1987. Biochemical and immunological characterization of rice albumin. Biosci Rep 7(1-9).
Menkhaus TJ, Bai Y, Zhang CM, Nikolov ZL, Glatz CE. 2004a. Considerations for the recovery of recombinant proteins from plants. Biotechnol Prog 20(4):1001-1014.
Menkhaus TJ, Eriksson SU, Whitson PB, Glatz CE. 2002. Host selection as a downstream strategy: Polyelectrolyte precipitation of beta-glucuronidase from plant extracts. Biotechnol Bioeng 77(2):148-154.
Menkhaus TJ, Pate C, Krech A, Glatz CE. 2004b. Recombinant protein purification from pea. Biotechnol Bioeng 86(1):108-114.
159
Milligan ED, Suriano JF. 1974. System for production of high and low protein dispersibility index edible extracted soybean flakes. J Am Oil Chem Soc 51(4):158-161.
Moreau RA, Powell MJ, Hicks KB. 1996. Extraction and quantitative analysis of oil from commercial corn fiber. J Agric Food Chem 44(8):2149-2154.
Muralidhara HS, Porter MA, Satyavolu JV, Sperber WH, Purtle I; Cargill, Inc., assignee. 2003. Process for producing oilseed protein products. U.S. patent 6630195.
Murthy GS, Sall ED, Metz SG, Foster G, Singh V. 2009. Evaluation of a dry corn fractionation process for ethanol production with different hybrids. Ind Crop Prod 29(1):67-72.
Nakajima H, Muranaka T, Ishige F, Akutsu K, Oeda K. 1997. Fungal and bacterial disease resistance in transgenic plants expressing human lysozyme. Plant Cell Rep 16(10):674-679.
Nakamura R, Sato Y, Yoshikawa K. 1961. Studies on the foaming property of the chicken egg white. Part IV. On the method of preparing ovomucin. J Agric Chem Soc Japan 35(7):636-641.
Nandi S, Suzuki YA, Huang JM, Yalda D, Pham P, Wu LY, Bartley G, Huang N, Lonnerdal B. 2002. Expression of human lactoferrin in transgenic rice grains for the application in infant formula. Plant Sci 163(4):713-722.
Nandi S, Yalda D, Lu S, Nikolov Z, Misaki R, Fujiyama K, Huang N. 2005. Process development and economic evaluation of recombinant human lactoferrin expressed in rice grain. Transgenic Res 14(3):237-249.
Nash DC, Chase HA. 1998. Comparison of diffusion and diffusion-convection matrices for use in ion-exchange separations of proteins. J Chromatogr 807(2):185-207.
Newcombe AR, Newcombe C, Francis R. 2008. Development of an ion-exchange process. Genet Eng News 28(8):50-52.
Nichols NN, Bothast RJ. 2008. Production of ethanol from grain. In: Vermerris W, editor. Genetic improvement of bioenergy crops. New York, NY: Springer. p 75-88.
Nielsen HC, Inglett GE, Wall JS, Donaldson GL. 1973. Corn germ protein isolate - preliminary studies on preparation and properties. Cereal Chem 50(4):435-443.
160
Nikolov Z, Hammes D. 2002. Production of recombinant proteins from transgenic crops. In: Hood EE, Howard JA, editors. Plants as factories for protein production. Dordrecht, The Netherlands: Kluwer Academic Publishers. p 159-174.
Nikolov ZL, Regan JR, Dickey LF, Woodard SL. 2009. Purification of antibodies from transgenic plants. In: Gottschalk U, editor. Process scale purification of antibodies: Wiley-VCH. p 387-406.
Nikolov ZL, Woodard SL. 2004. Downstream processing of recombinant proteins from transgenic feedstock. Curr Opin Biotechnol 15(5):479-486.
Nochi T, Takagi H, Yuki Y, Yang LJ, Masumura T, Mejima M, Nakanishi U, Matsumura A, Uozumi A, Hiroi T, Morita S, Tanaka K, Takaiwa F, Kiyono H. 2007. Rice-based mucosal vaccine as a global strategy for cold-chain- and needle-free vaccination. Proc Natl Acad Sci USA 104(26):10986-10991.
O'Dell BL, Burpo CE, Savage JE. 1972. Evaluation of zinc availability in foodstuffs of plant and animal origin. J Nutr 102(5):653-60.
Oka C, Tanaka M, Muraki M, Harata K, Suzuki K, Jigami Y. 1999. Human lysozyme secretion increased by alpha-factor pro-sequence in Pichia pastoris. Biosci Biotechnol Biochem 63(11):1977-1983.
Okafo GN, Birrell HC, Greenaway M, Haran M, Camilleri P. 1994. The effect of phytic acid on the resolution of peptides and proteins in capillary electrophoresis. Anal Biochem 219(2):201-206.
Okafo GN, Vinther A, Kornfelt T, Camilleri P. 1995. Effective ion-pairing for the separation of basic proteins in capillary electrophoresis. Electrophoresis 16(10):1917-1921.
Parris N, Moreau RA, Johnston DB, Singh V, Dickey LC. 2006. Protein distribution in commercial wet- and dry-milled corn germ. J Agric Food Chem 54(13):4868-4872.
Parry RM, Chandan RC, Shahani KM. 1969. Isolation and characterization of human milk lysozyme. Arch Biochem Biophys 130(1-2):59-&.
Peters MS, Timmerhaus KD. 1991. Plant design and economics for chemical engineers. New York, NY: McGraw-Hill, Inc. 910 p.
Ponnampalam E, Steele DB, Burgdorf D, McCalla D. 2004. Effect of germ and fiber removal on production of ethanol from corn. Appl Biochem Biotechnol 113-16:837-842.
161
Ponstein AS, Verwoerd TC, Pen J. 1996. Production of enzymes for industrial use. Ann N Y Acad Sci. p 91-98.
Proctor VA, Cunningham FE. 1988. The chemistry of lysozyme and its use as a food preservative and a pharmaceutical. CRC Crit Rev Food Sci Nutr 26(4):359-395.
Puastian D, Hammes D, Feller S; Corn Value Products, assignee. 2007. Process for recovery and separation of grain pericarp from endosperm. U.S. patent application 20070184159.
Rabiller-Baudry M, Chaufer B. 2001. Specific adsorption of phosphate ions on proteins evidenced by capillary electrophoresis and reversed-phase high-performance liquid chromatography. J Chromatogr B Analyt Technol Biomed Life Sci 753(1):67-77.
Rao A, Shallo HE, Ericson AP, Thomas RL. 2002. Characterization of soy protein concentrate produced by membrane ultrafiltration. J Food Sci 67(4):1412-1418.
Reddy NR. 2002. Occurrence, distribution, content, and dietary intake of phytate. In: Reddy NR, Sathe SK, editors. Food phytates. Boca Raton, FL: CRC Press. p 25-52.
Reichwald K, Hatzack F. 2008. Application of a modified Haug and Lantzsch method for the rapid and accurate photometrical phytate determination in soybean, wheat, and maize meals. J Agric Food Chem 56(9):2888-2891.
Rodriguez I, Li SFY. 1999. Surface deactivation in protein and peptide analysis by capillary electrophoresis. Anal Chim Acta 383(1-2):1-26.
Sala F, Manuela Rigano M, Barbante A, Basso B, Walmsley AM, Castiglione S. 2003. Vaccine antigen production in transgenic plants: Strategies, gene constructs and perspectives. Vaccine 21(7-8):803-808.
Sava G. 1996. Pharmacological aspects and therapeutic applications of lysozymes. In: Jollès P, editor. Lysozymes: Model enzymes in biochemistry and biology. Basel, Switzerland: Birkhäuser Verlag p 433-449.
Selle PH, Ravindran V, Caldwell A, Bryden WL. 2000. Phytate and phytase: Consequences for protein utilisation. Nutr Res Rev 13(02):255-278.
Shugar D. 1952. The measurement of lysozyme activity and the ultra-violet inactivation of lysozyme. Biochim Biophys Acta 8(3):302-309.
162
Siener R, Heynck H, Hesse A. 2001. Calcium-binding capacities of different brans under simulated gastrointestinal pH conditions. In vitro study with Ca-45. J Agric Food Chem 49(9):4397-4401.
Singh V, Eckhoff SR. 1996. Effect of soak time, soak temperature, and lactic acid on germ recovery parameters. Cereal Chem 73(6):716-720.
Singh V, Moreau RA, Doner LW, Eckhoff SR, Hicks KB. 1999. Recovery of fiber in the corn dry-grind ethanol process: A feedstock for valuable coproducts. Cereal Chem 76(6):868-872.
Skidmore GL, Horstmann BJ, Chase HA. 1990. Modeling single-component protein adsorption to the cation exchanger S Sepharose FF. J Chromatogr 498(1):113-128.
Sparrow PAC, Irwin JA, Dale PJ, Twyman RM, Ma JKC. 2007. Pharma-planta: Road testing the developing regulatory guidelines for plant-made pharmaceuticals. Transgenic Res 16(2):147-161.
Stevens L. 1991. Egg white proteins. Comp Biochem Physiol B Biochem Mol Biol 100(1):1-9.
Stöger E, Sack M, Fischer R, Christou P. 2002. Plantibodies: Applications, advantages and bottlenecks. Curr Opin Biotechnol 13(2):161-166.
Stöger E, Vaquero C, Torres E, Sack M, Nicholson L, Drossard J, Williams S, Keen D, Perrin Y, Christou P, Fischer R. 2000. Cereal crops as viable production and storage systems for pharmaceutical scFv antibodies. Plant Mol Biol 42(4):583-590.
Strube J, Sommerfeld S, Lohrmann M. 2007. Process development and optimization for biotechnology production - Monoclonal antibodies. In: Subramanian G, editor. Bioseparation and bioprocessing. Weinheim, Germany: Wiley-VCH. p 65-99.
Takaichi M, Oeda K. 2000. Transgenic carrots with enhanced resistance against two major pathogens, Erysiphe heraclei and Alternaria dauci. Plant Sci 153(2):135-144.
Takaiwa F, Takagi H, Hirose S, Wakasa Y. 2007. Endosperm tissue is good production platform for artificial recombinant proteins in transgenic rice. Plant Biotechnol J 5(1):84-92.
Thomas RL, Ndife LI, Shallo H, Nelles LP; Abbott Laboratories, assignee. 2001. Soy proteins and methods for their production. U.S. patent 6,313,273.
163
Tsuchiya K, Tada S, Gomi K, Kitamoto K, Kumagai C, Jigami Y, Tamura G. 1992. High-level expression of the synthetic human lysozyme gene in Aspergillus oryzae. Appl Microbiol Biotechnol 38(1):109-114.
Turner BL, Paphazy MJ, Haygarth PM, McKelvie ID. 2002. Inositol phosphates in the environment. Philos Trans R Soc Lond B Biol Sci 357(1420):449-469.
Twyman RM. 2004. Host plants, systems and expression strategies for molecular farming. In: Fischer R, Schillberg S, editors. Molecular farming: Plant-made pharmaceuticals and technical proteins. Weinheim, Germany: Wiley-VCH. p 191-216.
Twyman RM, Stöger E, Schillberg S, Christou P, Fischer R. 2003. Molecular farming in plants: Host systems and expression technology. Trends Biotechnol 21(12):570-578.
USDA. 2007. Availability of an environmental assessment and finding of no significant impact for a proposed field release of rice genetically engineered to express lactoferrin, lysozyme, or serum albumin. In: Services AaPHI, editor. Washington, D.C.: Federal Register. p 27539-27540.
Wahjudi J, Xu L, Wang P, Singh V, Buriak P, Rausch KD, McAloo AJ, Tumbleson ME, Eckhoff SR. 2000. Quick fiber process: Effect of mash temperature, dry solids, and residual germ on fiber yield and purity. Cereal Chem 77(5):640-644.
Wang CS, Kloer HU. 1984. Purification of human lysozyme from milk and pancreatic Juice. Anal Biochem 139(1):224-227.
Watson SA. 1994. Structure and composition. In: Watson SA, Ramstad PE, editors. Corn: Chemistry and technology. St. Paul, MN: American Association of Cereal Chemists, Inc. p 53-82.
Weaver CM, Kannan S. 2002. Phytate and mineral bioavailability. In: Reddy NR, Sathe SK, editors. Food phytates. Boca Raton, FL: CRC Press. p 211-223.
Whitley RD, Wachter R, Liu F, Wang NHL. 1989. Ion-exchange equilibria of lysozyme, myoglobin and bovine serum albumin: Effective valence and exchanger capacity. J Chromatogr 465(2):137-156.
Wilken LR, Nikolov ZL. 2006a. Effect of rice extract impurities on cation exchange adsorption of lysozyme. ASABE Paper No 067074. St. Joseph, MI: ASABE.
Wilken LR, Nikolov ZL. 2006b. Factors influencing recombinant human lysozyme extraction and cation exchange adsorption. Biotechnol Prog 22(3):745-752.
164
Wilson CM. 1994. Proteins of the kernel. In: Watson SA, Ramstad PE, editors. Corn: Chemistry and technology. St. Paul, MN: American Association of Cereal Chemistists, Inc. p 273-310.
Winzor DJ. 2004. Determination of the net charge (valence) of a protein: A fundamental but elusive parameter. Anal Biochem 325(1):1-20.
Wolf WJ, Sathe SK. 1998. Ultracentrifugal and polyacrylamide gel electrophoretic studies of extractability and stability of almond meal proteins. J Sci Food Agric 78(4):511-521.
Woodard SL, Mayor JM, Bailey MR, Barker DK, Love RT, Lane JR, Delaney DE, McComas-Wagner JM, Mallubhotla HD, Hood EE, Dangott LJ, Tichy SE, Howard JA. 2003. Maize (Zea mays)-derived bovine trypsin: characterization of the first large-scale, commercial protein product from transgenic plants. Biotechnol Appl Biochem 38:123-130.
Wright KN. 1994. Nutritional properties and feeding value of corn and its by-products. In: Watson SA, Ramstad PE, editors. Corn: Chemistry and technology. St. Paul, MN: American Association of Cereal Chemists, Inc. p 447-478.
Wu J, Yu L, Li L, Hu J, Zhou J, Zhou X. 2007. Oral immunization with transgenic rice seeds expressing VP2 protein of infectious bursal disease virus induces protective immune responses in chickens. Plant Biotechnol J 5(5):570-578.
Wyant S. 2006. New ethanol system could boost efficiency and feed products. Agri-Pulse 2(37): 1-2.
Yang DC, Guo FL, Liu B, Huang N, Watkins SC. 2003. Expression and localization of human lysozyme in the endosperm of transgenic rice. Planta 216(4):597-603.
Yang L, Kajiura H, Suzuki K, Hirose S, Fujiyama K, Takaiwa F. 2008a. Generation of a transgenic rice seed-based edible vaccine against house dust mite allergy. Biochem Biophys Res Commun 365(2):334-339.
Yang LJ, Wakasa Y, Takaiwa F. 2008b. Biopharming to increase bioactive peptides in rice seed. J AOAC Int 91(4):957-964.
Yoshimura K, Toibana A, Nakahama K. 1988. Human lysozyme: Sequencing of a cDNA, and expression and secretion by Saccharomyces cerevisiae. Biochem Biophys Res Commun 150(2):794-801.
Zavaleta N, Figueroa D, Rivera J, Sánchez J, Alfaro S, Lönnerdal B. 2007. Efficacy of rice-based oral rehydration solution containing recombinant human lactoferrin
165
and lysozyme in Peruvian children with acute diarrhea. J Pediatr Gastroenterol Nutr 44(2):258-264.
Zayas JF. 1997. Functionality of proteins in food. New York, NY: Springer. 373 p.
Zayas JF, Lin CS. 1989. Protein solubility of 2 hexane-defatted corn germ proteins and soy protein. J Food Process Preserv 13(3):161-173.
Zhang CM, Lillie R, Cotter J, Vaughan D. 2005. Lysozyme purification from tobacco extract by polyelectrolyte precipitation. J Chromatogr 1069(1):107-112.
Zhu Z, Hughes KW, Huang L, Sun BL, Liu CM, Li Y, Hou YD, Li XH. 1994. Expression of human α-interferon cDNA in transgenic rice plants. Plant Cell Tissue Organ Cult 36(2):197-204.
Zydney AL, Harinarayan C, van Reis R. 2009. Modeling electrostatic exclusion effects during ion exchange chromatography of monoclonal antibodies. Biotechnol Bioeng 102(4):1131-1140.
166
VITA
Name: Lisa Rachelle Wilken
Address: Department of Biological & Agricultural Engineering 201 Scoates Hall TAMU 2117 College Station, TX 77843 Email Address: [email protected] Education: B.S., Biological & Agricultural Engineering, Kansas State University,