24
Recovery of Simulated Recovery of Simulated Sawn Logs with Sweep Sawn Logs with Sweep and Ovality and Ovality Robert A. Monserud PNW, Portland, OR Christine Todoroki FRI, Rotorua, NZ
Recovery of Simulated Recovery of Simulated Sawn Logs with SweepSawn Logs with Sweep
and Ovalityand Ovality
Robert A. MonserudPNW, Portland, OR
Christine Todoroki FRI, Rotorua, NZ


The Problem(Sweep = deflection from straight)
The Problem
• Todoroki 1998: “Not all logs are straight.”
• If curve-sawing not available, need to quantify expected product loss due to sweep
• Difficult to obtain a balanced sample of logs with sweep
• Unable to break confounding between sweep and other factors

The Solution: Sawing Simulation
• Digitize a representative sample of logs– Location & size of all knots, defects
• Systematically bend digitized logs (parabola)
• All logs retain original branching structure– Number, size, shape, location at pith
• Saw digital logs into boards with a sawing simulator: AUTOSAW

Data Collection: Log Diagramming
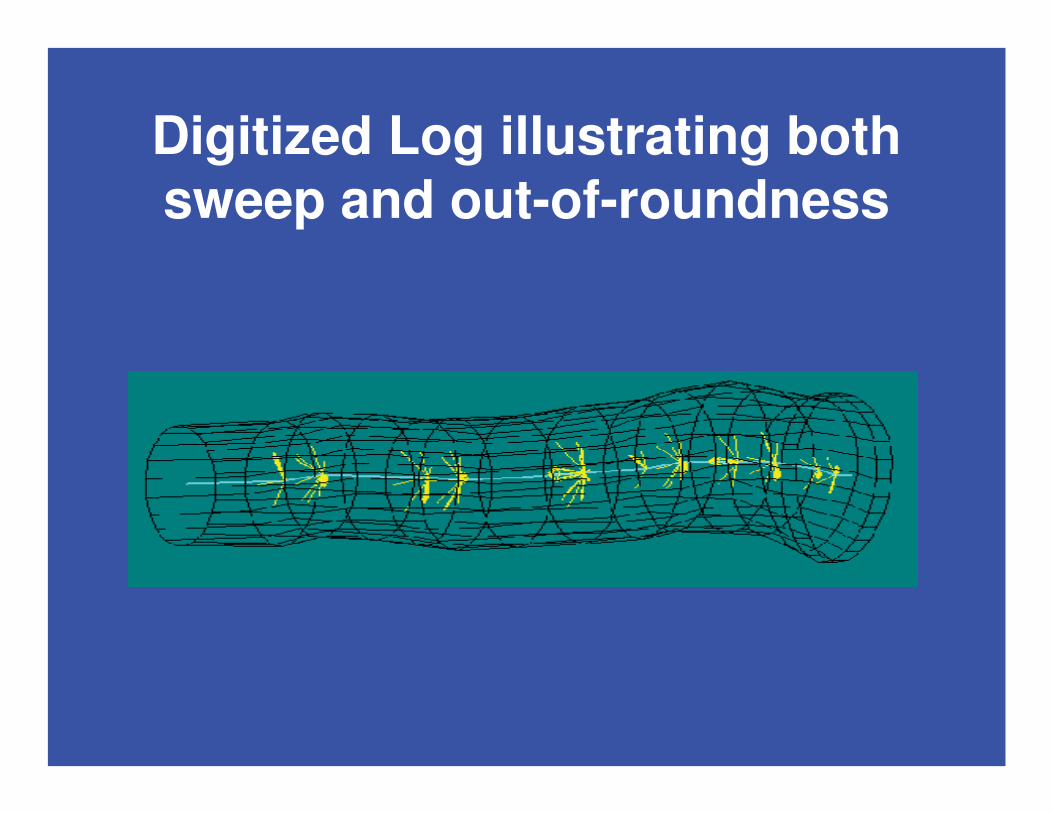
Digitized Log illustrating both sweep and out-of-roundness

Benefits of sawing simulation• Sawing parameters can be held constant• Log variables, such as sweep, can be
examined in isolation of other confounding factors
• Logs can be repeatedly sawn in different ways
• Able to explore the full range of variation• Experimental Design is balanced
Material
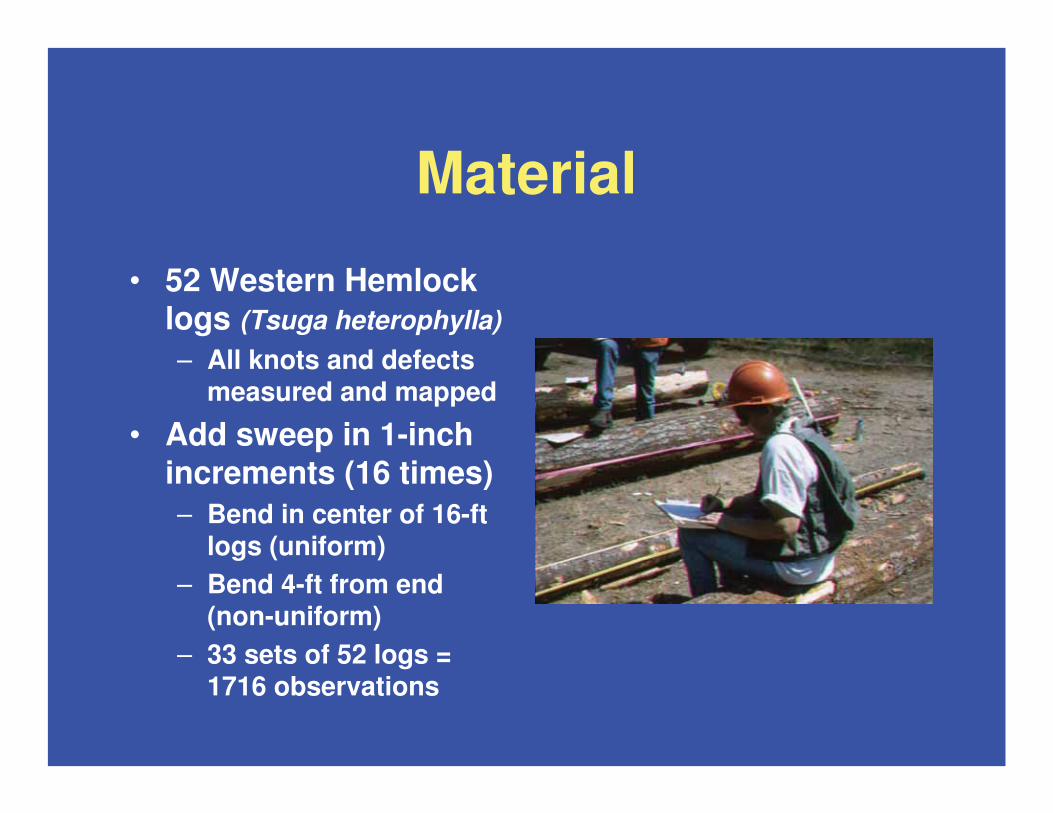
• 52 Western Hemlock logs (Tsuga heterophylla)– All knots and defects
measured and mapped
• Add sweep in 1-inch increments (16 times)– Bend in center of 16-ft
logs (uniform)– Bend 4-ft from end
(non-uniform)– 33 sets of 52 logs =
1716 observations

0
10
20
30
40
50
60
70
80
90
100
0 1 2 3 4 5 6 7 8 9 10 11 12 13 14 15 16
Results

Effect of sweep on conversion
0 5 10 15 20 25
Small end diameter (inch)
0
20
40
60
80
100
Con
vers
ion
(%)
0" sweep4"8"16"

Total Lumber Value($ per Log)
0
20
40
60
80
100
120
0 5 10 15 20 25
Log small end diameter (inch)
Tot
al lo
g va
lue
($U
S)
Straight
Sweep

Proportion of Select Structural
0
0.1
0.2
0.3
0.4
0.5
0.6
0 5 10 15 20 25
Log small end diameter (inch)
Prop
orti
on S
elec
t Str
uctu
ral
StraightSweep

Average Lumber Value($ per MBF)
250
275
300
325
0 5 10 15 20 25
Log small end diameter (inch)
Ave
rage
Lum
ber
Val
ue($
US/
MB
F)
StraightSweep

Log value & volume due to rotation: Straight vs Swept
100110120130140150160170
0 60 120 180 240 300 360
Log rotation (degrees)
Tot
al L
og V
alue
($U
S)
400
450
500
550
Lum
ber
Vol
ume
(BF)
Straight $ Curved $ Straight BF Curved BF
Log 6211091 SED = 20 in.
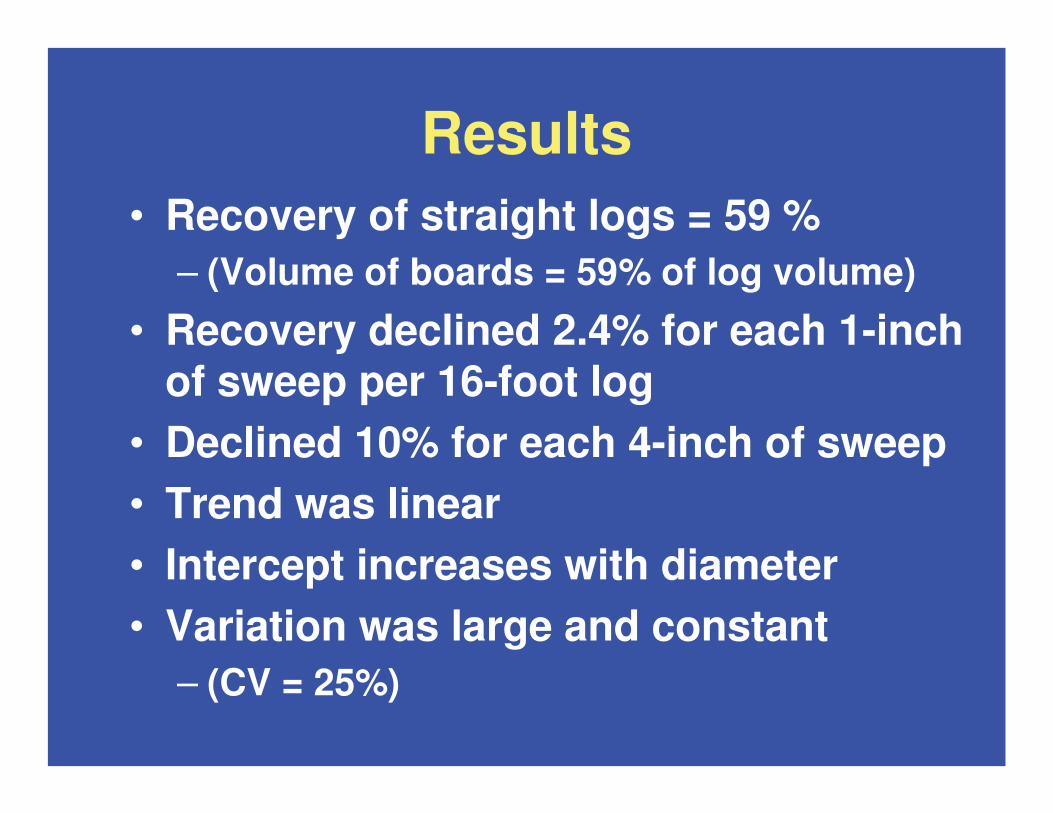
Results• Recovery of straight logs = 59 %
– (Volume of boards = 59% of log volume)
• Recovery declined 2.4% for each 1-inch of sweep per 16-foot log
• Declined 10% for each 4-inch of sweep• Trend was linear• Intercept increases with diameter• Variation was large and constant
– (CV = 25%)
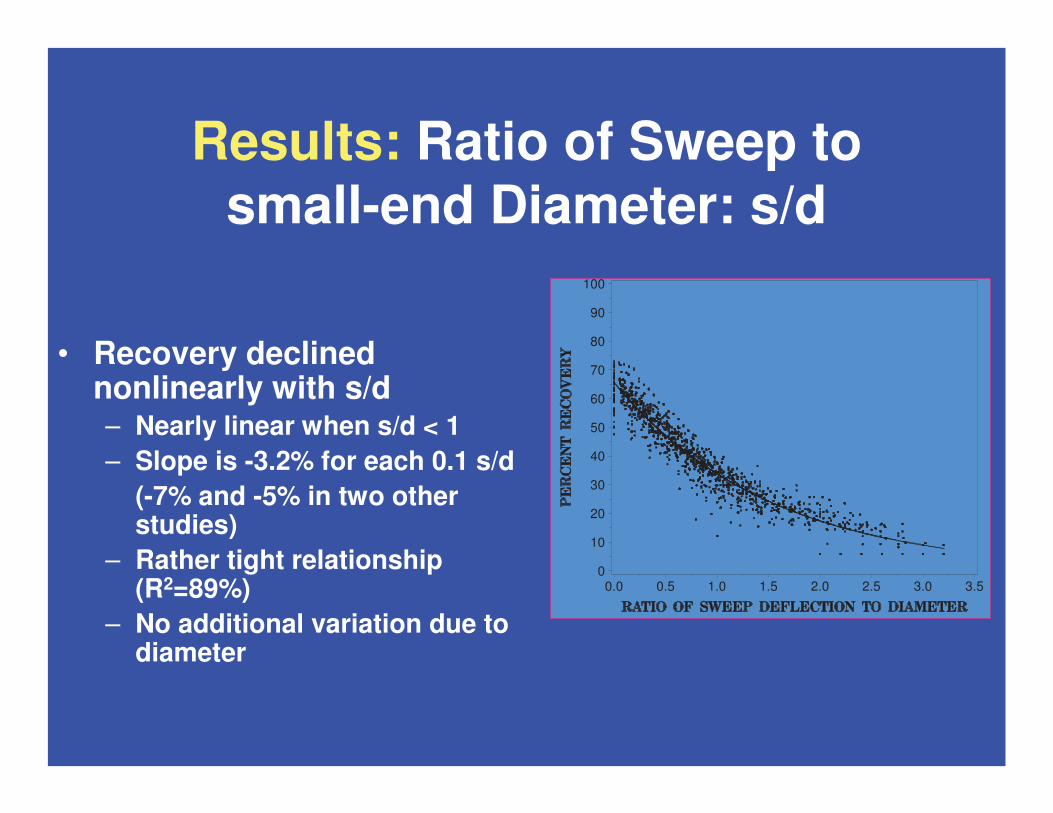
Results: Ratio of Sweep to small-end Diameter: s/d
• Recovery declined nonlinearly with s/d– Nearly linear when s/d < 1– Slope is -3.2% for each 0.1 s/d
(-7% and -5% in two other studies)
– Rather tight relationship (R2=89%)
– No additional variation due to diameter
0
10
20
30
40
50
60
70
80
90
100
0.0 0.5 1.0 1.5 2.0 2.5 3.0 3.5

Results
• Recovery % the same regardless of uniform or non-uniform sweep.
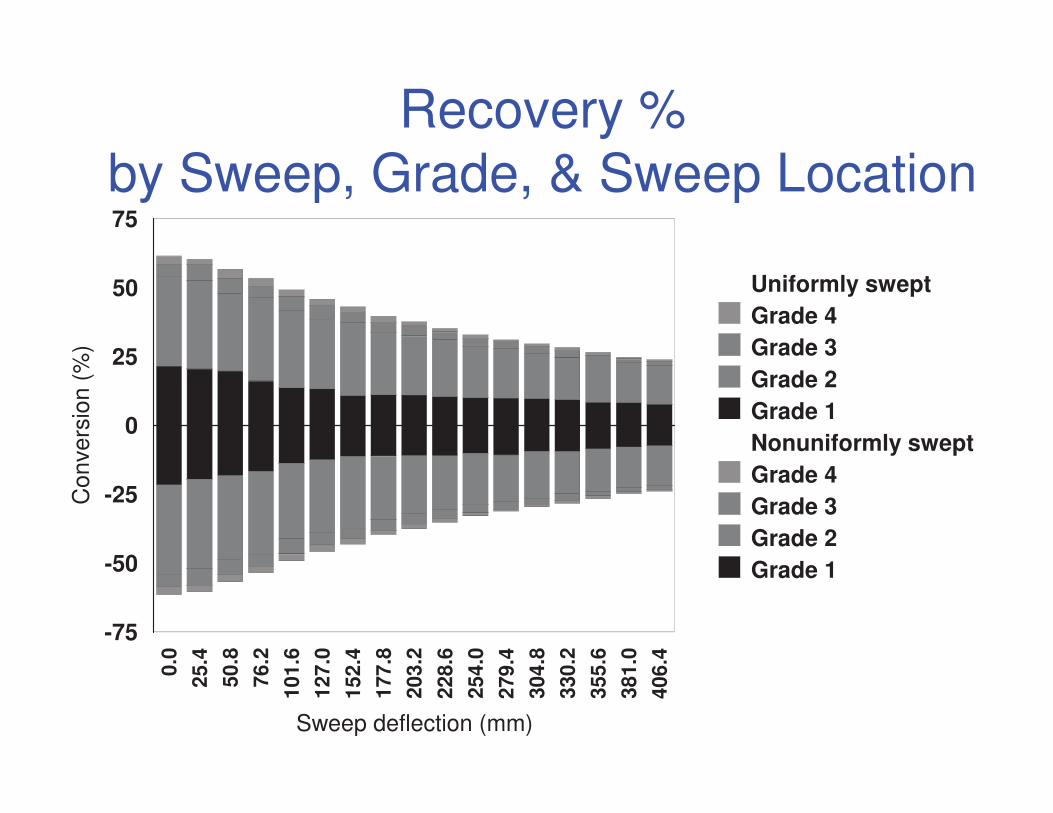
Recovery % by Sweep, Grade, & Sweep Location
0.0
25.4
50.8
76.2
101.
6
127.
0
152.
4
177.
8
203.
2
228.
6
254.
0
279.
4
304.
8
330.
2
355.
6
381.
0
406.
4
Sweep deflection (mm)
-75
-50
-25
0
25
50
75
Con
vers
ion
(%)
Uniformly sweptGrade 4Grade 3Grade 2Grade 1Nonuniformly sweptGrade 4Grade 3Grade 2Grade 1
Conclusions
• Expected trend of decreasing recovery % with increasing sweep was found– Trend was linear– Variation largely due to log size (diameter)
• Relation between recovery % and s/d(sweep/diam) was exponential decay, not a constant rate.
• Value loss ($/Vol) was also exponential decay

Conclusions
• Straight logs have higher value than swept logs
• Volume recovery is the main reason
• Differences in grade yield are a secondary reason
• More wane from curved logs is probably the cause

Conclusions
• Sawing discrete boards is a step function– Very sensitive to small changes in
initial set-up– Large and essentially constant
amount of variation always present
• Sawing simulation a useful tool for analyzing variation

Citation:
• Monserud, R.A, Parry, D., Todoroki, C.L. 2004. Recovery of Simulated Sawn Logs with Sweep. New Zealand Journal of Forestry Science 34(2): 190-205.
BUT.. log shape is not limited to sweep


