.. Recruit Holdings Co., Ltd. (TSE 6098) Consolidated Financial Results for Q2 FY 2017 1 November 14, 2017 Recruit Holdings, Co., Ltd. (TSE 6098) Consolidated Financial Results for the Six Months Ended September 30, 2017 (IFRS, Unaudited) Masumi Minegishi, President, CEO, and Representative Director Keiichi Sagawa, CFO and Senior Managing Corporate Executive Officer http://www.recruit-rgf.com/ir/ Tokyo, November 14, 2017―Recruit Holdings, Co., Ltd. (TSE 6098) (“Recruit Holdings” or the “Company”) announced today its financial results for the six months ended September 30, 2017. (Amounts are rounded to the nearest million yen) Consolidated Operating Results for the Six Months Ended September 30, 2017 (April 1 to September 30, 2017) For the Six Months Ended September 30, % change 2016 2017 (in millions of yen) Revenue 924,751 1,063,094 15.0 EBITDA 1 121,743 139,232 14.4 Operating income 117,497 108,391 (7.7) Profit before tax 119,376 113,233 (5.1) Profit for the period 84,339 82,448 (2.2) Profit attributable to owners of the parent 83,987 82,068 (2.3) Profit available for dividends 2 67,268 74,499 10.7 Total comprehensive income 29,402 103,443 251.8 Adjusted EPS (yen) 3 43.47 48.30 11.1 Earnings per share –Basic (yen) 49.70 49.13 - Earnings per share –Diluted (yen) 49.63 49.02 - Selected Consolidated Balance Sheet Information As of March 31, 2017 As of September 30, 2017 (in millions of yen) Total assets 1,462,903 1,509,752 Total equity 742,765 807,612 Equity attributable to owners of the parent 737,575 802,690 Ratio of equity attributable to owners of the parent (%) 50.4 53.2 Dividends for the Year Ending March 31, 2018 (April 1, 2017 to March 31, 2018) (the “Fiscal Year 2017” or “FY2017”) The Company’s dividend forecast for the Fiscal Year 2017 remained unchanged since May 12, 2017. FY2016 FY2017 Annual amount of dividends - At the end of Q1 - - At the end of Q2 - 11.00 At the end of Q3 - Not Available At the end of Q4 65.00* Not Available Total 65.00* 22.00 (Forecast) Note: See the note for the three-for-one stock split on page 2. Outlook for the Fiscal Year 2017 The Company’s consolidated annual earnings forecast for the Fiscal Year 2017 remained unchanged since May 12, 2017. FY2016 FY2017 (Forecast) % change (in millions of yen) Revenue 1,941,922 2,084,000 7.3 EBITDA 232,205 251,000 8.1 Operating income 193,513 185,500 (4.1) Profit attributable to owners of the parent 136,654 122,000 (10.7) Profit available for dividends 122,131 124,000 1.5 Adjusted EPS (yen) 80.06 82.01 2.4 Earnings per share –Basic (yen) 81.33 73.03 -
Transcript
.. Recruit Holdings Co., Ltd. (TSE 6098)
Consolidated Financial Results for Q2 FY 2017
1
November 14, 2017
Recruit Holdings, Co., Ltd. (TSE 6098) Consolidated Financial Results for the Six Months Ended September 30, 2017
(IFRS, Unaudited)
Masumi Minegishi, President, CEO, and Representative Director
Keiichi Sagawa, CFO and Senior Managing Corporate Executive Officer
http://www.recruit-rgf.com/ir/
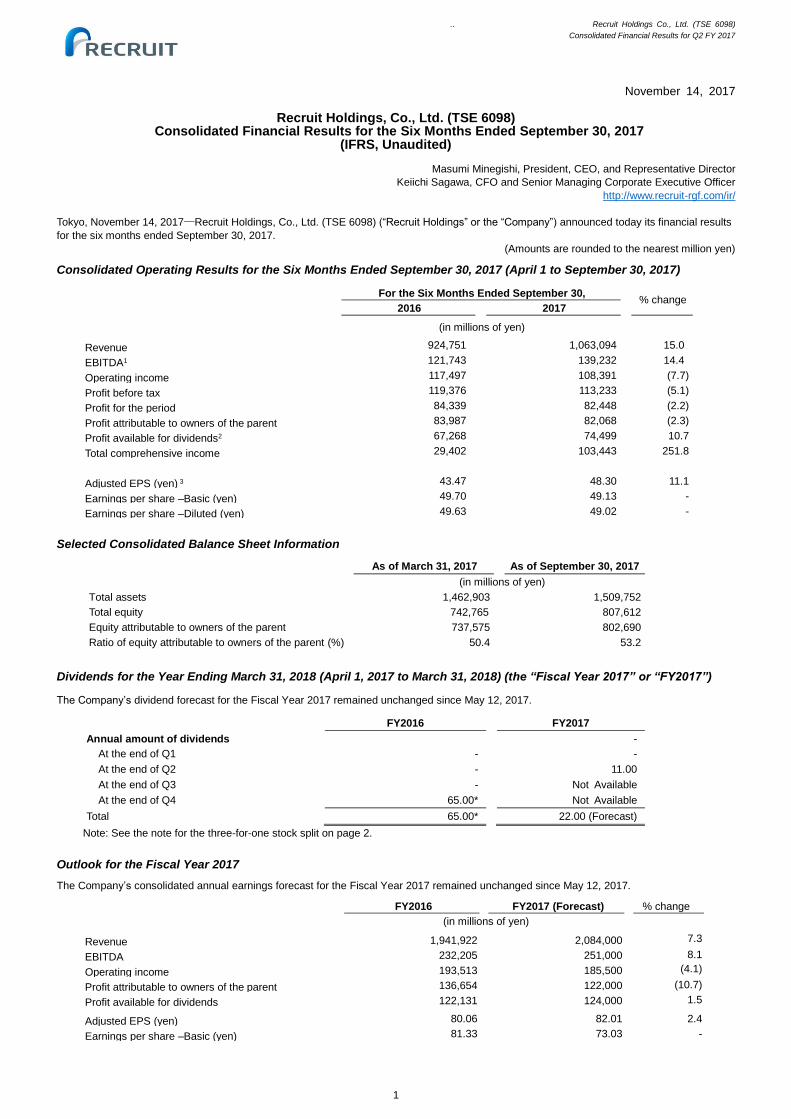
Tokyo, November 14, 2017―Recruit Holdings, Co., Ltd. (TSE 6098) (“Recruit Holdings” or the “Company”) announced today its financial results
for the six months ended September 30, 2017.
(Amounts are rounded to the nearest million yen)
Consolidated Operating Results for the Six Months Ended September 30, 2017 (April 1 to September 30, 2017)
For the Six Months Ended September 30, % change
2016 2017
(in millions of yen)
Revenue 924,751 1,063,094 15.0
EBITDA1 121,743 139,232 14.4
Operating income 117,497 108,391 (7.7)
Profit before tax 119,376 113,233 (5.1)
Profit for the period 84,339 82,448 (2.2)
Profit attributable to owners of the parent 83,987 82,068 (2.3)
Profit available for dividends2 67,268 74,499 10.7
Total comprehensive income 29,402 103,443 251.8
Adjusted EPS (yen) 3 43.47 48.30 11.1
Earnings per share –Basic (yen) 49.70 49.13 -
Earnings per share –Diluted (yen) 49.63 49.02 -
Selected Consolidated Balance Sheet Information
As of March 31, 2017 As of September 30, 2017
(in millions of yen)
Total assets 1,462,903 1,509,752
Total equity 742,765 807,612
Equity attributable to owners of the parent 737,575 802,690
Ratio of equity attributable to owners of the parent (%) 50.4 53.2
Dividends for the Year Ending March 31, 2018 (April 1, 2017 to March 31, 2018) (the “Fiscal Year 2017” or “FY2017”)
The Company’s dividend forecast for the Fiscal Year 2017 remained unchanged since May 12, 2017.
FY2016 FY2017
Annual amount of dividends -
At the end of Q1 - -
At the end of Q2 - 11.00
At the end of Q3 - Not Available
At the end of Q4 65.00* Not Available
Total 65.00* 22.00 (Forecast)
(Forecast) Note: See the note for the three-for-one stock split on page 2.
Outlook for the Fiscal Year 2017
The Company’s consolidated annual earnings forecast for the Fiscal Year 2017 remained unchanged since May 12, 2017.
FY2016 FY2017 (Forecast) % change
(in millions of yen)
Revenue 1,941,922 2,084,000 7.3
EBITDA 232,205 251,000 8.1
Operating income 193,513 185,500 (4.1)
Profit attributable to owners of the parent 136,654 122,000 (10.7)
Profit available for dividends 122,131 124,000 1.5
Notes: 1. After deducting corporate expense and eliminations. The total sum of the three segments does not agree with consolidated revenue. 2. The amounts shown are calculated by: revenues for the current period in foreign currency x (foreign exchange rate applied for the reporting period – the rate applied for the
same period of the previous year) 3. Monthly average rates are applied to the HR Technology segment. 4. The amount for this second quarter is calculated by deducting the amount for the first quarter from that for the six month period.
Overview
Recruit Holdings’ consolidated revenue for the three months ended September 30, 2017 (hereinafter quarterly, or the second quarter) was
¥538.6 billion, an increase of 10.8% from the same period of the previous year. This was mainly due to continued favorable growth of its Staffing
and HR Technology segments. The effect of the exchange rate fluctuation positively impacted the consolidated revenue during the period by
¥27.1 billion. As a result, consolidated revenue for the six months ended September 30. 2017, was ¥1,063.0 billion, an increase of 15.0% from
the same period of the previous year. The growth rate for the six-month period was higher than that for the second quarter as USG People, a
wholly owned Staffing subsidiary, started to be consolidated in June 2016 and recorded its operating results for a one-month period in the first
quarter of the previous year.
Consolidated operating income for the second quarter of the Fiscal Year 2017 was ¥52.0 billion, a decrease of 22.8% from the same quarter of
the previous year. This decline was mainly due to a non-recurring gain from sales of shares of subsidiaries of ¥22.1 billion recorded in the
second quarter of the previous year resulting from the transfer of a travel business subsidiary in the Media & Solutions segment. As a result,
operating income for the six-month period was ¥108.3 billion, a decrease of 7.7% year on year.
Profit before tax for the second quarter of the Fiscal Year 2017 was ¥54.1 billion, a decrease of 20.7% year on year. This was due primarily to a
decline in operating income impacted by the non-recurring gain mentioned above in the prior year. As a result, profit before tax for the six-month
period was ¥113.2 billion, a decrease of 5.1% from the same period of the prior year.
Quarterly profit was ¥41.9 billion, a decrease of 15.0%, and profit for the six-month period was ¥82.4 billion, a decrease of 2.2% year on year.
Quarterly profit attributable to owners of the parent was ¥41.8 billion, a decrease of 14.9% year on year, and that for the six month period was
¥82.0 billion, a decrease of 2.3% year on year. Both quarterly profit and quarterly profit attributable to owners of the parent declined
accompanied by a decline in quarterly operating income as mentioned above.
.. Recruit Holdings Co., Ltd. (TSE 6098)
Consolidated Financial Results for Q2 FY 2017
4
Management Key Performance Indicators
Quarterly consolidated EBITDA for the second quarter was ¥67.3 billion, an increase of 14.8% year on year. This was mainly a result of the
increased segment profit in all the three segments, the HR Technology, Media & Solutions and Staffing. Consolidated EBITDA for the six-month
period was ¥139.2 billion, an increase of 14.4% from the same period of the prior year.
Adjusted EPS for the second quarter was ¥22.97, an increase of 10.9% year on year, and adjusted EPS for the six-month period was ¥48.30, an
increase of 11.1% year on year. Quarterly profit available for dividends was ¥35.2 billion, an increase of 13.5% year on year, and that for the six-
month period was ¥74.4 billion, an increase of 10.7% year on year.
Quarterly consolidated revenues and EBITDA which exclude the effect of acquisitions or dispositions were the same as those stated above in
the Overview section since there were no items that were excluded for this reporting period. These figures correspond to the stated revenue and
EBITDA.
Management Measures during the Second Quarter of the Fiscal Year 2017
The Group Reorganization
The Company announced that its Board of Directors has resolved on September 27 and November 14 of 2017 on a reorganization of its
consolidated subsidiaries including the Company's company-split (collectively, the "Group Reorganization"), which was previously mentioned as
a significant subsequent event in the "Consolidated Financial Results for the Year Ended March 31, 2017 [Japanese GAAP]" dated May 12,
2017. According to these resolutions, the Company released timely disclosures regarding the disclosed matters respectively. In those
disclosures, the Company announced its intention to reorganize the Group by establishing consolidated groups under the Company based on its
three strategic business units: HR Technology, Media & Solutions, and Staffing. In addition, since this planned reorganization requires a
company-split, an extraordinary general meeting of shareholders will be held to submit this bill on January 17, 2018, setting October 31, 2017 as
the record date for voting rights execution. For further details, please refer to the following news releases.
Announcement on September 27, 2017: http://www.recruit-rgf.com/ir/ir_news/2017/0927_7911.html Announcement on November 14, 2017: http://www.recruit-rgf.com/ir/ir_news/2017/1114_7916.html
Interim Dividend Payment
The Company has changed its dividend policy to start interim dividend payments from the Fiscal Year 2017 in order to increase opportunities to
return profits to its shareholders. Under this policy, on November 14, 2017 the Board of Directors has declared an interim dividend of ¥11 per
share. The record date for the interim dividends is on September 30 of each year as stipulated in its articles of incorporation.
Results of Operations by Segment
HR Technology
This reportable segment consists of a single business operation, namely, “Indeed,” a job search engine website and its related businesses.
Quarterly revenue in the HR Technology segment was ¥52.7 billion, an increase of 75.8% year on year. This growth was mainly due to a
combination of new customer acquisition and expanding spend per account. Revenue for the six-month period was ¥99.1 billion, an increase of
67.9% year on year. On a US dollar basis, year-on-year revenue growth was 60.1% for the second quarter, and 59.3% for the six-month period.
Quarterly segment EBITDA was ¥8.4 billion, an increase of 116.1% year on year. This growth was primarily due to the revenue growth, which
outpaced growth in expenses during the quarter. To support its revenue growth, the HR Technology segment continued to invest in its sales
force and in marketing activities, the timing of which fluctuates throughout the year. Segment EBITDA for the six-month period was ¥16.1 billion,
an increase of 96.6% year on year.
The operating results of this reportable segment and its relevant data are as follows:
Paid Study Sapuri users (Others, Marketing Solutions) 3
215 230 237 244 318 333
Statistical data
Number of new housing starts4(Housing) 247,079 253,072 250,696 223,290 249,916 246,924
Job-offers to applicants ratio5 (Domestic Recruiting)
1.35 1.37 1.41 1.44 1.49 1.52
_______________________ Notes;
1. Pre-cancellation reservation acceptance basis, stating the cumulative total from the beginning of each fiscal year
2. Figures are shown in millions. 3. Figures are shown in thousands. 4. Source: Statistical Survey of Construction Starts, Ministry of Land, Infrastructure, Transport and Tourism of Japan 5. Source: Ministry of Health, Labour and Welfare of Japan
Marketing Solutions
Housing and Real Estate
Despite a slowdown in the number of new construction starts of condominium apartments in Japan, revenue in the independent housing and
leasing divisions grew as a result of the sales initiatives to offer solutions to its clients and to attract more users to its platform. As a result,
quarterly revenue was favorable at ¥25.1 billion, an increase of 5.4% year on year. Revenue for the six-month period amounted to ¥49.8 billion,
an increase of 0.4% from the same period in the previous year. The growth ratio for the six-month period was lower than the quarterly figure due
to the absence of one-time revenue realized in the prior year as mentioned above. Excluding this factor, revenue for the six-month period, on a
managerial accounting basis, increased by 6.0% from the same period of the previous year.
.. Recruit Holdings Co., Ltd. (TSE 6098)
Consolidated Financial Results for Q2 FY 2017
6
Bridal
Although the number of marrying couples and the number of couples who hold wedding receptions have been declining in Japan, the Bridal
subsegment focused on responding to the high demand by major wedding venue operator clients to attract marrying couples. As a result,
quarterly revenue was solid at ¥13.9 billion, an increase of 1.6% year on year. Revenue for the six-month period was ¥27.8 billion, an increase
of 1.9% year on year.
Travel
The total number of hotel guests who made reservations on the Travel subsegment platform increased as the subsegment carried out
campaigns to promote its usage. Meanwhile, the year-on-year quarterly revenue growth rate for this second quarter declined due to a sales of a
subsidiary in the second quarter of the previous year. As a result, quarterly revenue was ¥16.9 billion, a decrease of 0.1% year on year.
Revenue for the six-month period was ¥30.5 billion, a decrease of 1.5% year on year. Excluding the impact of the divestiture, revenue increased
by 7.1% year on year, calculated using the figure subtracting the subsidiary’s revenue from the subsegment revenue for the same period of the
previous year.
Dining
Dining and restaurant operators have been facing a challenging environment mainly due to the workforce shortage in Japan. Additionally, a few of the Dining subsegment’s major clients were forced to reduce their spending on sales promotion. Meanwhile, the subsegment intensively focused its efforts to promote Air Platform, a cloud-based operational support package, and strengthened its relationship with clients by providing operational solutions to them. As a result, quarterly revenue stagnated at ¥8.8 billion, a decrease of 1.1% year on year. Revenue for the six-month period was ¥17.6 billion, a decrease of 1.0% year on year.
Beauty
Online beauty salon reservations on the Beauty subsegment platform, Hot Pepper Beauty, continued to show solid growth as a result of an
increase in the number of clients using SALON BOARD, a cloud-based beauty salon vacancy management and other support package, while
improving its functionality. In addition, as a result of its efforts to extend its reach to non-urban salons, the number of its clients has further
increased. As a result, quarterly revenue was favorable at ¥15.7 billion, an increase of 11.0% year on year. Revenue for the six-month period
was ¥30.7 billion, an increase of 10.4% year on year.
Others
Revenues from the Automobile, Post-secondary Education, Overseas Marketing, and Air Platform businesses were included in this subsegment.
Quarterly revenues were strong at ¥16.2 billion, an increase of 13.9% year on year. Revenues for the six-month period were ¥31.9 billion, an
increase of 10.6% year on year.
HR Solutions
Domestic Recruiting
The Japanese domestic labor market has remained very tight as evidenced by the rise in the ratio of job-offers to applicants and a continued
increase in the number of job advertisements. In this environment, both Full-time and Part-time Recruitment divisions have achieved solid
growth as a result of enhancing their brand values, strengthening user attractiveness, and reinforcing their sales structure. As a result, quarterly
revenue was solid at ¥62.2 billion, an increase of 1.4% year on year. Revenue for the six-month period was ¥128.5 billion, an increase of 2.8%
year on year.
Others
Revenues from the HR development service in Japan and placement service in the Asian region were recorded in this subsegment. Quarterly
revenues were favorable at ¥6.4 billion, an increase of 4.1% year on year. Revenues for the six-month period was ¥11.4 billion, an increase of
7.2% year on year.
.. Recruit Holdings Co., Ltd. (TSE 6098)
Consolidated Financial Results for Q2 FY 2017
7
Staffing
In this reportable segment, there are two major regional operations; Japan and Overseas.
Quarterly revenue in the Staffing segment was ¥324.6 billion, an increase of 8.2% year on year. This was mainly because of the increased
revenue from the operations in Japan supported by a solid market environment. In addition, revenue from the overseas operation increased as a
result of the impact of foreign exchange rate movements in this quarter. As a result, revenue for the six-month period was ¥642.6 billion, an
increase of 16.3% year on year. The growth rate for the six-month period was higher than that for this second quarter as USG People started to
be consolidated in June 2016.
Quarterly segment EBITDA was ¥20.1 billion, an increase of 14.0% year on year. This was mainly due to the increased revenue from the
Japanese operations. The breakdown of segment EBITDA was as follows: ¥9.0 billion from the Japanese operations, an increase of 27.5% year
on year, and ¥11.0 billion from the overseas operations, an increase of 4.8% year on year. As a result, segment EBITDA for the six-month period
was ¥40.7 billion, an increase of 25.3% year on year. The growth rate for the six-month period was higher than the quarterly figure due to the
timing of USG People’s consolidation as mentioned above. Segment EBITDA was comprised of ¥20.4 billion from the Japanese operations, an
increase of 40.2% year on year, and ¥20.2 billion from the overseas operations, an increase of 13.2% year on year.
The operating results of this reportable segment and its relevant data are as follows:
Source: Japan Staffing Services Association. The figure for this reported quarter is omitted since the data has not been disclosed at the time of release of this document.
Japan
The Japanese staffing market continues to expand moderately as evidenced by the continued increase in the number of active agency workers.
Under this environment, the Japanese operations focused on extending existing staffing contracts and increasing the number of new staffing
contracts. As a result, quarterly revenue was favorable at ¥123.9 billion, an increase of 10.4% year on year. Revenue for the six-month period
was ¥249.6 billion, an increase of 11.5% year on year.
Overseas
Quarterly revenue was ¥200.6 billion, an increase of 6.9% year on year. The positive effect of foreign exchange rate movements on its revenue during this quarter was ¥22.5 billion. Excluding this effect, the quarterly revenue declined by 4.4% year on year. This was primarily due to its operating focus on profitability based on the Unit management system. In addition, the operations experienced a decrease in transactions with existing clients who limited their spending owing to the challenging business environment in some industries in the United States. As a result, revenue for the six-month period was ¥392.9 billion, an increase of 19.5% year on year. The reason for higher growth rate for the six-month period than the quarterly growth rate was the timing of USG People’s consolidation as mentioned above. Effects of foreign exchange rate movements for the six-month period positively impacted revenue by ¥27.1 billion. Normalized revenue for the six-month period, excluding factors of USG People’s consolidation and applied foreign exchange rates, declined by 4.4% year on year for the same reason as the quarterly revenue growth rate.
.. Recruit Holdings Co., Ltd. (TSE 6098)
Consolidated Financial Results for Q2 FY 2017
8
Analysis of Consolidated Balance Sheet
As of March
31, 2017
As of September
30, 2017 Variance % change
(in billions of yen)
Assets
Total current assets 691.3 699.1 7.7 1.1
Total non-current assets 771.5 810.6 39.1 5.1
Total assets 1,462.9 1,509.7 46.8 3.2
Liabilities
Total current liabilities 413.5 402.5 (10.9) (2.6)
Total non-current liabilities 306.6 299.5 (7.0) (2.3)
Total liabilities 720.1 702.1 (17.9) (2.5)
Equity
Total equity attributable to owners of the parent 737.5 802.6 65.1 8.8
Non-controlling interests 5.1 4.9 (0.2) (5.2)
Total equity 742.7 807.6 64.8 8.7
Assets
Total current assets were ¥699.1 billion, an increase of ¥7.7 billion, or 1.1%, from the end of the previous fiscal year. This was mainly due to an
increase in other current assets of ¥13.8 billion, a decrease in cash and cash equivalents of ¥3.7 billion, and a decrease in other financial assets
of ¥3.0 billion. Non-current assets were ¥810.6 billion, an increase of ¥39.1 billion, or 5.1%, from the end of the previous fiscal year. This was
mainly because an increase in property, plant and equipment of ¥4.9 billion, an increase of ¥22.4 billion in goodwill recorded in foreign currency
by Japanese yen depreciation, and an increase of ¥5.9 billion in intangible assets due to an increase in software. As a result, total assets as of
September 30, 2017 were ¥1,509.7 billion, an increase of ¥46.8 billion, or 3.2%, from the end of the previous fiscal year.
Liabilities
Current liabilities were ¥402.5 billion, a decrease of ¥10.9 billion or 2.6%, from the end of the previous fiscal year. This was mainly due to a
decrease in trade and other payables of ¥3.7 billion, a decrease in income tax payables of ¥5.5 billion, a decrease in allowance of ¥3.4 billion,
and an increase in other current liabilities of ¥3.4 billion. Non-current liabilities were ¥299.5 billion, a decrease of ¥7.0 billion or 2.3%, from the
end of the previous fiscal year. This was mainly due to a decrease in bonds and borrowings of ¥12.0 billion, an increase in deferred tax liabilities
of ¥1.4 billion, and an increase in other non-current liabilities of ¥2.7 billion. As a result, total liabilities as of September 30, 2017 were ¥702.1
billion, a decrease of ¥17.9 billion or 2.5% from the end of the previous fiscal year.
Equity
Total equity as of September 30, 2017 was ¥807.6 billion, an increase of ¥64.8 billion or 8.7%, from the end of the previous fiscal year. This was
mainly due to an increase in retained earnings of ¥45.0 billion resulting from the recording of profit for the period and payment of dividends, and
an increase in other components of equity of ¥22.9 billion resulting from an increase in exchange differences on translation of foreign
operations.
Analysis of Consolidated Cash Flows
Six Months
Ended September 30,
Variance
2016 2017
(in billions of yen)
Net cash flows from operating activities 70.8 92.5 21.7
Net cash flows from investing activities (198.1) (41.7) 156.4
Net cash flows from financing activities 103.6 (53.0) (156.6)
Effect of exchange rate changes on cash and cash equivalents (7.1) (1.5) 5.5
Net increase (decrease) in cash and cash equivalents (30.7) (3.7) 27.0
Cash and cash equivalents at the beginning of the period 309.8 355.1 45.3
Cash and cash equivalents at the end of the period 279.0 351.4 72.3
Cash and cash equivalents (hereinafter referred to as “cash”) as of September 30, 2017 was ¥351.4 billion, a decrease of ¥3.7 billion from the
end of the previous year, since cash outflows from investing and financing activities exceeded cash inflows from operating activities.
Cash Flows from Operating Activities
Cash provided by operating activities during the six months ended September 30, 2017 was ¥92.5 billion, a year-on-year increase of ¥21.7
billion, or 30.7%. This was mainly due to adding ¥29.5 billion of depreciation and amortization to, and subtracting ¥37.6 billion of income tax paid
from profit before tax of ¥113.2 billion.
.. Recruit Holdings Co., Ltd. (TSE 6098)
Consolidated Financial Results for Q2 FY 2017
9
Cash Flows from Investing Activities
Cash used in investing activities during the six months ended September 30, 2017 was ¥41.7 billion, a year-on-year decrease of ¥156.4 billion
or 78.9%. This was mainly due to payment for purchase of property, plant and equipment of ¥9.8 billion, payment for purchase of intangible
assets of ¥21.6 billion, and payment for purchase of shares of subsidiaries and associates of ¥5.3 billion.
Cash Flows from Financing Activities
Cash used in financing activities during the six months ended September 30, 2017 was a decrease of ¥53.0 billion (¥103.6 billion inflow for the
same period of the previous year). This was mainly due to repayment of long-term borrowings of ¥12.4 billion and dividends paid of ¥36.1 billion.
Outlook for the Fiscal Year 2017
The Company’s consolidated earnings forecast for the Fiscal Year 2017 remained unchanged since May 12, 2017.
.
.. Recruit Holdings Co., Ltd. (TSE 6098)
Consolidated Financial Results for Q2 FY 2017
10
2. Condensed Consolidated Financial Statements and Primary Notes
(1) Condensed Consolidated Statement of Financial Position
(in millions of yen)
As of April 1, 2016
(Date of transition to
IFRS)
As of March 31, 2017 As of
September 30, 2017
Assets
Current assets
Cash and cash equivalents 309,860 355,196 351,438
Trade and other receivables 221,998 294,456 295,144
Other current financial assets 21,792 21,330 18,298
Other current assets 14,454 20,410 34,256
Total current assets 568,106 691,394 699,138
Non-current assets
Property, plant and equipment 39,515 49,158 54,123
Goodwill 169,264 303,273 325,753
Intangible assets 138,684 229,914 235,838
Investments in associates and joint
ventures 34,199 37,627 40,361
Other non-current financial assets 109,862 113,413 115,869
Deferred tax assets 32,864 32,879 31,655
Other non-current assets 5,552 5,241 7,012
Total non-current assets 529,942 771,508 810,613
Total assets 1,098,049 1,462,903 1,509,752
.. Recruit Holdings Co., Ltd. (TSE 6098)
Consolidated Financial Results for Q2 FY 2017
11
(in millions of yen)
As of April 1, 2016
(Date of transition to
IFRS)
As of March 31, 2017 As of
September 30, 2017
Liabilities and equity
Liabilities
Current liabilities
Trade and other payables 153,274 173,947 170,228
Bonds and borrowings 15,044 24,967 25,002
Other financial liabilities 6,453 3,097 1,338
Income tax payables 39,237 32,847 27,333
Provisions 4,212 9,114 5,634
Other current liabilities 112,030 169,551 173,047
Total current liabilities 330,253 413,524 402,584
Non-current liabilities
Bonds and borrowings - 186,620 174,579
Other financial liabilities 3,837 1,960 1,749
Provisions 3,210 4,198 4,203
Net defined benefit liability 44,019 43,349 44,299
Deferred tax liabilities 36,082 52,739 54,196
Other non-current liabilities 12,401 17,743 20,527
Total non-current liabilities 99,553 306,612 299,555
Total liabilities 429,806 720,137 702,140
Equity
Equity attributable to owners
of the parent
Common stock 10,000 10,000 10,000
Share premium 53,756 52,529 50,119
Retained earnings 598,188 714,055 759,092
Treasury shares (495) (31,640) (32,130)
Other components of equity 2,306 (7,369) 15,609
Total equity attributable to
owners of the parent 663,755 737,575 802,690
Non-controlling interests 4,487 5,190 4,921
Total equity 668,243 742,765 807,612
Total liabilities and equity 1,098,049 1,462,903 1,509,752
.. Recruit Holdings Co., Ltd. (TSE 6098)
Consolidated Financial Results for Q2 FY 2017
12
(2) Condensed Consolidated Statement of Profit and Loss
For the Six-Month Period
(in millions of yen)
Six Months Ended
September 30, 2016
Six Months Ended
September 30, 2017
Revenue 924,751 1,063,094
Cost of sales 496,653 571,674
Gross profit 428,097 491,420
Selling, general and administrative
expenses 330,605 381,706
Other operating income 23,079 860
Other operating expenses 3,075 2,182
Operating income 117,497 108,391
Share of profit (loss) of associates and joint
ventures 2,062 1,835
Finance income 1,435 3,321
Finance costs 1,617 316
Profit before tax 119,376 113,233
Income tax expense 35,037 30,784
Profit for the period 84,339 82,448
Profit attributable to:
Owners of the parent 83,987 82,068
Non-controlling interests 351 379
Profit for the period 84,339 82,448
Earnings per share attributable to owners of the
parent
Basic earnings per share (yen) 49.70 49.13
Diluted earnings per share (yen) 49.63 49.02
.. Recruit Holdings Co., Ltd. (TSE 6098)
Consolidated Financial Results for Q2 FY 2017
13
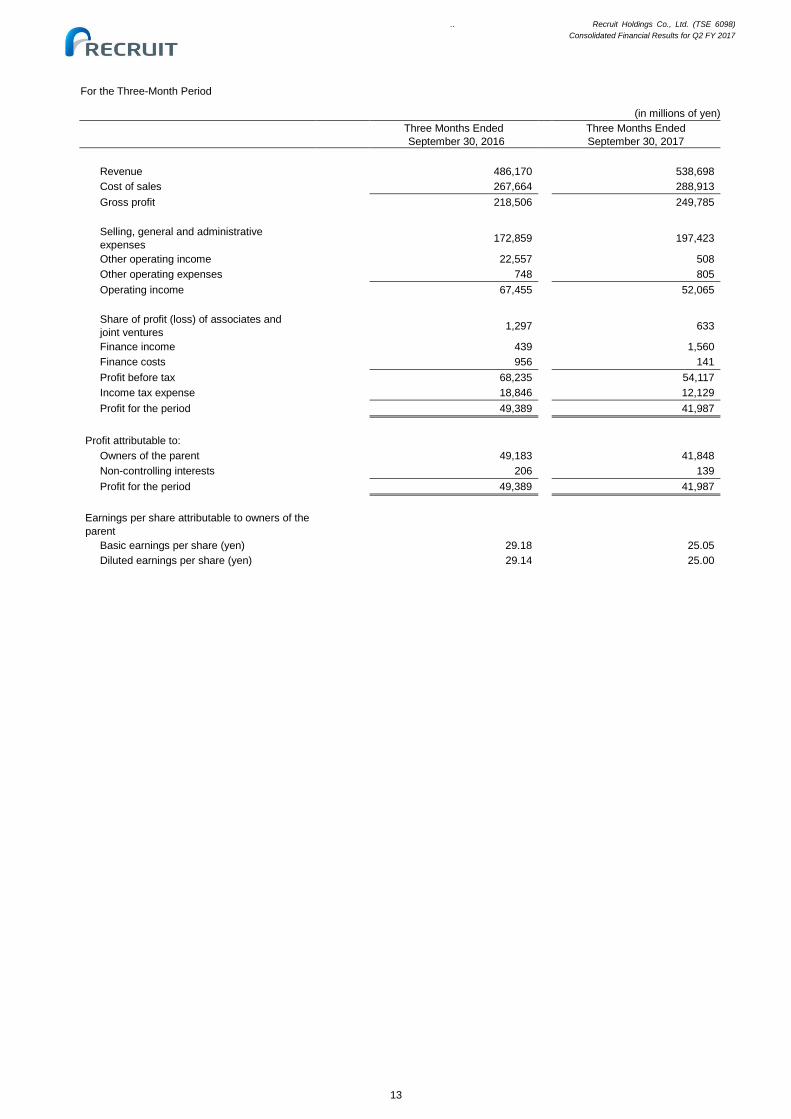
For the Three-Month Period
(in millions of yen)
Three Months Ended
September 30, 2016
Three Months Ended
September 30, 2017
Revenue 486,170 538,698
Cost of sales 267,664 288,913
Gross profit 218,506 249,785
Selling, general and administrative
expenses 172,859 197,423
Other operating income 22,557 508
Other operating expenses 748 805
Operating income 67,455 52,065
Share of profit (loss) of associates and
joint ventures 1,297 633
Finance income 439 1,560
Finance costs 956 141
Profit before tax 68,235 54,117
Income tax expense 18,846 12,129
Profit for the period 49,389 41,987
Profit attributable to:
Owners of the parent 49,183 41,848
Non-controlling interests 206 139
Profit for the period 49,389 41,987
Earnings per share attributable to owners of the
parent
Basic earnings per share (yen) 29.18 25.05
Diluted earnings per share (yen) 29.14 25.00
.. Recruit Holdings Co., Ltd. (TSE 6098)
Consolidated Financial Results for Q2 FY 2017
14
(3) Condensed Consolidated Statement of Comprehensive Income
For the Six-Month Period
(in millions of yen)
Six Months Ended
September 30, 2016
Six Months Ended
September 30, 2017
Profit for the period 84,339 82,448
Other comprehensive income
Items that will not be reclassified to profit or loss:
Net change in financial assets measured at
fair value through other comprehensive
income
(5,074) (1,420)
Remeasurements of defined benefit plans - -
Share of other comprehensive income of
associates and joint ventures
- (3)
Subtotal (5,074) (1,423)
Items that may be reclassified subsequently to
profit or loss:
Exchange differences on translation of foreign
operations
(49,881) 22,418
Effective portion of the change in the fair value
of cash flow hedges
19 0
Subtotal (49,862) 22,418
Other comprehensive income (loss) for the
period, net of tax
(54,936) 20,995
Comprehensive income for the period 29,402 103,443
Comprehensive income attributable to:
Owners of the parent 29,404 103,040
Non-controlling interests (2) 402
Total comprehensive income 29,402 103,443
For the Three-Month Period
(in millions of yen)
Three Months Ended September
30, 2016
Three Months Ended September
30, 2016
Profit for the period 49,389 41,987
Other comprehensive income
Items that will not be reclassified to profit or loss:
Net change in financial assets measured at fair
value through other comprehensive income 1,955 206
Remeasurements of defined benefit plans - -
Share of other comprehensive income of
associates and joint ventures - 2
Subtotal 1,955 208
Items that may be reclassified subsequently to
profit or loss:
Exchange differences on translation of foreign
operations (10,808) 12,217
Effective portion of the change in the fair value
of cash flow hedges 372 (536)
Subtotal (10,436) 11,681
Other comprehensive income (loss) for the
period, net of tax (8,480) 11,889
Comprehensive income for the period 40,908 53,877
Comprehensive income attributable to:
Owners of the parent 40,735 53,715
Non-controlling interests 173 161
Total comprehensive income 40,908 53,877
.. Recruit Holdings Co., Ltd. (TSE 6098)
Consolidated Financial Results for Q2 FY 2017
15
(4) Condensed Consolidated Statement of Changes in Equity
For the Six Months Ended September 30, 2016
(in millions of yen)
Equity attributable to owners of the parent
Common stock
Share premium
Retained earnings
Treasury shares
Other components of equity
Share-based payments
Exchange differences on translation of
foreign operations
Effective portion of the change in the fair value of
cash flow hedges
Balance at April 1, 2016 10,000 53,756 598,188 (495) 2,137 - 168
Profit for the period 83,987
Other comprehensive income
(49,527) 19
Comprehensive income for the period
- - 83,987 - - (49,527) 19
Transfer from other components of equity to retained earnings
(5,074)
Purchase of treasury shares
(77) (30,000)
Disposal of treasury shares
60 35 (95)
Dividends (28,236)
Share-based payments
Equity transactions with non-controlling interests
(1,208)
Increase (decrease) by business combination
Other 1,208
Transactions with owners - total
- (1,226) (32,103) (29,964) (95) - -
Balance at September 30, 2016
10,000 52,529 650,073 (30,460) 2,042 (49,527) 187
Equity attributable to owners of the parent
Non-controlling interests
Total equity
Other components of equity
Total
Net change in financial assets
measured at fair value
through other comprehensiv
e income
Remeasure-ments of defined
benefit plans
Total
Balance at April 1, 2016 - - 2,306 663,755 4,487 668,243
Profit for the period - 83,987 351 84,339
Other comprehensive income
(5,074) (54,582) (54,582) (354) (54,936)
Comprehensive income for the period
(5,074) - (54,582) 29,404 (2) 29,402
Transfer from other components of equity to retained earnings
5,074 5,074 - -
Purchase of treasury shares
- (30,078) (30,078)
Disposal of treasury shares
(95) 0 0
Dividends - (28,236) (28,236)
Share-based payments - - -
Equity transactions with non-controlling interests
- (1,208) (554) (1,763)
Increase (decrease) by business combination
- - 797 797
Other - 1,208 (46) 1,161
Transactions with owners - total
5,074 - 4,979 (58,315) 195 (58,119)
Balance at September 30, 2016
- - (47,297) 634,844 4,681 639,525
.. Recruit Holdings Co., Ltd. (TSE 6098)
Consolidated Financial Results for Q2 FY 2017
16
For the Six Months Ended September 30, 2017
(in millions of yen)
Equity attributable to owners of the parent
Common stock
Share premium
Retained earnings
Treasury shares
Other components of equity
Share-based payments
Exchange differences on translation of
foreign operations
Effective portion of the change in the fair value of
cash flow hedges
Balance at April 1, 2017 10,000 52,529 714,055 (31,640) 3,221 (11,383) 792
Profit for the period 82,068
Other comprehensive income
22,395 0
Comprehensive income for the period
- - 82,068 - - 22,395 0
Transfer from other components of equity to retained earnings
(1,423)
Purchase of treasury shares
(17) (1,063)
Disposal of treasury shares
(131) 573 (442)
Dividends (36,195)
Share-based payments 1,026
Equity transactions with non-controlling interests
(2,245)
Increase (decrease) by business combination
Other (16) 586
Transactions with owners - total
- (2,410) (37,032) (490) 584 - -
Balance at September 30, 2017
10,000 50,119 759,092 (32,130) 3,805 11,011 793
Equity attributable to owners of the parent
Non-controlling interests
Total equity
Other components of equity
Total
Net change in financial assets
measured at fair value
through other comprehensiv
e income
Remeasure-ments of defined
benefit plans
Total
Balance at April 1, 2017 - - (7,369) 737,575 5,190 742,765
Profit for the period - 82,068 379 82,448
Other comprehensive income
(1,423) 20,972 20,972 23 20,995
Comprehensive income for the period
(1,423) - 20,972 103,040 402 103,443
Transfer from other components of equity to retained earnings
1,423 1,423 - -
Purchase of treasury shares
- (1,081) (1,081)
Disposal of treasury shares
(442) 0 0
Dividends - (36,195) (36,195)
Share-based payments 1,026 1,026 1,026
Equity transactions with non-controlling interests
- (2,245) (836) (3,082)
Increase (decrease) by business combination
- - -
Other - 570 164 735
Transactions with owners - total
1,423 - 2,007 (37,925) (671) (38,597)
Balance at September 30, 2017
- - 15,609 802,690 4,921 807,612
.. Recruit Holdings Co., Ltd. (TSE 6098)
Consolidated Financial Results for Q2 FY 2017
17
(5) Condensed Consolidated Statement of Cash Flows
(in millions of yen)
Six Months Ended
September 30, 2016
Six Months Ended
September 30, 2017
Cash flows from operating activities
Profit before tax 119,376 113,233
Depreciation and amortization 24,250 29,519
Gain on sales of investments in
subsidiaries
(22,174) (298)
(Increase) decrease in trade and other
receivables
12,507 7,131
Increase (decrease) in trade and other payables (7,266) (7,432)
Other (9,183) (13,314)
Subtotal 117,510 128,838
Interest and dividends received 934 1,493
Interest paid (998) (87)
Income tax paid (46,618) (37,660)
Net cash flows from operating activities 70,828 92,583
Cash flows from investing activities
Payment for purchase of property, plant and
equipment
(12,070) (9,811)
Payment for purchase of intangible assets (30,916) (21,630)
Payment for purchase of shares of
subsidiaries and associates
(172,462) (5,358)
Proceeds from sales of shares of
subsidiaries and associates
23,082 291
Other (5,769) (5,213)
Net cash flows from investing activities (198,136) (41,723)
Cash flows from financing activities
Proceeds from long-term borrowings 174,704 -
Repayments of long-term borrowings (7,500) (12,479)
Payments of purchase of treasury shares (30,078) (1,081)
Dividends paid (28,568) (36,149)
Other (4,897) (3,314)
Net cash flows from financing activities 103,660 (53,024)
Effect of exchange rate changes on cash and cash
equivalents
(7,120) (1,594)
Net increase (decrease) in cash and cash equivalents (30,768) (3,758)
Cash and cash equivalents at the beginning of the
period
309,860 355,196
Cash and cash equivalents at the end of the period 279,092 351,438
.. Recruit Holdings Co., Ltd. (TSE 6098)
Consolidated Financial Results for Q2 FY 2017
18
(6) Going Concern Assumption
Not applicable.
(7) Notes to Condensed Consolidated Financial Statements
1. Reporting Entity
Recruit Holdings Co., Ltd. (the “Company”) is a stock company incorporated under the Companies Act of Japan and domiciled in Japan.
The addresses of its registered headquarters and principal business locations are disclosed on the Company’s website
(http://www.recruit.jp/). The details of businesses and principal activities of the Company and its subsidiaries (the “Group”) are described in
“5. Operating Segments.”
2. Basis of Preparation
(1) Compliance of the condensed consolidated financial statements with IFRS and matters regarding the first-time adoption thereof
The Company’s condensed consolidated financial statements are prepared in conformity with International Accounting Standards 34
“Interim Financial Reporting” (hereinafter “IAS 34”). The Company applies the provisions of Article 93 of Ordinance on Terminology, Forms,
and Preparation Methods of Quarterly Financial Statements, etc. (Cabinet Office Ordinance No. 64 of 2007) (hereinafter “Ordinance on
Quarterly Financial Statements”) since it meets the requirements of the “Specified Company under Designated International Accounting
Standards” prescribed in Article 1-2 of the same ordinance.
The Group adopted IFRS from the year ending March 31, 2018 and prepares the condensed consolidated financial statements in
conformity with IAS 34 from the first quarter ended June 30, 2017. The date of transition to IFRS is April 1, 2016. In the transition to IFRS,
the Group applied IFRS 1 “First-time Adoption of International Financial Reporting Standards” (“IFRS 1”). The effects of the transition to
IFRS on the financial position, operating results, and cash flows of the Group are disclosed in Note “6. First-time Adoption.”
(2) Basis of measurement
The condensed consolidated financial statements of the Company are prepared on the historical cost basis except for certain financial
instruments and other assets that are measured at fair value.
(3) Functional currency and presentation currency
The condensed consolidated financial statements of the Company are presented in Japanese yen, which is the functional currency of the
Company, and figures less than one million yen are rounded down to the nearest million yen.
(4) Early adoption of standards and interpretations
The Group early applied the following standards:
・IFRS 9 “Financial Instruments” (revised in 2014)
(5) Standards and interpretations in issue but not yet adopted by the Group
Major standards that were issued by the date of approval of the condensed consolidated financial statements are as follows. The Group did
not early adopt them in the second quarter ended September 30, 2017.The Company is currently evaluating the effects of the adoption of
these standards on the Company’s condensed consolidated financial statements and they cannot be estimated at the time of this report.