83
2013 TRC1101 Recycled Asphalt Shingles in Asphalt Pavements Stacy G. Williams, Joshua D. King Final Report
2013
TRC1101
Recycled Asphalt Shingles in Asphalt Pavements
Stacy G. Williams, Joshua D. King
Final Report
Recycled Asphalt Shingles in Asphalt Pavements
Final Report
TRC-1101
by
Stacy G. Williams, Ph.D., P.E. Director, CTTP Research Associate Professor Department of Civil Engineering University of Arkansas
Joshua D. King, M.S. Department of Civil Engineering University of Arkansas
July 26, 2013
The statements contained in this report are the sole responsibility of the authors, and do not necessarily reflect the official views of the Arkansas State Highway
and Transportation Department. The use of specific product names in this paper does not constitute or imply an endorsement of those products. This document
does not constitute a standard, specification, or regulation.
TRC 1101 – Final Report
1
1. Introduction
Asphalt shingles are one of the largest wastes generated from construction with an estimated 11 million tons of waste shingles each year (Grodinsky et al. 2002). Relieving the landfills and utilizing more environmentally friendly construction processes has become a large concern. Including waste shingles in asphalt mixtures may provide a viable method for reducing the amount of shingle waste in landfills. The inclusion of shingle in asphalt mixes can also reduce costs associated with asphalt materials while bettering certain material properties of the pavement. Because aged shingles have stiff liquid asphalt, rutting resistance may be enhanced. Currently, many states provide specifications allowing for the use of shingles in asphalt mixtures, but the Arkansas Highway and Transportation Department (AHTD) only allows for the use of 3 percent shingles as a special provision (Hall 2010). If waste shingles provide positive results for asphalt mixtures in Arkansas, provisions for the design, verification, and construction of pavement utilizing RAS will contribute to the pavement engineering community. Recycled, or Reclaimed, Asphalt Shingles (RAS) is a technology that holds promise for reduced impacts on landfills, reducing asphalt costs, and enhancing pavement performance. However, the manner in which RAS influences certain pavement properties has not been well documented, and many questions still exist. By adding RAS to asphalt mixtures, the binder content, volumetric properties, rutting susceptibility, and stiffness are all expected to change. The binder contribution is the most appealing part of this research in that it provides the potential for significant savings. The shingles’ ability to release binder depends on factors such as mixing temperature, the point at which RAS in introduced into the mix, and most importantly shingle grind size. In order to provide specifications, the influence of RAS on asphalt properties was investigated.
2. Problem Statement Reclaimed asphalt shingles (RAS) are a new development in asphalt pavement technology. The inclusion of RAS may reduce the cost of asphalt pavements while also increasing the stiffness of the pavement. Along with the potential cost reduction it will also reduce the amount of shingle waste in landfills. Asphalt roofing shingles are one of the major components of debris generated from construction, demolition and renovation projects. Current AHTD specifications do not include provisions for the use of RAS. Therefore, if RAS is found to be a viable technology for the production of asphalt pavements in Arkansas, provisions for the design, verification, and construction of RAS pavements will need to be incorporated into AHTD Standard Specifications to allow its use.
TRC 1101 – Final Report
2
3. Background Asphalt shingles are one of the largest wastes generated by construction activities with an estimated 11 million tons of waste shingles each year (Grodinsky et al. 2002). Of these 11 million tons, one million tons of pre-consumer wastes are generated as a byproduct from shingle manufacturing plants. This type of RAS is termed Manufactured Shingle Waste, or MSW. The remaining 10 million tons come from post-consumer shingles, or tear-off shingle scrap (TOSS), commonly referred to as “tear-offs” (Marks and Petermeier 1997). The components of shingles are commonly used as ingredients in asphalt mixes. Shingles contain mineral aggregate and binder – which are also components of HMA – and a fibrous mat made of organic felt or fiberglass that can be valuable to some asphalt mixtures (Turley and Krivit 2007). Tear-off shingles are aged and as a result often have a stiffer binder and less mineral aggregate. The tear-off shingles, if manufactured before 1980, have approximately 25 percent granular material and 75 percent binder material. The shingle binder material consists of 70 percent asphalt and 30 percent limestone filler. The resulting liquid asphalt binder is approximately 52.5 percent of the total product (Brock 1987). In 1980, shingles began to be manufactured differently, and no longer contained asbestos. Shingles manufactured after 1980 typically consist of 25 to 35 percent asphalt, 25 percent fiberglass and up to 50 percent granular/filler material (Brock 1987, Newcomb et al. 1993). According to Brock (1987), it was estimated that the amount of liquid asphalt being landfilled is 2,275,000 tons per year with an additional 20,000 tons coming from tabs cut from shingles, and 20,000 tons coming from shingles not meeting quality assurance/quality control (QA/QA) requirements. The results of one study suggested that if a shingle content of five percent were used in all asphalt mixtures, at least 600,000 tons of shingles could be used annually (Hanson et al. 1997). This large amount of waste clearly shows the impact of shingles on our environment. Landfills are being burdened with shingles that have up to, and in many cases more than, 30 percent asphalt by weight (www.rotochopper.com). This material, if reclaimed, could reduce the cost of pavement materials by three to five dollars per ton (Krivit 2010). Conservatively reclaiming 5 percent shingle material can produce savings of more than one dollar per ton (Hanson 1997). From these statistics, the benefits of recycling waste shingles into asphalt pavements are certainly worth further investigation.
Several methods exist for preparing discarded shingles for use in asphalt pavements. Various types of crushers, rotary shredders, and hammer mills are used to process the shingles. Most commonly, a hammer mill is used to shred the shingles to a maximum particle size of ½ inch (or smaller), and a water spray is used to prevent excessive heat generation and particle agglomeration. The resulting shingle product is then fed into the HMA mix in a manner similar to that of an aggregate or Reclaimed Asphalt Pavement (RAP) source. In general, shingle scrap can be processed to a maximum size of approximately ½” after a single grind, though double-grinding is often used to provide a more consistent product such that the vast majority of the material will pass a 4.75mm (#4) sieve.
One issue that can present a challenge when using RAS in HMA is the presence of deleterious material. Grodinsky et al. (2002) conducted several case-studies with tear-offs, and provided information pertaining to the problems that shingles can inflict. Grodinsky concluded that the main problem with using RAS is contamination from construction debris such as wood, metal flashing, cans, paper, nails,
TRC 1101 – Final Report
3
agglomeration, and the possibility of asbestos. Thus, quality testing is recommended for all shingle sources that are intended to be used in asphalt mixes. During the early trials of RAS mixes, many expressed a concern regarding the potential for roofing nails to cause flat tires. However, this has not been reported to be a problem, as strong magnets are capable of removing this type of waste during the processing of RAS.
Effects of Asphalt Binder In the Superpave mix design system, asphalt binder grade is chosen based on climatic conditions of the proposed project location. That information, along with anticipated traffic loads, is used to determine the applicable binder performance grade (PG). The PG grade essentially identifies the range of pavement temperatures at which a particular binder is expected to provide adequate performance. The quality and quantity of binder used in a mix critically affects its performance. Higher binder contents and ‘softer’ binders contribute to mixture rutting susceptibility, while lower binder contents and ‘harder’ or oxidized binders will create a more brittle pavement, exacerbating the potential for cracking. Because binder characteristics are so important, shingle binders must be thoroughly characterized. Shingle binders are harder than typical PG-Graded binders used in HMA mixes. One shingle binder source from a manufacturer in Illinois graded out as PG 112+2 (C&D World 2012). This is significantly higher than the standard binder grades used in the U.S., and does not account for the aging of the binder that would be expected of tear-off shingles. Older tear-off shingles are typically highly oxidized, especially in warm climates, and may demonstrate excessive stiffness. This stiffness can lead to premature pavement cracking, but can also increase a pavement’s resistance to rutting. Therefore, RAS content in an asphalt mix is an important consideration and should be limited to a reasonable proportion.
Incorporating waste shingles into asphalt pavement can also yield positive results on PG graded binders. Along with this, Krivit (2010) shows how the high temperature grade of the virgin asphalt binder is improved by adding shingles to a mixture, but the low temperature grade is reduced. The change of grades found by Krivit can be summed up as added resistance to rutting, but lower resistance to low temperature cracking. This change in material properties would be valuable where the low temperature grade is conservative and the high temperature grade is not.
AASHTO Recommendations Due to the increased interest in the use of RAS, AASHTO has adopted provisional specifications for the requirements of using RAS. These procedures include:
• AASHTO MP15: “Use of Reclaimed Asphalt Shingles as an Additive in Hot Mix Asphalt (HMA)” • AASHTO PP53: “Design Considerations When Using Reclaimed Asphalt Shingles (RAS) in New Hot
Mix Asphalt (HMA)”
These documents address procedures for establishing RAS terminology, designing RAS mixes, gradation requirements, RAS characterization, blending and the calculation of associated parameters.
TRC 1101 – Final Report
4
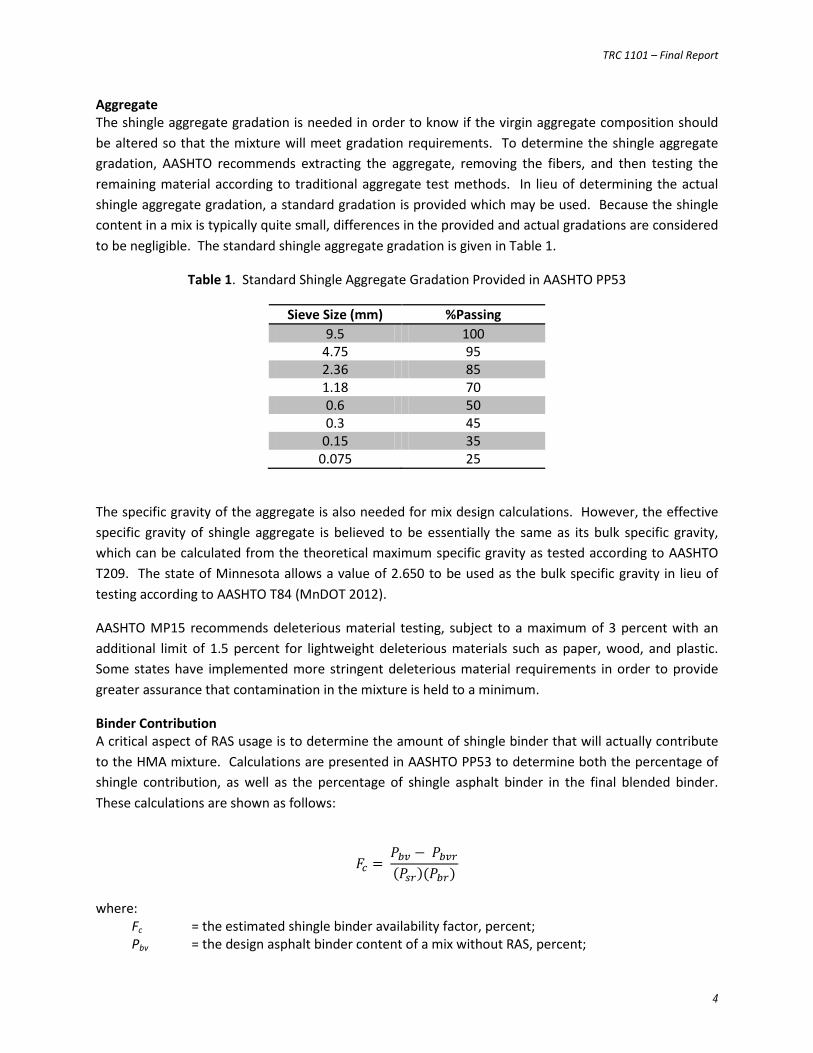
Aggregate The shingle aggregate gradation is needed in order to know if the virgin aggregate composition should be altered so that the mixture will meet gradation requirements. To determine the shingle aggregate gradation, AASHTO recommends extracting the aggregate, removing the fibers, and then testing the remaining material according to traditional aggregate test methods. In lieu of determining the actual shingle aggregate gradation, a standard gradation is provided which may be used. Because the shingle content in a mix is typically quite small, differences in the provided and actual gradations are considered to be negligible. The standard shingle aggregate gradation is given in Table 1.
Table 1. Standard Shingle Aggregate Gradation Provided in AASHTO PP53
Sieve Size (mm) %Passing 9.5 100
4.75 95 2.36 85 1.18 70 0.6 50 0.3 45
0.15 35 0.075 25
The specific gravity of the aggregate is also needed for mix design calculations. However, the effective specific gravity of shingle aggregate is believed to be essentially the same as its bulk specific gravity, which can be calculated from the theoretical maximum specific gravity as tested according to AASHTO T209. The state of Minnesota allows a value of 2.650 to be used as the bulk specific gravity in lieu of testing according to AASHTO T84 (MnDOT 2012).
AASHTO MP15 recommends deleterious material testing, subject to a maximum of 3 percent with an additional limit of 1.5 percent for lightweight deleterious materials such as paper, wood, and plastic. Some states have implemented more stringent deleterious material requirements in order to provide greater assurance that contamination in the mixture is held to a minimum.
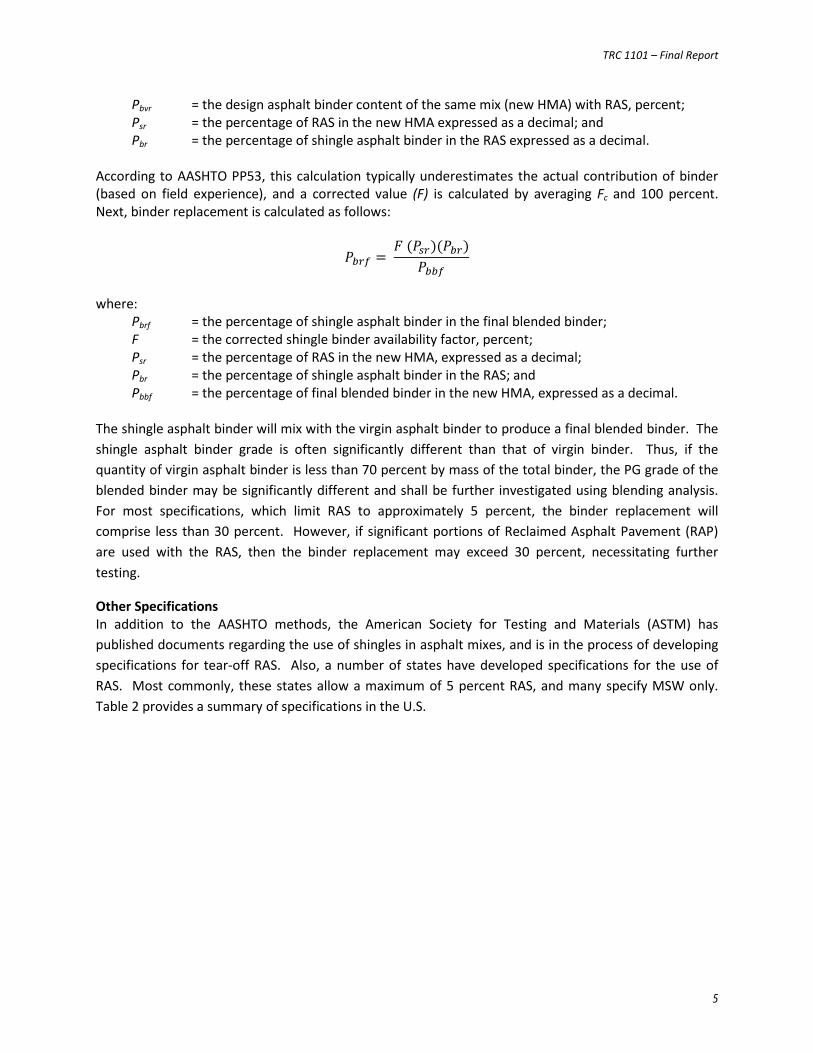
Binder Contribution A critical aspect of RAS usage is to determine the amount of shingle binder that will actually contribute to the HMA mixture. Calculations are presented in AASHTO PP53 to determine both the percentage of shingle contribution, as well as the percentage of shingle asphalt binder in the final blended binder. These calculations are shown as follows:
𝐹𝑐 = 𝑃𝑏𝑣 − 𝑃𝑏𝑣𝑟(𝑃𝑠𝑟)(𝑃𝑏𝑟)
where:
Fc = the estimated shingle binder availability factor, percent; Pbv = the design asphalt binder content of a mix without RAS, percent;
TRC 1101 – Final Report
5
Pbvr = the design asphalt binder content of the same mix (new HMA) with RAS, percent; Psr = the percentage of RAS in the new HMA expressed as a decimal; and Pbr = the percentage of shingle asphalt binder in the RAS expressed as a decimal.
According to AASHTO PP53, this calculation typically underestimates the actual contribution of binder (based on field experience), and a corrected value (F) is calculated by averaging Fc and 100 percent. Next, binder replacement is calculated as follows:
𝑃𝑏𝑟𝑓 = 𝐹 (𝑃𝑠𝑟)(𝑃𝑏𝑟)
𝑃𝑏𝑏𝑓
where:
Pbrf = the percentage of shingle asphalt binder in the final blended binder; F = the corrected shingle binder availability factor, percent; Psr = the percentage of RAS in the new HMA, expressed as a decimal; Pbr = the percentage of shingle asphalt binder in the RAS; and Pbbf = the percentage of final blended binder in the new HMA, expressed as a decimal.
The shingle asphalt binder will mix with the virgin asphalt binder to produce a final blended binder. The shingle asphalt binder grade is often significantly different than that of virgin binder. Thus, if the quantity of virgin asphalt binder is less than 70 percent by mass of the total binder, the PG grade of the blended binder may be significantly different and shall be further investigated using blending analysis. For most specifications, which limit RAS to approximately 5 percent, the binder replacement will comprise less than 30 percent. However, if significant portions of Reclaimed Asphalt Pavement (RAP) are used with the RAS, then the binder replacement may exceed 30 percent, necessitating further testing.
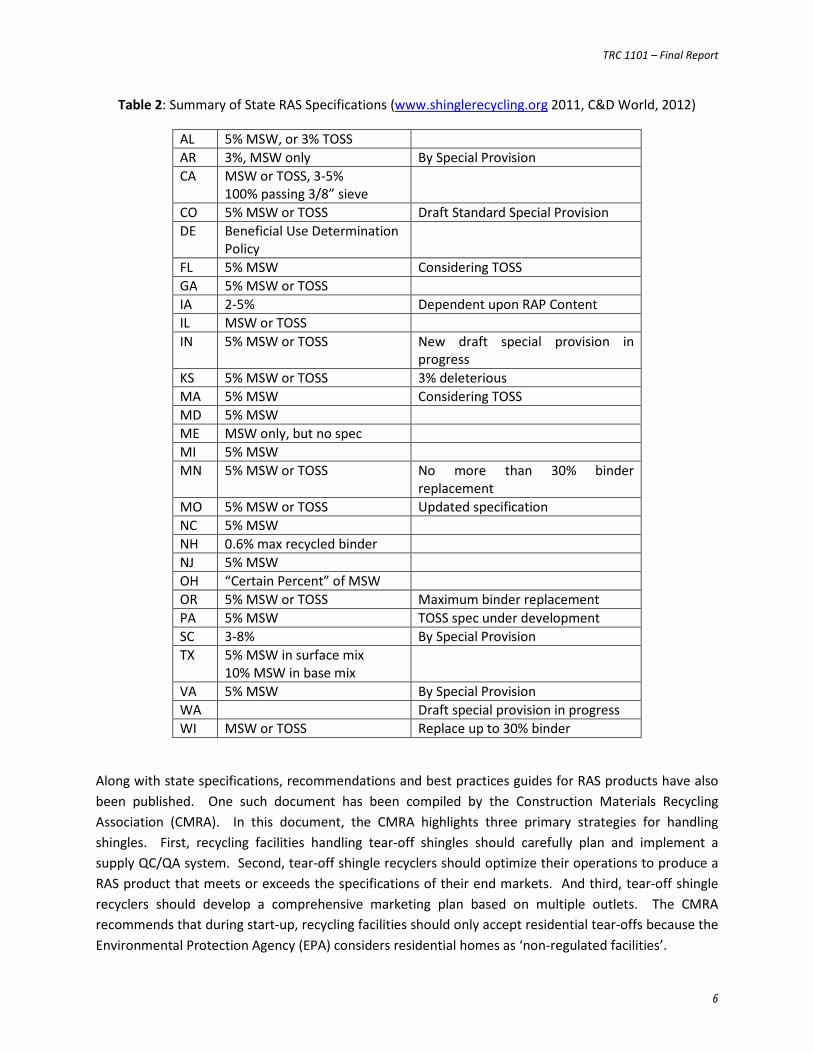
Other Specifications In addition to the AASHTO methods, the American Society for Testing and Materials (ASTM) has published documents regarding the use of shingles in asphalt mixes, and is in the process of developing specifications for tear-off RAS. Also, a number of states have developed specifications for the use of RAS. Most commonly, these states allow a maximum of 5 percent RAS, and many specify MSW only. Table 2 provides a summary of specifications in the U.S.
TRC 1101 – Final Report
6
Table 2: Summary of State RAS Specifications (www.shinglerecycling.org 2011, C&D World, 2012)
AL 5% MSW, or 3% TOSS AR 3%, MSW only By Special Provision CA MSW or TOSS, 3-5%
100% passing 3/8” sieve
CO 5% MSW or TOSS Draft Standard Special Provision DE Beneficial Use Determination
Policy
FL 5% MSW Considering TOSS GA 5% MSW or TOSS IA 2-5% Dependent upon RAP Content IL MSW or TOSS IN 5% MSW or TOSS New draft special provision in
progress KS 5% MSW or TOSS 3% deleterious MA 5% MSW Considering TOSS MD 5% MSW ME MSW only, but no spec MI 5% MSW MN 5% MSW or TOSS No more than 30% binder
replacement MO 5% MSW or TOSS Updated specification NC 5% MSW NH 0.6% max recycled binder NJ 5% MSW OH “Certain Percent” of MSW OR 5% MSW or TOSS Maximum binder replacement PA 5% MSW TOSS spec under development SC 3-8% By Special Provision TX 5% MSW in surface mix
10% MSW in base mix
VA 5% MSW By Special Provision WA Draft special provision in progress WI MSW or TOSS Replace up to 30% binder
Along with state specifications, recommendations and best practices guides for RAS products have also been published. One such document has been compiled by the Construction Materials Recycling Association (CMRA). In this document, the CMRA highlights three primary strategies for handling shingles. First, recycling facilities handling tear-off shingles should carefully plan and implement a supply QC/QA system. Second, tear-off shingle recyclers should optimize their operations to produce a RAS product that meets or exceeds the specifications of their end markets. And third, tear-off shingle recyclers should develop a comprehensive marketing plan based on multiple outlets. The CMRA recommends that during start-up, recycling facilities should only accept residential tear-offs because the Environmental Protection Agency (EPA) considers residential homes as ‘non-regulated facilities’.
TRC 1101 – Final Report
7
Departments of Transportation have been strongly urged by many associations to incorporate RAS into their HMA pavements. As a temporary means to demonstrate the feasibility of use of tear-off RAS into HMA, a number of state and local agencies have participated in demonstration projects specifying the use of RAS, and a great deal of emphasis has been placed on the use of tear-offs. This is because tear-off shingles comprise the large majority of shingle waste, and are locally available to almost every agency. In contrast, MSW materials may only be feasible in locations near a shingle manufacturing facility. Tear-offs have received a great deal of attention from county governments and other local agencies that are responsible both for management of landfills as well as roadway maintenance. These agencies not only have access to the RAS materials, but also possess immediate uses for the shingles. This represents a very sustainable process for the local agencies.
In order to prove the acceptability of using RAS in asphalt mixes, a number of field demonstrations and research projects have been conducted. While the environmental, societal, and economic advantages have been clearly demonstrated, pavement quality must not be sacrificed, and the long-term pavement performance must be proven.
TRC 1101 – Final Report
8
4. Literature Review
Though much of the attention to shingles has occurred during the last few years, research on this topic actually began some time ago. In 1993, the results of a study were reported that involved a comparison of felt-backed and fiberglass shingles added to a dense-graded HMA mix at 2.5, 5.0 and 7.5 percent rates (Newcomb et al. 1993). The mixtures were verified by the Marshall method using penetration grade binders of 85/100 and 120/150. RAS was added at ambient temperatures as currently recommended by AASHTO. It was concluded that the volumetric properties of the mixture containing 2.5 percent shingles were not significantly different than the control mixtures, so further testing on mixtures containing 2.5 percent RAS was not pursued. There was generally no reduction in required asphalt binder when any level of felt-backed shingles was incorporated. The fiberglass shingles, however, reduced the need for virgin binder by 12 percent (for 5 percent RAS) and 25 percent (for 7.5 percent RAS). Air void differences were also considered and indicated that fiberglass shingles tended to compact more easily than the felt-backed shingles.
These results were similar to another study reported in 1995 (Button et al. 1995) in which it was determined that the shingle aggregate gradation should replace the finest graded material in the mixture. At RAS additions of 5 percent MSW, optimum binder contents could be reduced by 0.5 percent for the dense-graded mixture, and 0.2 percent for a coarse matrix high binder (CMHB) mix. At 10 percent MSW, an additional reduction of 0.7 percent binder was achieved for the dense-graded mix. Tear-off shingles also reduced virgin binder requirements, but only by 0.2 and 0.4 percent for 5 and 10 percent tear-off RAS additions, respectively. For the CMHB mix, no binder reduction was achieved with 5 percent tear-offs, and only a 0.1 percent reduction was achieved for the mix containing 10 percent tear-offs.
The volumetric properties change with the incorporation of waste shingles due to the additional binder, fines, and backing. In 2000, Mallick et al. provided the Massachusetts Department of Transportation (MassDOT) with an evaluation of RAS with respect to volumetric properties. A control mixture was established containing no recycled material, and then MSW was added 3, 5, and 7 percent levels. The test results indicated that the effects of RAS on volumetric properties were not significant, but virgin binder contents were successfully reduced. Virgin binder contents were 5.2, 4.6, 4.2, and 3.8 percent for mixtures containing 0, 3, 5, and 7 percent shingles, respectively. Despite positive research results, MassDOT did not allow RAS in HMA mixes due to concerns about the consistency of the binder in waste shingles. More recently, however, MassDOT has incorporated RAS into its specifications, allowing up to 5 percent MSW.
Binder Effects Because the asphalt binder in shingles is stiffer than virgin asphalt binders used in HMA, the asphalt binder grade of the blended binder is expected to change with the incorporation of shingles. If the change is significant, additional design verification may need to be conducted on mixtures. In 2007, a joint study was conducted for Minnesota and Missouri regarding the use of tear-offs (McGraw et al. 2007). In Minnesota, a single binder grade (PG 58-28) was used for different percentages of RAS and reclaimed asphalt pavements (RAP) in the asphalt mix. First, a control mixture containing 20 percent
TRC 1101 – Final Report
9
RAP and 0 percent RAS was established. Next, mixes were produced in which 5 percent of the RAP was replaced with MSW, and with TOSS. The grade of the control mix averaged high and low temperatures of 64.2 and -29.2 degrees C, while that of the MSW mix yielded 70.9 and -26.2 degrees C, and that of the TOSS mix yielded 73.2 and -28.8 degrees C. Overall, the high temperature PG grades tended to increase, while the low temperature PG grade changes were less significant. The standard deviations for the tear-off shingles were greater, indicating greater variability for this type of shingles.
In Missouri, two different binder grades (PG 58-28 and PG 64-22) were used with a single source of RAP, a single source of tear-off shingles, and 0.25 percent antistrip additive (Pave Bond Lite). First, a mixture was verified containing 20 percent RAP using each binder type. Next, for each mix, 5 percent RAP was replaced with TOSS. Up to 3 percent deleterious material was accepted, but limited to 1.5 percent for wood. Mixture stiffness was measured, and the results of this testing revealed that the addition of shingle increased the stiffness of the mixture significantly at the two lowest test temperatures. Tensile strength was also measured for these mixtures by the direct tension tests and showed a slight increase in tensile strength. These results indicated that for a mixture containing PG 64-22 binder, the additional of shingles would results in the development of thermal stresses within the pavement. While these results differed from those found in Minnesota, it was also determined that the asphalt binder stiffness (RAP+RAS) was greater in the Missouri RAS source, again highlighting the inconsistencies present in TOSS shingle sources (McGraw et al. 2007).
In 2010, it was found that a linear trend existed between critical temperatures and the amounts of RAP/RAS used (Scholtz 2010). RAP percentages of up to 50 percent were used in the study, and higher RAP contents were mixed with PG 70-28 binder. The critical temperature increased for both high and low temperatures, with the maximum increase in high critical temperature of 18.5 degrees occurring for the 5 percent RAS/30 percent RAP mix containing PG 64-22 binder. Increases were also seen in the critical low temperature, though these increases were less significant. Overall, it was concluded that the addition of RAS with no RAP had a significant effect on the high temperature grade, and a moderate effect on the low temperature grade. These conclusions were consistent with those of another study in which high temperature grades were significantly increased by the addition of RAS, and low temperature grades deteriorated only slightly (Maupin, 2010).
Measurements of binder content are also important for RAS sources. More recently, a Virginia study used RAS to explore the binder content of RAS using the solvent extraction and ignition methods (Maupin, 2010). The samples tested by solvent yielded an average of 24.3 percent binder, while those tested by ignition yielded an average of 29.2 percent. A similar study in South Carolina determined that the difference in ignition and extraction values of shingle binder content was approximately 2 percent, and a correction factor (CF) was proposed as shown in the following equation (Maupin, 2010).
𝐶𝐹 = (% 𝑠ℎ𝑖𝑛𝑔𝑙𝑒𝑠) ∗ (% 𝑑𝑖𝑓𝑓𝑒𝑟𝑒𝑛𝑐𝑒 𝑏𝑒𝑡𝑤𝑒𝑒𝑛 𝑏𝑖𝑛𝑑𝑒𝑟 𝑑𝑒𝑡𝑒𝑟𝑚𝑖𝑛𝑒𝑑 𝑏𝑦 𝑒𝑥𝑡𝑟𝑎𝑐𝑡𝑖𝑜𝑛 𝑎𝑛𝑑 𝑖𝑔𝑛𝑖𝑡𝑖𝑜𝑛)
100
TRC 1101 – Final Report
10
Rutting Performance Because the asphalt binder in shingles is stiffer than virgin asphalt binder, the asphalt mixture stiffness is expected to change with the incorporation of shingles. In general, it is expected that the harder binder in the RAS will increase the stiffness of a mixture, leading to increased rutting resistance. However, the fine aggregate composition of the RAS could also have an effect on rutting performance. The French wheel rutting test has been used to determine the rutting susceptibility of RAS mixtures (Tighe et al. 2008). It was concluded that small amounts of shingles improved rutting performance, but larger RAS contents did not. It was suggested that the shingles were promoting stripping of the binder from the aggregates.
The Georgia Loaded Wheel Tester was used to evaluate the rutting susceptibility of a control mix and a RAS mix with 10 percent RAS (Grzybowski 1993). The RAS significantly improved performance throughout the duration of the test. This device was the pre-cursor to the APA, which was used to test control and RAS mixes (Mallick 2000). These results also demonstrated an improvement in rutting performance with the addition of RAS. Further testing in the APA showed improved performance for mixes containing RAS when tested for fatigue (Maupin 2010).
Resilient Modulus The resilient modulus is a measure of the stiffness of an asphalt mixture, and provides an indication of the fatigue and thermal cracking susceptibility of a pavement. Resilient modulus testing has been included in previous RAS research projects, and results have varied. In an early study, it was shown that the resilient modulus decreased as MSW rates increased, but increased with the incorporation of TOSS (Newcomb et al. 1993). Another study provided very different conclusions, however (Button et al. 1995). Based on comparisons of RAS mixes with control mixes, the addition of RAS did not have a significant effect on the resilient modulus of dense-graded mixtures, though results were mixed and did not always follow logical trends with respect to temperature. The dispersion of fibrous materials from the backing of the shingles was cited as being responsible for the increase in stiffness at high temperature and the decrease in stiffness at low temperatures. Differences in the results of the two studies were attributed to the differences in the shingle sources. In 2008, a Canadian study determined that the resilient modulus of HMA mixes decreased significantly when recycled material was added (Tighe et al. 2008). Again, this conclusion does not coincide with the other studies, but differences in the shingle products were cited for the differences.
Dynamic Modulus The dynamic modulus is a representation of the elastic properties of a material. This characteristic is quantified by subjecting an asphalt sample to a sinusoidal loading while varying the test temperature and loading frequency. A high dynamic modulus indicates an overall “good” mixture. At high temperatures, a high dynamic modulus indicates a rutting resistant mix; at low temperatures, a high dynamic modulus indicates a cracking resistant mix. In addition to resilient modulus, the Canadian study also investigated dynamic modulus (Tighe et al. 2008). At low temperatures, the mixtures containing shingles had lower dynamic modulus values, and at high temperatures, the results were very similar.
TRC 1101 – Final Report
11
Tensile Strength Tensile strength has also been investigated for mixtures containing RAS. In one study, the addition of shingles decreased the tensile strength of the mixes, though it was not clear whether the decrease was caused by the addition of shingles, reduction of virgin binder, or a combination of the two (Newcomb et al. 1993). In any case, the change in tensile strength performance could be attributed to the change in the mix design as a result of RAS incorporation. In the 1996 study, Button measured tensile strengths of both MSW and TOSS. Overall, the tear-offs exhibited higher strengths than the MSW, but neither displayed as much tensile strength as the control mixture.
The indirect tensile strength is used as a primary measure in moisture susceptibility determinations. Button’s study also investigated tensile strength ratio (TSR) according to Tex-531-C (which is very similar to AASTHO T283). The TSR of the control mixture was poor (0.58), and the addition of MSW did not significantly improve performance (0.56 and 0.72 at 5 and 10 percent MSW, respectively). TSR values were 0.71 and 0.72 when 5 and 10 percent TOSS was added, respectively.
In Maupin’s 2010 study, indirect tension tests indicated higher strengths as shingle content increased. Strengths were higher when the mixing temperature was increased, indicating a more thorough blending of the virgin and shingle binders at higher temperatures (Maupin, 2010). In the Canadian study, however, tensile strengths were lowest for the mixtures containing the greatest percentage of RAS (Tighe et al. 2008).
Field Performance Field trials including RAS mixes have been documented in a number of states, dating back to the 1990s (www.ShingleRecycling.org 2009). In 1994 and 1995, two field test sections were constructed in Georgia using 5 percent MSW from a shingle manufacturing facility in Maryland. The shingles were shredded to achieve a maximum particle size of 0.5 inches, and then shipped to Georgia. Laboratory mix design testing revealed that the modified mixtures possessed slightly improved material properties. The test sections were constructed and it was determined that existing HMA design and QC/QA procedures were also satisfactory for RAS mixes. These test sections were visually inspected in 1998 and were said to have little distress, and were very comparable to the control sections (Watson et al. 1998).
The Minnesota Department of Transportation (MnDOT) allows up to 5 percent RAS in HMA mixes, and has placed a number of pavements containing RAS materials. A test strip was placed in conjunction with a control strip on a part of Munger Trail in 1990. The RAS section contained 9 percent shingles, and performed as well as the control strip after 12 years of service (O’Gara 2002). In Scott County, a similar field section was placed, including both RAS and control sections. After 11 years in service, cores were taken to evaluate the performance of each section. Results showed that there was no discernible difference between the RAS section and control section. (O’Gara 2002).
More recent field studies have included not only RAS mixes, but have focused more heavily on combinations of RAS with other recycled materials, such as RAP or Ground Tire Rubber (GTR). In 2009, a Pooled Fund Study [TPF-5(213)] began in an effort to better understand the performance of RAS mixtures and to answer questions regarding their economic value. Participating states included Missouri, Iowa, Colorado, Minnesota, Wisconsin, and Indiana. In 2010, California and Illinois joined the

TRC 1101 – Final Report
12
study, and the project was extended by one year. This study is nearing completion, and interim results indicate mixed performance. In some cases, the addition of RAS has increased cracking potential, and in other cases cracking has been similar to or less severe than that of the control mixes.
TRC 1101 – Final Report
13
5. Research Objectives The primary objective of this research was to assess the use of RAS for asphalt pavements in Arkansas. Specific goals were to:
• Validate existing mixture design procedures associated with RAS. The asphalt binder contribution was a primary concern in this objective. Different mixtures containing RAS contents of 0 to 10 percent were designed according to applicable AASHTO and AHTD specifications, and the effects of aggregate type, aggregate size, binder grade, and shingle content were investigated.
• Evaluate the performance of mixtures containing RAS. Because the binder in recycled shingle sources is stiffer than most virgin binders, the effects of shingle binder on rutting and cracking performance of RAS mixes was considered. Moisture damage was also included in the performance evaluation.
• Determine the maximum percentage of RAS that should be used in HMA mixes. Based on mix design information and performance data, the effects of shingle content were assessed and used to make a determination of a maximum allowable percentage. MSW and TOSS types were considered.
• Identify the appropriate grind size for shingles that should be used in HMA mixes. As the gradation of the shingle source becomes finer, a greater surface area is exposed, increasing the ability of the shingles to release valuable binder to the asphalt mixture. However, additional grinding increases the cost of the shingle product. Varying gradations were used to determine the optimum level of grinding to provide a quality RAS mixture.
• Develop specific recommendations regarding the inclusion of RAS in the AHTD Standard Specification. The most important objective of this study was to develop appropriate recommendations for RAS specifications. Associated issues included design, acceptance, and construction of RAS, including QC/QA procedures.
• Consider the potential for using RAS in combination with other products, such as Warm Mix Asphalt. Because the reduced temperatures used in Warm Mix Asphalt (WMA) technology are believed to assist in retaining the more flexible properties of the asphalt binder (i.e., making it appear ‘softer’), and RAS contains oxidized, or ‘harder’ binder, combinations of these products were evaluated to determine whether a beneficial balance existed.
TRC 1101 – Final Report
14
6. Research Approach and Analysis In this project, two aggregate sources were used to develop mix designs containing RAS. The majority of the laboratory investigation involved the use of MSW, but TOSS was also considered. Two binder grades were included in the study, as well as two nominal maximum aggregate sizes (NMAS). Mixes of varying RAS contents were designed and tested for laboratory performance according to the testing matrix shown in Table 3. All combinations of parameters were investigated, resulting in a total of eight (8) control mixes. Each mixture was then adjusted to incorporate the desired percentage of RAS according to the guidelines presented in AASHTO MP15 and AASHTO PP53.
Table 3. Summary of Mixture Design Parameters
Parameter Value NMAS (2) 12.5mm, 25.0mm Binder Grade (2) PG 64-22, PG 70-22 Aggregate Source (2) Limestone, River Gravel Shingle Content (4) 0%, 2.5%, 5%, and 10%
Material Sources The aggregate sources chosen for the project were selected to particularly represent the most likely aggregate types that would use MSW for RAS mixtures. Since there are no shingle manufacturing facilities in the state of Arkansas, access to MSW shingles is limited and most likely to be made available to HMA producers near the perimeter of the state, having the closest proximity to shingle manufacturers and minimizing the shipping expense for RAS. Upon further investigation, the following shingle manufacturing facilities were identified, which have the greatest likelihood of being used in Arkansas. These facilities are provided in Table 4.
Table 4. Summary of Roofing Shingle Manufacturing Facilities with Reasonable Proximity to Arkansas
Manufacturer Plant Location
Atlas Roofing Corporation Ardmore, OK Meridian, MS Daingerfield, TX
CertainTeed Corporation Shreveport, LA Ennis, TX
GAF Ennis, TX Dallas, TX
IKO Industries LTD – MW/MB, LLC Clarksville, TN
Owens Corning Roofing and Asphalt, LLC Memphis, TN Irving, TX Jacksonville, TX
Tamko Building Products, Inc. Joplin, MO Dallas, TX
TRC 1101 – Final Report
15
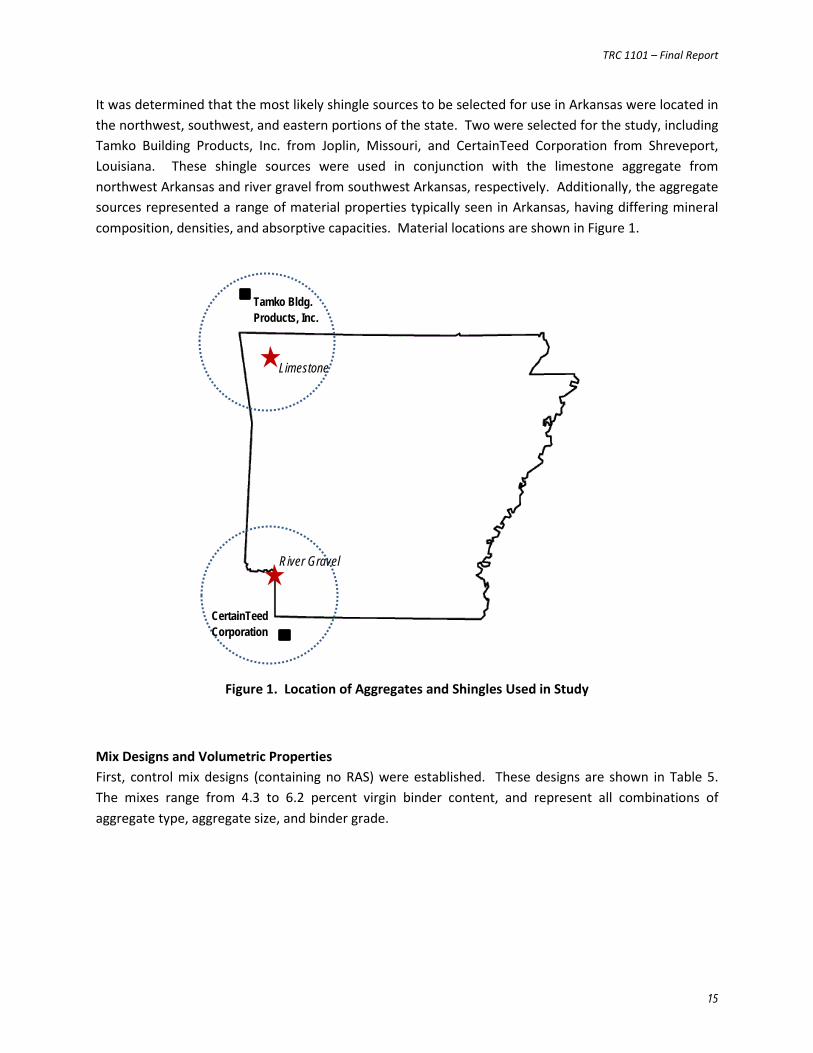
It was determined that the most likely shingle sources to be selected for use in Arkansas were located in the northwest, southwest, and eastern portions of the state. Two were selected for the study, including Tamko Building Products, Inc. from Joplin, Missouri, and CertainTeed Corporation from Shreveport, Louisiana. These shingle sources were used in conjunction with the limestone aggregate from northwest Arkansas and river gravel from southwest Arkansas, respectively. Additionally, the aggregate sources represented a range of material properties typically seen in Arkansas, having differing mineral composition, densities, and absorptive capacities. Material locations are shown in Figure 1.
Figure 1. Location of Aggregates and Shingles Used in Study
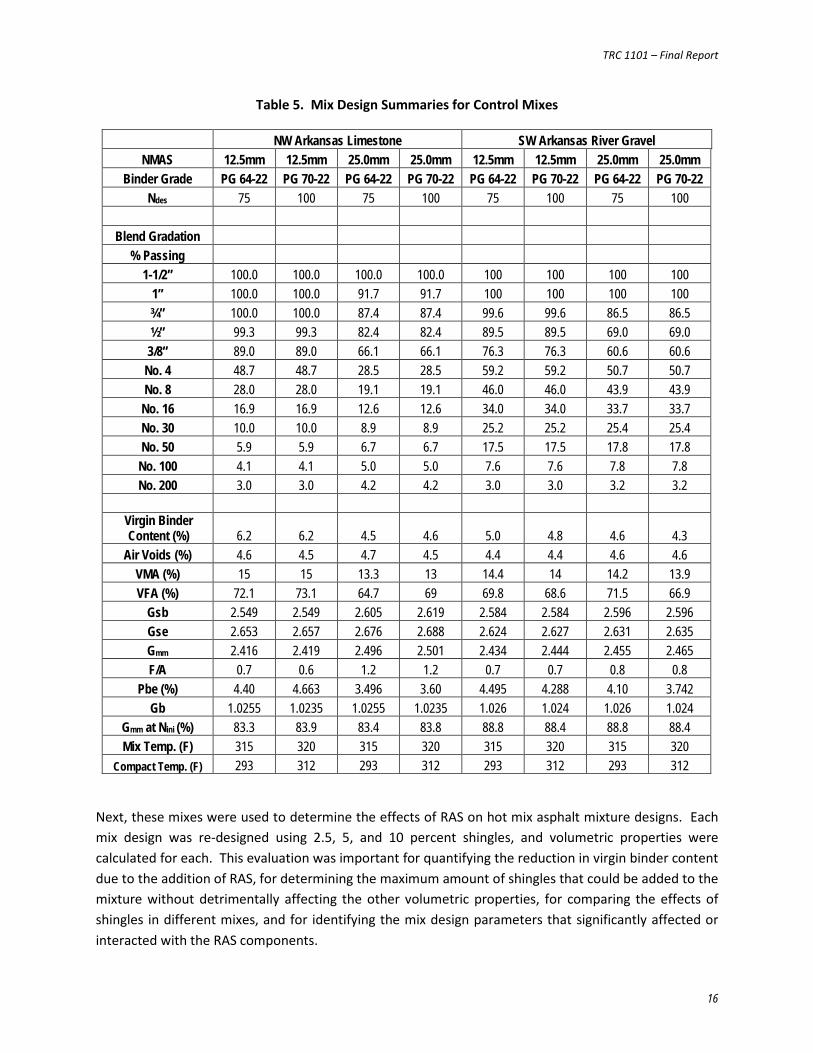
Mix Designs and Volumetric Properties First, control mix designs (containing no RAS) were established. These designs are shown in Table 5. The mixes range from 4.3 to 6.2 percent virgin binder content, and represent all combinations of aggregate type, aggregate size, and binder grade.
Limestone
River Gravel
Tamko Bldg. Products, Inc.
CertainTeed Corporation
TRC 1101 – Final Report
16
Table 5. Mix Design Summaries for Control Mixes
NW Arkansas Limestone SW Arkansas River Gravel NMAS 12.5mm 12.5mm 25.0mm 25.0mm 12.5mm 12.5mm 25.0mm 25.0mm
Binder Grade PG 64-22 PG 70-22 PG 64-22 PG 70-22 PG 64-22 PG 70-22 PG 64-22 PG 70-22 Ndes 75 100 75 100 75 100 75 100
Blend Gradation
% Passing 1-1/2” 100.0 100.0 100.0 100.0 100 100 100 100
1” 100.0 100.0 91.7 91.7 100 100 100 100 ¾” 100.0 100.0 87.4 87.4 99.6 99.6 86.5 86.5 ½” 99.3 99.3 82.4 82.4 89.5 89.5 69.0 69.0
3/8” 89.0 89.0 66.1 66.1 76.3 76.3 60.6 60.6 No. 4 48.7 48.7 28.5 28.5 59.2 59.2 50.7 50.7 No. 8 28.0 28.0 19.1 19.1 46.0 46.0 43.9 43.9
No. 16 16.9 16.9 12.6 12.6 34.0 34.0 33.7 33.7 No. 30 10.0 10.0 8.9 8.9 25.2 25.2 25.4 25.4 No. 50 5.9 5.9 6.7 6.7 17.5 17.5 17.8 17.8
No. 100 4.1 4.1 5.0 5.0 7.6 7.6 7.8 7.8 No. 200 3.0 3.0 4.2 4.2 3.0 3.0 3.2 3.2
Virgin Binder Content (%) 6.2 6.2 4.5 4.6 5.0 4.8 4.6 4.3
Air Voids (%) 4.6 4.5 4.7 4.5 4.4 4.4 4.6 4.6 VMA (%) 15 15 13.3 13 14.4 14 14.2 13.9 VFA (%) 72.1 73.1 64.7 69 69.8 68.6 71.5 66.9
Gsb 2.549 2.549 2.605 2.619 2.584 2.584 2.596 2.596 Gse 2.653 2.657 2.676 2.688 2.624 2.627 2.631 2.635 Gmm 2.416 2.419 2.496 2.501 2.434 2.444 2.455 2.465 F/A 0.7 0.6 1.2 1.2 0.7 0.7 0.8 0.8
Pbe (%) 4.40 4.663 3.496 3.60 4.495 4.288 4.10 3.742 Gb 1.0255 1.0235 1.0255 1.0235 1.026 1.024 1.026 1.024
Gmm at Nini (%) 83.3 83.9 83.4 83.8 88.8 88.4 88.8 88.4 Mix Temp. (F) 315 320 315 320 315 320 315 320
Compact Temp. (F) 293 312 293 312 293 312 293 312
Next, these mixes were used to determine the effects of RAS on hot mix asphalt mixture designs. Each mix design was re-designed using 2.5, 5, and 10 percent shingles, and volumetric properties were calculated for each. This evaluation was important for quantifying the reduction in virgin binder content due to the addition of RAS, for determining the maximum amount of shingles that could be added to the mixture without detrimentally affecting the other volumetric properties, for comparing the effects of shingles in different mixes, and for identifying the mix design parameters that significantly affected or interacted with the RAS components.
TRC 1101 – Final Report
17
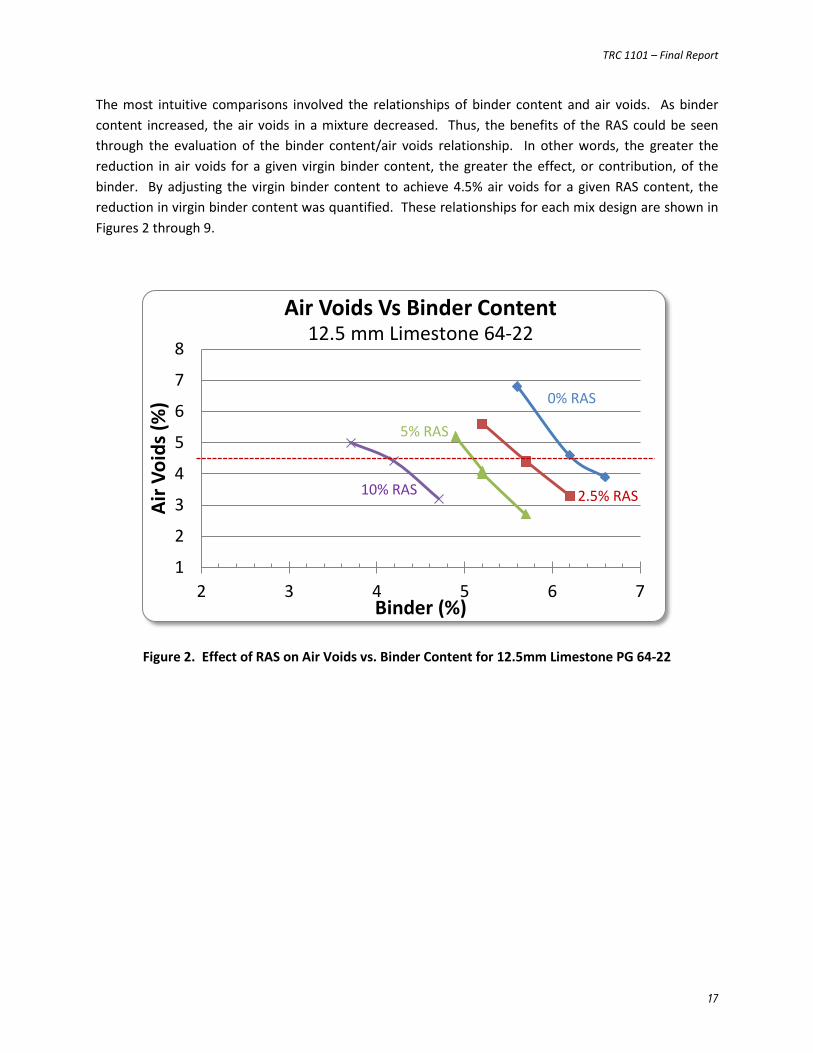
The most intuitive comparisons involved the relationships of binder content and air voids. As binder content increased, the air voids in a mixture decreased. Thus, the benefits of the RAS could be seen through the evaluation of the binder content/air voids relationship. In other words, the greater the reduction in air voids for a given virgin binder content, the greater the effect, or contribution, of the binder. By adjusting the virgin binder content to achieve 4.5% air voids for a given RAS content, the reduction in virgin binder content was quantified. These relationships for each mix design are shown in Figures 2 through 9.
Figure 2. Effect of RAS on Air Voids vs. Binder Content for 12.5mm Limestone PG 64-22
1
2
3
4
5
6
7
8
2 3 4 5 6 7
Air V
oids
(%)
Binder (%)
Air Voids Vs Binder Content 12.5 mm Limestone 64-22
0% RAS
2.5% RAS
5% RAS
10% RAS
TRC 1101 – Final Report
18
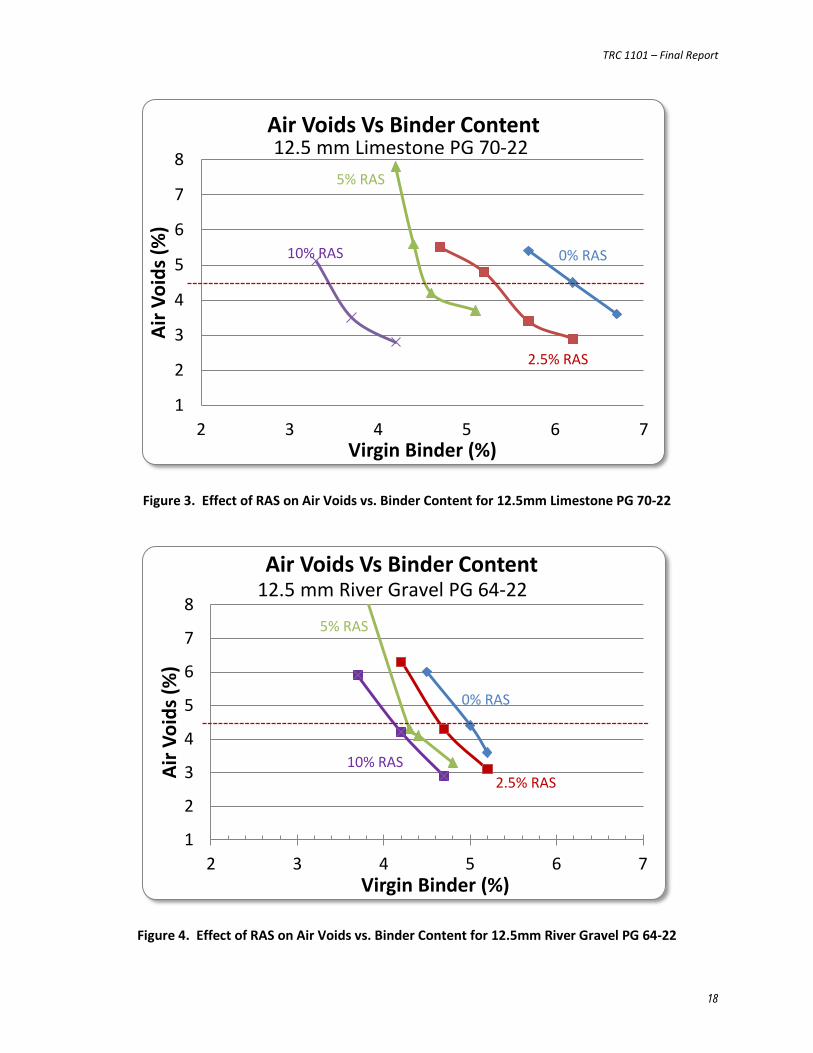
Figure 3. Effect of RAS on Air Voids vs. Binder Content for 12.5mm Limestone PG 70-22
Figure 4. Effect of RAS on Air Voids vs. Binder Content for 12.5mm River Gravel PG 64-22
1
2
3
4
5
6
7
8
2 3 4 5 6 7
Air V
oids
(%)
Virgin Binder (%)
Air Voids Vs Binder Content 12.5 mm Limestone PG 70-22
0% RAS
2.5% RAS
5% RAS
10% RAS
1
2
3
4
5
6
7
8
2 3 4 5 6 7
Air V
oids
(%)
Virgin Binder (%)
Air Voids Vs Binder Content 12.5 mm River Gravel PG 64-22
0% RAS
2.5% RAS
5% RAS
10% RAS
TRC 1101 – Final Report
19
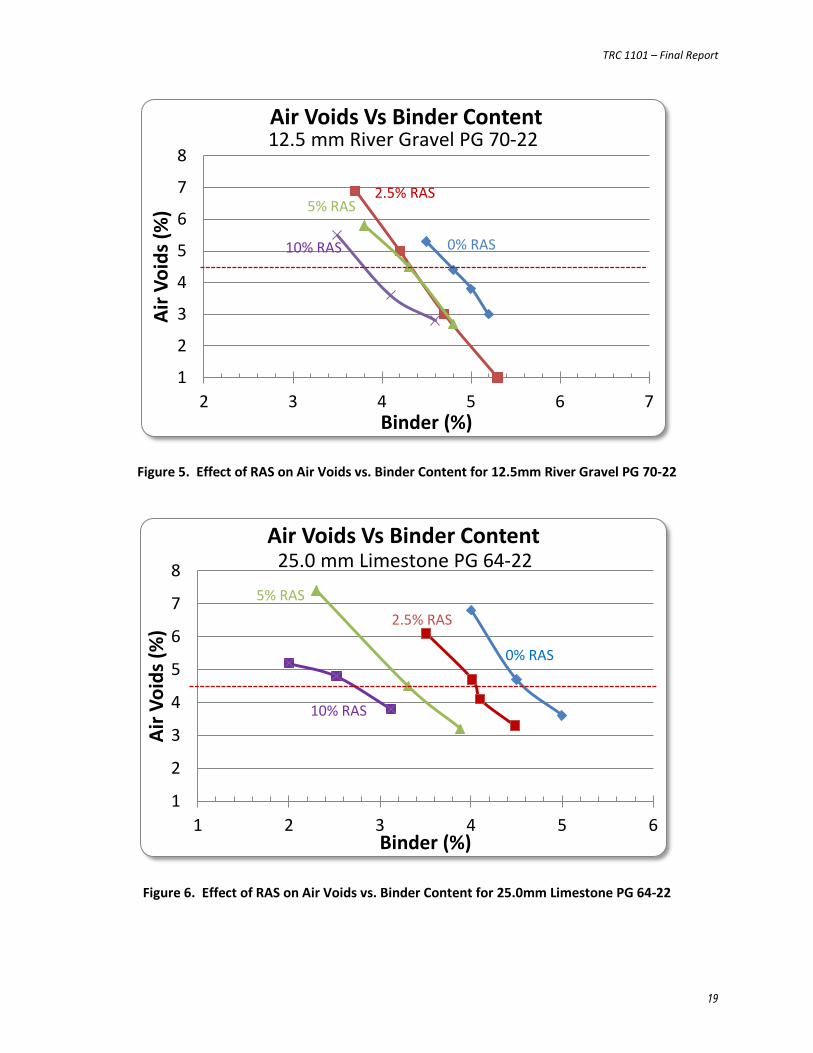
Figure 5. Effect of RAS on Air Voids vs. Binder Content for 12.5mm River Gravel PG 70-22
Figure 6. Effect of RAS on Air Voids vs. Binder Content for 25.0mm Limestone PG 64-22
1
2
3
4
5
6
7
8
2 3 4 5 6 7
Air V
oids
(%)
Binder (%)
Air Voids Vs Binder Content 12.5 mm River Gravel PG 70-22
0% RAS
2.5% RAS 5% RAS
10% RAS
1
2
3
4
5
6
7
8
1 2 3 4 5 6
Air V
oids
(%)
Binder (%)
Air Voids Vs Binder Content 25.0 mm Limestone PG 64-22
0% RAS
2.5% RAS 5% RAS
10% RAS
TRC 1101 – Final Report
20
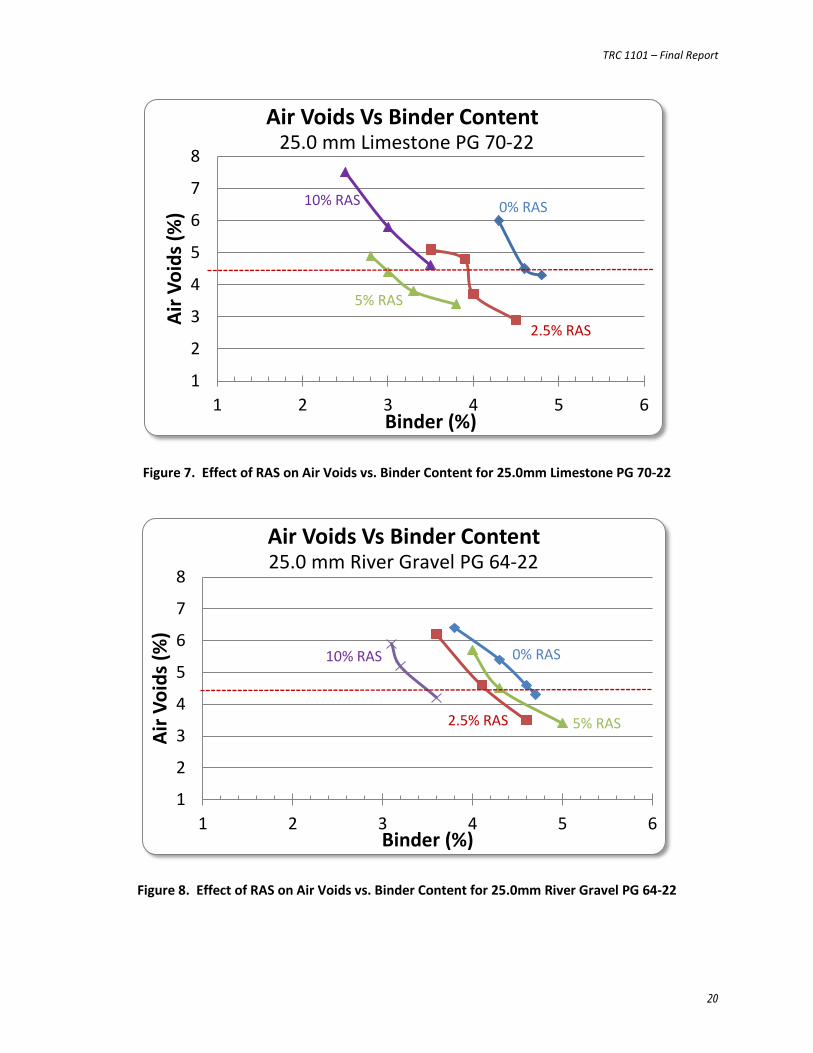
Figure 7. Effect of RAS on Air Voids vs. Binder Content for 25.0mm Limestone PG 70-22
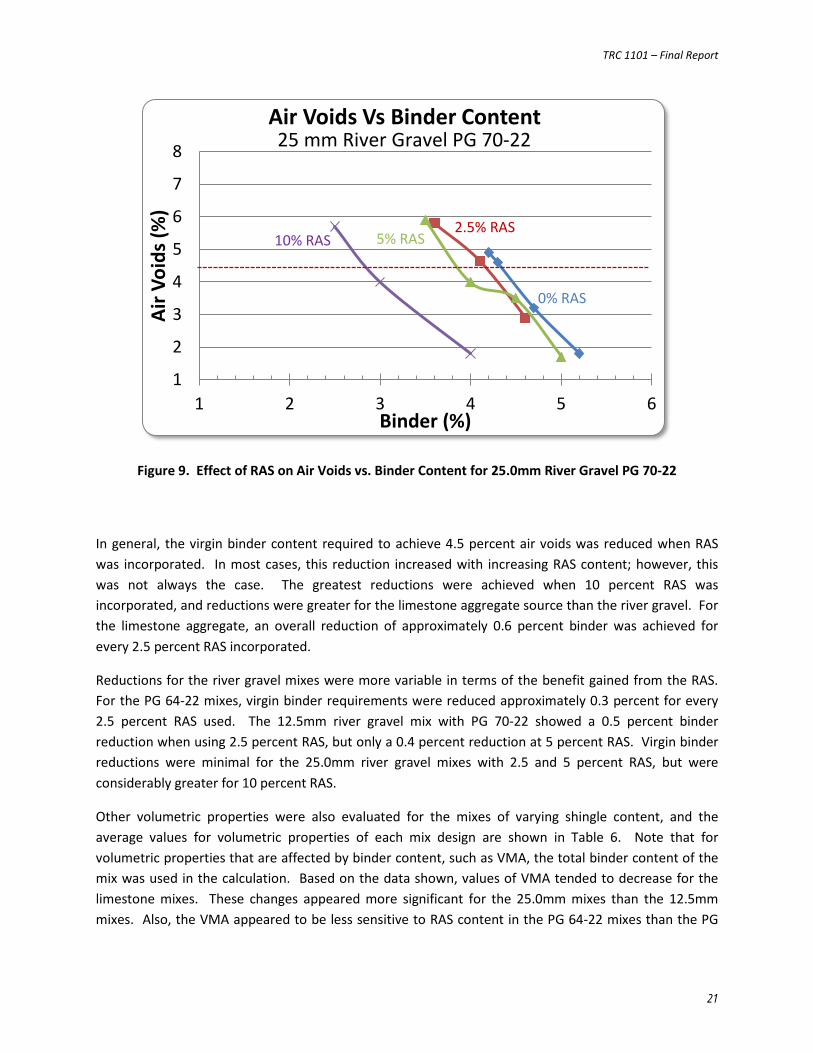
Figure 8. Effect of RAS on Air Voids vs. Binder Content for 25.0mm River Gravel PG 64-22
1
2
3
4
5
6
7
8
1 2 3 4 5 6
Air V
oids
(%)
Binder (%)
Air Voids Vs Binder Content 25.0 mm Limestone PG 70-22
0% RAS
2.5% RAS
5% RAS
10% RAS
1
2
3
4
5
6
7
8
1 2 3 4 5 6
Air V
oids
(%)
Binder (%)
Air Voids Vs Binder Content 25.0 mm River Gravel PG 64-22
0% RAS
2.5% RAS 5% RAS
10% RAS
TRC 1101 – Final Report
21
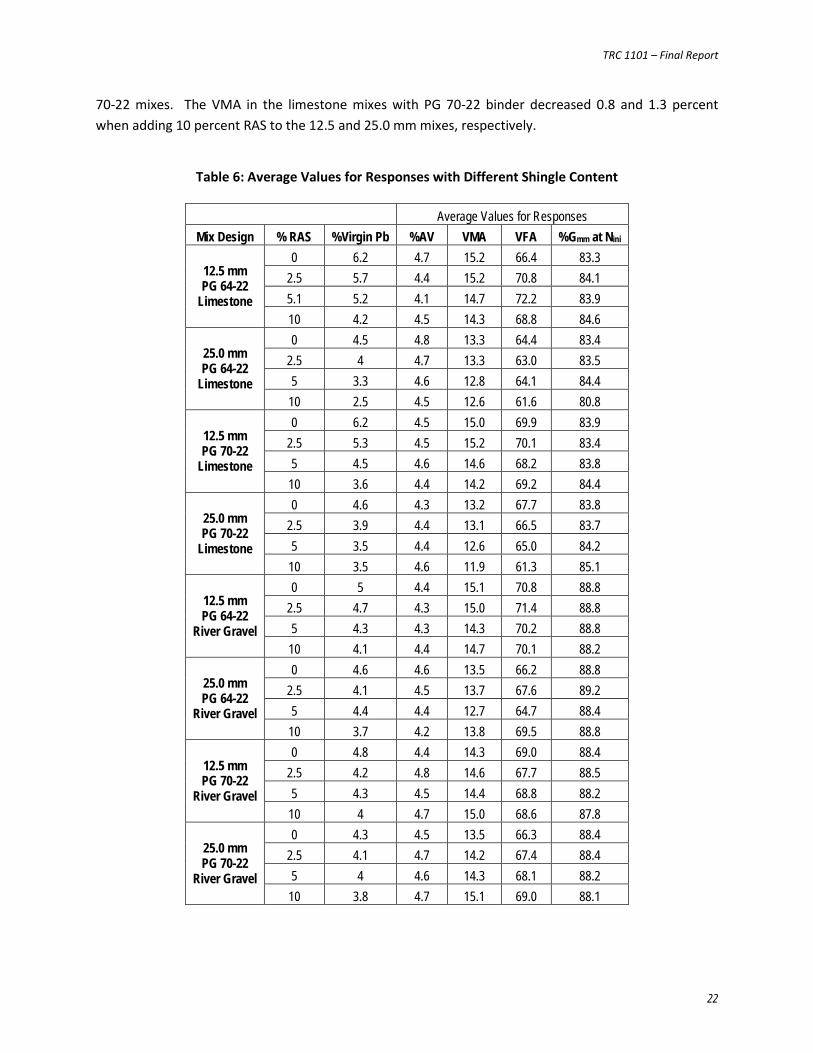
Figure 9. Effect of RAS on Air Voids vs. Binder Content for 25.0mm River Gravel PG 70-22
In general, the virgin binder content required to achieve 4.5 percent air voids was reduced when RAS was incorporated. In most cases, this reduction increased with increasing RAS content; however, this was not always the case. The greatest reductions were achieved when 10 percent RAS was incorporated, and reductions were greater for the limestone aggregate source than the river gravel. For the limestone aggregate, an overall reduction of approximately 0.6 percent binder was achieved for every 2.5 percent RAS incorporated.
Reductions for the river gravel mixes were more variable in terms of the benefit gained from the RAS. For the PG 64-22 mixes, virgin binder requirements were reduced approximately 0.3 percent for every 2.5 percent RAS used. The 12.5mm river gravel mix with PG 70-22 showed a 0.5 percent binder reduction when using 2.5 percent RAS, but only a 0.4 percent reduction at 5 percent RAS. Virgin binder reductions were minimal for the 25.0mm river gravel mixes with 2.5 and 5 percent RAS, but were considerably greater for 10 percent RAS.
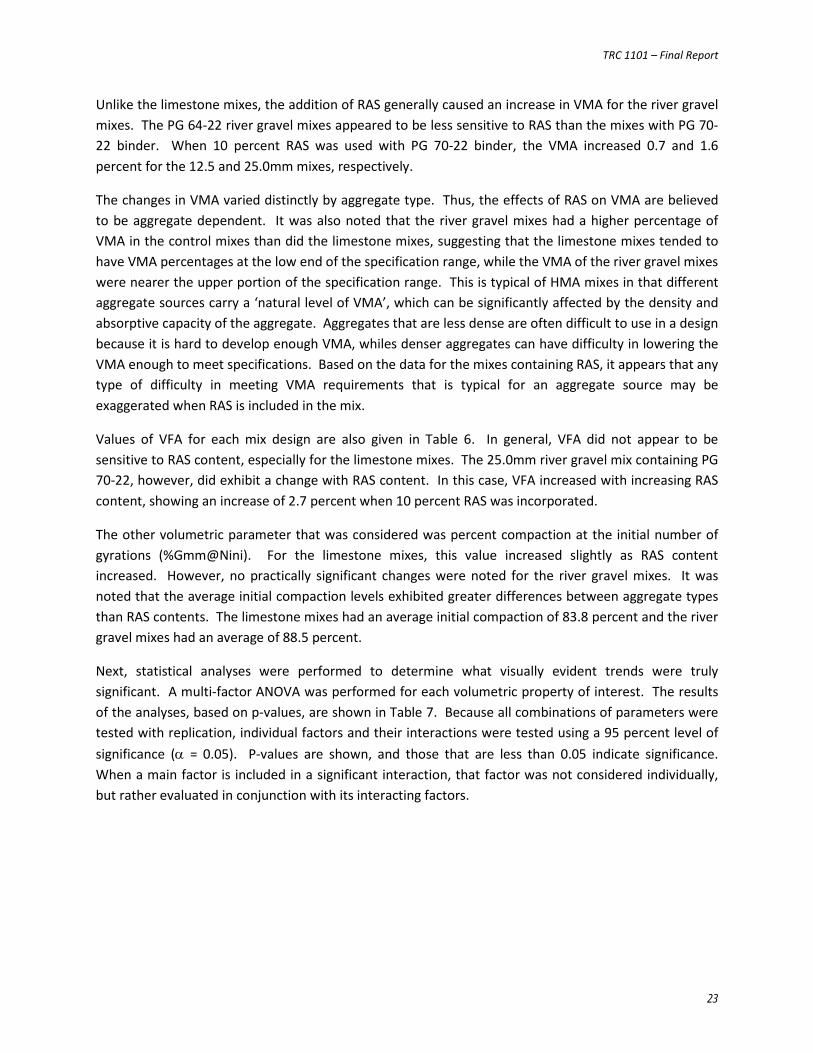
Other volumetric properties were also evaluated for the mixes of varying shingle content, and the average values for volumetric properties of each mix design are shown in Table 6. Note that for volumetric properties that are affected by binder content, such as VMA, the total binder content of the mix was used in the calculation. Based on the data shown, values of VMA tended to decrease for the limestone mixes. These changes appeared more significant for the 25.0mm mixes than the 12.5mm mixes. Also, the VMA appeared to be less sensitive to RAS content in the PG 64-22 mixes than the PG
1
2
3
4
5
6
7
8
1 2 3 4 5 6
Air V
oids
(%)
Binder (%)
Air Voids Vs Binder Content 25 mm River Gravel PG 70-22
0% RAS
2.5% RAS 5% RAS 10% RAS
TRC 1101 – Final Report
22
70-22 mixes. The VMA in the limestone mixes with PG 70-22 binder decreased 0.8 and 1.3 percent when adding 10 percent RAS to the 12.5 and 25.0 mm mixes, respectively.
Table 6: Average Values for Responses with Different Shingle Content
Average Values for Responses
Mix Design % RAS %Virgin Pb %AV VMA VFA %Gmm at Nini
12.5 mm PG 64-22
Limestone
0 6.2 4.7 15.2 66.4 83.3 2.5 5.7 4.4 15.2 70.8 84.1 5.1 5.2 4.1 14.7 72.2 83.9 10 4.2 4.5 14.3 68.8 84.6
25.0 mm PG 64-22
Limestone
0 4.5 4.8 13.3 64.4 83.4 2.5 4 4.7 13.3 63.0 83.5 5 3.3 4.6 12.8 64.1 84.4
10 2.5 4.5 12.6 61.6 80.8
12.5 mm PG 70-22
Limestone
0 6.2 4.5 15.0 69.9 83.9 2.5 5.3 4.5 15.2 70.1 83.4 5 4.5 4.6 14.6 68.2 83.8
10 3.6 4.4 14.2 69.2 84.4
25.0 mm PG 70-22
Limestone
0 4.6 4.3 13.2 67.7 83.8 2.5 3.9 4.4 13.1 66.5 83.7 5 3.5 4.4 12.6 65.0 84.2
10 3.5 4.6 11.9 61.3 85.1
12.5 mm PG 64-22
River Gravel
0 5 4.4 15.1 70.8 88.8 2.5 4.7 4.3 15.0 71.4 88.8 5 4.3 4.3 14.3 70.2 88.8
10 4.1 4.4 14.7 70.1 88.2
25.0 mm PG 64-22
River Gravel
0 4.6 4.6 13.5 66.2 88.8 2.5 4.1 4.5 13.7 67.6 89.2 5 4.4 4.4 12.7 64.7 88.4
10 3.7 4.2 13.8 69.5 88.8
12.5 mm PG 70-22
River Gravel
0 4.8 4.4 14.3 69.0 88.4 2.5 4.2 4.8 14.6 67.7 88.5 5 4.3 4.5 14.4 68.8 88.2
10 4 4.7 15.0 68.6 87.8
25.0 mm PG 70-22
River Gravel
0 4.3 4.5 13.5 66.3 88.4 2.5 4.1 4.7 14.2 67.4 88.4 5 4 4.6 14.3 68.1 88.2
10 3.8 4.7 15.1 69.0 88.1
TRC 1101 – Final Report
23
Unlike the limestone mixes, the addition of RAS generally caused an increase in VMA for the river gravel mixes. The PG 64-22 river gravel mixes appeared to be less sensitive to RAS than the mixes with PG 70-22 binder. When 10 percent RAS was used with PG 70-22 binder, the VMA increased 0.7 and 1.6 percent for the 12.5 and 25.0mm mixes, respectively.
The changes in VMA varied distinctly by aggregate type. Thus, the effects of RAS on VMA are believed to be aggregate dependent. It was also noted that the river gravel mixes had a higher percentage of VMA in the control mixes than did the limestone mixes, suggesting that the limestone mixes tended to have VMA percentages at the low end of the specification range, while the VMA of the river gravel mixes were nearer the upper portion of the specification range. This is typical of HMA mixes in that different aggregate sources carry a ‘natural level of VMA’, which can be significantly affected by the density and absorptive capacity of the aggregate. Aggregates that are less dense are often difficult to use in a design because it is hard to develop enough VMA, whiles denser aggregates can have difficulty in lowering the VMA enough to meet specifications. Based on the data for the mixes containing RAS, it appears that any type of difficulty in meeting VMA requirements that is typical for an aggregate source may be exaggerated when RAS is included in the mix.
Values of VFA for each mix design are also given in Table 6. In general, VFA did not appear to be sensitive to RAS content, especially for the limestone mixes. The 25.0mm river gravel mix containing PG 70-22, however, did exhibit a change with RAS content. In this case, VFA increased with increasing RAS content, showing an increase of 2.7 percent when 10 percent RAS was incorporated.
The other volumetric parameter that was considered was percent compaction at the initial number of gyrations (%Gmm@Nini). For the limestone mixes, this value increased slightly as RAS content increased. However, no practically significant changes were noted for the river gravel mixes. It was noted that the average initial compaction levels exhibited greater differences between aggregate types than RAS contents. The limestone mixes had an average initial compaction of 83.8 percent and the river gravel mixes had an average of 88.5 percent.
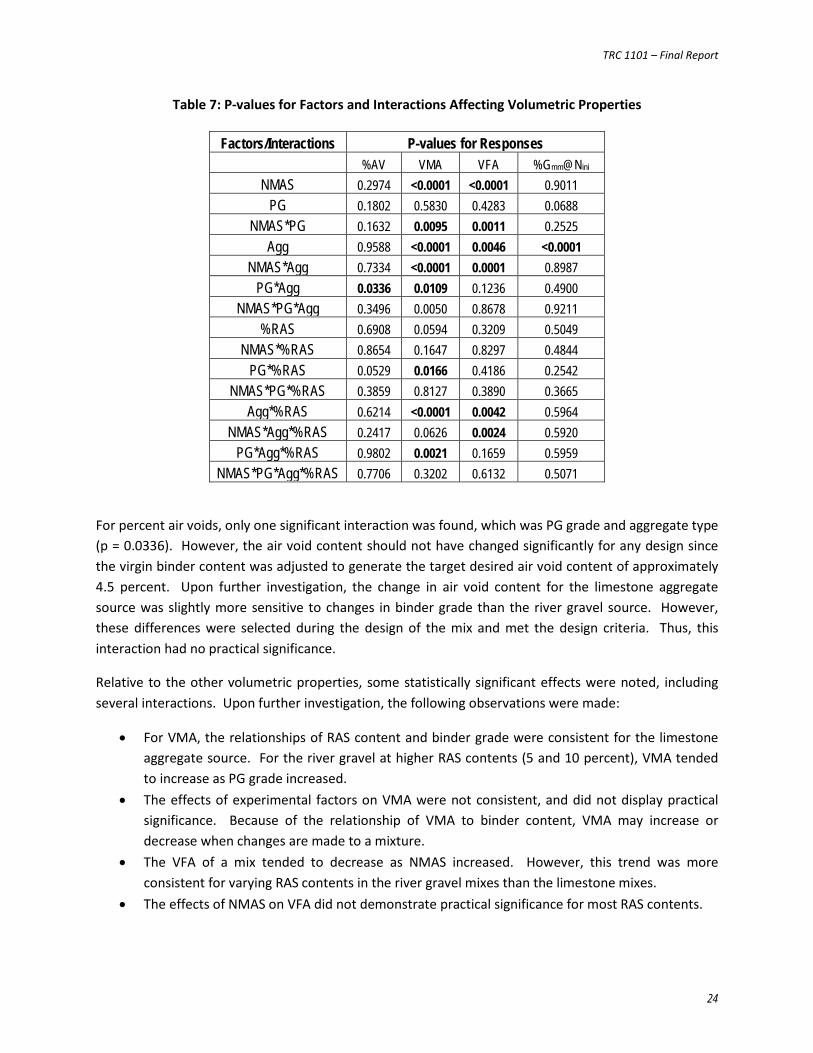
Next, statistical analyses were performed to determine what visually evident trends were truly significant. A multi-factor ANOVA was performed for each volumetric property of interest. The results of the analyses, based on p-values, are shown in Table 7. Because all combinations of parameters were tested with replication, individual factors and their interactions were tested using a 95 percent level of significance (α = 0.05). P-values are shown, and those that are less than 0.05 indicate significance. When a main factor is included in a significant interaction, that factor was not considered individually, but rather evaluated in conjunction with its interacting factors.
TRC 1101 – Final Report
24
Table 7: P-values for Factors and Interactions Affecting Volumetric Properties
Factors/Interactions P-values for Responses
%AV VMA VFA %Gmm@Nini
NMAS 0.2974 <0.0001 <0.0001 0.9011 PG 0.1802 0.5830 0.4283 0.0688
NMAS*PG 0.1632 0.0095 0.0011 0.2525 Agg 0.9588 <0.0001 0.0046 <0.0001
NMAS*Agg 0.7334 <0.0001 0.0001 0.8987 PG*Agg 0.0336 0.0109 0.1236 0.4900
NMAS*PG*Agg 0.3496 0.0050 0.8678 0.9211 %RAS 0.6908 0.0594 0.3209 0.5049
NMAS*%RAS 0.8654 0.1647 0.8297 0.4844 PG*%RAS 0.0529 0.0166 0.4186 0.2542
NMAS*PG*%RAS 0.3859 0.8127 0.3890 0.3665 Agg*%RAS 0.6214 <0.0001 0.0042 0.5964
NMAS*Agg*%RAS 0.2417 0.0626 0.0024 0.5920 PG*Agg*%RAS 0.9802 0.0021 0.1659 0.5959
NMAS*PG*Agg*%RAS 0.7706 0.3202 0.6132 0.5071
For percent air voids, only one significant interaction was found, which was PG grade and aggregate type (p = 0.0336). However, the air void content should not have changed significantly for any design since the virgin binder content was adjusted to generate the target desired air void content of approximately 4.5 percent. Upon further investigation, the change in air void content for the limestone aggregate source was slightly more sensitive to changes in binder grade than the river gravel source. However, these differences were selected during the design of the mix and met the design criteria. Thus, this interaction had no practical significance.
Relative to the other volumetric properties, some statistically significant effects were noted, including several interactions. Upon further investigation, the following observations were made:
• For VMA, the relationships of RAS content and binder grade were consistent for the limestone aggregate source. For the river gravel at higher RAS contents (5 and 10 percent), VMA tended to increase as PG grade increased.
• The effects of experimental factors on VMA were not consistent, and did not display practical significance. Because of the relationship of VMA to binder content, VMA may increase or decrease when changes are made to a mixture.
• The VFA of a mix tended to decrease as NMAS increased. However, this trend was more consistent for varying RAS contents in the river gravel mixes than the limestone mixes.
• The effects of NMAS on VFA did not demonstrate practical significance for most RAS contents.
TRC 1101 – Final Report
25
• Percent compaction at Ninitial was sensitive only to aggregate type. This means that early compaction characteristics were significantly affected by aggregate type, but that the addition of RAS did not affect early compaction.
The reduction in virgin binder content was of particular interest and was considered next. Because the design binder content of an asphalt mix design is selected by the designer and does not lend itself to replication with natural variation, a pooled variance procedure was used to identify the least influential variables in the model. In this analysis, the response variable was the reduction in binder content, or virgin binder change in the RAS and control mixes. Binder reduction, rather than binder content was analyzed in order to normalize the data and reduce the natural effects of NMAS on binder content requirements. For instance, 12.5mm mixes typically require greater binder contents than 25.0mm mixes due to the increased surface area of the aggregate particles. In order to separate these effects from the effects of the RAS, binder reduction (rather than binder content) was analyzed.
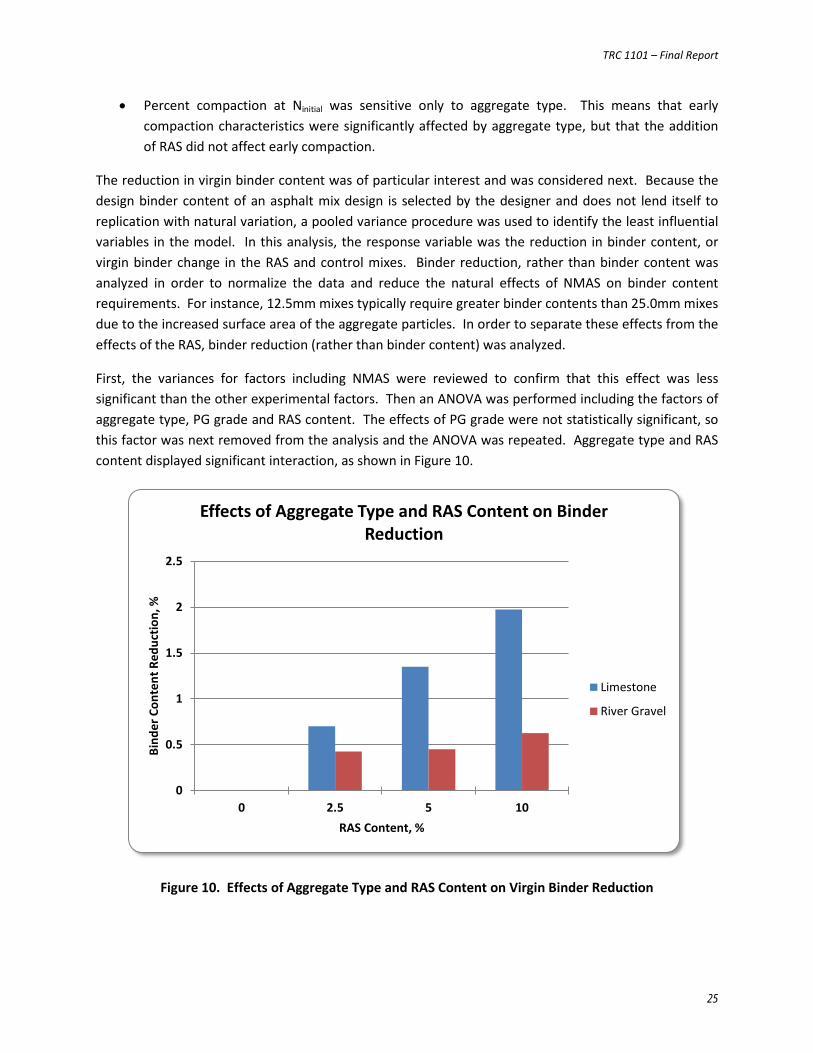
First, the variances for factors including NMAS were reviewed to confirm that this effect was less significant than the other experimental factors. Then an ANOVA was performed including the factors of aggregate type, PG grade and RAS content. The effects of PG grade were not statistically significant, so this factor was next removed from the analysis and the ANOVA was repeated. Aggregate type and RAS content displayed significant interaction, as shown in Figure 10.
Figure 10. Effects of Aggregate Type and RAS Content on Virgin Binder Reduction
0
0.5
1
1.5
2
2.5
0 2.5 5 10
Bind
er C
onte
nt R
educ
tion,
%
RAS Content, %
Effects of Aggregate Type and RAS Content on Binder Reduction
Limestone
River Gravel
TRC 1101 – Final Report
26
RAS content was significant in that as RAS content increased, binder reductions also increased. However, the increase was greater for the limestone aggregate source than the river gravel. For the limestone source, the reductions progressed steadily as the RAS content increased; but for the river gravel, the 2.5 and 5 percent RAS mixes were very similar in terms of binder reductions, and the 10 percent RAS mix had a slightly greater reduction. Even at 2.5 percent RAS, 0.7 and 0.4 percent virgin binder reductions were achieved, which demonstrated a great practical significance of using RAS in asphalt mixtures.
Binder Contribution One of the most important considerations when investigating the effects of RAS on a mixture is the amount of binder contribution. Virgin binder is the most expensive component of an asphalt mix, so the greater the binder contribution of RAS, the greater the cost savings for the mix.
Although asphalt shingles may contain 25 percent asphalt cement, it is generally recognized that not all of this binder will fully contribute to the mixture. To evaluate the available binder in the MSW sources, the ignition method was used to determine the total binder content of each shingle source. The binder contents of the MSW sources were as follows:
• MSW available in northwest Arkansas = 21.2 percent • MSW available in southwest Arkansas = 15.1 percent
For asphalt mixes, a correction factor is necessary when determining asphalt binder content using the ignition oven, and the same is true for shingles. In this study, a correction factor was determined for the virgin mix, and then a correction factor was determined for the shingle mix. The difference in the correction factors was attributed to the shingles. Although a correction factor was developed for the shingle binder content, the equations in AASHTO PP53 were not sensitive to this correction factor. Thus, for relatively low RAS contents, this correction factor was determined to be negligible.
Next, these values were used to calculate binder contribution for each of the RAS mixtures, as described in AASHTO PP53. This value is essentially the change in virgin optimum binder content for a given mixture when produced with and without RAS, and quantifies the change in behavior of an asphalt mixture due to the addition of RAS. The addition of RAS decreases the air voids in the mix, allowing for the reduction in virgin binder content. In other words, when air voids are held constant, virgin binder content is reduced. In the AASHTO method, it is assumed that only the binder contained in the shingles is responsible for the changes in air voids, however, the changes in aggregate gradation resulting from the fine aggregate in the shingles may also have an effect. In any case, the changes in air voids are attributed to the addition of RAS, and this effect is generalized as “shingle binder available”, or binder contribution.
On issue that was encountered early in the binder contribution evaluation was that the AASHTO-recommended procedure for producing laboratory specimens involves adding the RAS product at ambient temperature at the time mixing. This procedure does assist in preventing shingle agglomeration, but does not allow adequate heating time to activate the available shingle binder. This is most likely the reason for AASHTO PP53 stating that “this calculation will underestimate the value of
TRC 1101 – Final Report
27
Fc”, leading to the AASHTO requirement for calculating a corrected value of F. Rather than simply averaging the calculated value of Fc with 100, a more appropriate procedure would be to pre-heat the RAS product with the aggregate blend, allowing for a more realistic release of shingle binder. This is more consistent with field production and alleviates the need for a correction to the binder contribution value. Note that the RAS tends to agglomerate during heating, and should be thoroughly mixed into the aggregate blend before heating to ensure a homogeneous mixture.
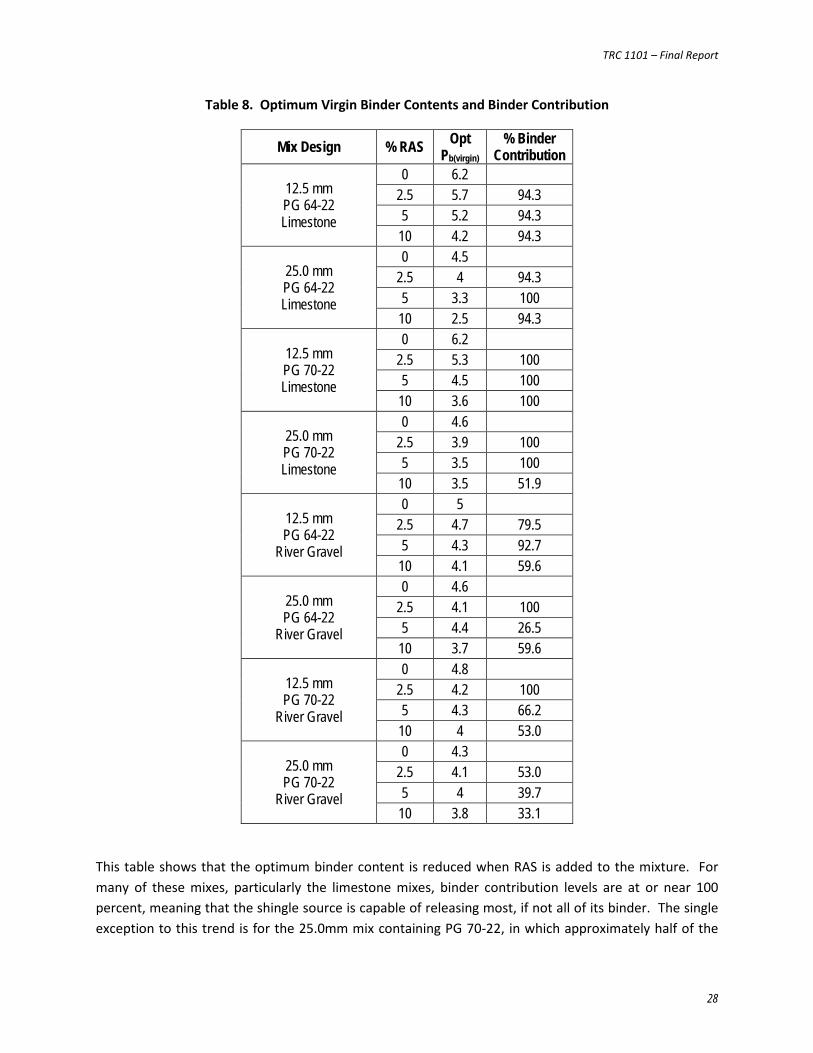
For the mixes tested in this study, RAS was preheated with the aggregate blend, and no correction factor was applied to the calculation of binder contribution. Results are given in Table 8.
TRC 1101 – Final Report
28
Table 8. Optimum Virgin Binder Contents and Binder Contribution
Mix Design % RAS Opt Pb(virgin)
% Binder Contribution
12.5 mm PG 64-22 Limestone
0 6.2 2.5 5.7 94.3 5 5.2 94.3
10 4.2 94.3
25.0 mm PG 64-22 Limestone
0 4.5 2.5 4 94.3 5 3.3 100
10 2.5 94.3
12.5 mm PG 70-22 Limestone
0 6.2 2.5 5.3 100 5 4.5 100
10 3.6 100
25.0 mm PG 70-22 Limestone
0 4.6 2.5 3.9 100 5 3.5 100
10 3.5 51.9
12.5 mm PG 64-22
River Gravel
0 5 2.5 4.7 79.5 5 4.3 92.7
10 4.1 59.6
25.0 mm PG 64-22
River Gravel
0 4.6 2.5 4.1 100 5 4.4 26.5
10 3.7 59.6
12.5 mm PG 70-22
River Gravel
0 4.8 2.5 4.2 100 5 4.3 66.2
10 4 53.0
25.0 mm PG 70-22
River Gravel
0 4.3 2.5 4.1 53.0 5 4 39.7
10 3.8 33.1
This table shows that the optimum binder content is reduced when RAS is added to the mixture. For many of these mixes, particularly the limestone mixes, binder contribution levels are at or near 100 percent, meaning that the shingle source is capable of releasing most, if not all of its binder. The single exception to this trend is for the 25.0mm mix containing PG 70-22, in which approximately half of the
TRC 1101 – Final Report
29
shingle binder contributed to the mix. For the river gravel mixes, binder contributions are lower, which coincides with the lesser binder content of the Southwest Arkansas MSW source. For the river gravel mixes, the greatest binder contribution levels are generally associated with the lower RAS contents. In every case, the 10 percent RAS mixes provided the least binder contribution, and the 2.5 percent RAS mixes typically provided the greatest. This suggests that the greatest binder savings advantages may be obtained by using 2.5 to 5 percent RAS in HMA mixes. It is noted that each aggregate source is associated with its own shingle source, and differences in the mixes containing the two aggregate types could be due to the shingles, the aggregates, or a combination of the two. It is also likely that the shingle aggregate, in addition to the shingle binder, created a decrease in air voids for the mixes, thereby decreasing the optimum virgin binder contents.
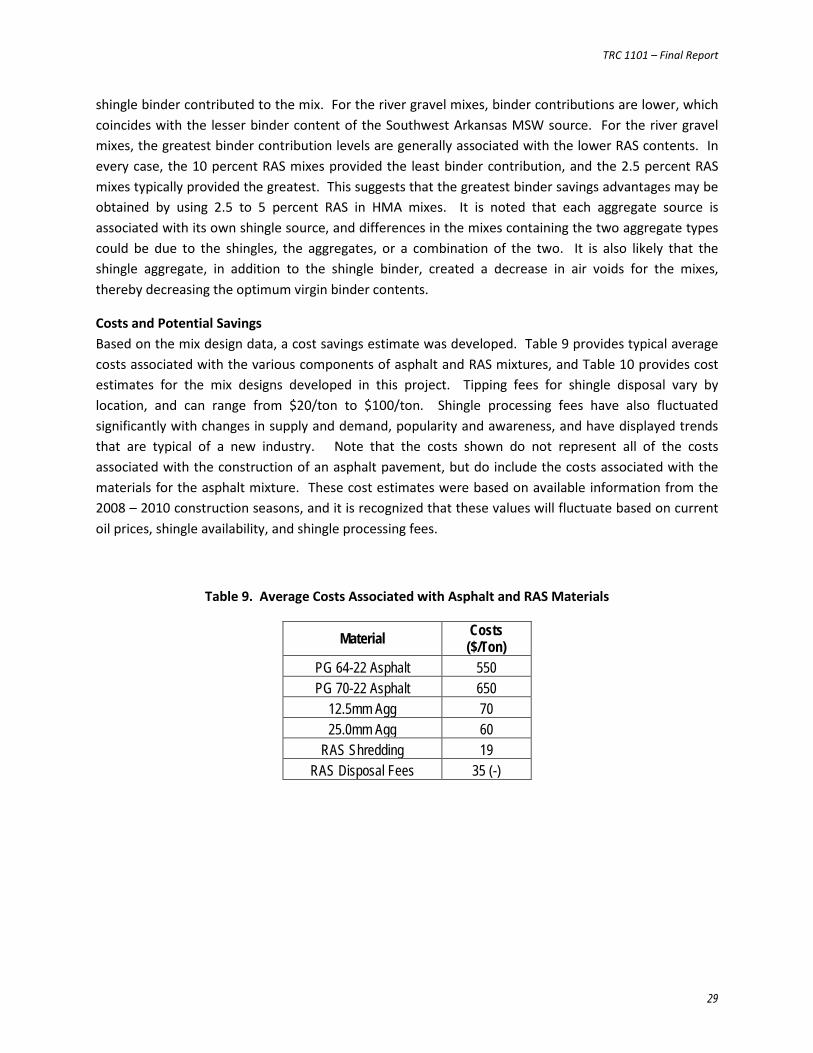
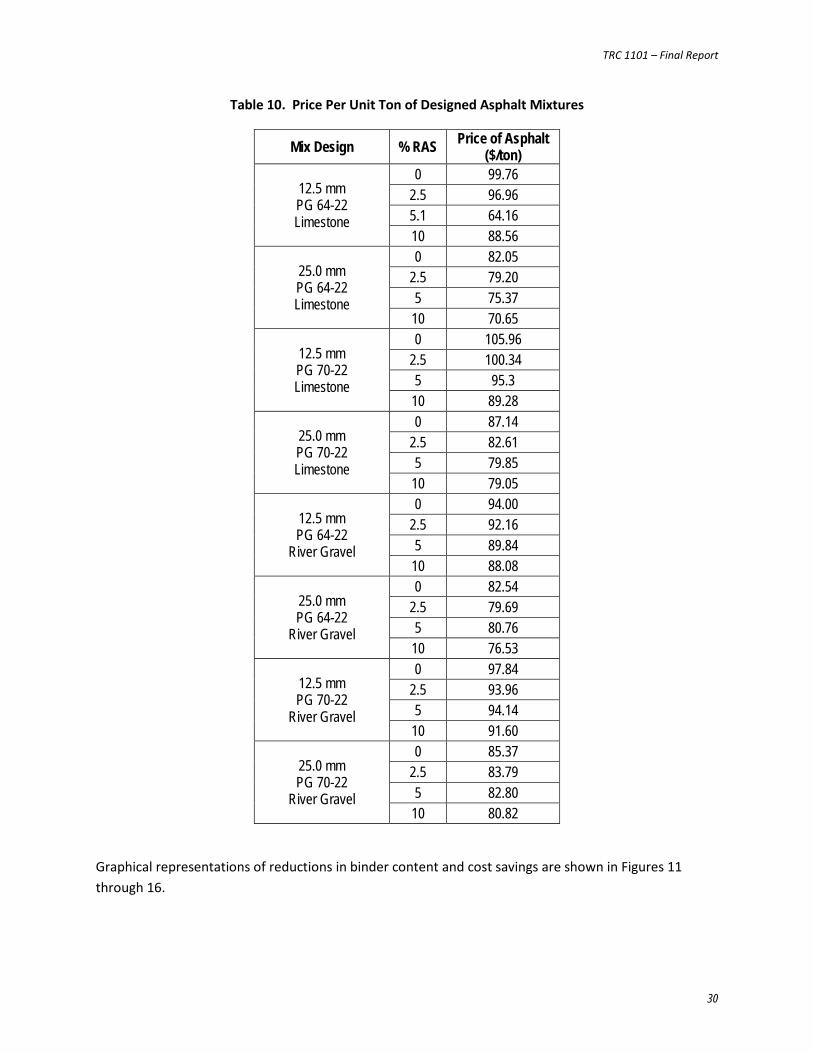
Costs and Potential Savings Based on the mix design data, a cost savings estimate was developed. Table 9 provides typical average costs associated with the various components of asphalt and RAS mixtures, and Table 10 provides cost estimates for the mix designs developed in this project. Tipping fees for shingle disposal vary by location, and can range from $20/ton to $100/ton. Shingle processing fees have also fluctuated significantly with changes in supply and demand, popularity and awareness, and have displayed trends that are typical of a new industry. Note that the costs shown do not represent all of the costs associated with the construction of an asphalt pavement, but do include the costs associated with the materials for the asphalt mixture. These cost estimates were based on available information from the 2008 – 2010 construction seasons, and it is recognized that these values will fluctuate based on current oil prices, shingle availability, and shingle processing fees.
Table 9. Average Costs Associated with Asphalt and RAS Materials
Material Costs ($/Ton)
PG 64-22 Asphalt 550 PG 70-22 Asphalt 650
12.5mm Agg 70 25.0mm Agg 60
RAS Shredding 19 RAS Disposal Fees 35 (-)
TRC 1101 – Final Report
30
Table 10. Price Per Unit Ton of Designed Asphalt Mixtures
Mix Design % RAS Price of Asphalt ($/ton)
12.5 mm PG 64-22 Limestone
0 99.76 2.5 96.96 5.1 64.16 10 88.56
25.0 mm PG 64-22 Limestone
0 82.05 2.5 79.20 5 75.37
10 70.65
12.5 mm PG 70-22 Limestone
0 105.96 2.5 100.34 5 95.3
10 89.28
25.0 mm PG 70-22 Limestone
0 87.14 2.5 82.61 5 79.85
10 79.05
12.5 mm PG 64-22
River Gravel
0 94.00 2.5 92.16 5 89.84
10 88.08
25.0 mm PG 64-22
River Gravel
0 82.54 2.5 79.69 5 80.76
10 76.53
12.5 mm PG 70-22
River Gravel
0 97.84 2.5 93.96 5 94.14
10 91.60
25.0 mm PG 70-22
River Gravel
0 85.37 2.5 83.79 5 82.80
10 80.82
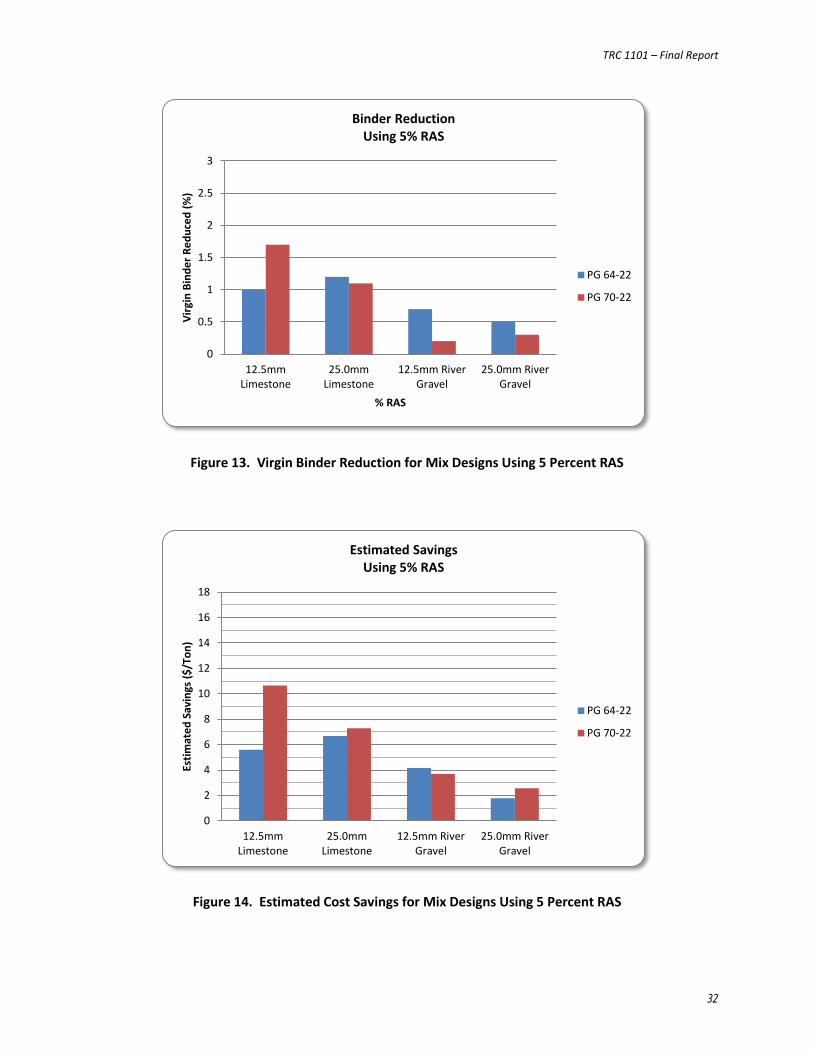
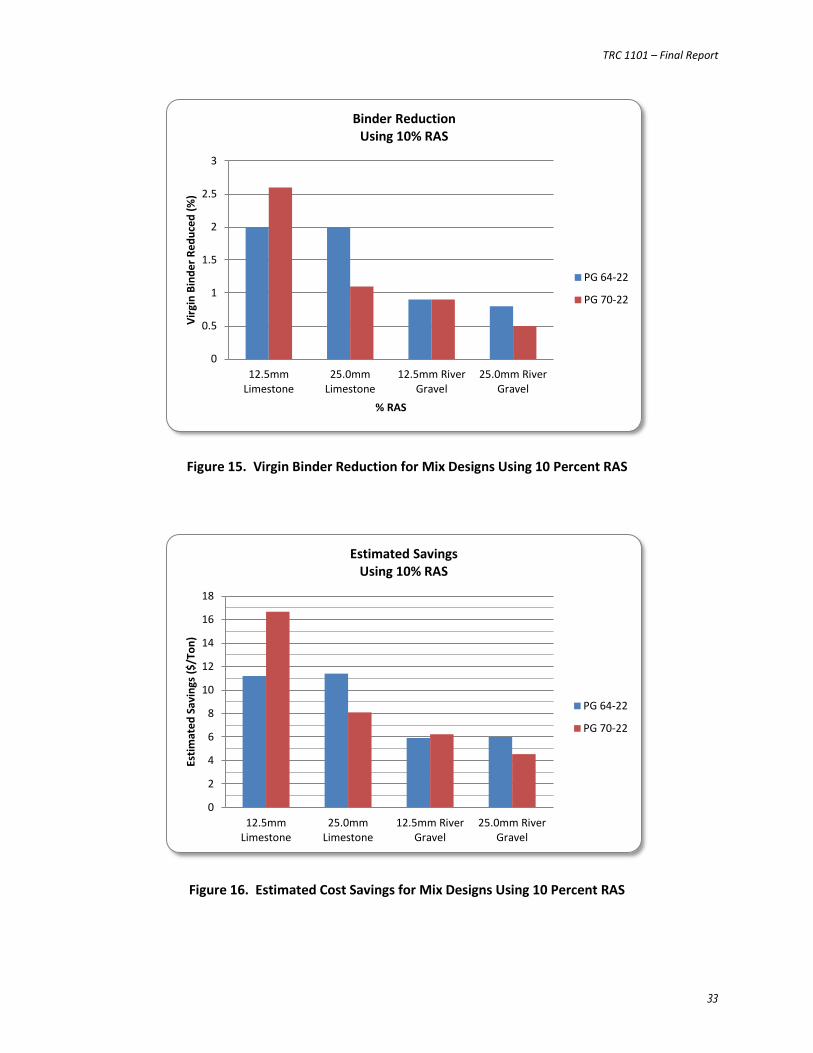
Graphical representations of reductions in binder content and cost savings are shown in Figures 11 through 16.
TRC 1101 – Final Report
31
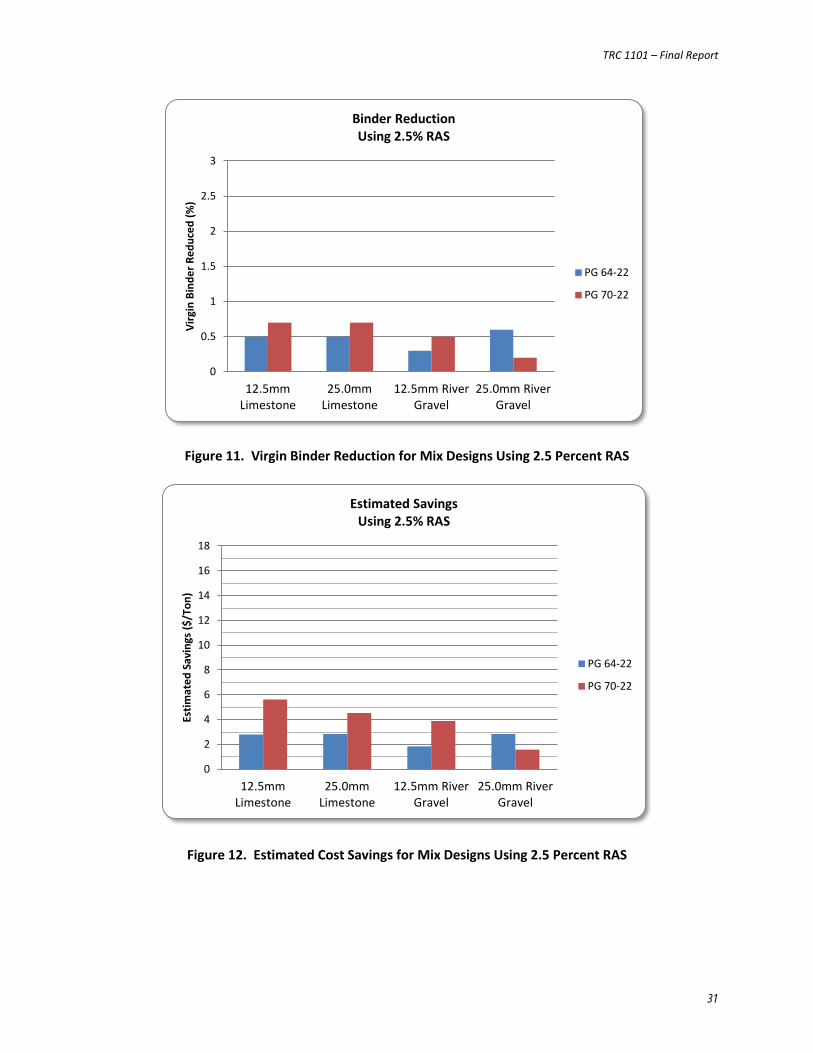
Figure 11. Virgin Binder Reduction for Mix Designs Using 2.5 Percent RAS
Figure 12. Estimated Cost Savings for Mix Designs Using 2.5 Percent RAS
0
0.5
1
1.5
2
2.5
3
12.5mmLimestone
25.0mmLimestone
12.5mm RiverGravel
25.0mm RiverGravel
Virg
in B
inde
r Red
uced
(%)
Binder Reduction Using 2.5% RAS
PG 64-22
PG 70-22
0
2
4
6
8
10
12
14
16
18
12.5mmLimestone
25.0mmLimestone
12.5mm RiverGravel
25.0mm RiverGravel
Estim
ated
Sav
ings
($/T
on)
Estimated Savings Using 2.5% RAS
PG 64-22
PG 70-22
TRC 1101 – Final Report
32
Figure 13. Virgin Binder Reduction for Mix Designs Using 5 Percent RAS
Figure 14. Estimated Cost Savings for Mix Designs Using 5 Percent RAS
0
0.5
1
1.5
2
2.5
3
12.5mmLimestone
25.0mmLimestone
12.5mm RiverGravel
25.0mm RiverGravel
Virg
in B
inde
r Red
uced
(%)
% RAS
Binder Reduction Using 5% RAS
PG 64-22
PG 70-22
0
2
4
6
8
10
12
14
16
18
12.5mmLimestone
25.0mmLimestone
12.5mm RiverGravel
25.0mm RiverGravel
Estim
ated
Sav
ings
($/T
on)
Estimated Savings Using 5% RAS
PG 64-22
PG 70-22
TRC 1101 – Final Report
33
Figure 15. Virgin Binder Reduction for Mix Designs Using 10 Percent RAS
Figure 16. Estimated Cost Savings for Mix Designs Using 10 Percent RAS
0
0.5
1
1.5
2
2.5
3
12.5mmLimestone
25.0mmLimestone
12.5mm RiverGravel
25.0mm RiverGravel
Virg
in B
inde
r Red
uced
(%)
% RAS
Binder Reduction Using 10% RAS
PG 64-22
PG 70-22
0
2
4
6
8
10
12
14
16
18
12.5mmLimestone
25.0mmLimestone
12.5mm RiverGravel
25.0mm RiverGravel
Estim
ated
Sav
ings
($/T
on)
Estimated Savings Using 10% RAS
PG 64-22
PG 70-22
TRC 1101 – Final Report
34
The most important conclusion was that for any RAS content, there was a cost savings associated with all of the mixtures in this portion of the study. At 2.5 percent RAS, the average cost savings was $3.24/ton, and average savings were estimated to be $5.30 and $8.76 for 5 and 10 percent RAS, respectively. Binder reductions and cost savings increased with increased RAS content, and the savings were more notable for the limestone source. While differences were apparent between aggregate sources, remember that the shingle sources varied as well, and were specific to each aggregate. Binder grade also appeared to affect the level of cost savings in that greater savings were achieved for the PG 70-22 mixes, which is reasonable since the higher binder grades carry a higher price tag.
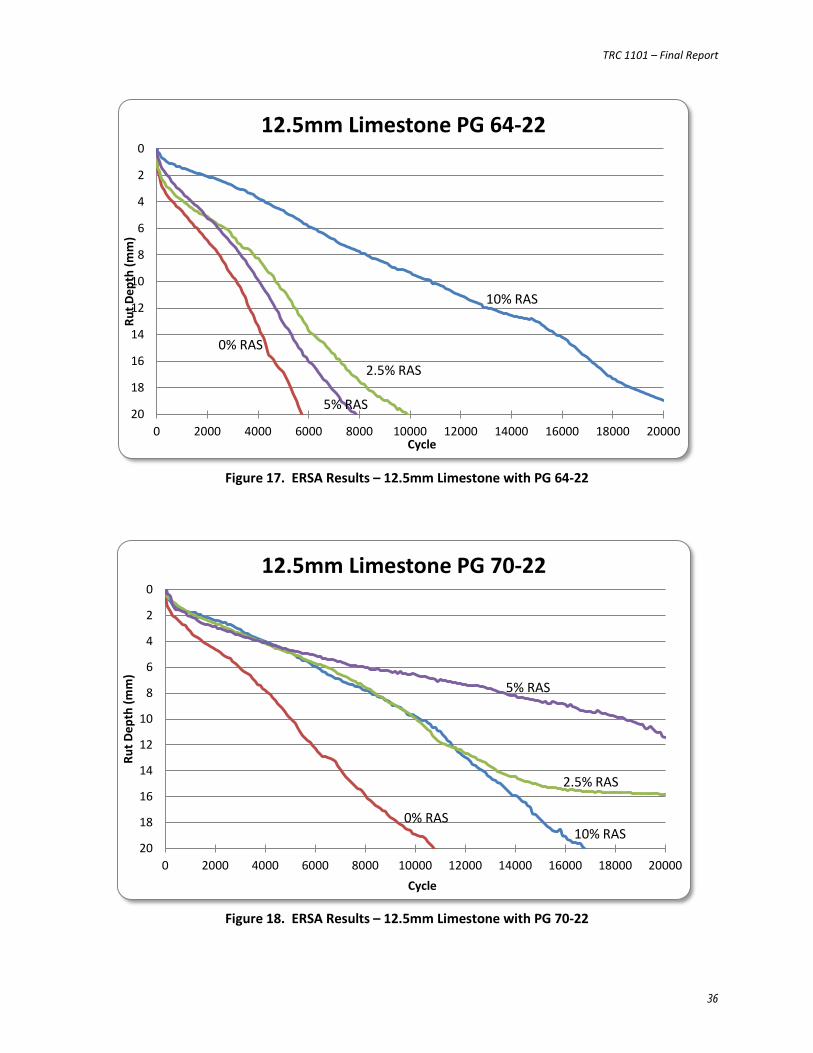
Rutting and Stripping Performance Rutting and stripping are major concerns for asphalt mixtures and are frequent modes of failure. It was hypothesized that the addition of shingles in asphalt mixtures could aid the mix in terms of rutting resistance because the shingle binder is stiffer than typical asphalt binders. In this portion of the study, all of the mixture designs were tested in the Evaluator of Rutting and Stripping in Asphalt (ERSA) to determine resistance to permanent deformation and moisture susceptibility. Based on the results of the ERSA testing, a subset of mixes was selected for additional testing according to AASHTO T283 for moisture damage to further assess whether the shingles increase a mixture’s potential for moisture damage.
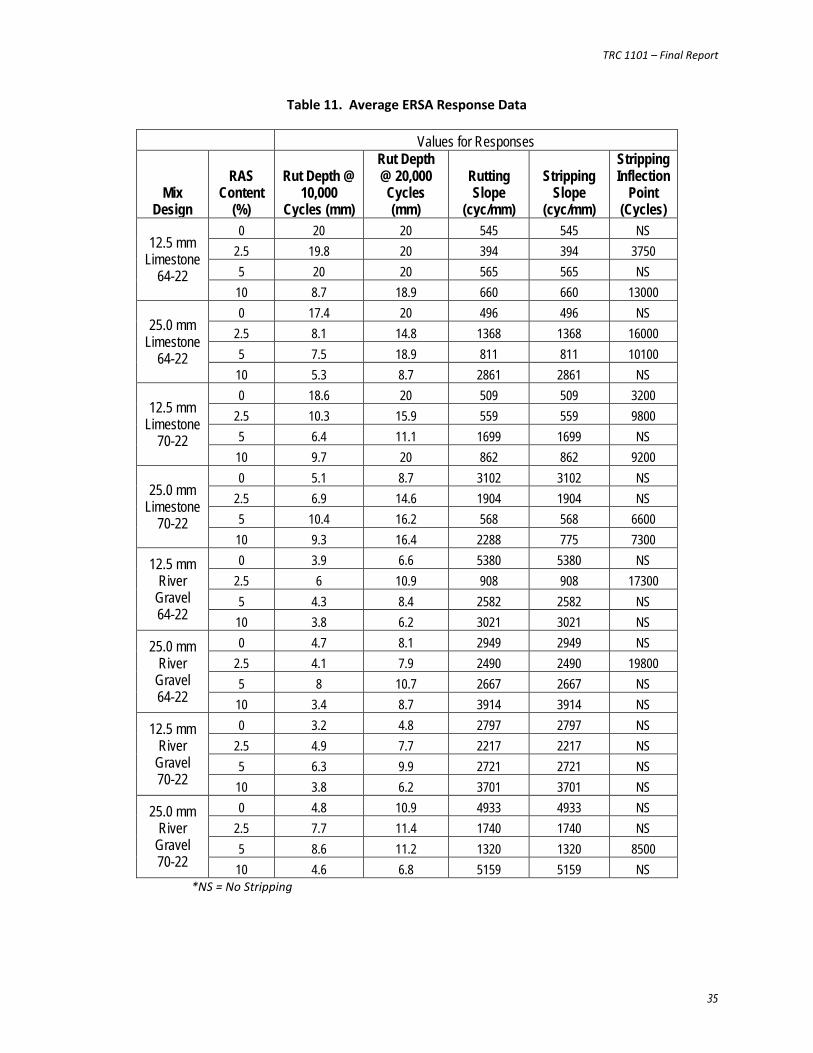
The wheel-track testing machine (ERSA) used in this study is very similar to the Hamburg device, which uses a loaded steel wheel on asphalt samples that are submerged in 50 °C water and deflection measurements are recorded periodically for a total of 20,000 cycles. The resulting data describes rut depth at 10,000 cycles, rut depth at 20,000 cycles, rutting slope, stripping slope, and stripping inflection point. The data was used to provide relative comparisons of mixture performance, and to assess the effects of varying percentages of RAS in the asphalt mixtures. Table 11 provides the average responses obtained from the ERSA testing, and Figures 17 through 24 provide graphical performance data.
TRC 1101 – Final Report
35
Table 11. Average ERSA Response Data
Values for Responses
Mix Design
RAS Content
(%)
Rut Depth @ 10,000
Cycles (mm)
Rut Depth @ 20,000 Cycles (mm)
Rutting Slope
(cyc/mm)
Stripping Slope
(cyc/mm)
Stripping Inflection
Point
(Cycles)
12.5 mm Limestone
64-22
0 20 20 545 545 NS 2.5 19.8 20 394 394 3750 5 20 20 565 565 NS
10 8.7 18.9 660 660 13000
25.0 mm Limestone
64-22
0 17.4 20 496 496 NS 2.5 8.1 14.8 1368 1368 16000 5 7.5 18.9 811 811 10100
10 5.3 8.7 2861 2861 NS
12.5 mm Limestone
70-22
0 18.6 20 509 509 3200 2.5 10.3 15.9 559 559 9800 5 6.4 11.1 1699 1699 NS
10 9.7 20 862 862 9200
25.0 mm Limestone
70-22
0 5.1 8.7 3102 3102 NS 2.5 6.9 14.6 1904 1904 NS 5 10.4 16.2 568 568 6600
10 9.3 16.4 2288 775 7300
12.5 mm River
Gravel 64-22
0 3.9 6.6 5380 5380 NS 2.5 6 10.9 908 908 17300 5 4.3 8.4 2582 2582 NS
10 3.8 6.2 3021 3021 NS
25.0 mm River
Gravel 64-22
0 4.7 8.1 2949 2949 NS 2.5 4.1 7.9 2490 2490 19800 5 8 10.7 2667 2667 NS
10 3.4 8.7 3914 3914 NS
12.5 mm River
Gravel 70-22
0 3.2 4.8 2797 2797 NS 2.5 4.9 7.7 2217 2217 NS 5 6.3 9.9 2721 2721 NS
10 3.8 6.2 3701 3701 NS
25.0 mm River
Gravel 70-22
0 4.8 10.9 4933 4933 NS 2.5 7.7 11.4 1740 1740 NS 5 8.6 11.2 1320 1320 8500
10 4.6 6.8 5159 5159 NS *NS = No Stripping
TRC 1101 – Final Report
36
Figure 17. ERSA Results – 12.5mm Limestone with PG 64-22
Figure 18. ERSA Results – 12.5mm Limestone with PG 70-22
0
2
4
6
8
10
12
14
16
18
200 2000 4000 6000 8000 10000 12000 14000 16000 18000 20000
Rut D
epth
(mm
)
Cycle
12.5mm Limestone PG 64-22
10% RAS
0% RAS
5% RAS
2.5% RAS
0
2
4
6
8
10
12
14
16
18
200 2000 4000 6000 8000 10000 12000 14000 16000 18000 20000
Rut D
epth
(mm
)
Cycle
12.5mm Limestone PG 70-22
10% RAS 0% RAS
5% RAS
2.5% RAS
TRC 1101 – Final Report
37
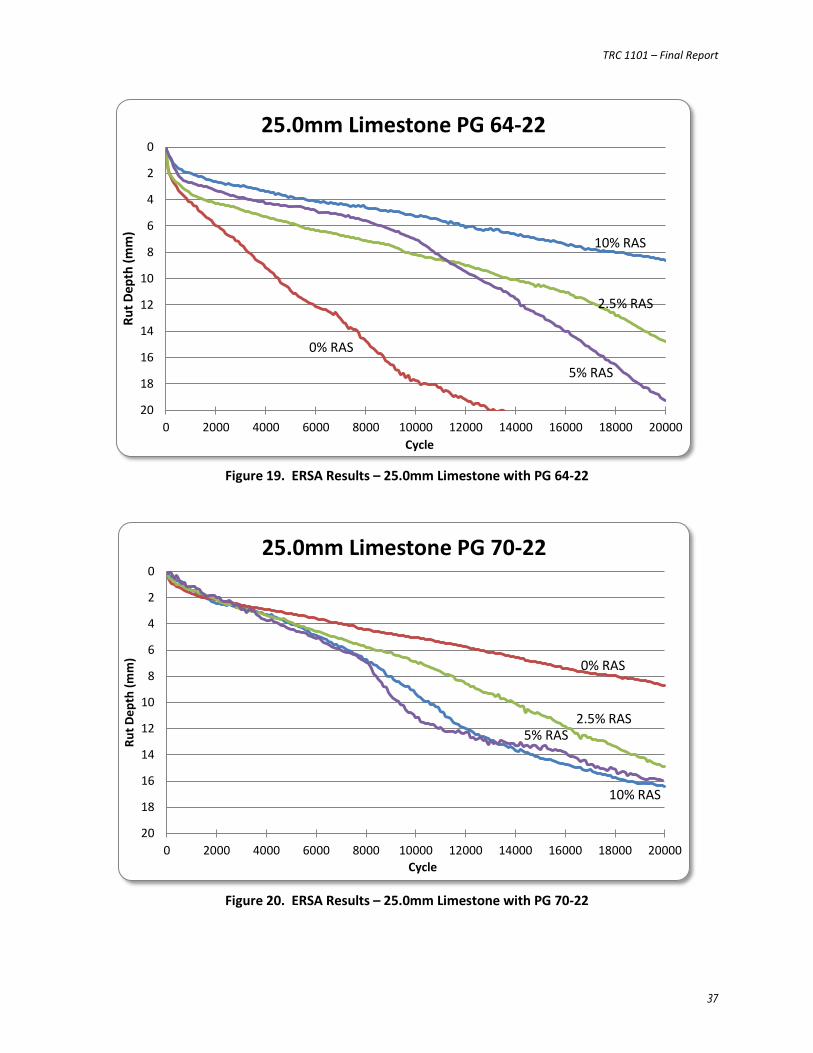
Figure 19. ERSA Results – 25.0mm Limestone with PG 64-22
Figure 20. ERSA Results – 25.0mm Limestone with PG 70-22
0
2
4
6
8
10
12
14
16
18
200 2000 4000 6000 8000 10000 12000 14000 16000 18000 20000
Rut D
epth
(mm
)
Cycle
25.0mm Limestone PG 64-22
0% RAS
2.5% RAS
5% RAS
10% RAS
0
2
4
6
8
10
12
14
16
18
200 2000 4000 6000 8000 10000 12000 14000 16000 18000 20000
Rut D
epth
(mm
)
Cycle
25.0mm Limestone PG 70-22
10% RAS
0% RAS
5% RAS 2.5% RAS
TRC 1101 – Final Report
38
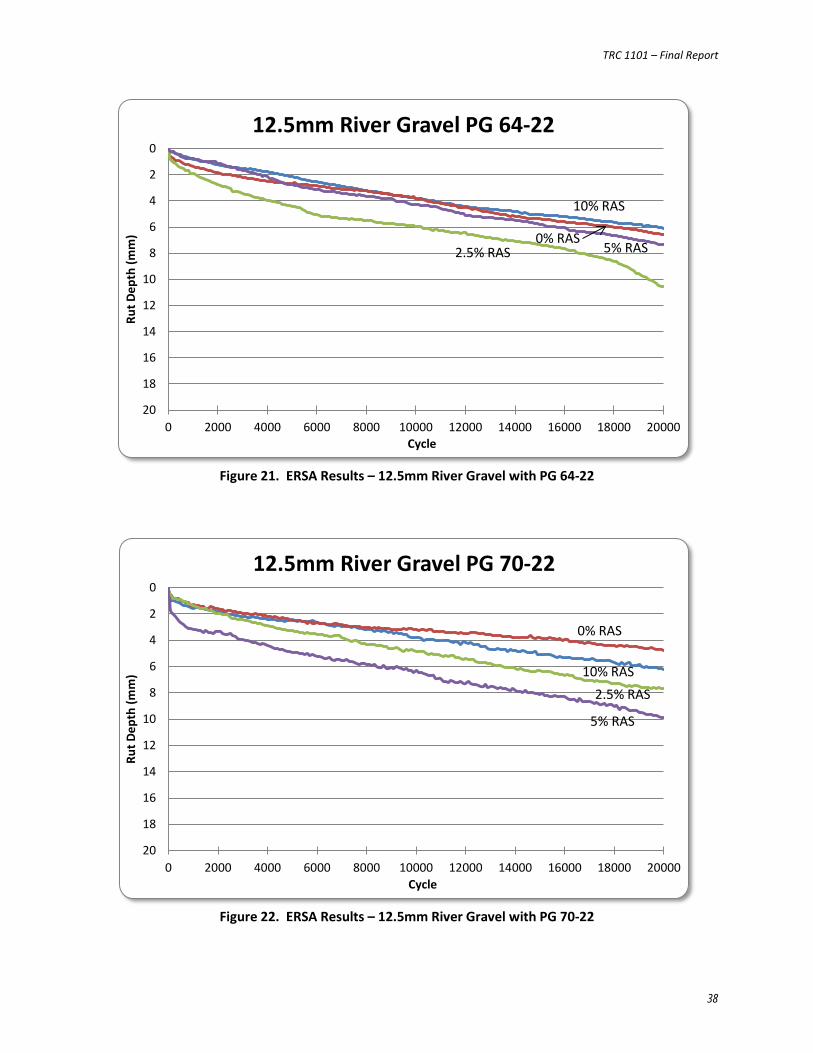
Figure 21. ERSA Results – 12.5mm River Gravel with PG 64-22
Figure 22. ERSA Results – 12.5mm River Gravel with PG 70-22
0
2
4
6
8
10
12
14
16
18
200 2000 4000 6000 8000 10000 12000 14000 16000 18000 20000
Rut D
epth
(mm
)
Cycle
12.5mm River Gravel PG 64-22
10% RAS
0% RAS 5% RAS 2.5% RAS
0
2
4
6
8
10
12
14
16
18
200 2000 4000 6000 8000 10000 12000 14000 16000 18000 20000
Rut D
epth
(mm
)
Cycle
12.5mm River Gravel PG 70-22
10% RAS
0% RAS
5% RAS
2.5% RAS
TRC 1101 – Final Report
39
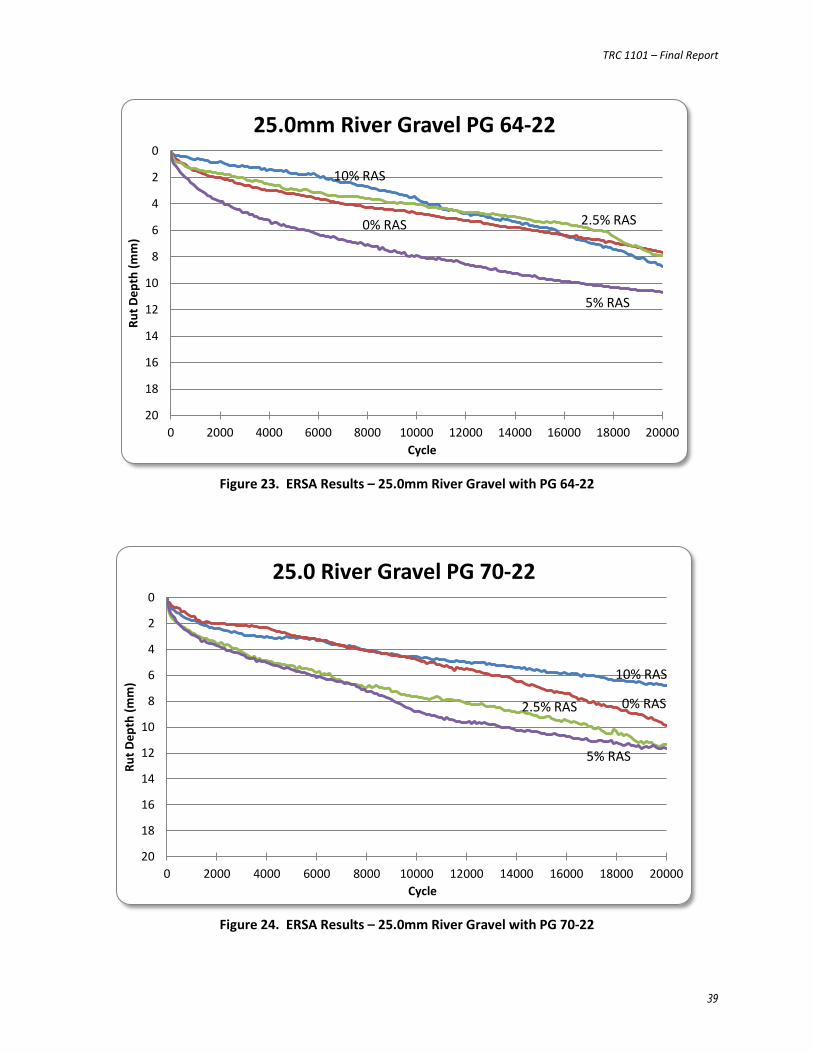
Figure 23. ERSA Results – 25.0mm River Gravel with PG 64-22
Figure 24. ERSA Results – 25.0mm River Gravel with PG 70-22
0
2
4
6
8
10
12
14
16
18
200 2000 4000 6000 8000 10000 12000 14000 16000 18000 20000
Rut D
epth
(mm
)
Cycle
25.0mm River Gravel PG 64-22
10% RAS
0% RAS
5% RAS
2.5% RAS
0
2
4
6
8
10
12
14
16
18
200 2000 4000 6000 8000 10000 12000 14000 16000 18000 20000
Rut D
epth
(mm
)
Cycle
25.0 River Gravel PG 70-22
10% RAS
0% RAS
5% RAS
2.5% RAS
TRC 1101 – Final Report
40
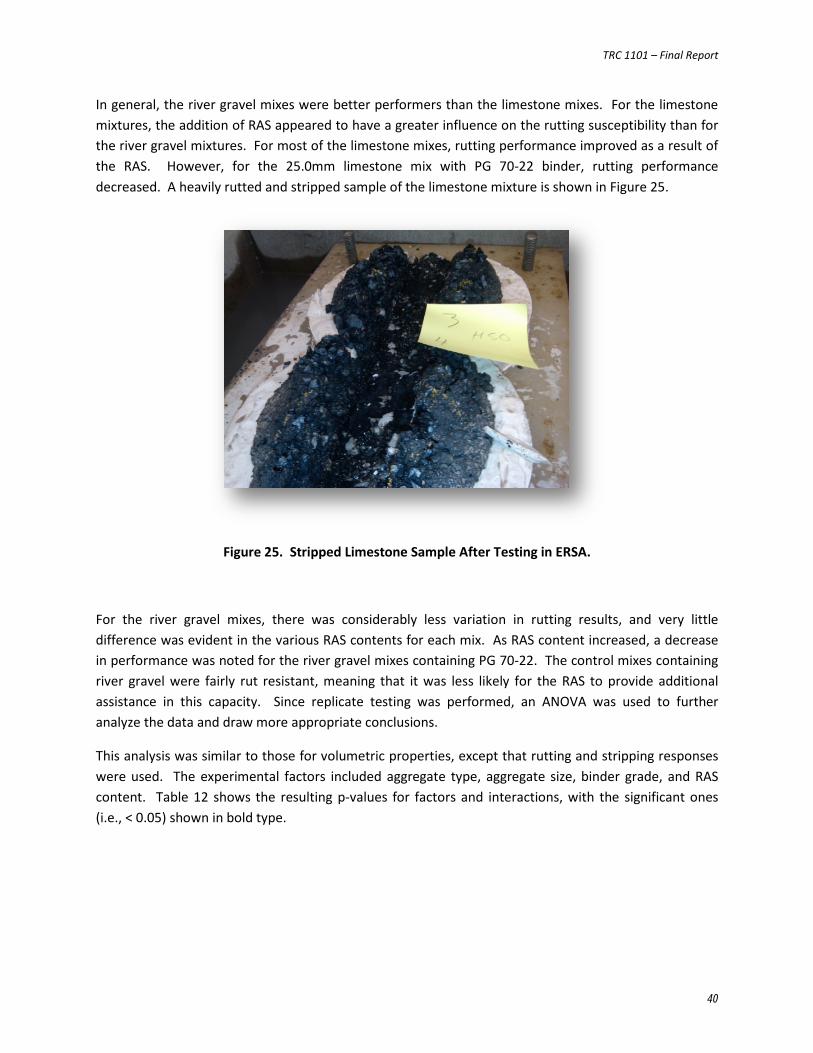
In general, the river gravel mixes were better performers than the limestone mixes. For the limestone mixtures, the addition of RAS appeared to have a greater influence on the rutting susceptibility than for the river gravel mixtures. For most of the limestone mixes, rutting performance improved as a result of the RAS. However, for the 25.0mm limestone mix with PG 70-22 binder, rutting performance decreased. A heavily rutted and stripped sample of the limestone mixture is shown in Figure 25.
Figure 25. Stripped Limestone Sample After Testing in ERSA.
For the river gravel mixes, there was considerably less variation in rutting results, and very little difference was evident in the various RAS contents for each mix. As RAS content increased, a decrease in performance was noted for the river gravel mixes containing PG 70-22. The control mixes containing river gravel were fairly rut resistant, meaning that it was less likely for the RAS to provide additional assistance in this capacity. Since replicate testing was performed, an ANOVA was used to further analyze the data and draw more appropriate conclusions.
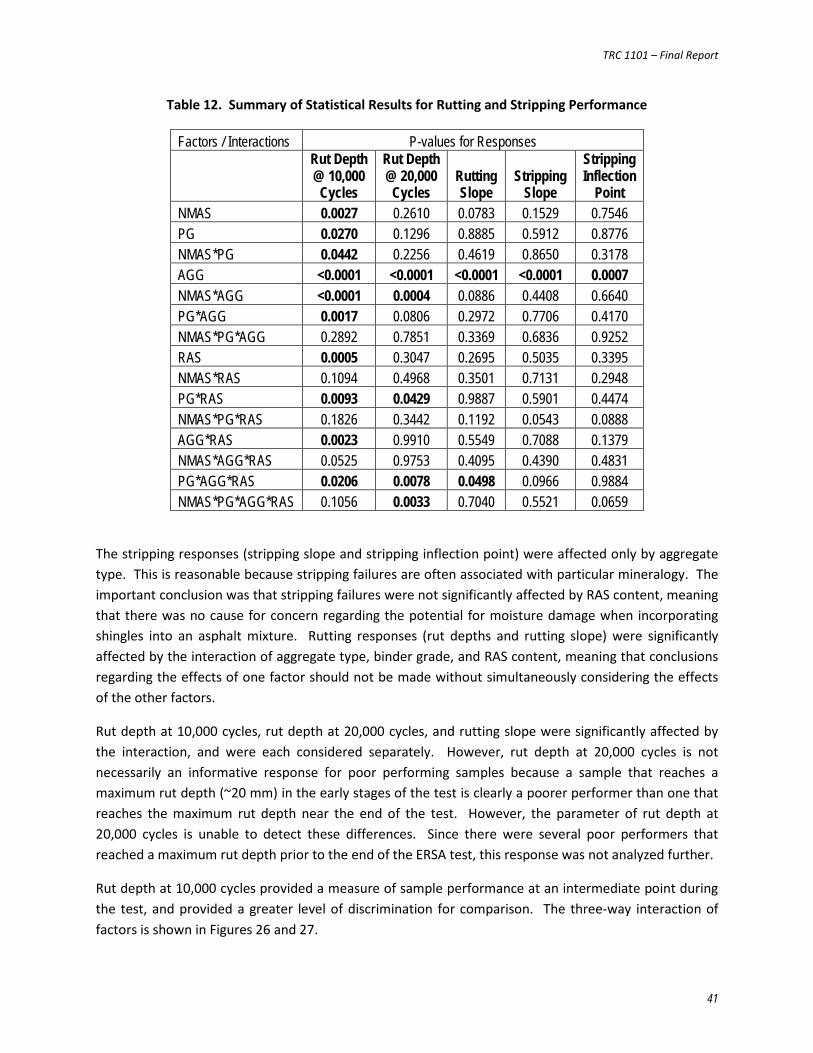
This analysis was similar to those for volumetric properties, except that rutting and stripping responses were used. The experimental factors included aggregate type, aggregate size, binder grade, and RAS content. Table 12 shows the resulting p-values for factors and interactions, with the significant ones (i.e., < 0.05) shown in bold type.
TRC 1101 – Final Report
41
Table 12. Summary of Statistical Results for Rutting and Stripping Performance
Factors / Interactions P-values for Responses
Rut Depth @ 10,000
Cycles
Rut Depth @ 20,000
Cycles Rutting Slope
Stripping Slope
Stripping Inflection
Point NMAS 0.0027 0.2610 0.0783 0.1529 0.7546 PG 0.0270 0.1296 0.8885 0.5912 0.8776 NMAS*PG 0.0442 0.2256 0.4619 0.8650 0.3178 AGG <0.0001 <0.0001 <0.0001 <0.0001 0.0007 NMAS*AGG <0.0001 0.0004 0.0886 0.4408 0.6640 PG*AGG 0.0017 0.0806 0.2972 0.7706 0.4170 NMAS*PG*AGG 0.2892 0.7851 0.3369 0.6836 0.9252 RAS 0.0005 0.3047 0.2695 0.5035 0.3395 NMAS*RAS 0.1094 0.4968 0.3501 0.7131 0.2948 PG*RAS 0.0093 0.0429 0.9887 0.5901 0.4474 NMAS*PG*RAS 0.1826 0.3442 0.1192 0.0543 0.0888 AGG*RAS 0.0023 0.9910 0.5549 0.7088 0.1379 NMAS*AGG*RAS 0.0525 0.9753 0.4095 0.4390 0.4831 PG*AGG*RAS 0.0206 0.0078 0.0498 0.0966 0.9884 NMAS*PG*AGG*RAS 0.1056 0.0033 0.7040 0.5521 0.0659
The stripping responses (stripping slope and stripping inflection point) were affected only by aggregate type. This is reasonable because stripping failures are often associated with particular mineralogy. The important conclusion was that stripping failures were not significantly affected by RAS content, meaning that there was no cause for concern regarding the potential for moisture damage when incorporating shingles into an asphalt mixture. Rutting responses (rut depths and rutting slope) were significantly affected by the interaction of aggregate type, binder grade, and RAS content, meaning that conclusions regarding the effects of one factor should not be made without simultaneously considering the effects of the other factors.
Rut depth at 10,000 cycles, rut depth at 20,000 cycles, and rutting slope were significantly affected by the interaction, and were each considered separately. However, rut depth at 20,000 cycles is not necessarily an informative response for poor performing samples because a sample that reaches a maximum rut depth (~20 mm) in the early stages of the test is clearly a poorer performer than one that reaches the maximum rut depth near the end of the test. However, the parameter of rut depth at 20,000 cycles is unable to detect these differences. Since there were several poor performers that reached a maximum rut depth prior to the end of the ERSA test, this response was not analyzed further.
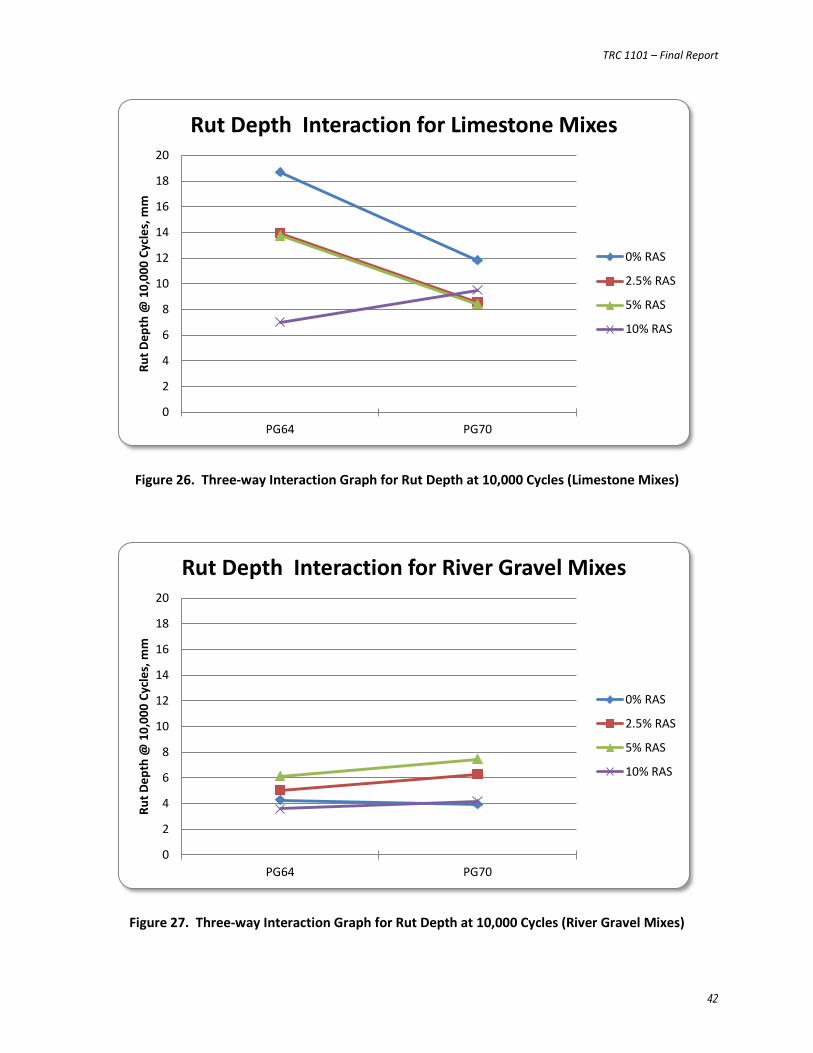
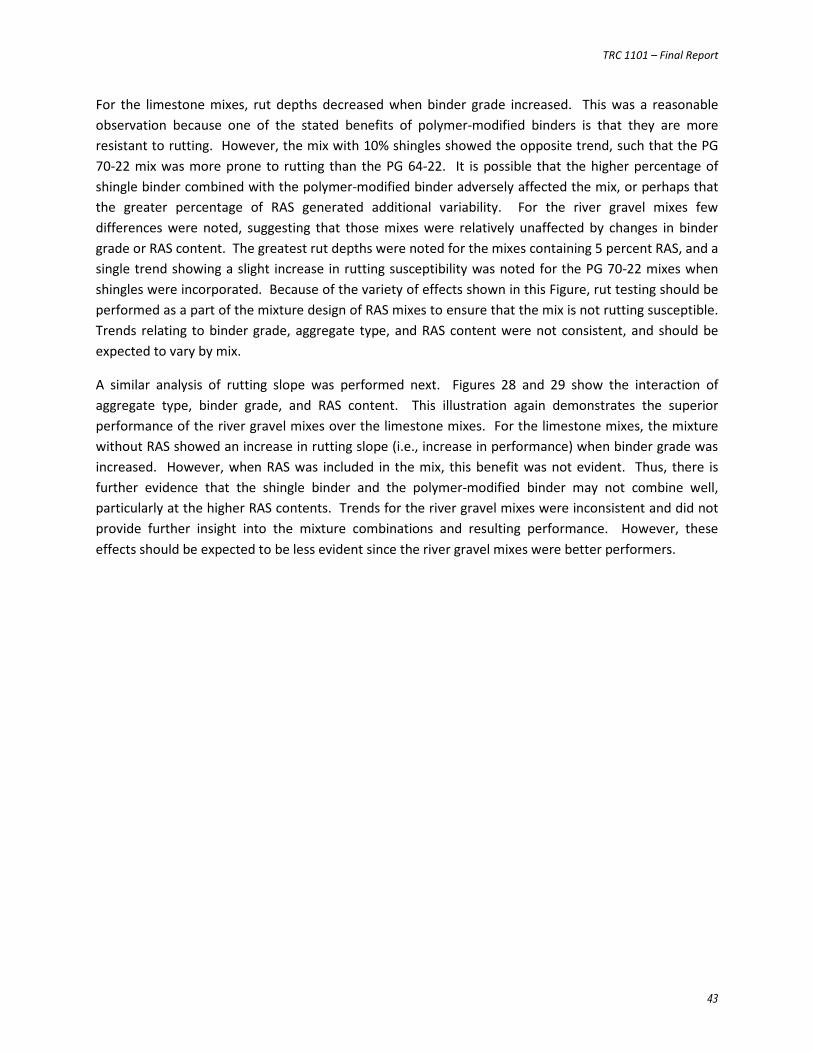
Rut depth at 10,000 cycles provided a measure of sample performance at an intermediate point during the test, and provided a greater level of discrimination for comparison. The three-way interaction of factors is shown in Figures 26 and 27.
TRC 1101 – Final Report
42
Figure 26. Three-way Interaction Graph for Rut Depth at 10,000 Cycles (Limestone Mixes)
Figure 27. Three-way Interaction Graph for Rut Depth at 10,000 Cycles (River Gravel Mixes)
0
2
4
6
8
10
12
14
16
18
20
PG64 PG70
Rut D
epth
@ 1
0,00
0 Cy
cles
, mm
Rut Depth Interaction for Limestone Mixes
0% RAS
2.5% RAS
5% RAS
10% RAS
0
2
4
6
8
10
12
14
16
18
20
PG64 PG70
Rut D
epth
@ 1
0,00
0 Cy
cles
, mm
Rut Depth Interaction for River Gravel Mixes
0% RAS
2.5% RAS
5% RAS
10% RAS
TRC 1101 – Final Report
43
For the limestone mixes, rut depths decreased when binder grade increased. This was a reasonable observation because one of the stated benefits of polymer-modified binders is that they are more resistant to rutting. However, the mix with 10% shingles showed the opposite trend, such that the PG 70-22 mix was more prone to rutting than the PG 64-22. It is possible that the higher percentage of shingle binder combined with the polymer-modified binder adversely affected the mix, or perhaps that the greater percentage of RAS generated additional variability. For the river gravel mixes few differences were noted, suggesting that those mixes were relatively unaffected by changes in binder grade or RAS content. The greatest rut depths were noted for the mixes containing 5 percent RAS, and a single trend showing a slight increase in rutting susceptibility was noted for the PG 70-22 mixes when shingles were incorporated. Because of the variety of effects shown in this Figure, rut testing should be performed as a part of the mixture design of RAS mixes to ensure that the mix is not rutting susceptible. Trends relating to binder grade, aggregate type, and RAS content were not consistent, and should be expected to vary by mix.
A similar analysis of rutting slope was performed next. Figures 28 and 29 show the interaction of aggregate type, binder grade, and RAS content. This illustration again demonstrates the superior performance of the river gravel mixes over the limestone mixes. For the limestone mixes, the mixture without RAS showed an increase in rutting slope (i.e., increase in performance) when binder grade was increased. However, when RAS was included in the mix, this benefit was not evident. Thus, there is further evidence that the shingle binder and the polymer-modified binder may not combine well, particularly at the higher RAS contents. Trends for the river gravel mixes were inconsistent and did not provide further insight into the mixture combinations and resulting performance. However, these effects should be expected to be less evident since the river gravel mixes were better performers.
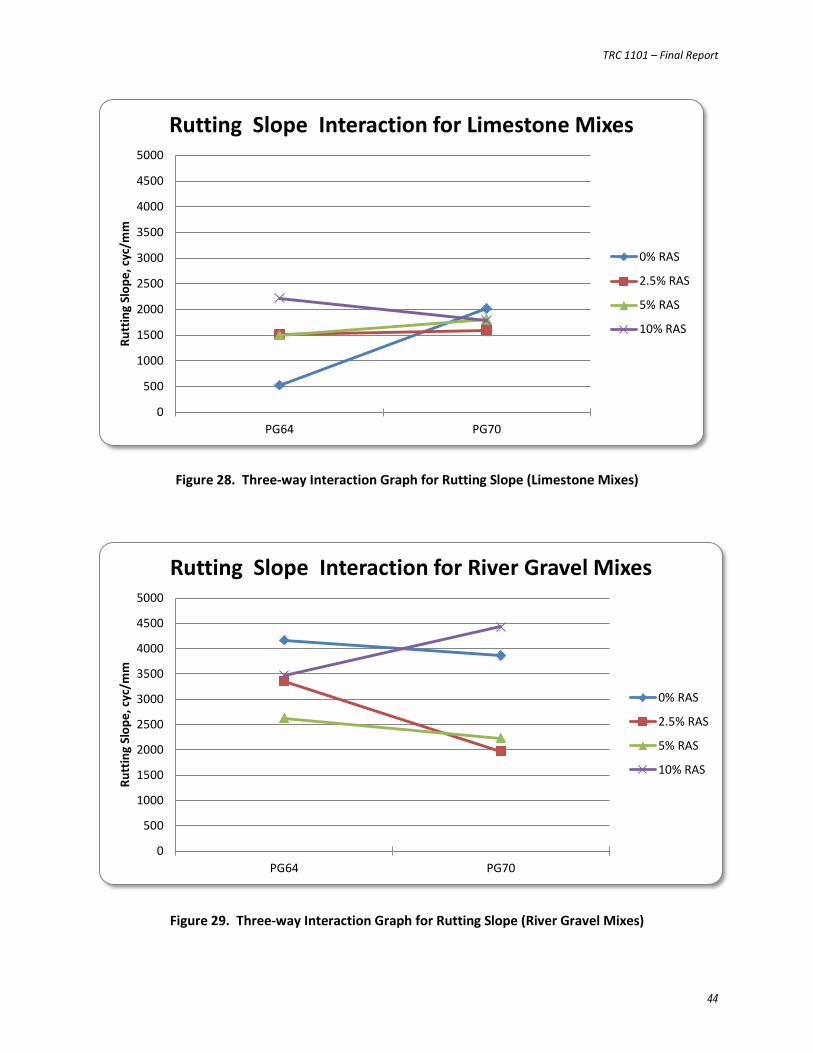
TRC 1101 – Final Report
44
Figure 28. Three-way Interaction Graph for Rutting Slope (Limestone Mixes)
Figure 29. Three-way Interaction Graph for Rutting Slope (River Gravel Mixes)
0
500
1000
1500
2000
2500
3000
3500
4000
4500
5000
PG64 PG70
Rutt
ing
Slop
e, c
yc/m
m
Rutting Slope Interaction for Limestone Mixes
0% RAS
2.5% RAS
5% RAS
10% RAS
0
500
1000
1500
2000
2500
3000
3500
4000
4500
5000
PG64 PG70
Rutt
ing
Slop
e, c
yc/m
m
Rutting Slope Interaction for River Gravel Mixes
0% RAS
2.5% RAS
5% RAS
10% RAS
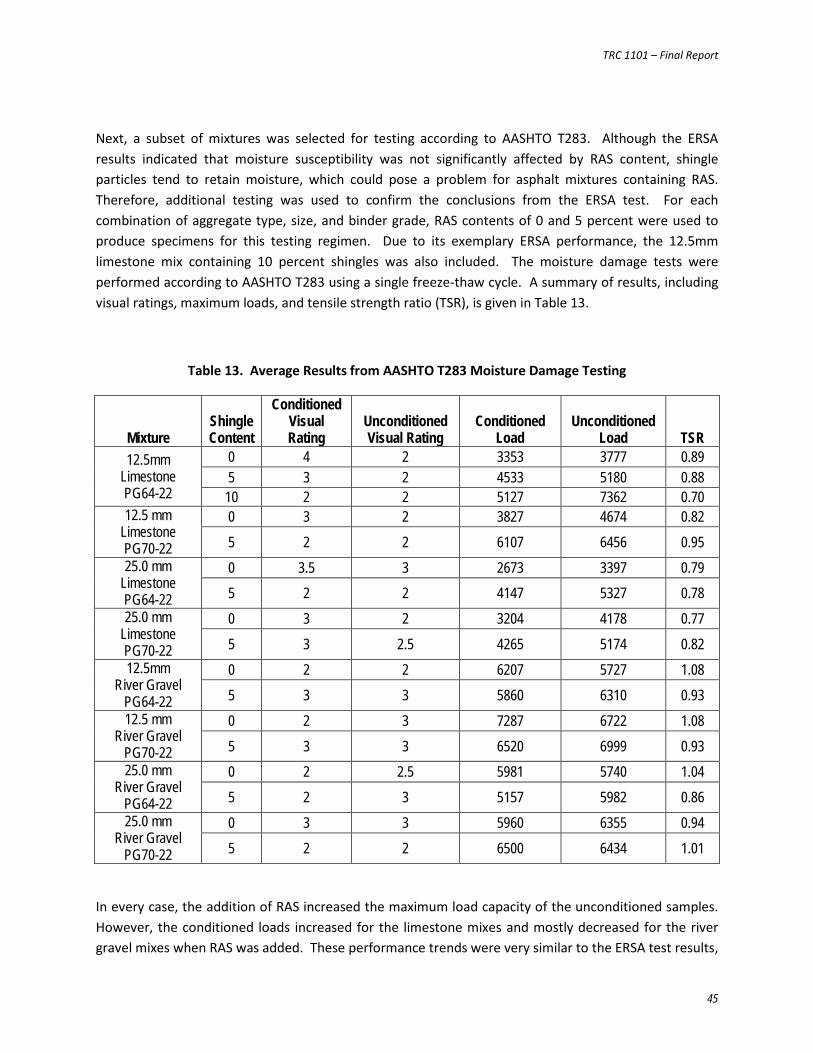
TRC 1101 – Final Report
45
Next, a subset of mixtures was selected for testing according to AASHTO T283. Although the ERSA results indicated that moisture susceptibility was not significantly affected by RAS content, shingle particles tend to retain moisture, which could pose a problem for asphalt mixtures containing RAS. Therefore, additional testing was used to confirm the conclusions from the ERSA test. For each combination of aggregate type, size, and binder grade, RAS contents of 0 and 5 percent were used to produce specimens for this testing regimen. Due to its exemplary ERSA performance, the 12.5mm limestone mix containing 10 percent shingles was also included. The moisture damage tests were performed according to AASHTO T283 using a single freeze-thaw cycle. A summary of results, including visual ratings, maximum loads, and tensile strength ratio (TSR), is given in Table 13.
Table 13. Average Results from AASHTO T283 Moisture Damage Testing
Mixture Shingle Content
Conditioned Visual Rating
Unconditioned Visual Rating
Conditioned Load
Unconditioned Load TSR
12.5mm Limestone PG64-22
0 4 2 3353 3777 0.89 5 3 2 4533 5180 0.88
10 2 2 5127 7362 0.70 12.5 mm
Limestone PG70-22
0 3 2 3827 4674 0.82 5 2 2 6107 6456 0.95
25.0 mm Limestone PG64-22
0 3.5 3 2673 3397 0.79 5 2 2 4147 5327 0.78
25.0 mm Limestone PG70-22
0 3 2 3204 4178 0.77 5 3 2.5 4265 5174 0.82
12.5mm River Gravel
PG64-22
0 2 2 6207 5727 1.08 5 3 3 5860 6310 0.93
12.5 mm River Gravel
PG70-22
0 2 3 7287 6722 1.08 5 3 3 6520 6999 0.93
25.0 mm River Gravel
PG64-22
0 2 2.5 5981 5740 1.04 5 2 3 5157 5982 0.86
25.0 mm River Gravel
PG70-22
0 3 3 5960 6355 0.94 5 2 2 6500 6434 1.01
In every case, the addition of RAS increased the maximum load capacity of the unconditioned samples. However, the conditioned loads increased for the limestone mixes and mostly decreased for the river gravel mixes when RAS was added. These performance trends were very similar to the ERSA test results,
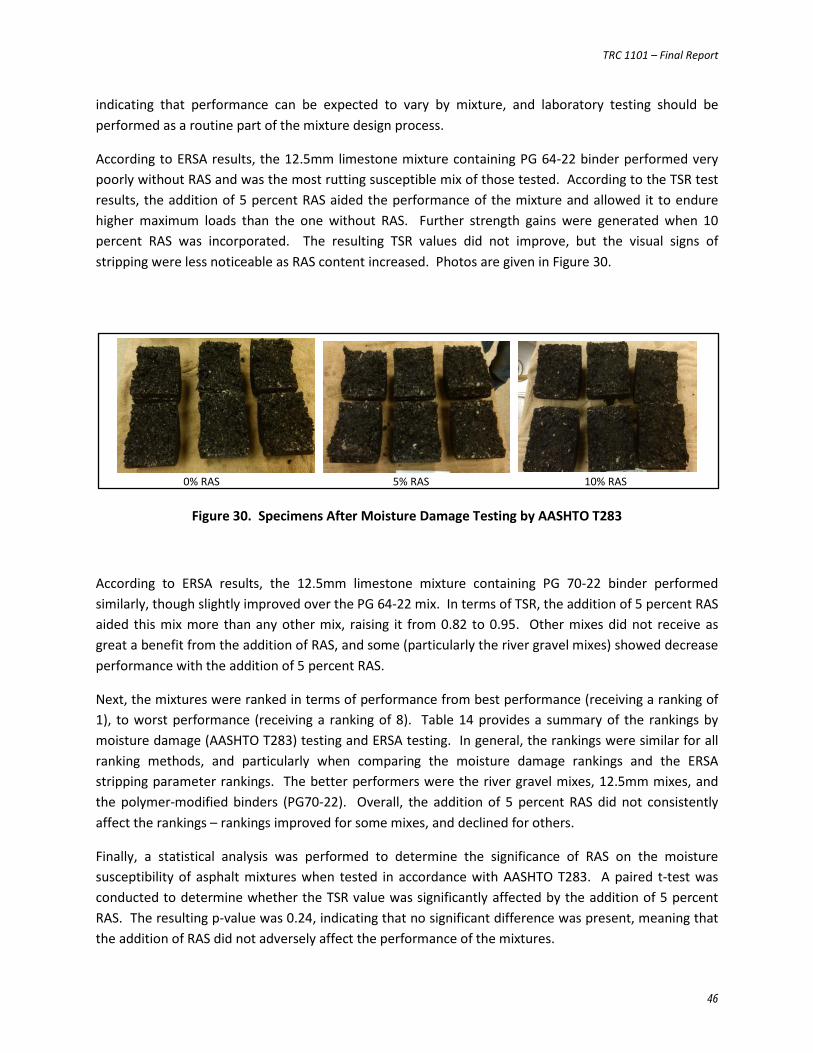
TRC 1101 – Final Report
46
indicating that performance can be expected to vary by mixture, and laboratory testing should be performed as a routine part of the mixture design process.
According to ERSA results, the 12.5mm limestone mixture containing PG 64-22 binder performed very poorly without RAS and was the most rutting susceptible mix of those tested. According to the TSR test results, the addition of 5 percent RAS aided the performance of the mixture and allowed it to endure higher maximum loads than the one without RAS. Further strength gains were generated when 10 percent RAS was incorporated. The resulting TSR values did not improve, but the visual signs of stripping were less noticeable as RAS content increased. Photos are given in Figure 30.
Figure 30. Specimens After Moisture Damage Testing by AASHTO T283
According to ERSA results, the 12.5mm limestone mixture containing PG 70-22 binder performed similarly, though slightly improved over the PG 64-22 mix. In terms of TSR, the addition of 5 percent RAS aided this mix more than any other mix, raising it from 0.82 to 0.95. Other mixes did not receive as great a benefit from the addition of RAS, and some (particularly the river gravel mixes) showed decrease performance with the addition of 5 percent RAS.
Next, the mixtures were ranked in terms of performance from best performance (receiving a ranking of 1), to worst performance (receiving a ranking of 8). Table 14 provides a summary of the rankings by moisture damage (AASHTO T283) testing and ERSA testing. In general, the rankings were similar for all ranking methods, and particularly when comparing the moisture damage rankings and the ERSA stripping parameter rankings. The better performers were the river gravel mixes, 12.5mm mixes, and the polymer-modified binders (PG70-22). Overall, the addition of 5 percent RAS did not consistently affect the rankings – rankings improved for some mixes, and declined for others.
Finally, a statistical analysis was performed to determine the significance of RAS on the moisture susceptibility of asphalt mixtures when tested in accordance with AASHTO T283. A paired t-test was conducted to determine whether the TSR value was significantly affected by the addition of 5 percent RAS. The resulting p-value was 0.24, indicating that no significant difference was present, meaning that the addition of RAS did not adversely affect the performance of the mixtures.
0% RAS 5% RAS 10% RAS
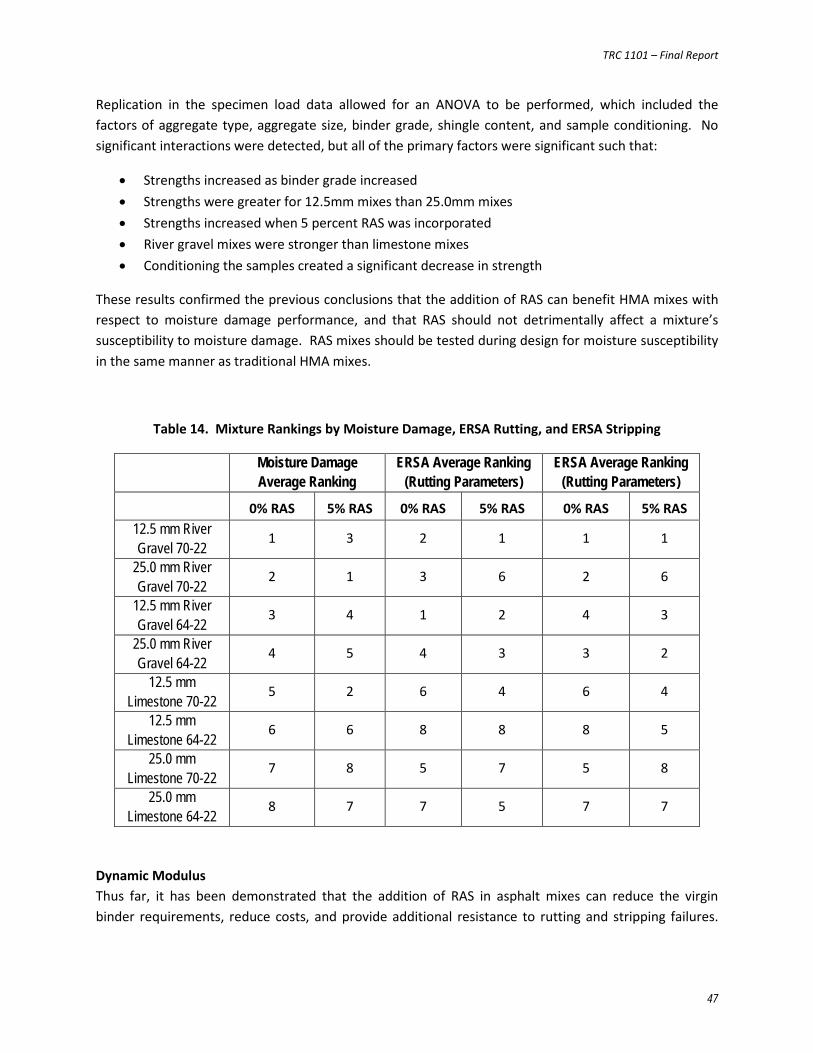
TRC 1101 – Final Report
47
Replication in the specimen load data allowed for an ANOVA to be performed, which included the factors of aggregate type, aggregate size, binder grade, shingle content, and sample conditioning. No significant interactions were detected, but all of the primary factors were significant such that:
• Strengths increased as binder grade increased • Strengths were greater for 12.5mm mixes than 25.0mm mixes • Strengths increased when 5 percent RAS was incorporated • River gravel mixes were stronger than limestone mixes • Conditioning the samples created a significant decrease in strength
These results confirmed the previous conclusions that the addition of RAS can benefit HMA mixes with respect to moisture damage performance, and that RAS should not detrimentally affect a mixture’s susceptibility to moisture damage. RAS mixes should be tested during design for moisture susceptibility in the same manner as traditional HMA mixes.
Table 14. Mixture Rankings by Moisture Damage, ERSA Rutting, and ERSA Stripping
Moisture Damage Average Ranking
ERSA Average Ranking (Rutting Parameters)
ERSA Average Ranking (Rutting Parameters)
0% RAS 5% RAS 0% RAS 5% RAS 0% RAS 5% RAS 12.5 mm River Gravel 70-22
1 3 2 1 1 1
25.0 mm River Gravel 70-22
2 1 3 6 2 6
12.5 mm River Gravel 64-22
3 4 1 2 4 3
25.0 mm River Gravel 64-22
4 5 4 3 3 2
12.5 mm Limestone 70-22
5 2 6 4 6 4
12.5 mm Limestone 64-22
6 6 8 8 8 5
25.0 mm Limestone 70-22
7 8 5 7 5 8
25.0 mm Limestone 64-22
8 7 7 5 7 7
Dynamic Modulus Thus far, it has been demonstrated that the addition of RAS in asphalt mixes can reduce the virgin binder requirements, reduce costs, and provide additional resistance to rutting and stripping failures.
TRC 1101 – Final Report
48
But when rutting susceptibility decreases, the potential for cracking failures often increases. Therefore, dynamic modulus testing was performed to assess this risk.
Dynamic modulus testing was performed according to AASHTO TP62 for the 12.5mm control mixtures (i.e., those containing no RAS) and the 5 percent RAS mixtures. The 12.5mm limestone mixture containing 10 percent RAS was also included due to its large increase in rutting performance when the greatest RAS percentage was added. This portion of the study was limited 12.5mm mixtures because they tended to exhibit the greatest level of stiffness in the rutting analysis, and because cracking in surface layers presents a more immediate maintenance issue than cracking in the underlying layers. Also, the most likely uses for RAS mixtures were expected to include overlays and surface courses rather than full-depth pavement sections.
The dynamic modulus value is a measure of stiffness at a range of temperatures and loading rates, and can be used to evaluate both the rutting and cracking potential of an asphalt mixture. At high temperatures, the asphalt binder is less viscous and may rut more easily. At low temperatures, mixtures can become excessively stiff and prone to cracking failures. If a mix is stiffer at high temperatures, it is less likely to experience rutting failures, but may be more likely to crack. This relationship is specific to each mixture, and is characterized by master curves.
The dynamic modulus test was performed using a continuous sinusoidal compressive stress with a MTS testing machine and an apparatus holding 4 LVDTs to measure the strain which lagged behind the stress. The lag time between peak stress and strain was measured as the phase angle. The apparatus is shown in Figure 31. The test was performed on three samples of each mixture at three different temperatures using six loading frequencies. According to AASHTO TP62, five temperatures should be used; however, it has been shown that the highest and lowest temperatures exhibit excessive variability (Bennert and Williams 2009). Thus, the upper and lower temperatures were omitted from this testing regimen. The DYNMOD program, which was developed at the University of Arkansas, was used to calculate dynamic modulus (E*) and phase angle (ϕ) for each combination of temperature and frequency (Nam 2005).
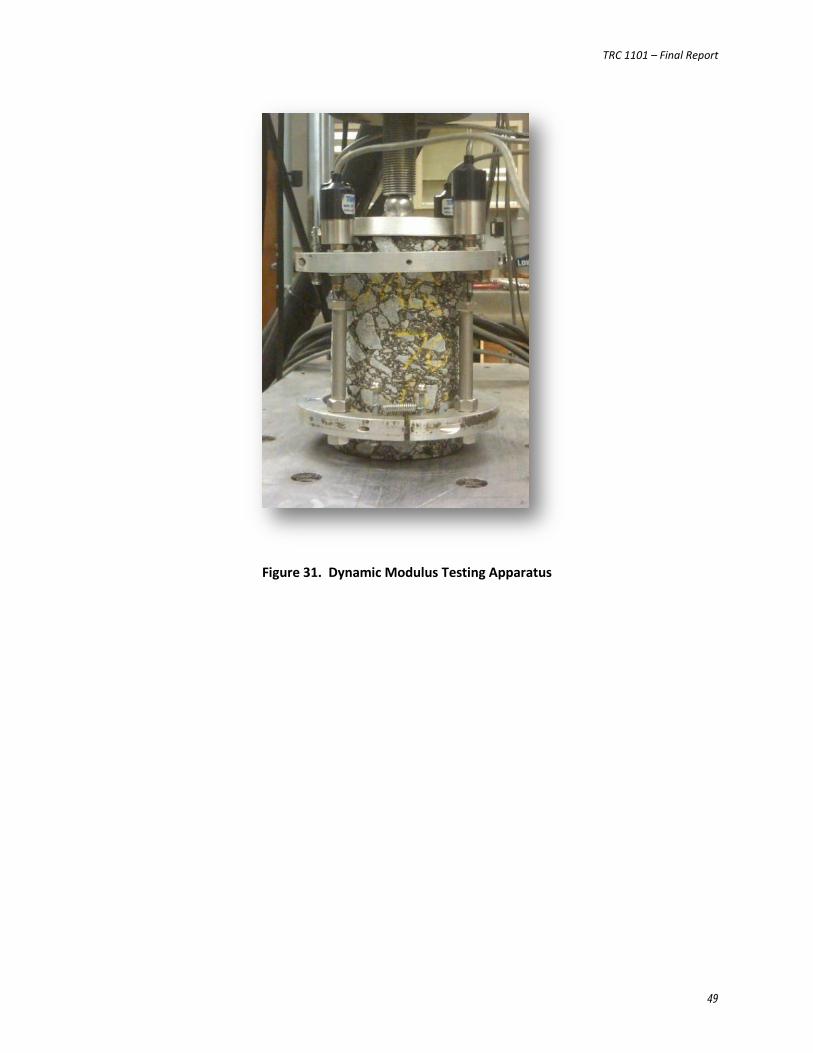
TRC 1101 – Final Report
49
Figure 31. Dynamic Modulus Testing Apparatus
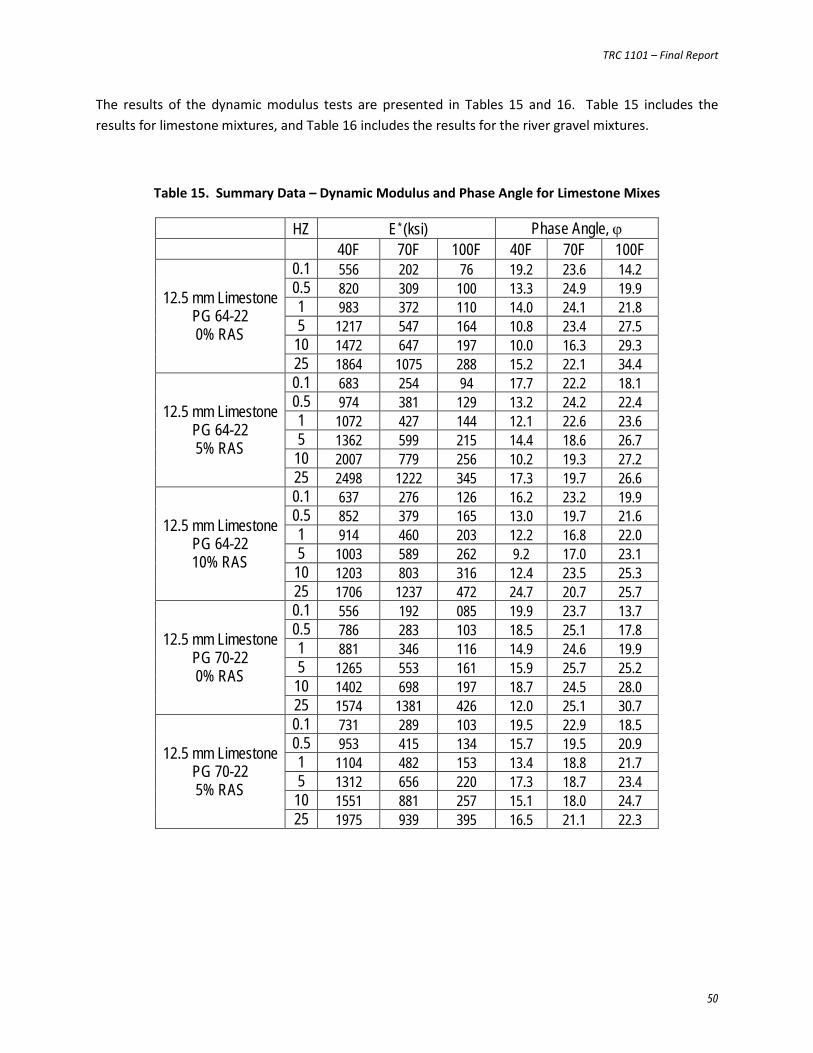
TRC 1101 – Final Report
50
The results of the dynamic modulus tests are presented in Tables 15 and 16. Table 15 includes the results for limestone mixtures, and Table 16 includes the results for the river gravel mixtures.
Table 15. Summary Data – Dynamic Modulus and Phase Angle for Limestone Mixes
HZ E* (ksi) Phase Angle, ϕ
40F 70F 100F 40F 70F 100F
12.5 mm Limestone PG 64-22 0% RAS
0.1 556 202 76 19.2 23.6 14.2 0.5 820 309 100 13.3 24.9 19.9 1 983 372 110 14.0 24.1 21.8 5 1217 547 164 10.8 23.4 27.5
10 1472 647 197 10.0 16.3 29.3 25 1864 1075 288 15.2 22.1 34.4
12.5 mm Limestone PG 64-22 5% RAS
0.1 683 254 94 17.7 22.2 18.1 0.5 974 381 129 13.2 24.2 22.4 1 1072 427 144 12.1 22.6 23.6 5 1362 599 215 14.4 18.6 26.7
10 2007 779 256 10.2 19.3 27.2 25 2498 1222 345 17.3 19.7 26.6
12.5 mm Limestone PG 64-22 10% RAS
0.1 637 276 126 16.2 23.2 19.9 0.5 852 379 165 13.0 19.7 21.6 1 914 460 203 12.2 16.8 22.0 5 1003 589 262 9.2 17.0 23.1
10 1203 803 316 12.4 23.5 25.3 25 1706 1237 472 24.7 20.7 25.7
12.5 mm Limestone PG 70-22 0% RAS
0.1 556 192 085 19.9 23.7 13.7 0.5 786 283 103 18.5 25.1 17.8 1 881 346 116 14.9 24.6 19.9 5 1265 553 161 15.9 25.7 25.2
10 1402 698 197 18.7 24.5 28.0 25 1574 1381 426 12.0 25.1 30.7
12.5 mm Limestone PG 70-22 5% RAS
0.1 731 289 103 19.5 22.9 18.5 0.5 953 415 134 15.7 19.5 20.9 1 1104 482 153 13.4 18.8 21.7 5 1312 656 220 17.3 18.7 23.4
10 1551 881 257 15.1 18.0 24.7 25 1975 939 395 16.5 21.1 22.3
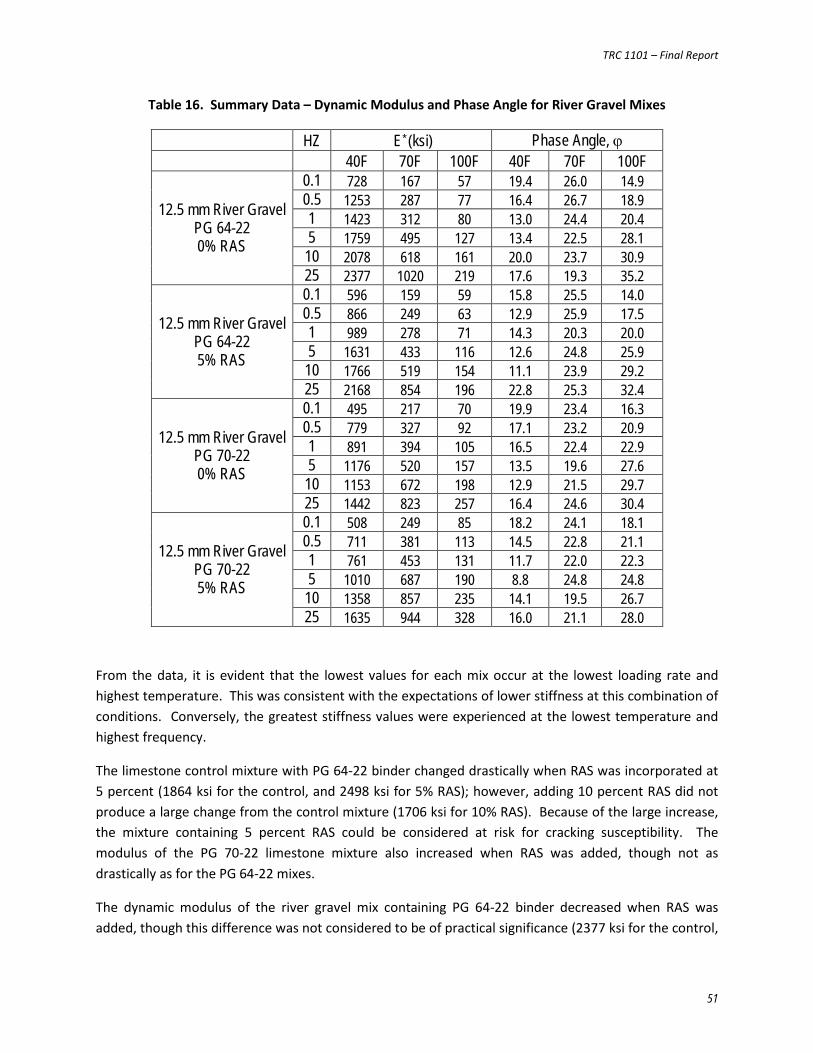
TRC 1101 – Final Report
51
Table 16. Summary Data – Dynamic Modulus and Phase Angle for River Gravel Mixes
HZ E* (ksi) Phase Angle, ϕ
40F 70F 100F 40F 70F 100F
12.5 mm River Gravel PG 64-22 0% RAS
0.1 728 167 57 19.4 26.0 14.9 0.5 1253 287 77 16.4 26.7 18.9 1 1423 312 80 13.0 24.4 20.4 5 1759 495 127 13.4 22.5 28.1
10 2078 618 161 20.0 23.7 30.9 25 2377 1020 219 17.6 19.3 35.2
12.5 mm River Gravel PG 64-22 5% RAS
0.1 596 159 59 15.8 25.5 14.0 0.5 866 249 63 12.9 25.9 17.5 1 989 278 71 14.3 20.3 20.0 5 1631 433 116 12.6 24.8 25.9
10 1766 519 154 11.1 23.9 29.2 25 2168 854 196 22.8 25.3 32.4
12.5 mm River Gravel PG 70-22 0% RAS
0.1 495 217 70 19.9 23.4 16.3 0.5 779 327 92 17.1 23.2 20.9 1 891 394 105 16.5 22.4 22.9 5 1176 520 157 13.5 19.6 27.6
10 1153 672 198 12.9 21.5 29.7 25 1442 823 257 16.4 24.6 30.4
12.5 mm River Gravel PG 70-22 5% RAS
0.1 508 249 85 18.2 24.1 18.1 0.5 711 381 113 14.5 22.8 21.1 1 761 453 131 11.7 22.0 22.3 5 1010 687 190 8.8 24.8 24.8
10 1358 857 235 14.1 19.5 26.7 25 1635 944 328 16.0 21.1 28.0
From the data, it is evident that the lowest values for each mix occur at the lowest loading rate and highest temperature. This was consistent with the expectations of lower stiffness at this combination of conditions. Conversely, the greatest stiffness values were experienced at the lowest temperature and highest frequency.
The limestone control mixture with PG 64-22 binder changed drastically when RAS was incorporated at 5 percent (1864 ksi for the control, and 2498 ksi for 5% RAS); however, adding 10 percent RAS did not produce a large change from the control mixture (1706 ksi for 10% RAS). Because of the large increase, the mixture containing 5 percent RAS could be considered at risk for cracking susceptibility. The modulus of the PG 70-22 limestone mixture also increased when RAS was added, though not as drastically as for the PG 64-22 mixes.
The dynamic modulus of the river gravel mix containing PG 64-22 binder decreased when RAS was added, though this difference was not considered to be of practical significance (2377 ksi for the control,
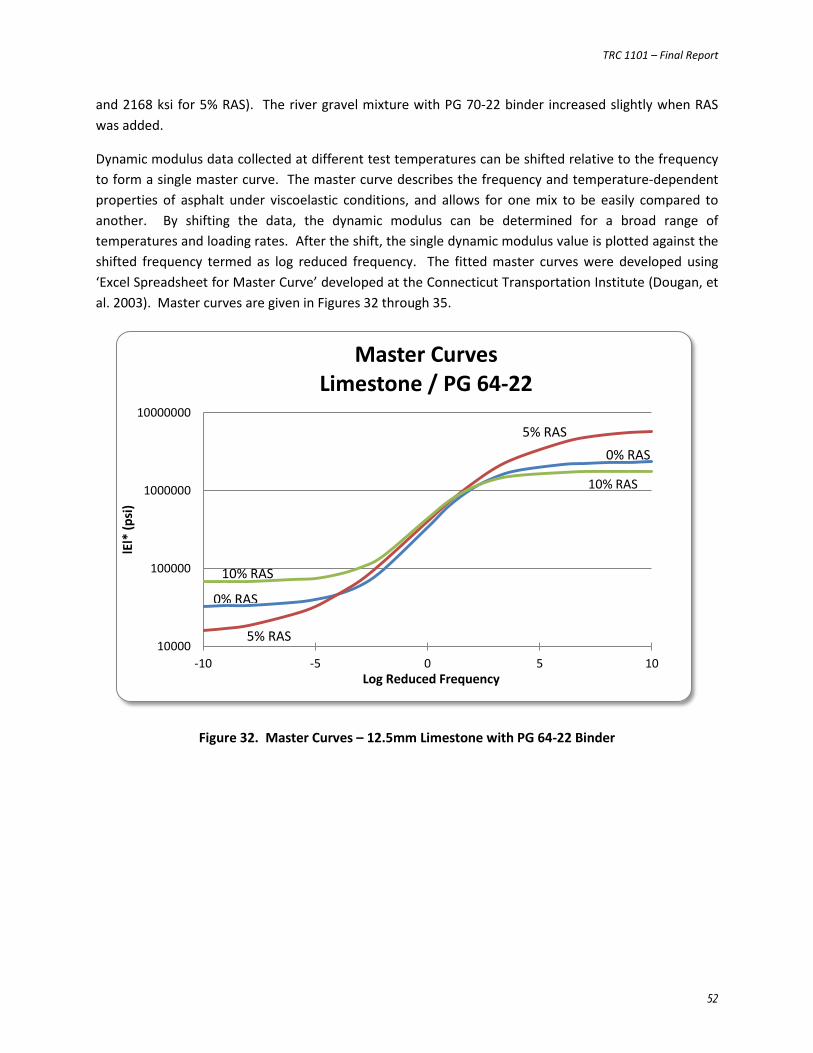
TRC 1101 – Final Report
52
and 2168 ksi for 5% RAS). The river gravel mixture with PG 70-22 binder increased slightly when RAS was added.
Dynamic modulus data collected at different test temperatures can be shifted relative to the frequency to form a single master curve. The master curve describes the frequency and temperature-dependent properties of asphalt under viscoelastic conditions, and allows for one mix to be easily compared to another. By shifting the data, the dynamic modulus can be determined for a broad range of temperatures and loading rates. After the shift, the single dynamic modulus value is plotted against the shifted frequency termed as log reduced frequency. The fitted master curves were developed using ‘Excel Spreadsheet for Master Curve’ developed at the Connecticut Transportation Institute (Dougan, et al. 2003). Master curves are given in Figures 32 through 35.
Figure 32. Master Curves – 12.5mm Limestone with PG 64-22 Binder
10000
100000
1000000
10000000
-10 -5 0 5 10
lEl*
(psi
)
Log Reduced Frequency
Master Curves Limestone / PG 64-22
0% RAS
0% RAS
5% RAS
5% RAS
10% RAS
10% RAS
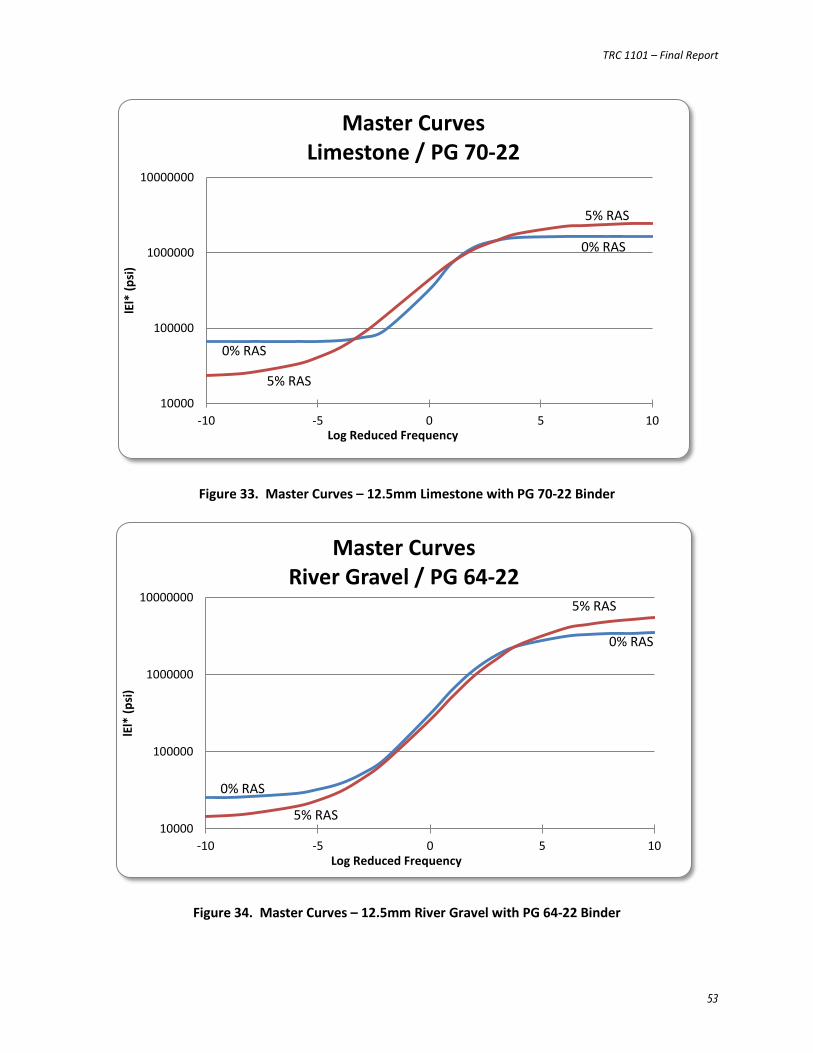
TRC 1101 – Final Report
53
Figure 33. Master Curves – 12.5mm Limestone with PG 70-22 Binder
Figure 34. Master Curves – 12.5mm River Gravel with PG 64-22 Binder
10000
100000
1000000
10000000
-10 -5 0 5 10
lEl*
(psi
)
Log Reduced Frequency
Master Curves Limestone / PG 70-22
5% RAS
5% RAS
0% RAS
0% RAS
10000
100000
1000000
10000000
-10 -5 0 5 10
lEl*
(psi
)
Log Reduced Frequency
Master Curves River Gravel / PG 64-22
0% RAS
0% RAS
5% RAS
5% RAS
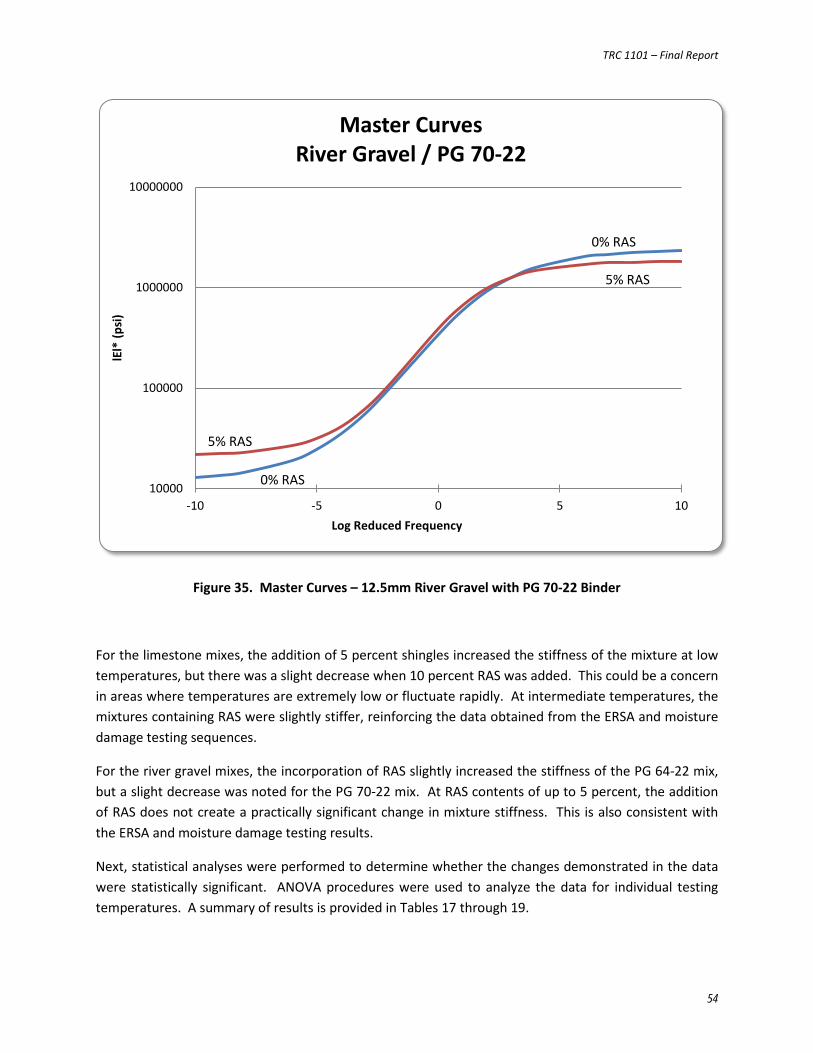
TRC 1101 – Final Report
54
Figure 35. Master Curves – 12.5mm River Gravel with PG 70-22 Binder
For the limestone mixes, the addition of 5 percent shingles increased the stiffness of the mixture at low temperatures, but there was a slight decrease when 10 percent RAS was added. This could be a concern in areas where temperatures are extremely low or fluctuate rapidly. At intermediate temperatures, the mixtures containing RAS were slightly stiffer, reinforcing the data obtained from the ERSA and moisture damage testing sequences.
For the river gravel mixes, the incorporation of RAS slightly increased the stiffness of the PG 64-22 mix, but a slight decrease was noted for the PG 70-22 mix. At RAS contents of up to 5 percent, the addition of RAS does not create a practically significant change in mixture stiffness. This is also consistent with the ERSA and moisture damage testing results.
Next, statistical analyses were performed to determine whether the changes demonstrated in the data were statistically significant. ANOVA procedures were used to analyze the data for individual testing temperatures. A summary of results is provided in Tables 17 through 19.
10000
100000
1000000
10000000
-10 -5 0 5 10
lEl*
(psi
)
Log Reduced Frequency
Master Curves River Gravel / PG 70-22
5% RAS
5% RAS
0% RAS
0% RAS
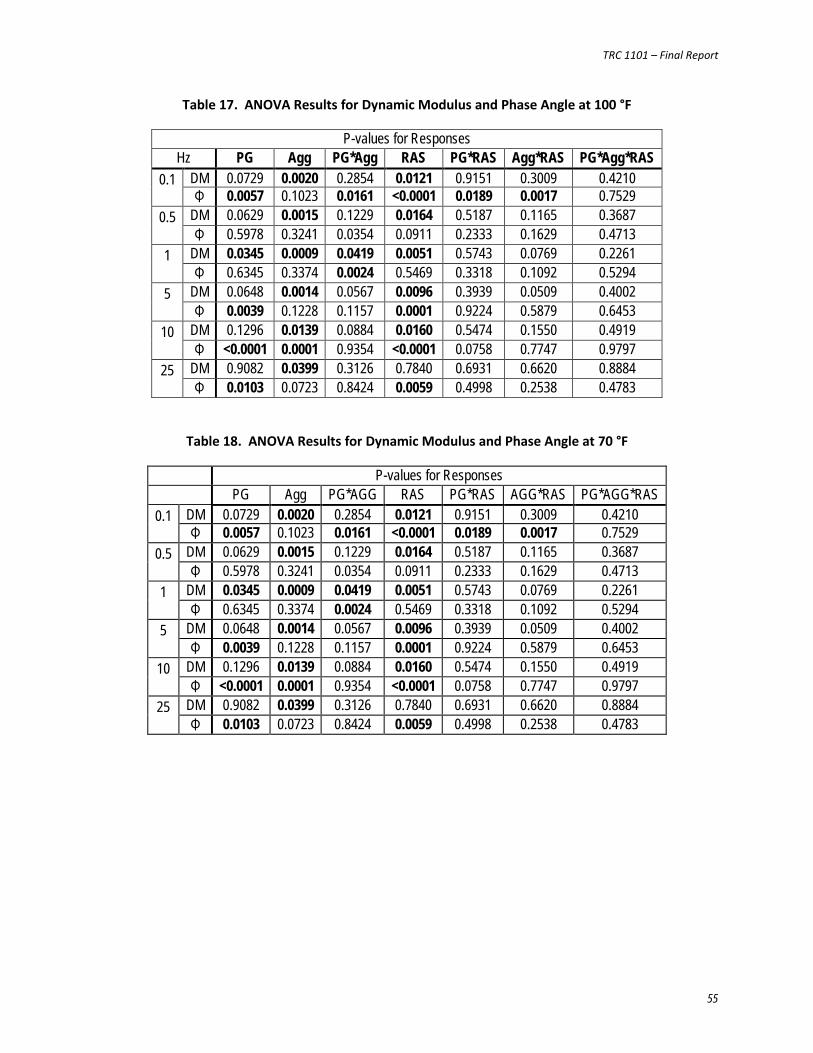
TRC 1101 – Final Report
55
Table 17. ANOVA Results for Dynamic Modulus and Phase Angle at 100 °F
P-values for Responses Hz PG Agg PG*Agg RAS PG*RAS Agg*RAS PG*Agg*RAS
0.1 DM 0.0729 0.0020 0.2854 0.0121 0.9151 0.3009 0.4210 Φ 0.0057 0.1023 0.0161 <0.0001 0.0189 0.0017 0.7529
0.5 DM 0.0629 0.0015 0.1229 0.0164 0.5187 0.1165 0.3687 Φ 0.5978 0.3241 0.0354 0.0911 0.2333 0.1629 0.4713
1 DM 0.0345 0.0009 0.0419 0.0051 0.5743 0.0769 0.2261 Φ 0.6345 0.3374 0.0024 0.5469 0.3318 0.1092 0.5294
5 DM 0.0648 0.0014 0.0567 0.0096 0.3939 0.0509 0.4002 Φ 0.0039 0.1228 0.1157 0.0001 0.9224 0.5879 0.6453
10 DM 0.1296 0.0139 0.0884 0.0160 0.5474 0.1550 0.4919 Φ <0.0001 0.0001 0.9354 <0.0001 0.0758 0.7747 0.9797
25 DM 0.9082 0.0399 0.3126 0.7840 0.6931 0.6620 0.8884 Φ 0.0103 0.0723 0.8424 0.0059 0.4998 0.2538 0.4783
Table 18. ANOVA Results for Dynamic Modulus and Phase Angle at 70 °F
P-values for Responses
PG Agg PG*AGG RAS PG*RAS AGG*RAS PG*AGG*RAS
0.1 DM 0.0729 0.0020 0.2854 0.0121 0.9151 0.3009 0.4210 Φ 0.0057 0.1023 0.0161 <0.0001 0.0189 0.0017 0.7529
0.5 DM 0.0629 0.0015 0.1229 0.0164 0.5187 0.1165 0.3687 Φ 0.5978 0.3241 0.0354 0.0911 0.2333 0.1629 0.4713
1 DM 0.0345 0.0009 0.0419 0.0051 0.5743 0.0769 0.2261 Φ 0.6345 0.3374 0.0024 0.5469 0.3318 0.1092 0.5294
5 DM 0.0648 0.0014 0.0567 0.0096 0.3939 0.0509 0.4002 Φ 0.0039 0.1228 0.1157 0.0001 0.9224 0.5879 0.6453
10 DM 0.1296 0.0139 0.0884 0.0160 0.5474 0.1550 0.4919 Φ <0.0001 0.0001 0.9354 <0.0001 0.0758 0.7747 0.9797
25 DM 0.9082 0.0399 0.3126 0.7840 0.6931 0.6620 0.8884 Φ 0.0103 0.0723 0.8424 0.0059 0.4998 0.2538 0.4783
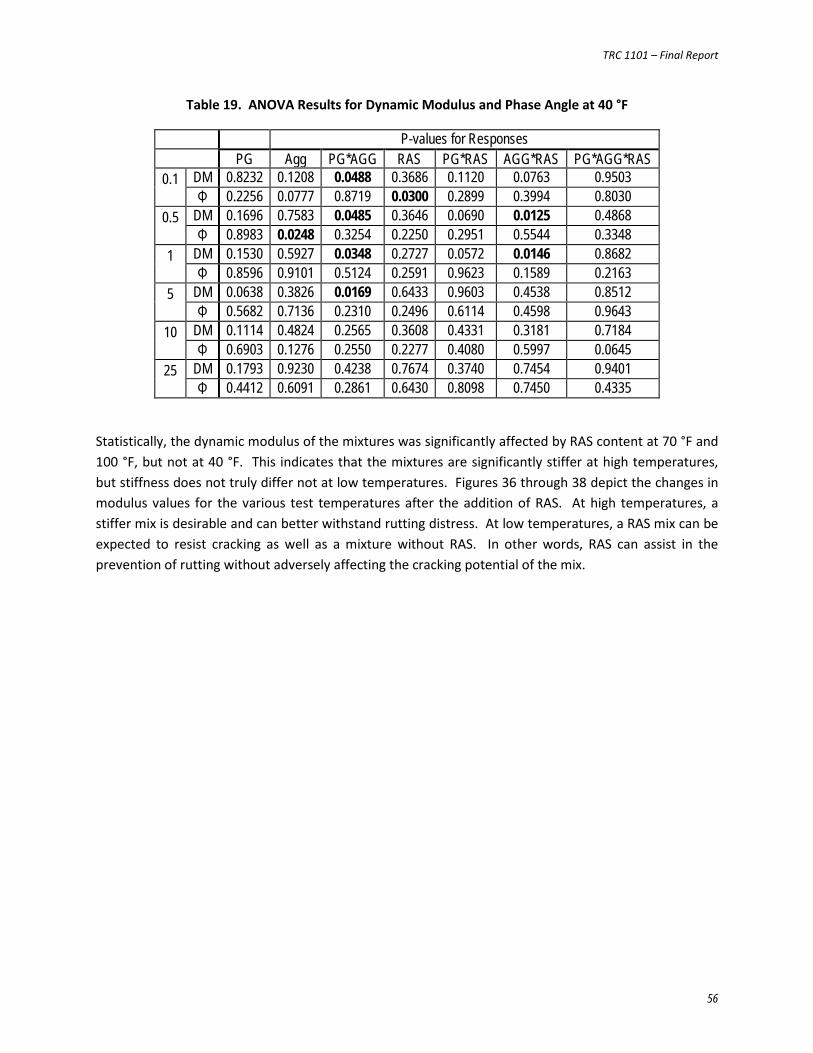
TRC 1101 – Final Report
56
Table 19. ANOVA Results for Dynamic Modulus and Phase Angle at 40 °F
P-values for Responses
PG Agg PG*AGG RAS PG*RAS AGG*RAS PG*AGG*RAS
0.1 DM 0.8232 0.1208 0.0488 0.3686 0.1120 0.0763 0.9503 Φ 0.2256 0.0777 0.8719 0.0300 0.2899 0.3994 0.8030
0.5 DM 0.1696 0.7583 0.0485 0.3646 0.0690 0.0125 0.4868 Φ 0.8983 0.0248 0.3254 0.2250 0.2951 0.5544 0.3348
1 DM 0.1530 0.5927 0.0348 0.2727 0.0572 0.0146 0.8682 Φ 0.8596 0.9101 0.5124 0.2591 0.9623 0.1589 0.2163
5 DM 0.0638 0.3826 0.0169 0.6433 0.9603 0.4538 0.8512 Φ 0.5682 0.7136 0.2310 0.2496 0.6114 0.4598 0.9643
10 DM 0.1114 0.4824 0.2565 0.3608 0.4331 0.3181 0.7184 Φ 0.6903 0.1276 0.2550 0.2277 0.4080 0.5997 0.0645
25 DM 0.1793 0.9230 0.4238 0.7674 0.3740 0.7454 0.9401 Φ 0.4412 0.6091 0.2861 0.6430 0.8098 0.7450 0.4335
Statistically, the dynamic modulus of the mixtures was significantly affected by RAS content at 70 °F and 100 °F, but not at 40 °F. This indicates that the mixtures are significantly stiffer at high temperatures, but stiffness does not truly differ not at low temperatures. Figures 36 through 38 depict the changes in modulus values for the various test temperatures after the addition of RAS. At high temperatures, a stiffer mix is desirable and can better withstand rutting distress. At low temperatures, a RAS mix can be expected to resist cracking as well as a mixture without RAS. In other words, RAS can assist in the prevention of rutting without adversely affecting the cracking potential of the mix.
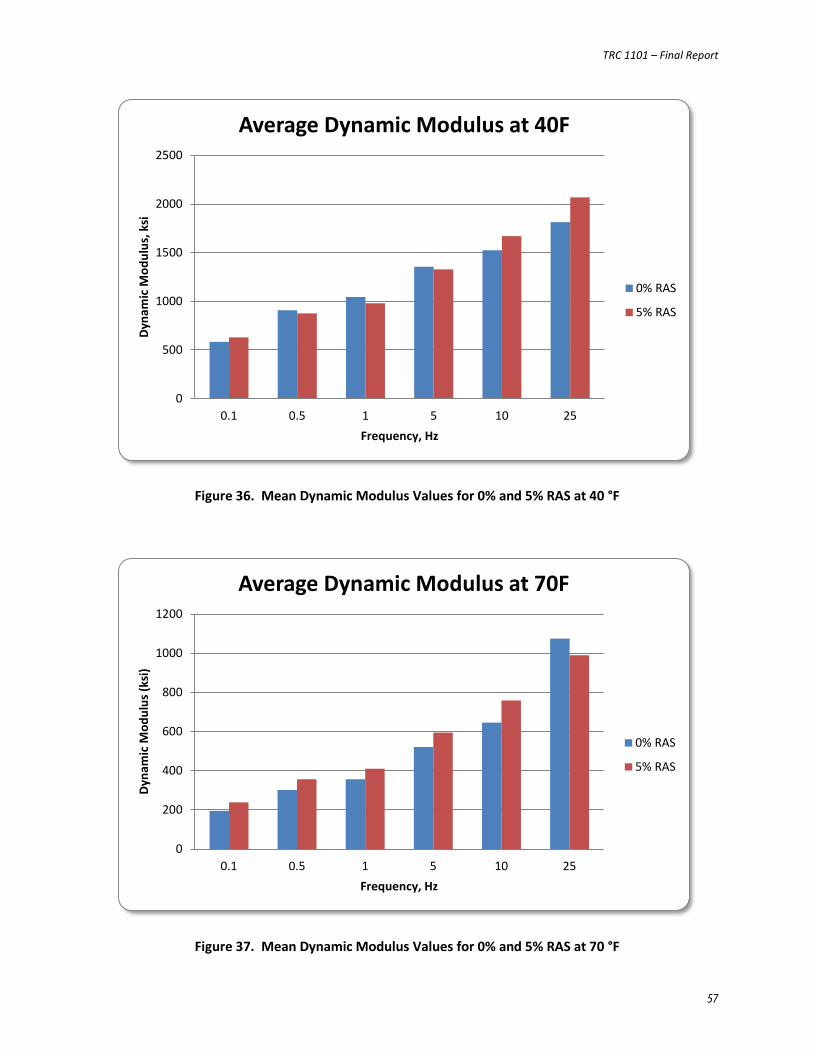
TRC 1101 – Final Report
57
Figure 36. Mean Dynamic Modulus Values for 0% and 5% RAS at 40 °F
Figure 37. Mean Dynamic Modulus Values for 0% and 5% RAS at 70 °F
0
500
1000
1500
2000
2500
0.1 0.5 1 5 10 25
Dyna
mic
Mod
ulus
, ksi
Frequency, Hz
Average Dynamic Modulus at 40F
0% RAS
5% RAS
0
200
400
600
800
1000
1200
0.1 0.5 1 5 10 25
Dyna
mic
Mod
ulus
(ksi
)
Frequency, Hz
Average Dynamic Modulus at 70F
0% RAS
5% RAS
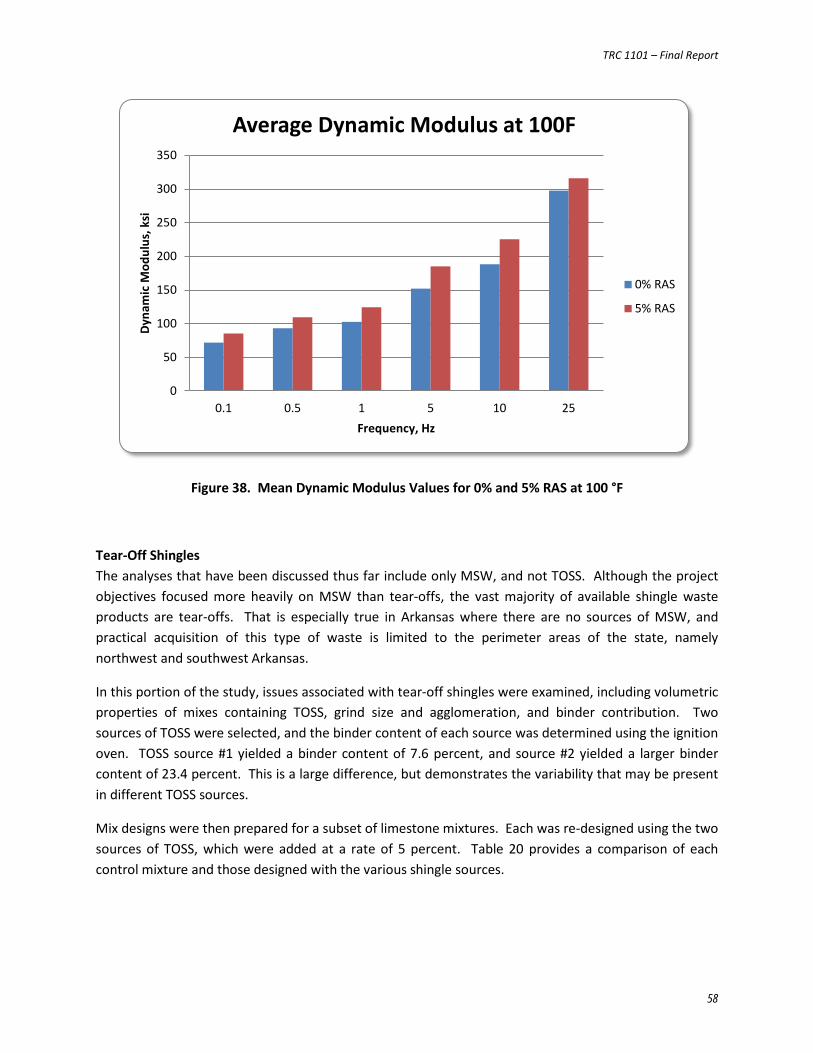
TRC 1101 – Final Report
58
Figure 38. Mean Dynamic Modulus Values for 0% and 5% RAS at 100 °F
Tear-Off Shingles The analyses that have been discussed thus far include only MSW, and not TOSS. Although the project objectives focused more heavily on MSW than tear-offs, the vast majority of available shingle waste products are tear-offs. That is especially true in Arkansas where there are no sources of MSW, and practical acquisition of this type of waste is limited to the perimeter areas of the state, namely northwest and southwest Arkansas.
In this portion of the study, issues associated with tear-off shingles were examined, including volumetric properties of mixes containing TOSS, grind size and agglomeration, and binder contribution. Two sources of TOSS were selected, and the binder content of each source was determined using the ignition oven. TOSS source #1 yielded a binder content of 7.6 percent, and source #2 yielded a larger binder content of 23.4 percent. This is a large difference, but demonstrates the variability that may be present in different TOSS sources.
Mix designs were then prepared for a subset of limestone mixtures. Each was re-designed using the two sources of TOSS, which were added at a rate of 5 percent. Table 20 provides a comparison of each control mixture and those designed with the various shingle sources.
0
50
100
150
200
250
300
350
0.1 0.5 1 5 10 25
Dyna
mic
Mod
ulus
, ksi
Frequency, Hz
Average Dynamic Modulus at 100F
0% RAS
5% RAS
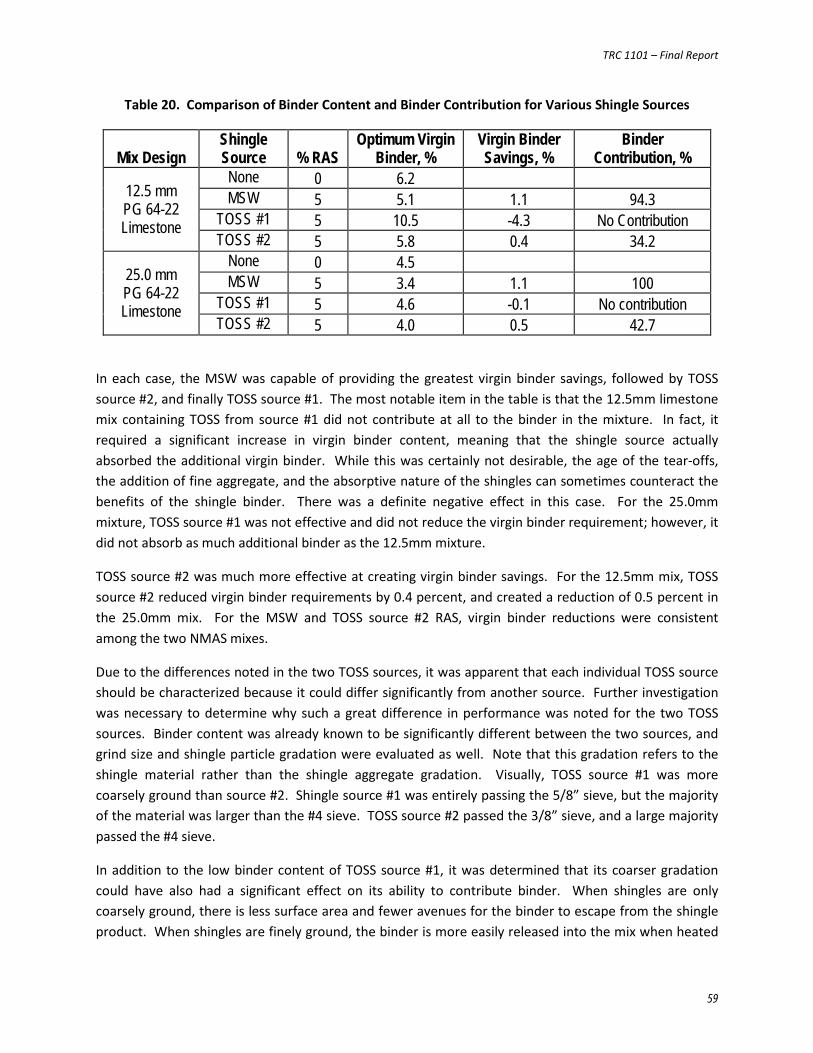
TRC 1101 – Final Report
59
Table 20. Comparison of Binder Content and Binder Contribution for Various Shingle Sources
Mix Design Shingle Source % RAS
Optimum Virgin Binder, %
Virgin Binder Savings, %
Binder Contribution, %
12.5 mm PG 64-22 Limestone
None 0 6.2 MSW 5 5.1 1.1 94.3
TOSS #1 5 10.5 -4.3 No Contribution TOSS #2 5 5.8 0.4 34.2
25.0 mm PG 64-22 Limestone
None 0 4.5 MSW 5 3.4 1.1 100
TOSS #1 5 4.6 -0.1 No contribution TOSS #2 5 4.0 0.5 42.7
In each case, the MSW was capable of providing the greatest virgin binder savings, followed by TOSS source #2, and finally TOSS source #1. The most notable item in the table is that the 12.5mm limestone mix containing TOSS from source #1 did not contribute at all to the binder in the mixture. In fact, it required a significant increase in virgin binder content, meaning that the shingle source actually absorbed the additional virgin binder. While this was certainly not desirable, the age of the tear-offs, the addition of fine aggregate, and the absorptive nature of the shingles can sometimes counteract the benefits of the shingle binder. There was a definite negative effect in this case. For the 25.0mm mixture, TOSS source #1 was not effective and did not reduce the virgin binder requirement; however, it did not absorb as much additional binder as the 12.5mm mixture.
TOSS source #2 was much more effective at creating virgin binder savings. For the 12.5mm mix, TOSS source #2 reduced virgin binder requirements by 0.4 percent, and created a reduction of 0.5 percent in the 25.0mm mix. For the MSW and TOSS source #2 RAS, virgin binder reductions were consistent among the two NMAS mixes.
Due to the differences noted in the two TOSS sources, it was apparent that each individual TOSS source should be characterized because it could differ significantly from another source. Further investigation was necessary to determine why such a great difference in performance was noted for the two TOSS sources. Binder content was already known to be significantly different between the two sources, and grind size and shingle particle gradation were evaluated as well. Note that this gradation refers to the shingle material rather than the shingle aggregate gradation. Visually, TOSS source #1 was more coarsely ground than source #2. Shingle source #1 was entirely passing the 5/8” sieve, but the majority of the material was larger than the #4 sieve. TOSS source #2 passed the 3/8” sieve, and a large majority passed the #4 sieve.
In addition to the low binder content of TOSS source #1, it was determined that its coarser gradation could have also had a significant effect on its ability to contribute binder. When shingles are only coarsely ground, there is less surface area and fewer avenues for the binder to escape from the shingle product. When shingles are finely ground, the binder is more easily released into the mix when heated
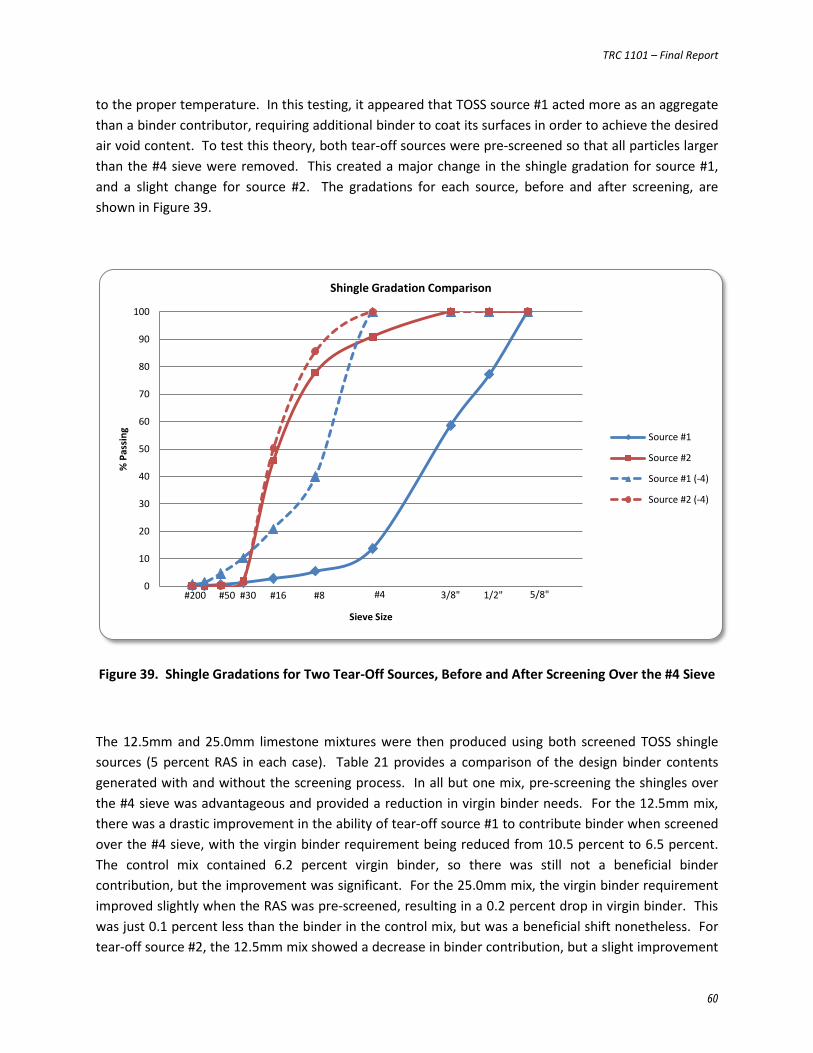
TRC 1101 – Final Report
60
to the proper temperature. In this testing, it appeared that TOSS source #1 acted more as an aggregate than a binder contributor, requiring additional binder to coat its surfaces in order to achieve the desired air void content. To test this theory, both tear-off sources were pre-screened so that all particles larger than the #4 sieve were removed. This created a major change in the shingle gradation for source #1, and a slight change for source #2. The gradations for each source, before and after screening, are shown in Figure 39.
Figure 39. Shingle Gradations for Two Tear-Off Sources, Before and After Screening Over the #4 Sieve
The 12.5mm and 25.0mm limestone mixtures were then produced using both screened TOSS shingle sources (5 percent RAS in each case). Table 21 provides a comparison of the design binder contents generated with and without the screening process. In all but one mix, pre-screening the shingles over the #4 sieve was advantageous and provided a reduction in virgin binder needs. For the 12.5mm mix, there was a drastic improvement in the ability of tear-off source #1 to contribute binder when screened over the #4 sieve, with the virgin binder requirement being reduced from 10.5 percent to 6.5 percent. The control mix contained 6.2 percent virgin binder, so there was still not a beneficial binder contribution, but the improvement was significant. For the 25.0mm mix, the virgin binder requirement improved slightly when the RAS was pre-screened, resulting in a 0.2 percent drop in virgin binder. This was just 0.1 percent less than the binder in the control mix, but was a beneficial shift nonetheless. For tear-off source #2, the 12.5mm mix showed a decrease in binder contribution, but a slight improvement
0
10
20
30
40
50
60
70
80
90
100
0.0 0.5 1.0 1.5 2.0 2.5 3.0 3.5 4.0
% P
assi
ng
Sieve Size
Shingle Gradation Comparison
Source #1
Source #2
Source #1 (-4)
Source #2 (-4)
1/2" 5/8" #50 #4 #200 #30 #16 #8 3/8"
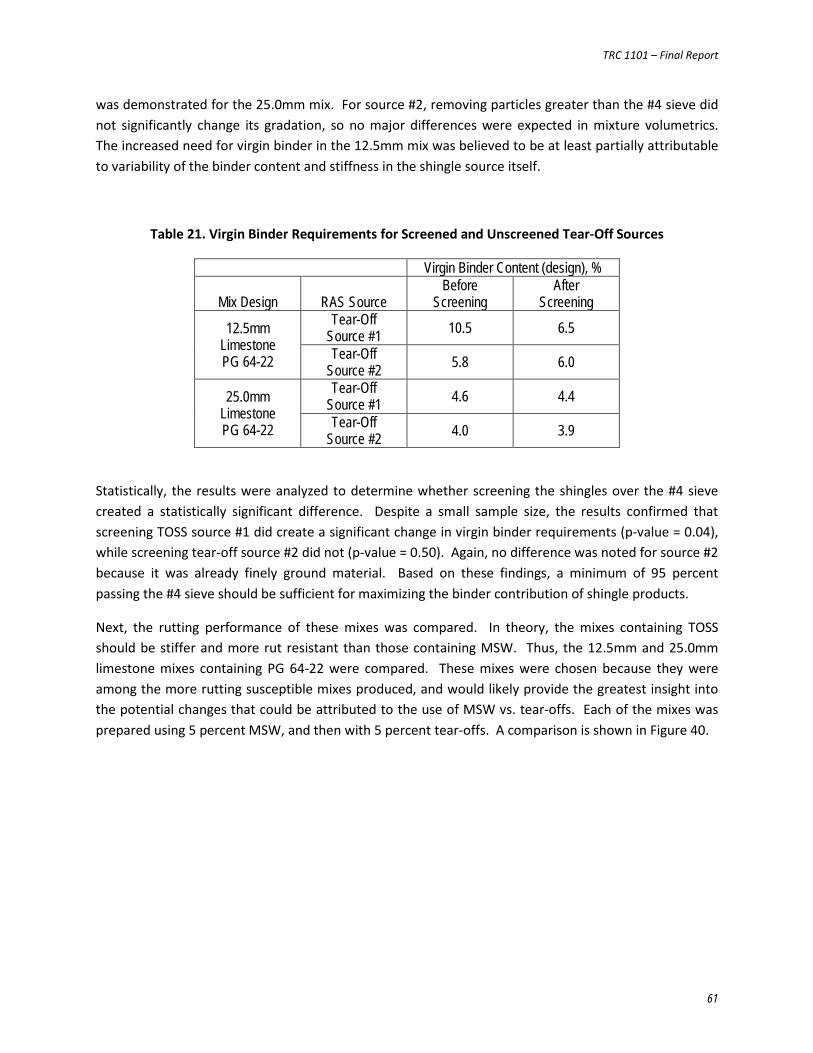
TRC 1101 – Final Report
61
was demonstrated for the 25.0mm mix. For source #2, removing particles greater than the #4 sieve did not significantly change its gradation, so no major differences were expected in mixture volumetrics. The increased need for virgin binder in the 12.5mm mix was believed to be at least partially attributable to variability of the binder content and stiffness in the shingle source itself.
Table 21. Virgin Binder Requirements for Screened and Unscreened Tear-Off Sources
Virgin Binder Content (design), %
Mix Design RAS Source Before
Screening After
Screening
12.5mm Limestone PG 64-22
Tear-Off Source #1 10.5 6.5
Tear-Off Source #2 5.8 6.0
25.0mm Limestone PG 64-22
Tear-Off Source #1 4.6 4.4
Tear-Off Source #2 4.0 3.9
Statistically, the results were analyzed to determine whether screening the shingles over the #4 sieve created a statistically significant difference. Despite a small sample size, the results confirmed that screening TOSS source #1 did create a significant change in virgin binder requirements (p-value = 0.04), while screening tear-off source #2 did not (p-value = 0.50). Again, no difference was noted for source #2 because it was already finely ground material. Based on these findings, a minimum of 95 percent passing the #4 sieve should be sufficient for maximizing the binder contribution of shingle products.
Next, the rutting performance of these mixes was compared. In theory, the mixes containing TOSS should be stiffer and more rut resistant than those containing MSW. Thus, the 12.5mm and 25.0mm limestone mixes containing PG 64-22 were compared. These mixes were chosen because they were among the more rutting susceptible mixes produced, and would likely provide the greatest insight into the potential changes that could be attributed to the use of MSW vs. tear-offs. Each of the mixes was prepared using 5 percent MSW, and then with 5 percent tear-offs. A comparison is shown in Figure 40.
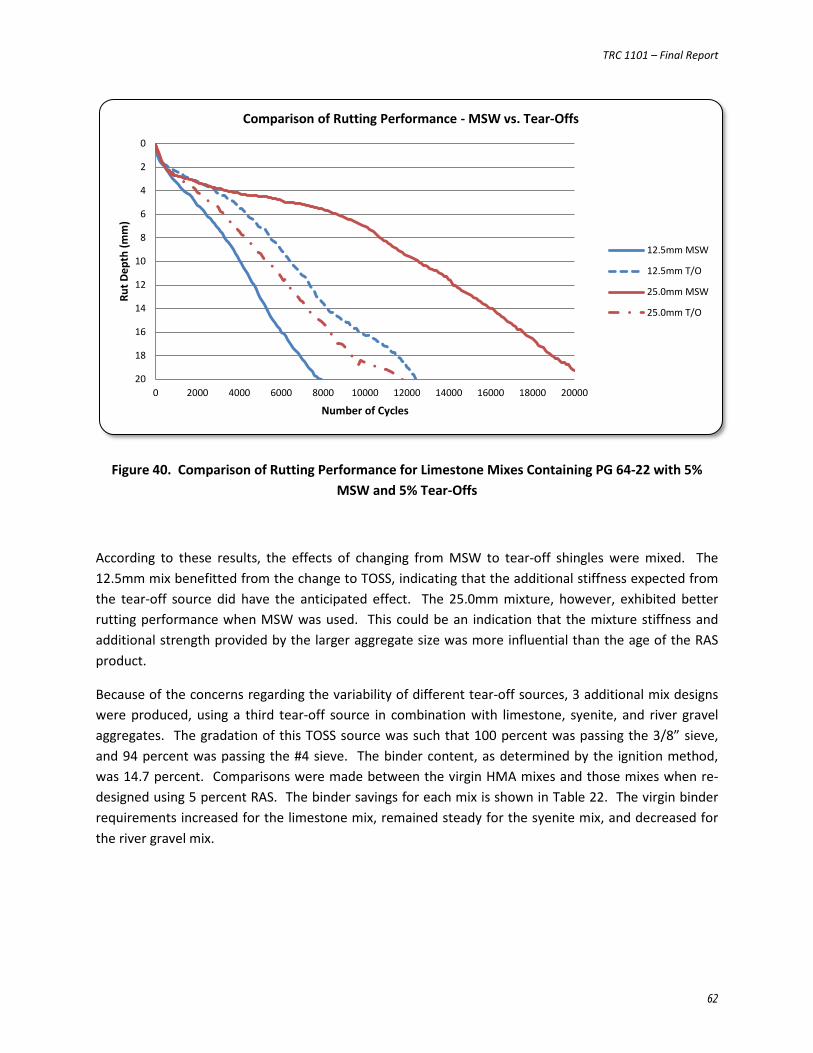
TRC 1101 – Final Report
62
Figure 40. Comparison of Rutting Performance for Limestone Mixes Containing PG 64-22 with 5% MSW and 5% Tear-Offs
According to these results, the effects of changing from MSW to tear-off shingles were mixed. The 12.5mm mix benefitted from the change to TOSS, indicating that the additional stiffness expected from the tear-off source did have the anticipated effect. The 25.0mm mixture, however, exhibited better rutting performance when MSW was used. This could be an indication that the mixture stiffness and additional strength provided by the larger aggregate size was more influential than the age of the RAS product.
Because of the concerns regarding the variability of different tear-off sources, 3 additional mix designs were produced, using a third tear-off source in combination with limestone, syenite, and river gravel aggregates. The gradation of this TOSS source was such that 100 percent was passing the 3/8” sieve, and 94 percent was passing the #4 sieve. The binder content, as determined by the ignition method, was 14.7 percent. Comparisons were made between the virgin HMA mixes and those mixes when re-designed using 5 percent RAS. The binder savings for each mix is shown in Table 22. The virgin binder requirements increased for the limestone mix, remained steady for the syenite mix, and decreased for the river gravel mix.
0
2
4
6
8
10
12
14
16
18
200 2000 4000 6000 8000 10000 12000 14000 16000 18000 20000
Rut D
epth
(mm
)
Number of Cycles
Comparison of Rutting Performance - MSW vs. Tear-Offs
12.5mm MSW
12.5mm T/O
25.0mm MSW
25.0mm T/O
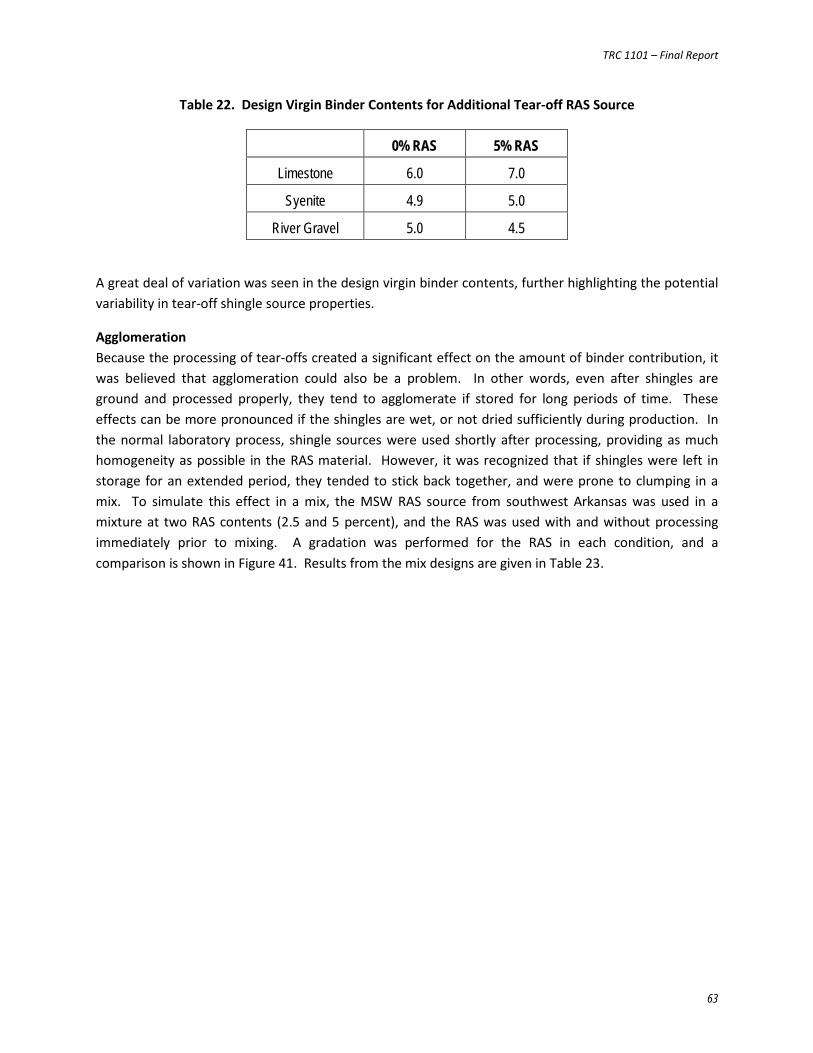
TRC 1101 – Final Report
63
Table 22. Design Virgin Binder Contents for Additional Tear-off RAS Source
0% RAS 5% RAS
Limestone 6.0 7.0
Syenite 4.9 5.0
River Gravel 5.0 4.5
A great deal of variation was seen in the design virgin binder contents, further highlighting the potential variability in tear-off shingle source properties.
Agglomeration Because the processing of tear-offs created a significant effect on the amount of binder contribution, it was believed that agglomeration could also be a problem. In other words, even after shingles are ground and processed properly, they tend to agglomerate if stored for long periods of time. These effects can be more pronounced if the shingles are wet, or not dried sufficiently during production. In the normal laboratory process, shingle sources were used shortly after processing, providing as much homogeneity as possible in the RAS material. However, it was recognized that if shingles were left in storage for an extended period, they tended to stick back together, and were prone to clumping in a mix. To simulate this effect in a mix, the MSW RAS source from southwest Arkansas was used in a mixture at two RAS contents (2.5 and 5 percent), and the RAS was used with and without processing immediately prior to mixing. A gradation was performed for the RAS in each condition, and a comparison is shown in Figure 41. Results from the mix designs are given in Table 23.
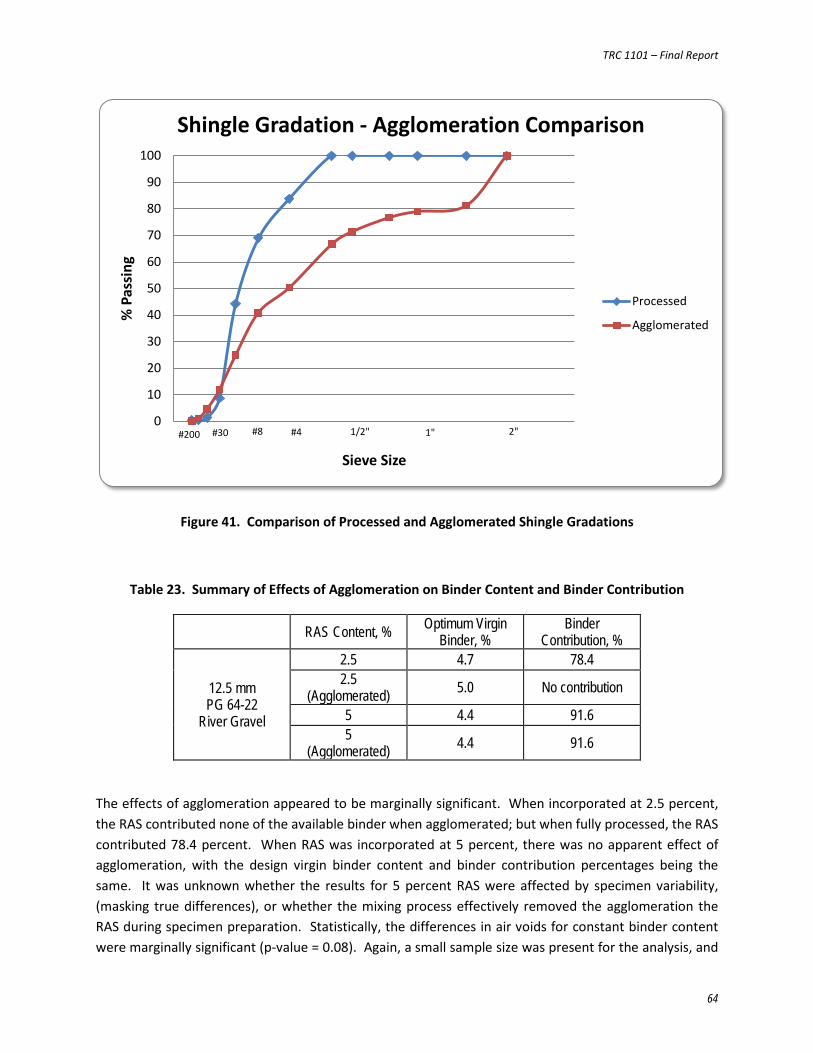
TRC 1101 – Final Report
64
Figure 41. Comparison of Processed and Agglomerated Shingle Gradations
Table 23. Summary of Effects of Agglomeration on Binder Content and Binder Contribution
RAS Content, % Optimum Virgin Binder, %
Binder Contribution, %
12.5 mm PG 64-22
River Gravel
2.5 4.7 78.4 2.5
(Agglomerated) 5.0 No contribution
5 4.4 91.6 5
(Agglomerated) 4.4 91.6
The effects of agglomeration appeared to be marginally significant. When incorporated at 2.5 percent, the RAS contributed none of the available binder when agglomerated; but when fully processed, the RAS contributed 78.4 percent. When RAS was incorporated at 5 percent, there was no apparent effect of agglomeration, with the design virgin binder content and binder contribution percentages being the same. It was unknown whether the results for 5 percent RAS were affected by specimen variability, (masking true differences), or whether the mixing process effectively removed the agglomeration the RAS during specimen preparation. Statistically, the differences in air voids for constant binder content were marginally significant (p-value = 0.08). Again, a small sample size was present for the analysis, and
0
10
20
30
40
50
60
70
80
90
100
0.0 1.0 2.0 3.0 4.0 5.0 6.0 7.0
% P
assi
ng
Sieve Size
Shingle Gradation - Agglomeration Comparison
Processed
Agglomerated
1" 2" #30 1/2" #200 #8 #4
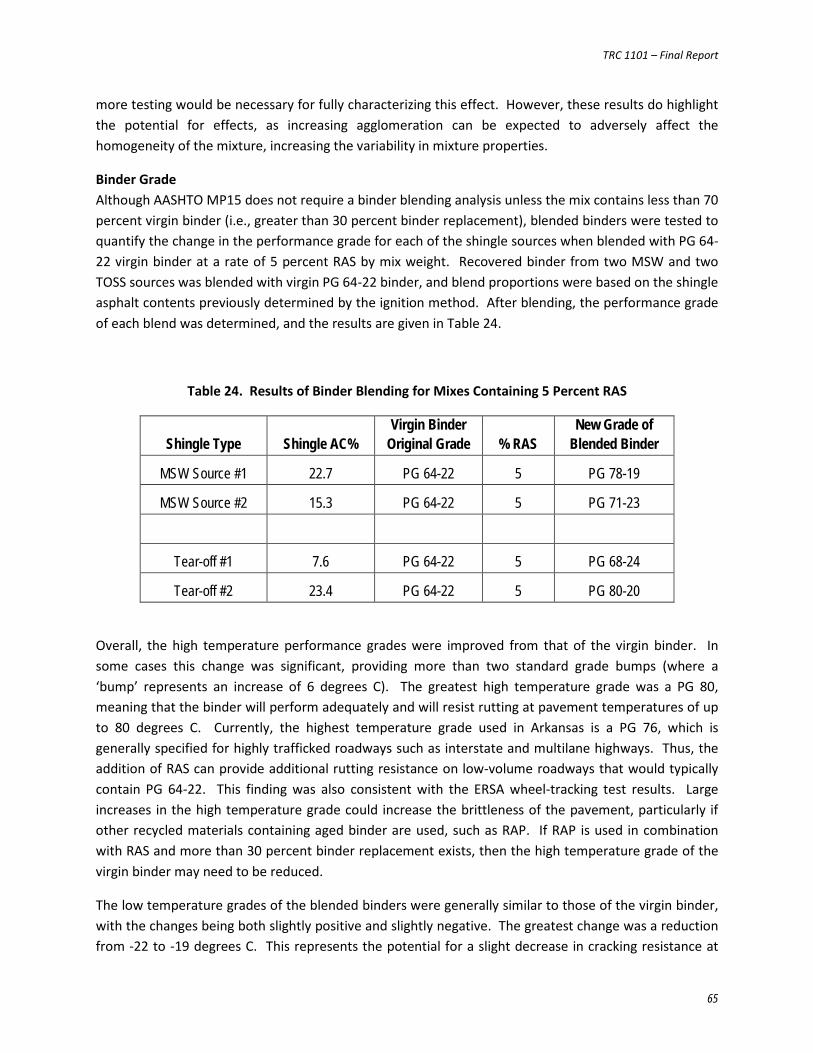
TRC 1101 – Final Report
65
more testing would be necessary for fully characterizing this effect. However, these results do highlight the potential for effects, as increasing agglomeration can be expected to adversely affect the homogeneity of the mixture, increasing the variability in mixture properties.
Binder Grade Although AASHTO MP15 does not require a binder blending analysis unless the mix contains less than 70 percent virgin binder (i.e., greater than 30 percent binder replacement), blended binders were tested to quantify the change in the performance grade for each of the shingle sources when blended with PG 64-22 virgin binder at a rate of 5 percent RAS by mix weight. Recovered binder from two MSW and two TOSS sources was blended with virgin PG 64-22 binder, and blend proportions were based on the shingle asphalt contents previously determined by the ignition method. After blending, the performance grade of each blend was determined, and the results are given in Table 24.
Table 24. Results of Binder Blending for Mixes Containing 5 Percent RAS
Shingle Type Shingle AC% Virgin Binder
Original Grade % RAS New Grade of
Blended Binder
MSW Source #1 22.7 PG 64-22 5 PG 78-19
MSW Source #2 15.3 PG 64-22 5 PG 71-23
Tear-off #1 7.6 PG 64-22 5 PG 68-24
Tear-off #2 23.4 PG 64-22 5 PG 80-20
Overall, the high temperature performance grades were improved from that of the virgin binder. In some cases this change was significant, providing more than two standard grade bumps (where a ‘bump’ represents an increase of 6 degrees C). The greatest high temperature grade was a PG 80, meaning that the binder will perform adequately and will resist rutting at pavement temperatures of up to 80 degrees C. Currently, the highest temperature grade used in Arkansas is a PG 76, which is generally specified for highly trafficked roadways such as interstate and multilane highways. Thus, the addition of RAS can provide additional rutting resistance on low-volume roadways that would typically contain PG 64-22. This finding was also consistent with the ERSA wheel-tracking test results. Large increases in the high temperature grade could increase the brittleness of the pavement, particularly if other recycled materials containing aged binder are used, such as RAP. If RAP is used in combination with RAS and more than 30 percent binder replacement exists, then the high temperature grade of the virgin binder may need to be reduced.
The low temperature grades of the blended binders were generally similar to those of the virgin binder, with the changes being both slightly positive and slightly negative. The greatest change was a reduction from -22 to -19 degrees C. This represents the potential for a slight decrease in cracking resistance at
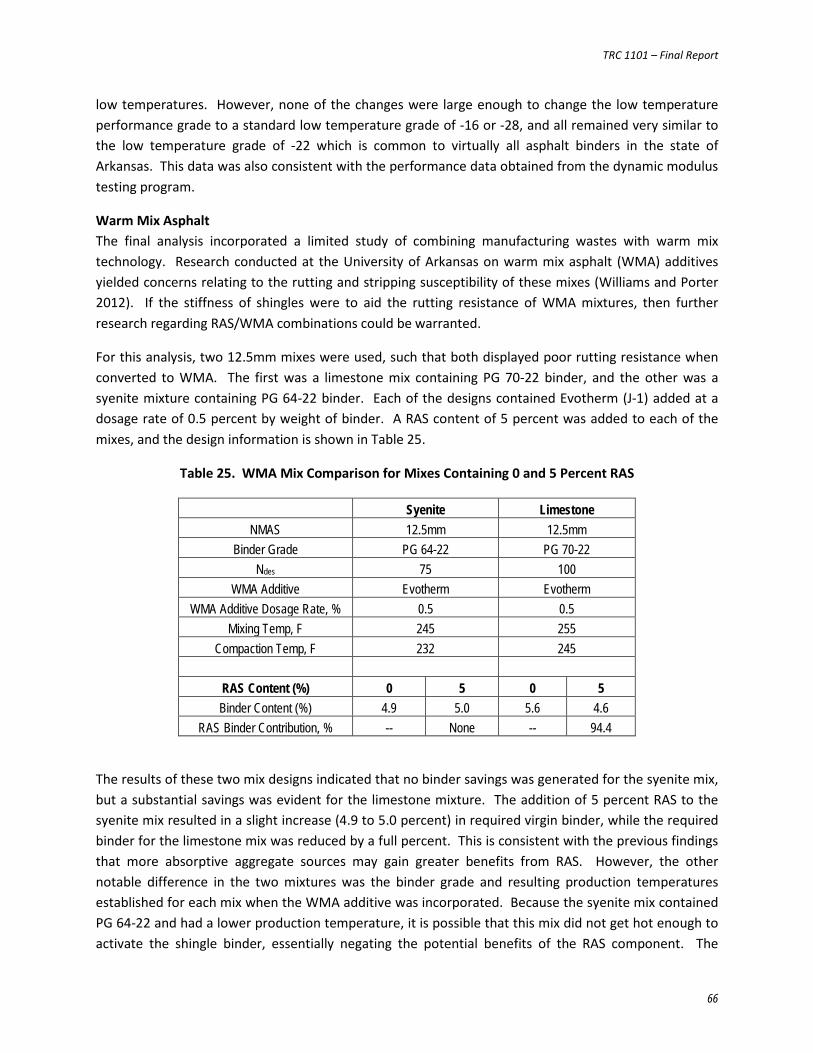
TRC 1101 – Final Report
66
low temperatures. However, none of the changes were large enough to change the low temperature performance grade to a standard low temperature grade of -16 or -28, and all remained very similar to the low temperature grade of -22 which is common to virtually all asphalt binders in the state of Arkansas. This data was also consistent with the performance data obtained from the dynamic modulus testing program.
Warm Mix Asphalt The final analysis incorporated a limited study of combining manufacturing wastes with warm mix technology. Research conducted at the University of Arkansas on warm mix asphalt (WMA) additives yielded concerns relating to the rutting and stripping susceptibility of these mixes (Williams and Porter 2012). If the stiffness of shingles were to aid the rutting resistance of WMA mixtures, then further research regarding RAS/WMA combinations could be warranted.
For this analysis, two 12.5mm mixes were used, such that both displayed poor rutting resistance when converted to WMA. The first was a limestone mix containing PG 70-22 binder, and the other was a syenite mixture containing PG 64-22 binder. Each of the designs contained Evotherm (J-1) added at a dosage rate of 0.5 percent by weight of binder. A RAS content of 5 percent was added to each of the mixes, and the design information is shown in Table 25.
Table 25. WMA Mix Comparison for Mixes Containing 0 and 5 Percent RAS
Syenite Limestone NMAS 12.5mm 12.5mm
Binder Grade PG 64-22 PG 70-22 Ndes 75 100
WMA Additive Evotherm Evotherm WMA Additive Dosage Rate, % 0.5 0.5
Mixing Temp, F 245 255 Compaction Temp, F 232 245
RAS Content (%) 0 5 0 5 Binder Content (%) 4.9 5.0 5.6 4.6
RAS Binder Contribution, % -- None -- 94.4
The results of these two mix designs indicated that no binder savings was generated for the syenite mix, but a substantial savings was evident for the limestone mixture. The addition of 5 percent RAS to the syenite mix resulted in a slight increase (4.9 to 5.0 percent) in required virgin binder, while the required binder for the limestone mix was reduced by a full percent. This is consistent with the previous findings that more absorptive aggregate sources may gain greater benefits from RAS. However, the other notable difference in the two mixtures was the binder grade and resulting production temperatures established for each mix when the WMA additive was incorporated. Because the syenite mix contained PG 64-22 and had a lower production temperature, it is possible that this mix did not get hot enough to activate the shingle binder, essentially negating the potential benefits of the RAS component. The
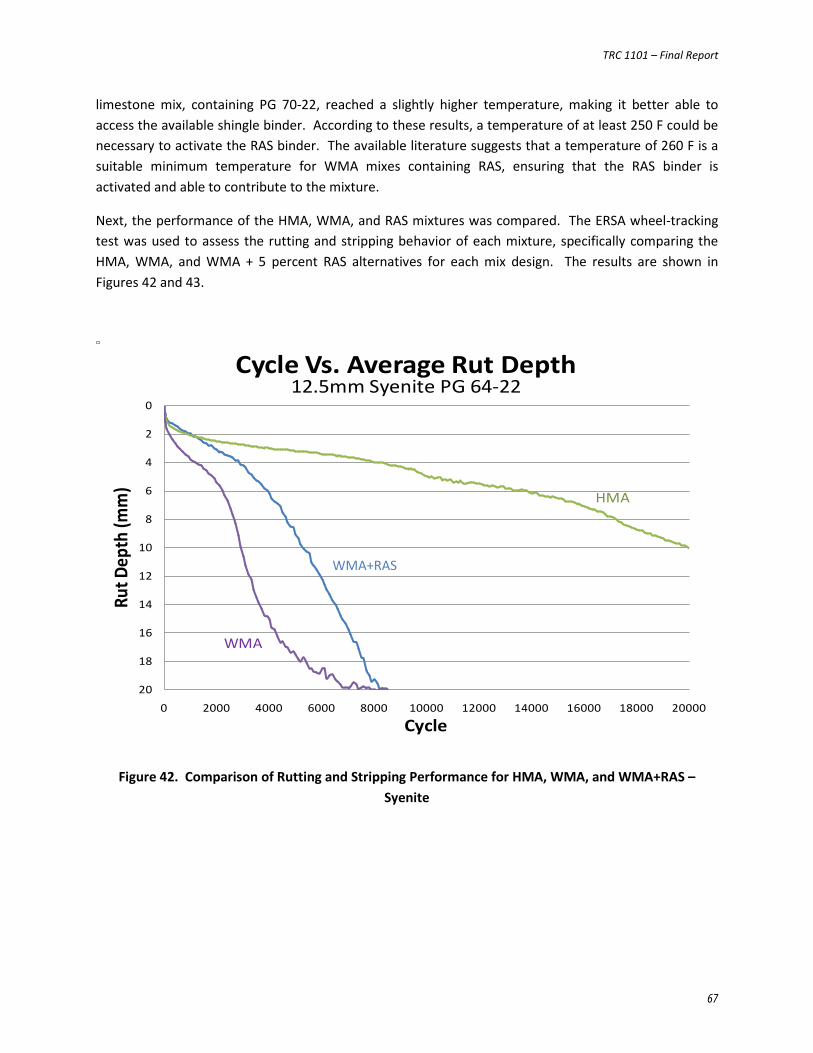
TRC 1101 – Final Report
67
limestone mix, containing PG 70-22, reached a slightly higher temperature, making it better able to access the available shingle binder. According to these results, a temperature of at least 250 F could be necessary to activate the RAS binder. The available literature suggests that a temperature of 260 F is a suitable minimum temperature for WMA mixes containing RAS, ensuring that the RAS binder is activated and able to contribute to the mixture.
Next, the performance of the HMA, WMA, and RAS mixtures was compared. The ERSA wheel-tracking test was used to assess the rutting and stripping behavior of each mixture, specifically comparing the HMA, WMA, and WMA + 5 percent RAS alternatives for each mix design. The results are shown in Figures 42 and 43.
Figure 42. Comparison of Rutting and Stripping Performance for HMA, WMA, and WMA+RAS – Syenite
0
2
4
6
8
10
12
14
16
18
200 2000 4000 6000 8000 10000 12000 14000 16000 18000 20000
Rut D
epth
(mm
)
Cycle
Cycle Vs. Average Rut Depth
WMA
5% RAS
HMA
12.5mm Syenite PG 64-22
WMA+RAS
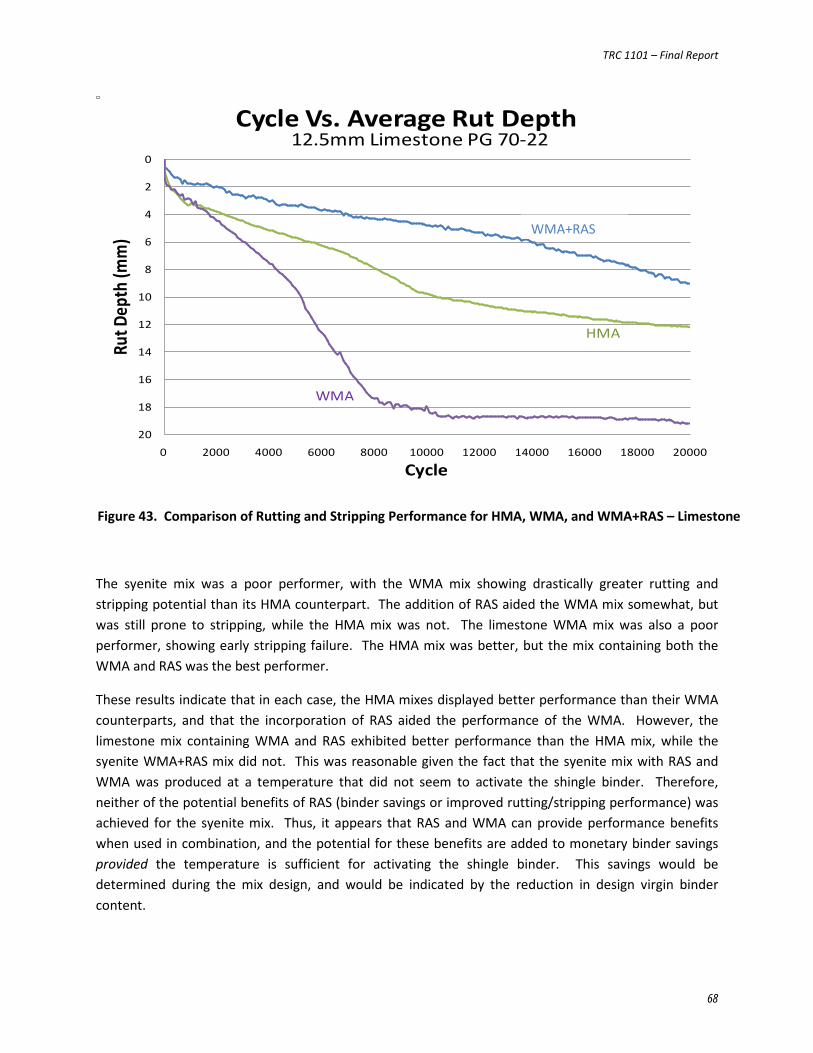
TRC 1101 – Final Report
68
Figure 43. Comparison of Rutting and Stripping Performance for HMA, WMA, and WMA+RAS – Limestone
The syenite mix was a poor performer, with the WMA mix showing drastically greater rutting and stripping potential than its HMA counterpart. The addition of RAS aided the WMA mix somewhat, but was still prone to stripping, while the HMA mix was not. The limestone WMA mix was also a poor performer, showing early stripping failure. The HMA mix was better, but the mix containing both the WMA and RAS was the best performer.
These results indicate that in each case, the HMA mixes displayed better performance than their WMA counterparts, and that the incorporation of RAS aided the performance of the WMA. However, the limestone mix containing WMA and RAS exhibited better performance than the HMA mix, while the syenite WMA+RAS mix did not. This was reasonable given the fact that the syenite mix with RAS and WMA was produced at a temperature that did not seem to activate the shingle binder. Therefore, neither of the potential benefits of RAS (binder savings or improved rutting/stripping performance) was achieved for the syenite mix. Thus, it appears that RAS and WMA can provide performance benefits when used in combination, and the potential for these benefits are added to monetary binder savings provided the temperature is sufficient for activating the shingle binder. This savings would be determined during the mix design, and would be indicated by the reduction in design virgin binder content.
0
2
4
6
8
10
12
14
16
18
200 2000 4000 6000 8000 10000 12000 14000 16000 18000 20000
Rut D
epth
(mm
)
Cycle
Cycle Vs. Average Rut Depth
WMA
5% RAS
HMA
12.5mm Limestone PG 70-22
WMA+RAS
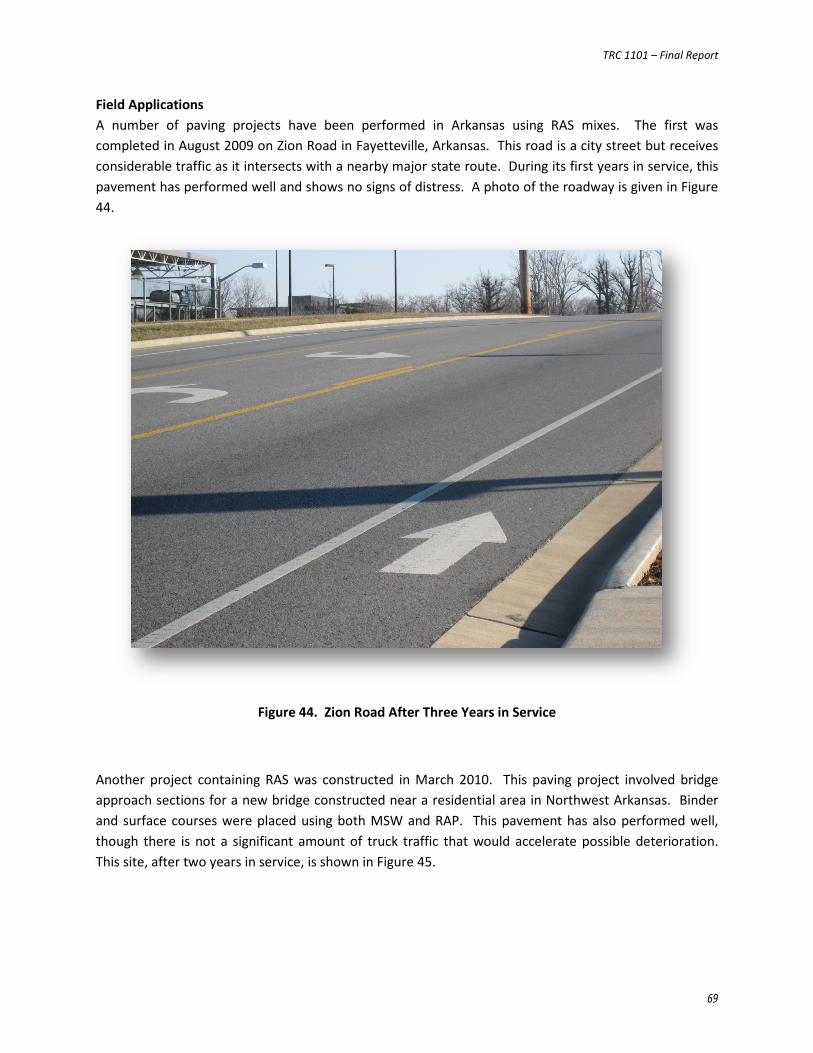
TRC 1101 – Final Report
69
Field Applications A number of paving projects have been performed in Arkansas using RAS mixes. The first was completed in August 2009 on Zion Road in Fayetteville, Arkansas. This road is a city street but receives considerable traffic as it intersects with a nearby major state route. During its first years in service, this pavement has performed well and shows no signs of distress. A photo of the roadway is given in Figure 44.
Figure 44. Zion Road After Three Years in Service
Another project containing RAS was constructed in March 2010. This paving project involved bridge approach sections for a new bridge constructed near a residential area in Northwest Arkansas. Binder and surface courses were placed using both MSW and RAP. This pavement has also performed well, though there is not a significant amount of truck traffic that would accelerate possible deterioration. This site, after two years in service, is shown in Figure 45.
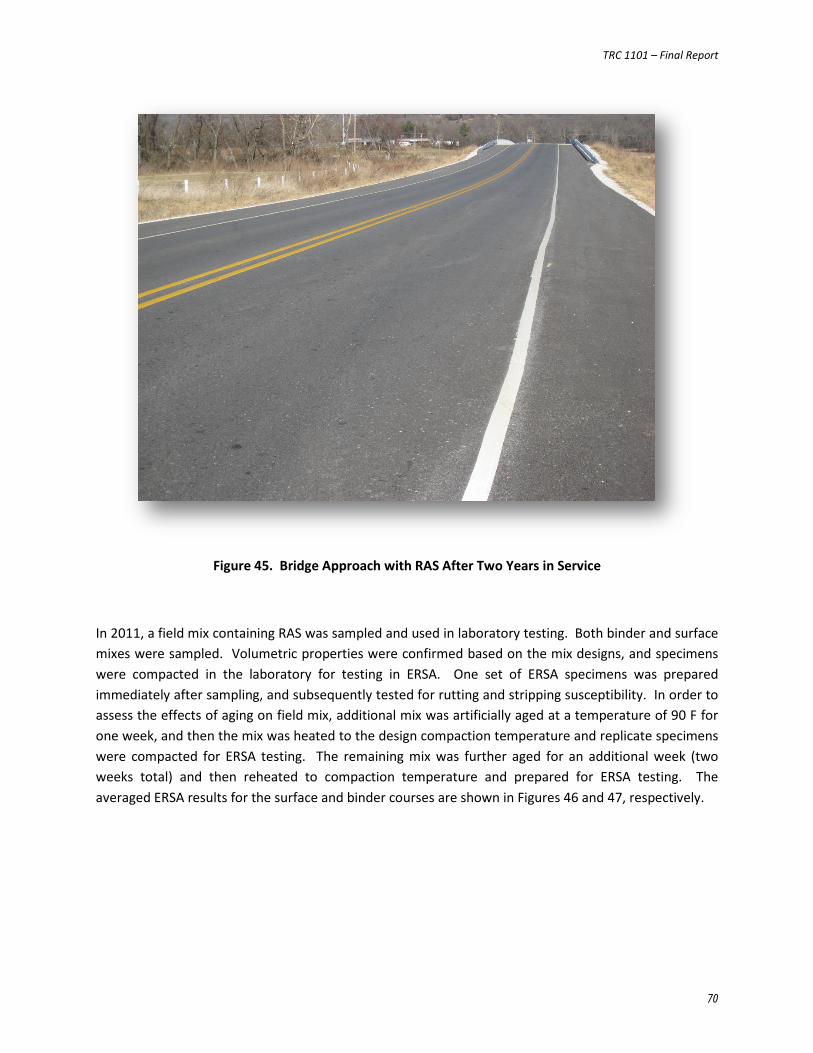
TRC 1101 – Final Report
70
Figure 45. Bridge Approach with RAS After Two Years in Service
In 2011, a field mix containing RAS was sampled and used in laboratory testing. Both binder and surface mixes were sampled. Volumetric properties were confirmed based on the mix designs, and specimens were compacted in the laboratory for testing in ERSA. One set of ERSA specimens was prepared immediately after sampling, and subsequently tested for rutting and stripping susceptibility. In order to assess the effects of aging on field mix, additional mix was artificially aged at a temperature of 90 F for one week, and then the mix was heated to the design compaction temperature and replicate specimens were compacted for ERSA testing. The remaining mix was further aged for an additional week (two weeks total) and then reheated to compaction temperature and prepared for ERSA testing. The averaged ERSA results for the surface and binder courses are shown in Figures 46 and 47, respectively.
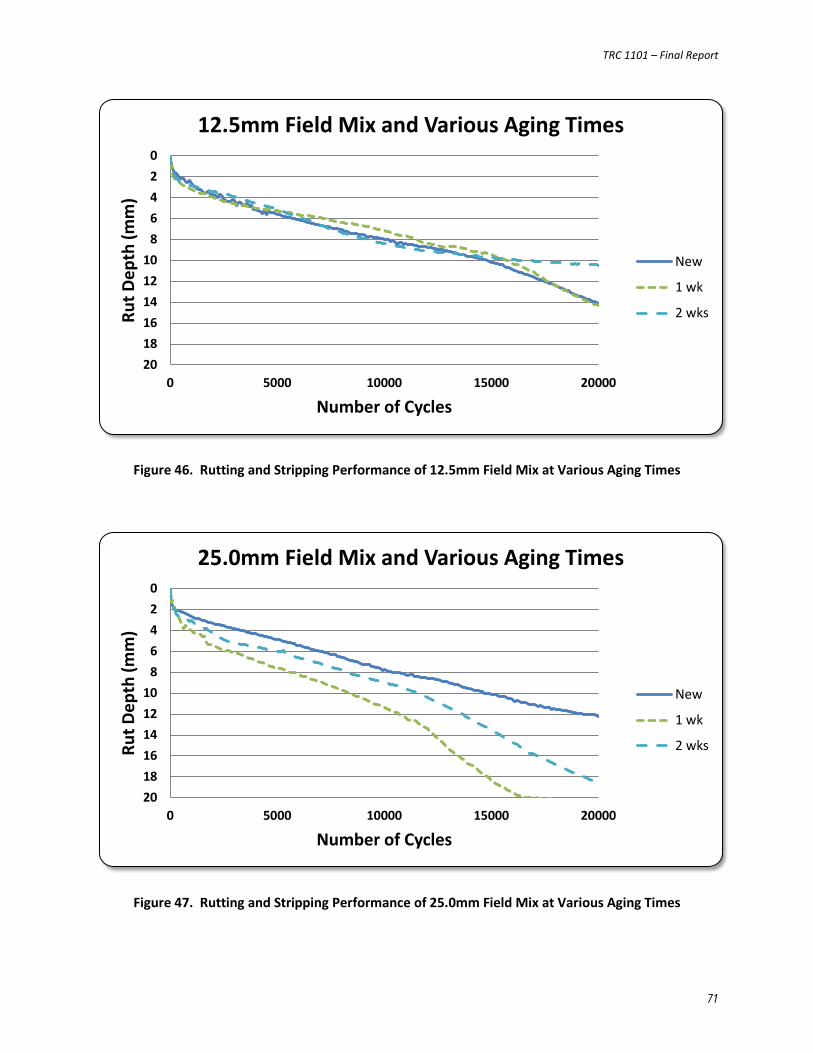
TRC 1101 – Final Report
71
Figure 46. Rutting and Stripping Performance of 12.5mm Field Mix at Various Aging Times
Figure 47. Rutting and Stripping Performance of 25.0mm Field Mix at Various Aging Times
02468
101214161820
0 5000 10000 15000 20000
Rut D
epth
(mm
)
Number of Cycles
12.5mm Field Mix and Various Aging Times
New
1 wk
2 wks
02468
101214161820
0 5000 10000 15000 20000
Rut D
epth
(mm
)
Number of Cycles
25.0mm Field Mix and Various Aging Times
New
1 wk
2 wks
TRC 1101 – Final Report
72
The performance levels of the surface mix specimens were very similar with regard to rutting. The newly produced specimens and those aged for one week were especially similar, displaying a tendency toward stripping during the last 5000 cycles of the test. The specimens prepared after two weeks of aging, however, did not strip. This was reasonable and confirmed the expectation that aged specimens could provide additional stiffness.
The binder mix showed more variation in rutting susceptibility among the different aging times, with the new specimens providing the best performance, followed by those aged for two weeks, and finally those aged for one week. The newly prepared 25.0mm specimens showed the greatest potential for resisting stripping failures. While this does not follow the expected trend, 25.0mm specimens tend to vary more during laboratory compaction, and this variability could have masked the actual trends.
TRC 1101 – Final Report
73
7. Conclusions and Recommendations
The primary tasks of this project were to evaluate the procedures associated with the design and production of RAS, to consider performance data, and to recommend procedures and specifications appropriate for incorporating RAS mixtures into current practice.
The majority of the work performed in this project involved MSW (pre-consumer products). Mix designs from two aggregate sources were used, including 12.5 and 25.0mm NMAS, as well as two virgin binder grades (PG 64-22 and PG 70-22). For each mix design, varying percentages of RAS were used to re-design the mixes and to determine the potential for virgin binder savings. Volumetric properties were evaluated, as well as laboratory performance characteristics. The major conclusions of the study of RAS mixes containing MSW were as follows:
• The incorporation of MSW into asphalt mixtures generally decreases the need for virgin binder. As RAS content increases, the design virgin binder content decreases. On average, when incorporating 2.5 to 5.0 percent RAS, an average reduction of 0.5 percent in virgin binder can be expected. The results varied by aggregate type, and additional savings may be generated for more absorptive aggregates.
• Volumetric properties such as VMA and VFA may be significantly affected by the addition of MSW in a mix. VMA appeared to be the most affected property, however this change was not consistent and was likely affected by aggregate type. The incorporation of RAS tended to exaggerate any existing difficulties already common for VMA requirements when designing mixes without RAS. Other volumetric properties were less affected by the addition of RAS.
• Binder contribution was significantly affected by aggregate type and shingle source. The average binder contribution for the limestone mixes was 94 percent, while that for the river gravel mixes was approximately 64 percent.
• By contributing valuable binder, RAS products can provide substantial cost savings. On average, the use of 2.5 percent MSW generated a savings of $3.25 per ton, the use of 5 percent MSW saved approximately $5.00 per ton, and the use of 10 percent MSW saved almost $9.00 per ton of mix.
• Overall, the use of RAS significantly decreased a mixture’s susceptibility to experience rutting or stripping failures, though greater variability in performance was noted for mixtures containing higher percentages of RAS. Factors such as aggregate type and binder grade appeared to affect the RAS mixtures in much the same way that they affected the control mixes.
• The dynamic modulus testing indicated that at high temperatures, RAS mixes can provide superior cracking performance, and similar performance at low temperatures when compared to the control mixes. The slight potential for RAS mixes to exhibit decreased cracking performance at low temperatures was outweighed by their consistently superior performance at high temperatures.
• Warm mix asphalt can be used successfully in combination with RAS. Because WMA mixes tend to be more rutting susceptible than traditional HMA mixtures, the stiffer nature of the RAS can provide the additional stiffness needed to counteract the deficiencies common to WMA.
TRC 1101 – Final Report
74
Tear-off shingle sources were also investigated, as these types of sources are more readily available and plentiful within the state of Arkansas. The most important finding regarding TOSS was that a large component of variability may be present, which can create significant differences in mixture design properties if alternate tear-off sources are substituted. Additional conclusions regarding the study of TOSS were as follows:
• Virgin binder content reductions for mix designs using TOSS were not as great as for similar mixes using MSW. Binder contribution levels were also less for the TOSS sources, even when the actual shingle binder contents were similar.
• Tear-off RAS sources displayed a great deal of variation, both in shingle properties and mixture properties. In some cases, the tear-off shingles actually absorbed virgin binder from the mix, generating a negative binder contribution. These situations should be identified during the mix design process and avoided during production. Mixture performance was not adversely affected when using tear-off shingle sources.
• The grind size of shingles was investigated, and it was determined that finer grind sizes provide the most significant levels of binder contribution. Pre-screening the RAS product over a No. 4 sieve enabled the RAS products to maximize their contribution of available binder to the mix.
• Shingle agglomeration significantly affected the volumetric properties of the RAS mixtures. Agglomeration can contribute to variability in a mixture, resulting in a non-homogeneous mixture. Thus, agglomeration should be avoided.
• When blending shingle binders with virgin binders in a mix, the high temperature grade increased significantly. The greatest grade increase (PG 64-22 to PG 80-20) was associated with TOSS source #1, which contained a relatively high shingle binder content of 23.4 percent.
Favorable results have been generated regarding the use of RAS in asphalt mixes. Thus, it is recommended that RAS mixes be incorporated into the current highway construction specification for use in base, binder, and surface courses, though separate requirements should be established for MSW and TOSS shingle sources. It is recommended that MSW be allowed at a maximum rate of 3 percent in mixes containing PG 64-22 and PG 70-22. While there is data to support the allowance of up to 5 percent RAS, the variability within the data tends to increase with increasing RAS content. Therefore a conservative limit of 3 percent is recommended for immediate implementation, with the possibility of increasing that percentage to 5 percent in the future.
Tear-offs should only be allowed in mixtures containing PG 64-22 (unmodified) binders that are to be used in low traffic applications, including city streets or county roads. Widespread application of these mixes is not anticipated within AHTD, but the presence of a specification for applicable situations would be a great benefit to local agencies. A special provision for the use of tear-offs should be drafted, and considered for use on a case-by-case basis at the request of the contractor.
Mix Design In general, applicable AASHTO procedures should be followed:
• AASHTO MP15: “Use of Reclaimed Asphalt Shingles as an Additive in Hot Mix Asphalt”
TRC 1101 – Final Report
75
• AASHTO PP53: “Design Considerations When Using Reclaimed Asphalt Shingles (RAS) in New Hot Mix Asphalt (HMA)”
The RAS percentage should be reported as the percent by total weight of mix, and the shingle aggregate should be considered in the Job Mix Formula as a mineral aggregate source.
AASHTO MP15 states that if <70 percent of binder in the mix is virgin binder, further blending analysis must be performed. At the current recommended limit of 3 percent RAS, the need for further blending analysis is not likely. However, if high RAP contents were to be used in conjunction with RAS, the total binder replacement could exceed 30 percent, and the blending procedure would need to be pursued.
Binder content of the RAS source shall be determined using one of the following extraction methods:
• AASHTO T164: “Quantitative Extraction of Asphalt Binder from Hot Mix Asphalt (HMA)” • AASHTO T319: “Quantitative Extraction and Recovery of Asphalt Binder from Asphalt Mixtures” • AASHTO T308: “Determining the Asphalt Binder Content of Hot Mix Asphalt (HMA) by the
Ignition Method” • AHTD 460: “Test Method for Solvent Washing and Sieve Analysis of Asphalt Concrete”
If the ignition method (AASHTO T308) is used to determine binder content, the sample size shall be 500 to 700 grams, and the sample shall be oven dried to a constant mass (at a temperature not exceeding 140 F) prior to testing. AASHTO T319 must be used if the recovered binder is to be used for further analysis.
The gradation of the RAS source must be considered as an aggregate source, and should be included in the job mix formula as a specific aggregate source. Although AASHTO PP53 provides a RAS gradation that can be used in lieu of an actual measured gradation, the gradation of the RAS source should be measured according to AASHTO T30 for a sample of extracted aggregate resulting from AASHTO T164, AASHTO T319, or AASHTO T308. Shingle fibers present should be removed prior to testing by AASHTO T30. After the shingle gradation is incorporated into the job mix formula, the blend gradation must still meet all applicable gradation specifications as given in Section 400 of the 2003 Edition of the Standard Specification for Highway Construction (i.e., the AHTD ‘Gold Book’). Also note that shingles tend to hold moisture, and it is not unusual to experience moisture contents of 10 to 14 percent. This moisture is significant and must be accounted for during batching of the mix.
The specific gravity of the RAS product is considered to be its effective specific gravity (Gse). To determine this value, perform specific gravity testing according to AASHTO T209, and then calculate Gse according to traditional hot mix asphalt calculations.
To design a RAS mix, a virgin mix must first be designed. For a given aggregate structure (which may need to be adjusted to meet blend gradation requirements), the virgin binder content requirement (optimum binder content) is determined. Next, the mix design is performed with the desired percentage of RAS added to the mix. A revised optimum binder content (i.e., percent of virgin binder
TRC 1101 – Final Report
76
required) is determined. From this data, calculate the percentage of available binder according to the following equation.
𝐹𝑐 = 𝑃𝑏𝑣 − 𝑃𝑏𝑣𝑟(𝑃𝑠𝑟)(𝑃𝑏𝑟)
where: Fc = the estimated shingle binder availability factor, percent; Pbv = the design asphalt binder content of a mix without RAS, percent; Pbvr = the design asphalt binder content of the same mix (new HMA) with RAS, percent; Psr = the percentage of RAS in the new HMA expressed as a decimal; and Pbr = the percentage of shingle asphalt binder in the RAS expressed as a decimal. According to AASHTO PP53, this calculation typically underestimates the actual contribution of binder (based on field experience), and a corrected value is calculated by averaging Fc and 100 percent. The method also states that the RAS product is to be introduced into the mixture at ambient temperature. This process does not allow adequate time to heat the RAS, and does not properly activate the available binder. A more appropriate process is to pre-heat the RAS with the other aggregates prior to mixing, allowing for a more realistic activation of binder and subsequent binder release. By pre-heating the RAS with the other aggregates, no correction is needed for Fc. Note that thorough mixing of the aggregates is necessary to prevent agglomeration of the RAS during the pre-heating phase. Next, binder replacement should be calculated as follows:
𝑃𝑏𝑟𝑓 = 𝐹 (𝑃𝑠𝑟)(𝑃𝑏𝑟)
𝑃𝑏𝑏𝑓
where: Pbrf = the percentage of shingle asphalt binder in the final blended binder; F = the estimated shingle binder availability factor, percent; Psr = the percentage of RAS in the new HMA, expressed as a decimal; Pbr = the percentage of shingle asphalt binder in the RAS; and Pbbf = the percentage of final blended binder in the new HMA, expressed as a decimal. In some cases, the design virgin binder content may increase when RAS is added to the mix (i.e., Pbv – Pbvr is negative). In this case, the addition of RAS is not advantageous, and the mix design should not be pursued. In reality, this situation would not prove beneficial to the contractor, and would likely not be submitted for approval. While this seems counter-intuitive, the amount of shingle contribution is governed by various factors, including:
• The binder content of the shingles (pre-consumer RAS may contain a higher binder content) • The binder contribution of the shingles (this is usually lower for tear-offs due to binder aging) • The grind size of the shingles (finer grading is better able to release binder) • The production temperature (higher temperatures are better able to ‘activate’ the release of
binder) • The amount of binder needed to coat the RAS particles, and
TRC 1101 – Final Report
77
• The additional absorption capacity of the mix due to the RAS. All mix design requirements contained in the Standard Specification must be met. For any RAS mix design, the following additional items should be reported:
• Shingle content (percent by weight of mix) • Shingle type (MSW or TOSS) • Virgin binder content (percent by weight of mix) • Binder content of the RAS product, percent (Pbr) • Method used to determine Pbr (i.e., AASHTO T164, T308, T319, etc.) • Total binder content of the mix, or sum of virgin binder and binder from RAS, percent (Pbbf) • Binder contribution, percent (Fc) • Binder replacement, percent (Pbrf)
RAS and RAP In many cases, RAP and RAS may be used together in a mix. In such instances, the total binder replacement percentage should be calculated and reported on the mix design, as well as the individual binder contents of the RAS and RAP materials. RAS and WMA When WMA mixes are used, lower production temperatures pose a number of advantages. However, the reduced temperatures may affect the ability of the RAS binder to ‘activate’, resulting in a lower level of binder contribution by the RAS. This effect was much more pronounced for the PG 64-22 mix than for the PG 70-22 mix, and the data suggested that WMA mixes produced at temperatures below 260 °F may counteract the benefits of RAS additives. The effectiveness of individual RAS sources at reduced temperatures should be assessed during the mix design process. When the addition of RAS does not reduce the virgin binder content requirement, RAS should not be used. For plant-foamed WMA mixes containing RAS, production temperatures should not fall below a minimum of 260 °F. Processing and Handling Shingles shall be processed in a manner that creates a homogeneous and fine-graded product, and stored in a manner that minimizes moisture retention. Finer-graded RAS is better able to contribute binder to the asphalt mixture. Thus, 100 percent of the processed RAS material must pass the 3/8” sieve, and 95 percent must pass the #4 sieve. Double-grinding, or double-processing, may be necessary in order to meet this requirement. Shingles shall be clean and free of deleterious material, having no more than 1.5 percent deleterious materials when tested according to AHTD 302. Metal, glass, rubber, soil, brick, tars, paper, wood and plastic shall be considered deleterious materials in RAS. This requirement is more stringent than the AASHTO recommendation of 3 percent maximum total deleterious materials, but will provide a more consistent and homogeneous asphalt mixture. RAS stockpiles shall be kept clean and dry, and must be placed on a surface that facilitates drainage and prevents contamination. Shingles tend to hold moisture, which leads to particle agglomeration. If possible, shingle stockpiles should be covered. RAS stockpiles should be mixed regularly (particularly after a rainfall event) to maintain a homogeneous product and to help prevent agglomeration. Another technique that may be used to prevent agglomeration is to pre-blend the RAS with other recycled
TRC 1101 – Final Report
78
materials, such as RAP or a fine aggregate source used in the mix design. The blended material must adequately represent the proportions required for the mix design. During production, the RAS material should be added as an aggregate, and a separate cold feed bin shall be used for the RAS or RAS blend, which shall be set up according to manufacturer’s instructions. The bin shall be equipped with a weighing unit such that an accurate proportion of RAS in the Job Mix Formula can be consistently added to the mix. Tear-Offs Tear-off shingles shall be acquired from residential sources only, and must meet all applicable specifications, including ADEQ requirements (such as asbestos testing). Certification that the RAS source has passed applicable environmental testing requirements shall be provided to AHTD prior to acceptance of the mix design. In order to reduce the risk of asbestos contamination, only tear-off shingles produced after 1980 should be used in HMA mixes. In no case shall a roofing material containing rubber or rubber-like polymer components be used as RAS in HMA mixes. Because little information is available regarding the individual sources and properties of tear-off shingles, they may vary greatly in consistency and binder contribution. For this reason, a single stockpile must be used for a single mix design, or project. A TOSS stockpile should be treated as an aggregate source, and should be listed as a specific aggregate source on the Job Mix Formula. Once a stockpile has been designated for a particular mix, no more TOSS may be added to the stockpile. If additional shingles are needed, then a new stockpile must be produced and the mix design must be verified/approved using material from the new TOSS stockpile. Quality Control / Quality Assurance Current QC/QA procedures are adequate for RAS mixes, although additional testing should be performed to regularly confirm the properties of tear-off stockpiles. One stockpile test per lot of mix should be conducted by the contractor to confirm the binder content and gradation of the RAS product, and the sample should be representative of the RAS material entering the production process for the lot tested (i.e., be sampled from the working face of the stockpile). These test results should not be used as a pay item, but could serve as justification for the Engineer to require process changes when necessary. All other existing HMA QC/QA specification limits are appropriate for MSW and TOSS RAS mixtures.
TRC 1101 – Final Report
79
8. Acknowledgments / Disclaimer
This document contains recommendations for the implementation of research conducted for the Arkansas State Highway and Transportation Department (AHTD) under project TRC 1101, Recycled Asphalt Shingles in Asphalt Pavements. The research was conducted at the University of Arkansas by the Department of Civil Engineering in Fayetteville, Arkansas.
The authors gratefully acknowledge the talents and efforts of undergraduate research assistants John Ryan, Derec Bass, and Anna Keogh. Industry partners Paragon Technical Services, Inc., Hutchens Construction Company, L & W Environmental, Inc., and R.K. Hall Construction Ltd. are also greatly appreciated for their roles in the successful completion of this project.
TRC 1101 – Final Report
80
References
Bauman (2005). “Asphalt Shingle Recycling in Massachusetts”. The Home Depot Foundation. Bennert and Williams (2009). “Precision of AASHTO TP62-07 for Use in Mechanistic-Empirical Pavement
Design Guide for Flexible Pavements. Paper No. 09-3228. Prepared for the Annual Meeting of the Transportation Research Board, Washington D.C. CD-ROM.
Brock, James D. (1987). “Method and Apparatus for Recycling Roofing Shingles as an Additive to Asphalt
Paving Composition” U.S. Patent Number 4,706,893. Button, Williams, Scherocman (1995). “ROOFING SHINGLES AND TONER IN ASPHALT PAVEMENTS”.
Texas Transportation Institute. Research Report 1344-2F. C & D World (2012). “Gathering State Specs for RAS”, C&D World, July/August 2012, pp. 31-32. C & D World (2012). “Illinois DOT Study Supports Use of Shingles in Roads”, C&D World,
September/October 2012, pp. 23-30. Cascione, A., Williams, R.C., Haugen, D., Marataneu, M., and J. McGraw (2010). “Performance of
Recycled Asphalt Shingles in Hot Mix Asphalt”, Pooled Fund Study TPS-5(213).
Dougan, C.E., Stephens, J.E., Mahoney, J., and G. Hansen (2003). “E* - Dynamic Modulus Test Protocol – Problems and Solutions”, Report No. CT-SPR-0003084-F-03-3, Connecticut Transportation Institute, University of Connecticut, Storrs, Connecticut.
Grodinsky, Plunkett, Surwilo (2002). “Performance Of Recycled Asphalt Shingles For Road Applications”.
Vermont Agency of Natural Resources. Grzybowski, K. (1993). “Recycled Asphalt Roofing Materials – A Multi-Functional, Low Cost Hot-Mix
Asphalt Pavement Additive”, Use of Waste Materials in Hot-Mix Asphalt, ASTM STP 1193, H. Fred Waller, Ed., American Society for Testing and Materials, Philadelphia.
Hall, Ralph (2010). “Strategic Energy Plan (StEP) For Arkansas State Highway and Transportation
Department”. 10324 Interstate Highway, Little Rock. Hanson, Foo, Lynn (1997). “Evaluation of Roofing Shingles in HMA”. National Center for Asphalt
Technology. Krivit, Dan (2010). “RAS in HMA: Understanding of Value Grows”. www.cdworldmag.com, accessed July
2011. Mallick, Teto, and Mogawer (2000). “Evaluation of Use of Manufactured Waste Asphalt Shingles in Hot
Mix Asphalt”. Chelsea Center for Recycling and Economic Development. Marks, and Petermeier (1997). “Let Me Shingle Your Roadway”. Iowa Department of Transportation.
TRC 1101 – Final Report
81
Maupin, W. (2010). “Investigation of the Use of Tear-Off Shingles in Asphalt Concrete”. Virginia Transportation Research Council. FHWA/VTRC 10-R23.
McGraw, Zofka, Krivit, Schroer, Olson, Marasteanu (2007). “Recycled Asphalt Shingles in Hot Mix
Asphalt”. Journal of the Association of Asphalt Paving Technologies. Volume 76. Mn/DOT (2012). “3139 Graded Aggregate for Bituminous Mixtures”, 2012 Version, revised 3/30/12,
Minnesota Department of Transportation. Nam, Tran (2005). “Characterizing and Predicting Dynamic Modulus of Hot-Mix Asphalt for Mechanistic-
Empirical Design Guide”. ProQuest Dissertations and Theses. Newcomb, Stroup-Gardiner, Weikle, Drescher (1993). “Influence of Roofing Shingles on Asphalt
Concrete Mixture Properties”. Minnesota Department of Transportation MN/RC-93/09. O’Gara, Ryan (2002). “Glenn CASE STUDIES” SKB Environmental, Roofing Shingles & Roads, Minnesota
Office of Environmental Assistance and Minnesota Department of Transportation. Paulsen, Stroup-Gardiner, Epps (1987). “Recycling Waste Roofing Material in Asphalt Paving Mixtures”.
Transportation Research Record. Volume 1115. Scholtz, Todd (2010). “Preliminary Investigation of RAP and RAS in HMAC”. Oregon Department of
Transportation. Report SR 500-291. Schroer, Joe (2010). “USE OF RECYCLED SHINGLES IN MISSOURI”. <www.p2pays.org>. Tighe, Hanasoge, Eyers, Essex, Damp (2008). “Who Thought Recycled Asphalt Shingles (RAS) Needed To
Be Landfilled: Why Not Build A Road”. Transportation Association of Canada. Watson, Johnson, and Sharma (1998). “Georgia’s Experience with Recycled Roofing Shingles in Asphaltic
Concrete”. Transportation Research Record 1638. Williams, S.G. and Porter, A.M. (2012). “An Investigation of Warm Mix Asphalt Design and Construction”.
Final Report TRC-1004, Arkansas State Highway and Transportation Department, Little Rock, Arkansas, July 2012.
www.rotochopper.com. (2010) <www.rotochopper.com>. accessed August 1, 2010. www.shinglerecycling.org (2009). “State Experience” http://www.shinglerecycling.org/content/state-
experience-recycling-asphalt-shingles, accessed May 2009.
www.shinglerecycling.org (2011). “State Experience” http://www.shinglerecycling.org/content/state-experience-recycling-asphalt-shingles, accessed July 2011.


