i sök Recycling of CIGS solar cells: an investigation of a possible separation process with solvent extraction Master of Science Thesis in the Master Degree Program, Materials Chemistry and Nanotechnology FILIP HOLMBERG Department of Chemical and Biological Engineering Division of Nuclear Chemistry CHALMERS UNIVERSITY OF TECHNOLOGY Gothenburg, Sweden, 2014
Transcript
i
sök
Recycling of CIGS solar cells: an investigation of a possible
separation process with solvent extraction
Master of Science Thesis in the Master Degree Program,
Materials Chemistry and Nanotechnology
FILIP HOLMBERG
Department of Chemical and Biological Engineering
Division of Nuclear Chemistry
CHALMERS UNIVERSITY OF TECHNOLOGY
Gothenburg, Sweden, 2014
i
Recycling of CIGS solar cells: an investigation of a possible
separation process with solvent extraction
FILIP HOLMBERG
Department of Chemical and Biological Engineering
Division of Nuclear Chemistry
CHALMERS UNIVERSITY OF TECHNOLOGY
Gothenburg, Sweden, 2014
ii
Recycling of CIGS solar cells: an investigation of a possible
6.1 Conclusions of leaching experiments .......................................................................................... 31
6.2 Conclusions of the solvent extraction and stripping experiments .............................................. 31
7 Future work ........................................................................................................................................ 32
A Calculations ........................................................................................................................................ 36
A.1 ICP-OES data ................................................................................................................................ 36
A.2 ICP-MS data ................................................................................................................................. 36
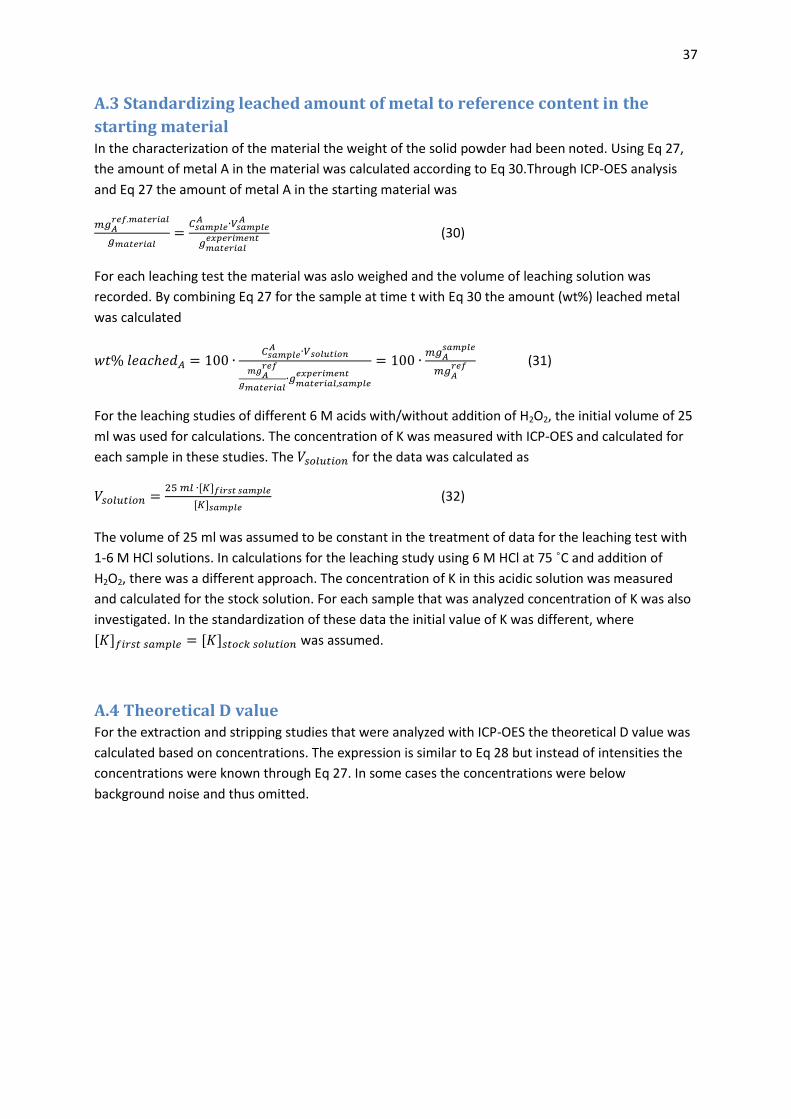
A.3 Standardizing leached amount of metal to reference content in the starting material............. 37
A.4 Theoretical D value ..................................................................................................................... 37
A.5 amount (% recovered) from the organic phase .......................................................................... 38
B Experimental ...................................................................................................................................... 39
B.1 Chemical specification ................................................................................................................. 39
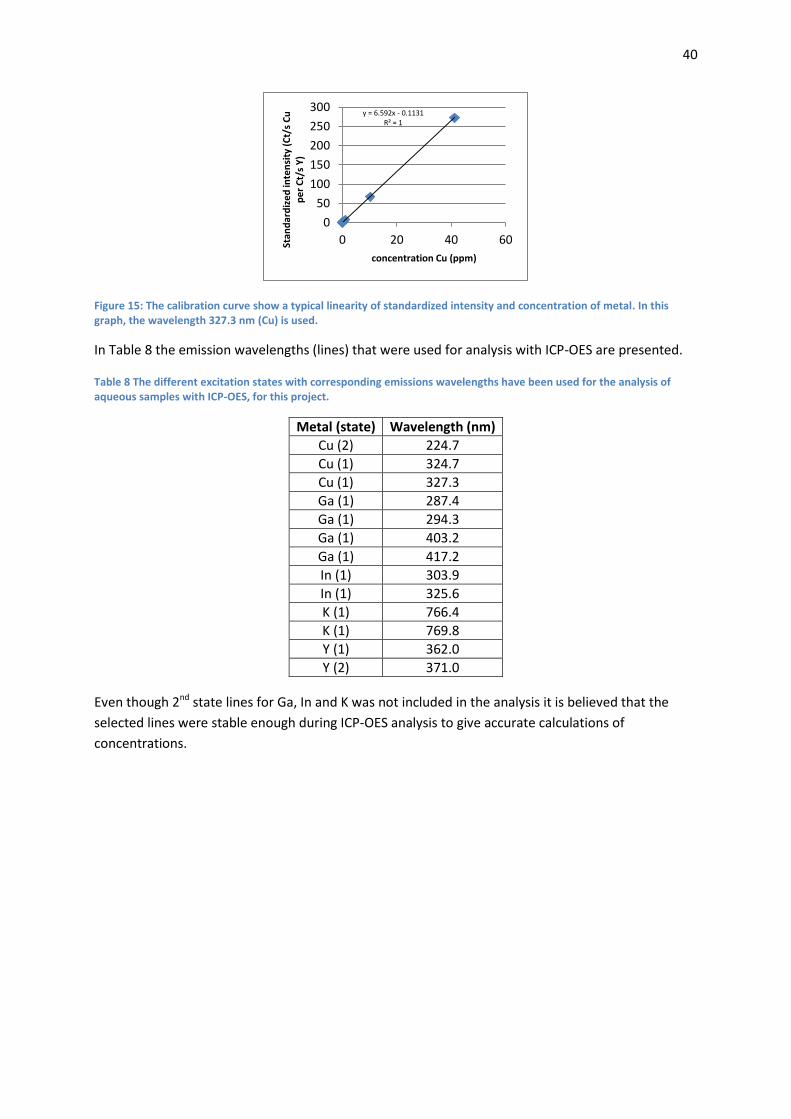
B.2 ICP-OES Analysis and calibration ................................................................................................. 39
C Additional results from the screening of extractants experiment ..................................................... 40
1
1 Introduction There is a need of renewable energy sources for progress into a more sustainable society. This idea has its origins from the Brundtland report by the UN from 1987 [1]. Since its publication the global discussion on the energy sector has evolved. Today one of the key problems that has to be addressed is the emission of greenhouse gases. These emissions are potentially responsible for the global warming and can possibly have negative consequences for the environment, global economy and societies [2]. In the context of sustainability the photovoltaic (PV) technology can make significant contributions to the global energy market. In the last two decades the PV industry has developed a lot [3]. Besides increased production, the economic interest of this technology has boomed. In 2012 the investments in this industry was $240 billion which correspond to 57 % of the total investments in the renewable energy sector. As a consequence, the production of waste has also increased. Without considering the mining of raw material, the PV waste can be categorized into production and end-of-life module wastes [4]. Recycling of these wastes can be argued from environmental, political and economic perspectives [5-8]. In particular, it is the scarcity of material that is highlighted as one of the main motives of recycling of these materials. Among many metals that are used in PV production In, Ga, Te and Se have been emphasized as critical [9-11]. The term critical point out that these metals that have a high risk of becoming bottlenecks in the deployment of technologies. It is believed that in the context of material scarcity the recycling of PV waste is important. Fortunately there are several methods to recycle PV waste available [5, 6, 8, 11-15]. The diversity of
these methods can be beneficial in terms of securing secondary production of critical metals. Many
of the materials that are used in PV modules are produced as byproduct from major metals [16].
With this observation it is believed that more exploration of recycling methods can help recover a
portion of these consumed critical metals. A more diverse set of recycling methods could possibly
also assist the progress of recycling of PV waste.
In one of the previously mentioned recycling methods, Gustafsson et al. (2012) was able to separate
Se from CIGS material [15]. However, the residual oxidized material containing mostly Cu, In and Ga
had not been separated. The authors concluded that there was a need of developing separation
methods for this residual material. Thus, in the present thesis an investigation for a separation
method of the oxidized residual material will be described. The study could therefore contribute to
development of a complete recycling process of CIGS modules. An additional recycling route to
recover Se, In and Ga could ease the pressure on the PV industry to resolve issues with its waste.
Subsequently this could mean that the industry can focus its business on to further establish PV
modules on the global energy market. In this event the global energy consumption can take further
steps on the sustainable path.
2
1.1 Aim and approach The aim of this project is to investigate a possible method to separate Cu, In and Ga from each other.
This separation is investigated with the residual oxidized material that is produced in the separation
process, which is described by Gustafsson et al. (2012).
A hydrometallurgical process was investigated: leaching of the metals from the solid matrix, followed
by the separation of Cu, In and Ga using solvent extraction. Both extraction and stripping are
potentially feasible ways to achieve separation between the metals.
3
2 The Hydrometallurgical process A hydrometallurgical process is a method to recover and purify metals. It is used to treat both ore
and metal waste. It can be divided into the four subsequent steps: leaching, separation,
concentration and reduction to metals [17]. The theory of leaching is described in section 2.1. In this
thesis the separation and concentration is investigated using solvent extraction, which is described in
section 2.2. Other possible separation methods are ion-exchange and membrane separation. Even if
it is important, the step of reduction to metals is beyond the scope of this thesis. Still some important
aspects of this process are good to keep in mind. Reduction to metals can be performed with
cementation, precipitation by gaseous reduction and electrolysis [17]. The choice of which process
should be used is a compromise based on limiting factors. Such limitations can be the chemical
properties of the metals, economic aspects and demand on the purity of the product.
In terms of separation, solvent extraction is comprised of three steps: extraction, scrubbing and
stripping [18]. A simplified scheme for such a system has been described by Rydberg (1992) and can
be seen in Figure 1.
Figure 1: A simplified depiction of the description given by Rydberg (1992) for an arbitrary solvent extraction process [19].
The leaching process provides the initial feed with metals which meets the solvent, containing
extractant. The metal is transferred to the organic phase and is scrubbed from unwanted co-
extracted components. In the stripping step the components of interest are back-extracted to
another aqueous solution. This is a step which also provides possibilities to separate the desired
metals. The loaded stripping solution continues to the product recovery step (i.e. electro winning).
An important feature in Figure 1 is that liquids can be recirculated. These possibilities to reuse the
flows are important for both environmental and economic reasons [19].
4
2.1 Leaching The leaching process is the first step in the hydrometallurgical recycling route of metals. The solid
waste is contacted with an aqueous solution containing with leaching agents. This will dissolve the
soluble species from the solid to the leaching liquid [20]. The efficiency depends on many
parameters including concentration of leaching agent, contact time, temperature, stirring, liquid to
solid ratio and pretreatment methods [21]. Pretreatment by e.g. grinding can increase the availability
of the soluble material and surface area of the solid. This is done to liberate the components that are
to be leached [20]. For an industrial process it is preferable that the leaching step is fast [21].
2.1.1 Kinetics of dissolution
The kinetics of dissolution of metal oxides can be controlled by different processes. With
simplifications, some of the important parameters which are used in the current project can be
explained. According to Geankoplis (2003), it is the mass transfer from the solid surface to the liquid
solvent that is the rate determining step. The author showed that the rate of accumulation of a
solute A in the solution could be described by Equation 1.
( ) (1)
In this equation (Eq 1) the variables correspond to the solution (V), particle surface area (A), mass
transfer coefficient ( ), saturation concentration of A ( ) and concentration of A in the solution
at each time t ( ). By integrating from t = 0 to t = t and = to = Eq 1 can be solved to
(2)
When the concentration of A is plotted against time, a leaching kinetics curve is obtained [22]. If
unknown parameters in Eq 2 are set to constant values, plotting against time will result in a
parabolic shape (Figure 2). As can be seen from Eq 2, some parameters influence the dissolution rate
of the solid. The parameters that are pointed out are the size of particles, solution volume, leaching
time and solubility of the material. In addition, the mass transfer coefficient is also important.
Therefore stirring is also important as it can increase this coefficient.
Figure 2: A typical dissolution rate when the mass transfer of A to the solution is the rate determining factor.
0
25
50
75
100
0 1 2 3 4 5
% le
ach
ed
time
5
2.1.2 Solubility in leaching
Once the metal is in solution, the total solubility is dependent on a series of equilibrium reactions. In
the work of Blesa et al. (1993) general reactions of hydrolysis for an arbitrary metal is provided [23]
(3)
(4)
(5)
(6)
(7)
(8)
(9)
These equations (3-9) point out the complexity of hydrolysis even in a simplified case. The source of
these equations did not present them in the same context, but it can be interpreted that it is the
distribution and solubility of complexes that is of importance for the overall solubility. By introducing
other species into a solution additional complexes and species distribution can become available.
This thought serves as a conceptual understanding of why different leaching agents and system
variables (i.e. temperature etc) have an impact on the leaching process. In section 2.1.3 a literature
review of leachants is presented.
Another important aspect of leaching is redox reactions which can be an accessible way to bring
stable solids into solution. Due to changes in the oxidation state of the metal ion it may also change
its properties of hydrolysis [23]. Therefore addition of an oxidation agent, e.g. O2 or H2O2, into the
leaching solution can provide improved leaching properties.
6
2.1.3 Literature review of leaching agents
Various leaching agents, also referred to as leachants, can be used to leach the material [21]. There
are four types of leachants: water, acid, alkaline and salt solutions. Water is, not surprisingly,
applicable on solids which are water soluble. It is understood from Gupta and Mukherjee (1990) that
salt solutions can involve foreign metal ions present in solution [24]. These foreign metals could end
up as detrimental impurities in the recovered product. Undesired metals in the final product can
however be avoided by additional cleaning processes. In the best scenario impurities is avoided
without any additional modifications to the process. Since there are the options of using an alkaline
or acid solution, the salt leachant seem coupled with unnecessary risks that make the recycling
method more tedious.
2.1.3.1 Alkaline agents
Alkaline dissolution has a potentially great advantage in dissolution rate compared to acids. This is
because a base attacks the lattice faster than an acid [23]. From this aspect the chemical behavior, of
Cu, Ga and In, in the waste material needs to be reviewed. Both metallic gallium and its oxide Ga2O3
was reported to be very slowly dissolved in alkaline solution at moderate temperature [25]. It was
observed that Ga(OH)4- (aq) was the only complex of significance from low to high concentrations of
gallate and base. For metallic In, the use of boiling caustic alkaline has no effect on its dissolution
[26]. However, it was stated that the same solid was easily dissolved in hot HCl and HNO3 while more
slowly in dilute H2SO4 and HCl. Cu is well known to form insoluble complexes in aqueous media.
Depending on concentration of Cu, the metal starts to precipitate at pH 4-6 [20]. In alkaline media, it
has also been reported to form insoluble species [27]. From these observations, the feasibility to use
alkaline leachants to dissolve the starting material studied in this project appears to be unlikely.
2.1.3.2 Acidic agents
The mineral acids HCl, H2SO4 and HNO3 are some of the most important acids in ore processing [24].
H2SO4 is the most commonly used and cheapest mineral acid [20]. It has been used to leach many
different oxides. A more expensive option is to use HNO3, which has good oxidizing capabilities. The
third leachant, HCl, is non-oxidizing and have been used for processing complex metal oxides. It is
believed that these mineral acids should be initially studied for leaching of the starting material in
the current project. These should suffice for a scale up recycling process, as these acids are currently
used in the hydrometallurgy industry.
7
2.2 Separation using solvent extraction Solvent extraction is a common separation technique that it used in many applications: analytical
chemistry, industrial separation processes for inorganic waste, pharmaceutical and biochemical
industries [19]. In order to make it more relevant, the discussion in this section will be from a waste
treatment point of view. The presented theory can, however, be extended to other applications.
The separation from a waste stream occurs when a solute is distributing between two immiscible
phases, namely the aqueous and an organic phase. These two solutions are very different in polarity
and so components are differently soluble in respective phase. The aqueous phase is polar and is
able to carry both neutral and charged species. The organic phase is usually nonpolar and can
therefore only carry neutral species. When a neutral component A is added to either phase it will
distribute between them, as described by Equation 10.
(10)
The mass transfer between the phases can be explained by the chemical potential ( ). This property
has been described as the tendency of the solute to escape its physical state [28]. In the context of
phase equilibrium, this means that a component has a tendency to change to another phase. The
distribution has reached equilibrium when is equal in both phases. In either medium it is expressed
by
(11)
where the is the standard state and refers to the activity of specie A. Eq 11 can be rewritten
to Eq (12), with the assumption .
(12)
When Eq 12 is valid for both respective phase, the equilibrium process in Eq 10 can be reformulated
as
(13)
The derivation in Eq 12 show that the distribution constant ( ) is constant, if the activities are the
constant. Using low concentrations of metals, in the practical experiments, therefore provides a
constant distribution. In the context of constant distribution the results can be compared to previous
works.
This single equilibrium reaction of Eq 10 is rarely the case and more mass transfer reaction between
the phases needs to be accounted for. It is therefore more convenient to express the overall
distribution as the distribution ratio (D value),
∑
∑
(14)
and includes all of the chemical states of the solute in respective phase. If the phase ratio
8
(15)
is not at unity the distribution is expressed as the distribution factor,
(16)
In a mixture of different metals (A and B) in the aqueous solution, it is the difference in distribution
that makes a separation possible,
(17)
If this ratio is unity, no separation occurs. By contacting the organic phase loaded with metal with a
different aqueous phase, the extraction can be reversed (stripping). This stage also provides a
possibility of separation that is also expressed with Eq 12-17.
To enable or enhance extraction of a solute, the solvent is usually loaded with specific organic
molecules (extractants). The extractant is used to increase the solubility of the aqueous solute in the
organic phase and thereby increase the D value. The concentration of extractant should be kept low
and at the same time be at excess compared to metals. With this practice the activities of extractants
become constant throughout the extraction experiment.
The leaching solution contributes to a lot of important aspects of extraction. Sometimes this solution
is associated to high ionic strengths that can affect the extraction a lot. That is, a pH sensitive
extraction can be useless in very acidic solutions. In extreme solutions, e.g. high acidic or alkaline, pH
adjustments are inappropriate for an economic reason. Solvent extraction processes use large
volumetric flows and so changing the temperature for better separation can also be expensive [19].
9
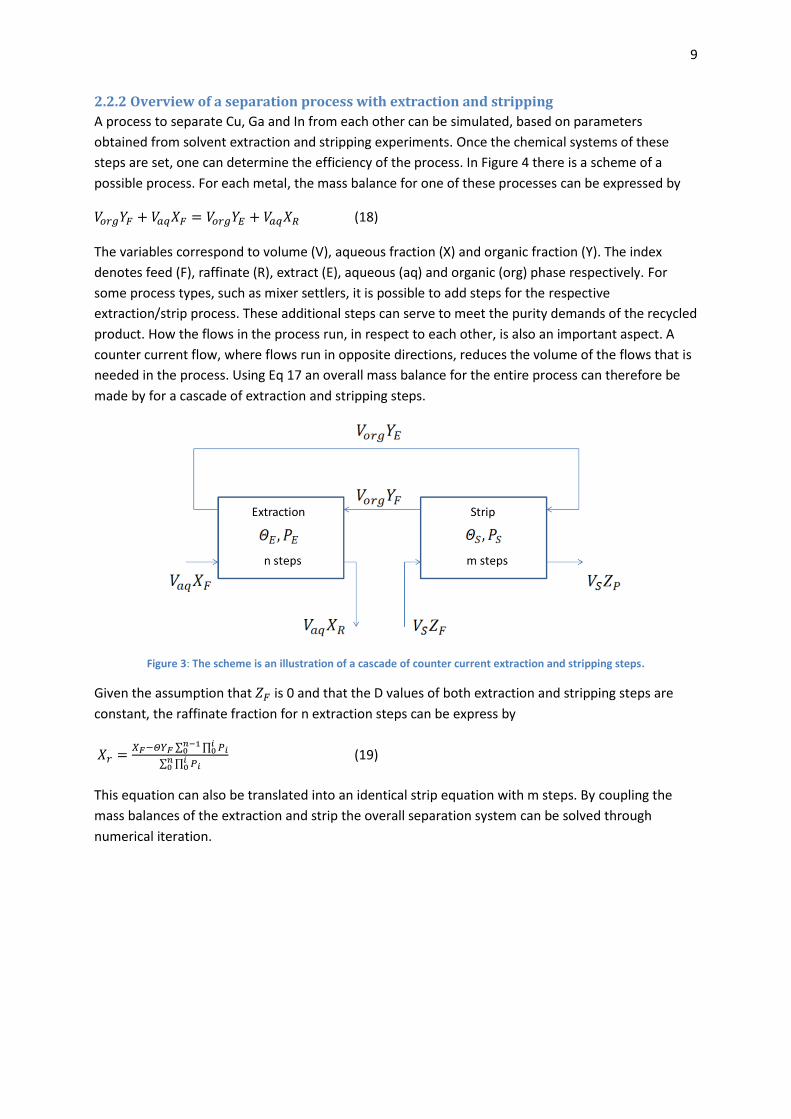
2.2.2 Overview of a separation process with extraction and stripping
A process to separate Cu, Ga and In from each other can be simulated, based on parameters
obtained from solvent extraction and stripping experiments. Once the chemical systems of these
steps are set, one can determine the efficiency of the process. In Figure 4 there is a scheme of a
possible process. For each metal, the mass balance for one of these processes can be expressed by
(18)
The variables correspond to volume (V), aqueous fraction (X) and organic fraction (Y). The index
denotes feed (F), raffinate (R), extract (E), aqueous (aq) and organic (org) phase respectively. For
some process types, such as mixer settlers, it is possible to add steps for the respective
extraction/strip process. These additional steps can serve to meet the purity demands of the recycled
product. How the flows in the process run, in respect to each other, is also an important aspect. A
counter current flow, where flows run in opposite directions, reduces the volume of the flows that is
needed in the process. Using Eq 17 an overall mass balance for the entire process can therefore be
made by for a cascade of extraction and stripping steps.
Figure 3: The scheme is an illustration of a cascade of counter current extraction and stripping steps.
Given the assumption that is 0 and that the D values of both extraction and stripping steps are
constant, the raffinate fraction for n extraction steps can be express by
∑ ∏
∑ ∏
(19)
This equation can also be translated into an identical strip equation with m steps. By coupling the
mass balances of the extraction and strip the overall separation system can be solved through
numerical iteration.
10
2.2.3 Literature review of extractants
This section gives a literature review of suitable extractants that possibly can be used to separate Cu,
In and Ga from each other. Some other general aspects of extractants are also provided. The choice
of reagent must take the conditions of the leaching solution in consideration. The results from the
leaching study, in section 4.2-4.5, favored an HCl aqueous solution. Hence, the focus of this project
has been on extraction from chloride media (Table 1). There may, of course, be other extractants
that have not been detected in previous scientific papers.
Table 1 A summary of literature found for this project, that involves extraction of Cu, In and Ga in chloride media.
Extracting agent
Extraction mechanism
Metal(s) of interest Diluent Reference
Cyanex 272 Acidic [29] Cu, In, Ga Kerosene [30]
Cyanex 923 Solvating [29] Cu, Ga Kerosene [31]
LIX 984 Acidic [32] Cu Kerosene [33]
TOPO Solvating [29] In, Ga n-hexane [34]
TOPO Solvating [35] Cu, In, Ga Cyclohexane [36]
TBP Solvating [29] Cu, In, Ga Benzene/TBP [37]
TBP Solvating [29] In Kerosene [35]
LIX 984 Acidic [32] Cu Kerosene [33]
D2EHPA Ion Exchange [38] In Kerosene [35]
The extraction of the three metals from chloride media have been previously studied, as seen in
Table 1. The table also shows that kerosene is a common diluent in these solvent extraction
conditions. In the following sections a more detailed discussion of the potential use of the
extractants is given. The extraction mechanisms Acidic, Solvating and Ion Exchange are respectively
described in Eq 20-22.
(20)
(21)
(22)
The following general criteria has been assigned by Gupta and Mukherjee (1990) to describe an ideal
extractant [24]:
Ability to extract a desired metal at the desired pH;
Selectivity towards desired components;
Acceptable rate during extraction, scrubbing and stripping;
High solubility in the organic phase and low solubility in the aqueous phase;
Stability throughout the steps named in the third point of this list.
It was also pointed out by these authors that in reality a balance between these aspects must be
found. In addition to this list, the separation time of organic/aqueous phase need to be adequately
fast. All of these aspects have not been evaluated in this project. However, the suitability of
suggested extractants in Table 1 can be argued from another point of view. Namely that all
11
extractants have been listed as commercially available [19, 39]. For at least two of the extractants,
Cyanex 272 and Cyanex 923, the stability of extraction in HCl media was previously verified [30, 40].
Depending on HCl concentration in the aqueous phase Cyanex 272 (di-2,4,4-trimethylpentyl-
phosphinic acid) has been found to extract both In and Ga but not Cu [30].The proposed mechanism
of extraction for both metals at lower acidities (0.1-0.01 M) was
(23)
Whereas at higher acidities (> 1M) the extraction mechanism of Ga was suggested to be
(24)
This idea is of great interest since it shows that one reagent could possibly have two reaction
mechanisms, depending on the aqueous phase. Hence, other extractants may perhaps have the
same properties. In the mentioned work, from aqueous phases above 1.0 M HCl, In was not as
efficiently extracted as Ga. This suggests that Cyanex 272 can be useful in separation of Ga and In,
which was also pointed out by the authors of the study. This reagent has also been used for Cu
extraction in sulfate media [41, 42].
2.2.3.2 Cyanex 923 (A blend of trialkylphospine oxides)
Cyanex 923 is a mixture of trioctylphosphine, dioctylmonohexylphosphine, trihexylphospine,
dihexylmonooctylphosphine oxides [21]. It has been used to extract Ga from chloride media [31].
Even in the presence of Cu, Ga was still quantitatively extracted. However, some Cu was co-
extracted. The aqueous phase used in this study was HCl at concentrations from 0.5 to 7 M. The peak
extraction of Ga occurred at 5 M HCl which indicates that Cyanex 923 is an interesting extractant to
investigate further in the separation of Ga from Cu. Another important observation was a suspected
salting out effect at lower acidities. The salting out effect means that the distribution ratio is
increased with increasing salt concentration in the aqueous phase [19]. Thus, the extraction is
sensitive to the HCl concentration in the aqueous solution.
2.2.3.3 TBP (Tri-n-butylphosphate)
The use of TBP (Tri-n-butylphosphate) in solvent extrcation is sometimes associated with a high
extractant/diluents ratio. Up to 100 vol% of this reagent have been used directly on the aqueous
phase [24]. However, it was showed by Virolainen et al. (1967) that In could be extracted almost
quantitatively using 1 M TBP in kerosene from 6-8 M HCl aqueous solutions [35]. In another study by
De and Sen (1967), 100 vol% TBP phase also extracted In from 6 M HCl solution where Cu was co-
extracted [37]. The same work also showed 20 and 25 vol%, in benzene, could extract Ga
quantitatively from 6 and 4 M solutions respectively. Giving these literatures it is interesting to
investigate the extraction with TBP on a solution of all the three metals Cu, In and Ga. Doing so with
0.1 M TBP in kerosene could also contribute to more knowledge of its behavior at lower
concentrations.
12
2.2.3.4 TOPO (Tri-n-octylphosphine oxide)
TOPO (Tri-n-octylphosphine oxide) is a constituent of Cyanex 923. Using TOPO, the extraction of Cu,
In and Ga from HCl solutions have been previously studied in literature. Using cyclohexane as diluent,
Ga was extracted with good results from solutions at 6-7 M HCl [36]. The presence of In and Cu (each
at 10 ppm) did not have any significant influence of the extraction of Ga. Another study by Hasegawa
et al. (1979) was done using this extractant [34]. In this presented data, Ga starts to extract when the
aqueous solution is above 0.1 M HCl. In was not extracted when the concentration of HCl increased.
However, the concentration was not increased much over 1 M HCl in this work. Thus, it remains
unclear if TOPO is useful to extract Cu, In and Ga from more concentrated HCl phases. The impact of
using kerosene as diluent, rather than cyclohexane, is also of interest to investigate.
2.2.3.5 LIX 984 (A blend of LIX 84 and LIX 860)
The LIX 984 is a 1:1 volumetric mixture of LIX 84 and LIX860 (2-hydroxy-5-nonylacetophenone oxime
and 5-dodecylsalicylaldoxime, respectively) [43]. In dilute HNO3, LIX 984 has been successful to
separate Cu, In and Ga by varying the pH [32].
Extraction of Cu from chloride solutions, using LIX 984, has been compared with other similar LIX
extractants (84-I, 612N-LV and XI-04003). The results presented by Lu and Dreisinger (2013) showed
that LIX 984 was better to use than the other mentioned extractants, in terms of extraction and
loading capabilities [44]. The extraction was carried out through pH adjustments. At the same time it
was also reported that Cu could be stripped using a 6 M HCl solution. Furthermore, extraction of Cu
was reduced when Fe(III) extraction increased, but not for other investigated impurities. Since Fe(III)
was extracted, it is possible that LIX 984 can be used to extract Ga and In from chloride media, which
both are at the (+3) oxidation state.
2.2.3.6 D2EHPA (Bis(2-ethylhexyl)phosphoric acid)
Indium has been reported to be extracted quantitatively from HCl phases up to 0.6 M acidity using
D2EHPA (Bis(2-ethylhexyl)phosphoric acid) [35]. In terms of Cu and Ga extraction with this reagent in
HCl, it seems to be a lack of available information. It was however described by Ren et al. (2007) that
a solvent loaded with Cu could be stripped using HCl medium (most effective at 6 M) [38]. Due to this
observation, it is indicated that D2EHPA is not well suited to extract Cu from HCl solutions.
Investigations still has to be performed in terms of Ga to discover its possible usability in the present
project. From other aqueous media, more work using this reagent has been done. The results from
Lee et al. (2002) showed good extraction of Ga and In from dilute H2SO4 solutions, where selectivity
was towards In [45]. Extraction of Cu has also been conducted from HNO3 phases [46].
13
3 Experimental The aim of this section is to provide an overview of the experimental methods that were performed
in this project. The starting material that was used for the experimental investigations of this project
is described in section 3.1. In order to characterize the material digestion experiments were
conducted (section 3.2). The aim of these studies was to couple the results of other leaching
experiments to each other.
The studies that relates to leaching of starting material are
Leaching with different acids (section 3.3)
Leaching with different acid concentrations (section 3.4)
Leaching at elevated temperature (section 3.5)
Studies of possible extraction conditions were conducted using only HCl media,
Screening of extractants (section 3.6)
The conditions that seemed best at separating Cu, In and Ga was then focused on. It was interesting
to both investigate the kinetics of these extractions and a possible way to separate the metals
through stripping,
Kinetic study of TOPO and Cyanex 923 (section 3.7)
Stripping with EDTA and HCl (section 3.8)
A process flow sheet was calculated based on the results of the leaching, extraction and stripping
studies. This simulation is described in section 3.9.
The details of the chemicals used in this project can be reviewed in appendix A.
In the analyses of the samples for the various experiments, Y was used as an internal standard. The samples were analyzed with ICP-OES (Thermo iCAP 6500) except those of the screening of extractants study, which were analyzed with ICP-MS (Elan 6000, PerkinElmer). For ICP-OES analysis, 0.1 M supra pure HNO3 was used to dilute the samples. Samples containing EDTA were diluted with MilliQwater. The calibration of the intensities that were obtained in ICP-OES analyses are described in appendix B. Samples analyzed with ICP-MS were diluted with 0.5 M supra pure HNO3. The intensities of the measured samples were converted into various numerical values, and the
details of these conversions are described in appendix A. For all the experiments in this project, the
samples were collected from aqueous phases. Due to practical limitations the organic phases in the
solvent extraction/stripping studies could not be analyzed. Therefore, the results from solvent
extraction investigations are based on mass balances from analyzed metal concentration before and
after extraction. Thus, verification of these results needs to be verified by stripping tests or literature.
14
3.1 The starting material The material that is investigated in this project originates from CIGS waste material of sputtering
targets that was provided by a solar cell producer. Before this waste was used the CIGS material went
through a pyrometallurgical process developed by Gustafsson et al. (2014). In brief the following
order of procedures was performed in accordance to this process,
The CIGS material was reduced to a particle size of less than 6 µm using a mortar and sieves.
Roughly 15 g of CIGS particles was transferred into a furnace boat which was then put into a
tube furnace. A picture of this set up is given in Figure 4.
When the temperature of this furnace was increased to 600 ˚C a flow of nitrogen gas (200
ml/min) was used. Oxygen gas flow (200 ml/min) was allowed to flow through the tube
furnace. The temperature continued to rise and then allowed to settle at 800 ˚C.
The experiment was allowed to continue for 2 h before the oxygen gas flow and furnace
heating was switched off. A flow of nitrogen gas was switched on meanwhile the sample
cooled in room temperature for more than 12 h.
Figure 4: The experimental set up where the CIGS particles are put into a furnace boat that is placed in the tube furnace (image adapted from Gustafsson et al. (2014) later modified by Gustafsson, A.M.K (2014)).
At the left exist of the glass cylinder that was put into the tube furnace in Figure 4 there had been a
deposition of SeO2 that resulted in crystal formations during the experiment. These crystals were
scraped out before collection of the residual CIGS material. This collected CIGS material also referred
to as the starting material. Before the material was used for the leaching experiments it was grinded
into particle sizes of 63-355 m (using a mortar and sieves).
Gustafsson et al. (2014) have determined the crystal structures for their oxidation products obtained
at 800 ˚C with X-ray diffraction analyses. The results showed these products also contained oxygen.
15
3.2 Characterization of the starting material The characterization of the starting material was done by acid digestion. 12 ml aqua regia (3:1 vol ratio of concentrated HCl:HNO3) heated to 75 ˚C was used to dissolve the starting material. In the initial experiments 0.5 g of material was used. This amount was later on changed to 0.1 g. The dissolution was done in a 100 ml polypropylene container with a magnetic stirring rate of 500 rpm for 4 h. During this period 0.5 ml H2O2 was added each hour. MilliQwater was also added to maintain the volume of the solution. The solution was diluted to 50 ml before sampling this liquid.
3.3 Leaching with different acids The screening tests of acids were performed at room temperature by two procedures, with and
without H2O2, up to 8 h. For each study 0.5 g starting material was added to a propylene container,
100 ml with lid. 25 ml of 6 M acid solutions of HCl, HNO3 and H2SO4 was respectively used as
leachants. The acids had been spiked with 0.5 g/l KCl. For the experiments where H2O2 was added,
the concentration of K was measured so that the volume change could be calculated.
The leaching without H2O2 was performed using magnetic stirring at a rate of 600 rpm for 50 min. The
stirring was switched off and a sample was collected after 10 min of sedimentation.
In studies with H2O2 the magnetic stirring was also 600 rpm. The H2O2 was added at a rate of 0.04
ml/min using a Gilson Minipuls 2 pump. Between replicate studies the position of tubes on the pump
were changed. This was done so that differences of pump rate, due to tube positions, were taken
into consideration. H2O2 was added for 45 min and the magnetic stirring was allowed to continue for
an additional 5 min. A sample of the solution was collected after 10 min.
3.4 Leaching with different acid concentrations Since the HCl acid showed the best leaching efficiency, additional studies using HCl at different
concentrations (at 1, 3 and 6 M) were performed at room temperature. The experimental procedure
was the same as for the previously mentioned screening test when HCl, HNO3, H2SO4 was used
without addition of H2O2 (described in the previous section 3.3). The only deviation was that
collection of samples occurred up to 98 h.
3.5 Leaching at elevated temperature
The starting material was leached with 25 ml 6 M HCl and addition of H2O2 at 75 ˚C for up to 8 h. The
leaching of 0.5 g material was performed using a heated reaction vessel (quartz). This vessel was
connected to a heating radiator with water pump. A known amount of KCl had been added to the HCl
solution so that the volume change, during the experiment, could be recorded.
Magnetic stirring was set to 600 rpm and addition of H2O2 was controlled with a 905 Titrando
(Metrohm) in two settings. In the first setting 1 ml H2O2 was added for 20 min. The stirring continued
5 min after the titration had stopped. In the second setting, 2 ml H2O2 was added for 50 min and the
stirring continued for 55 min. For both settings a sample of the solution was taken 5 min after the
stirring had stopped.
16
3.6 Screening of extractants The organic solutions that were investigated were 0.1 M of TBP, D2EHPA, Cyanex 923, Cyanex 272,
TOPO and LIX 984, respectively in kerosene. These solutions were mixed with aqueous solutions of
0.01-6 M HCl, loaded with metals. The aqueous phases were prepared by diluting spent leaching
solutions that were produced in the previous studies, described in section 3.5. The solutions were
prepared so that 1.7 mM of total metal concentration was obtained in each solutions with the
respective final concentration of 0.01, 0.1, 1, 3 and 6 M HCl. The composition of the three metals in
these solutions was 45 mol% (Cu), 13 mol% (Ga) and 42 mol% (In).
In each extraction systems the volumetric ratio was unity. The shaking of vials was conducted in a
shaking machine (IKA Vibrax VXR basic) that was connected to a heating bath. By this setup the
extraction temperature maintained at 25˚C. The systems were shaken for 2 h at 1500 rpm. Before
sampling the aqueous phase the phases were allowed to separate for 5 min.
3.7 Kinetic studies of TOPO and Cyanex 923 The kinetic studies were performed on two of the extractants TOPO and Cyanex 923, respectively
diluted to 0.1 M in kerosene. Solutions with 1.7 mM metals at 3 M HCl was chosen as the aqueous
phase. The preparation of these aqueous solutions has been described in the previous section. The
choice of HCl concentration was made due to observations that had been made in the previous
screening study. Both TOPO and Cyanex 923 had showed the best extraction and separation between
the metals from 3 and 6 M HCl aqueous solutions. The 6 M HCl was, however, excluded in this study
as it had showed possible water entrainment in organic phase.
The experimental procedure for shaking was the similar to what is described in section 3.6. Vials with
equal volumes of organic and aqueous phase were shaken between 5-120 min. Additional
precautions were made when collecting a sample aqueous phase. Before ejecting the liquid, the
pipette tip was cleaned with a napkin and the outer most liquid was absorbed onto the paper.
3.8 Stripping with EDTA and HCl Stripping experiments were conducted on 0.1 M TOPO and Cyanex 923, respectively, in kerosene. A
solution of 3 M HCl with 1.7 mM metals was used as the aqueous phase. The preparation of this
solution and shaking procedure is described in section 3.6. The extraction systems, with equal
organic and aqueous volumes, were shaken for 1 h. The phases that were tested to strip these
organic phases of metals were 0.8 M HCl and 0.1 M EDTA respectively. Throughout three consecutive
strips, the volumes of organic and aqueous phase were equal and shaken for 20 min. The collection
of samples in both the extraction and stripping was the same as described in the previous section.
17
3.9 Modeling of a possible separation method The simulation of a separation process take into account the experimental results of the leaching,
extraction and stripping studies. How these results are coupled in the process is provided in Figure 6.
Cyanex 923 was used in the simulation as it was deemed as the most suitable extractant to separate
the metals. The leaching feed is 3 M HCl containing the three metals. The stripping agent, in the first
strip, is clean 3 M HCl. Subsequently 0.8 M HCl is used to strip the organic phase. Finally 0.1 M EDTA
recovers most of the residual metals in the organic phase. Some of the numerical results of the
leaching, extraction and stripping experiment provide the input data for this simulation. These can be
seen in Table 2.
Figure 5: The flow scheme of the proposed separation process includes one extraction and three stripping sub processes. Each process box can be divided into several steps. The notations include volume flow (V), aqueous fraction (X and Z) and organic fraction (Y). The index denotes feed (F), extract (E), strip (S) or raffinate (R and Pi).
Loaded solvent
Strip 2 (0.8 M HCl)
Strip 3 (0.1 MEDTA)
𝑃𝑆 𝛩𝑆
𝑚𝑠 𝑠𝑡𝑒𝑝𝑠
Extraction
𝑛𝐸 𝑠𝑡𝑒𝑝𝑠
𝑃𝐸 𝛩𝐸
𝑉𝑠 𝑍 𝐺𝑎
𝑉𝑠 𝑍𝐹
𝑉𝐸 𝑎𝑞 𝑋𝐹
𝑉𝐸 𝑎𝑞 𝑋𝑅 𝐶𝑢
𝑉 𝑜𝑟𝑔 𝑌𝐸 𝑉 𝑜𝑟𝑔 𝑌𝐹
𝑉 𝑜𝑟𝑔 𝑌𝑆
Strip 1 (3 M HCl)
𝑉𝑠 𝑍𝐹
𝑉𝑠 𝑍 𝐶𝑢
𝑃𝑆 𝛩𝑆
𝑚𝑠 𝑠𝑡𝑒𝑝𝑠
𝑉 𝑜𝑟𝑔 𝑌𝑆
𝑃𝑆3 𝛩𝑆3
𝑚𝑠3 𝑠𝑡𝑒𝑝𝑠
𝑉𝑠3 𝑍3 𝐼𝑛
𝑉𝑠3 𝑍𝐹3
(3 M HCl)
(Cyanex 923)
18
Table 2 Various parameters are required in a simulation of a separation process. The numerical results presented here are from the leaching, extraction and stripping results.
Initial feed Cu (mg/l) In (mg/l) Ga (mg/l)
67.9 19.0 106.8
process D value (Cu) D value (In) D value (Ga)
Extraction 0.27 69.21 449.60
Strip 1 0.27 69.21 449.60
Strip 2 0.29 35.79 0.13
Strip 3 0.01 0.22 0.10
ΘE = Θs1 = Θs2 1 1 1
The variables used in Figure 6 are explained in the associated text. The process is set up to be
counter flowing to increase efficiency of flows. The feed of the initial aqueous solution is assumed
to be provided by the leaching process. The metal content of this flow is set to match the conditions
of the solvent extraction experiments. It is also seen that the metals are recovered in several
fraction, - 3 .
To model a process the following assumptions need to be made in context to Eq 19:
The phases are immiscible so that the volumetric flows are constant;
The D values for each process are constant;
In each step the dynamical equilibrium is obtained;
The stripping feeds, , are assumed to be clean of metals.
Each flow is calculated through numerical iteration. The aim of the modeling is to achieve less than 1
wt% of overall impurities in the outflow fraction of Ga and In. The purity demands are of course
arbitrary and must meet the requirements of the industry that will use these fractions.
19
4 Results and Discussion
4.1 Characterization of the starting material The characterization of the material was performed with acid digestion in order to quantify its
content. The metal content of two different batches at different occasions has been characterized
(Table 3). Besides Cu, Ga and In the solid was also made up by roughly 20-25 % of other element(s).
This unaccounted weight was believed to be oxygen as the material had been oxidized using a flow of
O2 at 800 ˚C.
Table 3 The investigated composition of Cu, Ga and In, in the material.
Batch Cu (wt%) Ga (wt%) In (wt%)
1 (test 1) 25.9±1.2 7.2±0.3 42.9±1.7
1 (test 2) 25.8±0.8 7.4±0.3 55.8±1.8
2 (test 1) 27.2±0.9 8.0±0.2 44.5±1.3
2 (test 2) 26.5±0.9 7.3±0.2 42.2±1.2
It was expected that the material contained different amounts of the three metals, between
different batches. However, even within the same batch the material was not homogenous. A
difference in size and composition of the particles can be the cause of these differences. Since the
material was not homogenous, comparisons between the different systems were problematic. It is
believed that the different effects on leaching of the material can still be compared, as these types of
tests were performed at the same occasions and standardized with the most present results of
digestion studies. Hence, errors arising from changing material composition should be minimal.
20
4.2 Screening of different acids The material was leached with 6 M HCl, HNO3 and H2SO4 up to 8 h at room temperature (Figure 6). As
can be seen, the leaching percentages of the metals were different depending on what leachant was
used. At room temperature neither investigated acid was able to fully dissolve the material within 8
h.
Figure 6: The leaching efficiency of Cu, Ga and In have been calculated: (a), (b) and (c) respectively.
The highest difference in leaching efficiency was obtained, for all the metals, when HCl was used (45
wt% Ga after 8 h). The other acids, H2SO4 and HNO3, showed much lower efficiencies after the same
time (28 % and 16 % Ga respectively). The same trend of leached Cu and In was observed. Since the
leached material was unique it is therefore difficult to compare the leaching results with previous
studies. The different leaching efficiencies, of the acids on the material, can probably be appointed to
the metal oxide structures. Gustafsson et al. (2014) reported that 5 different oxide structures existed
in their oxidized material. HCl is generally known to be effective for leaching mixed metal oxides, and
in this context the results are supported.
0
20
40
60
80
100
0 2 4 6 8 10
Cu
leac
he
d (
% w
t)
Time (hours)
(a)
6 M HNO3
6 M HCl
6 M H2SO4
0
20
40
60
80
100
0 2 4 6 8 10
Ga
leac
he
d (
% w
t)
Time (hours)
(b) 6 M HNO3
6 M HCl
6 M H2SO4
0
20
40
60
80
100
0 2 4 6 8 10
In le
ach
ed
(w
t %
)
Time (hours)
(c) 6 M HNO3
6 M HCl
6 M H2SO4
21
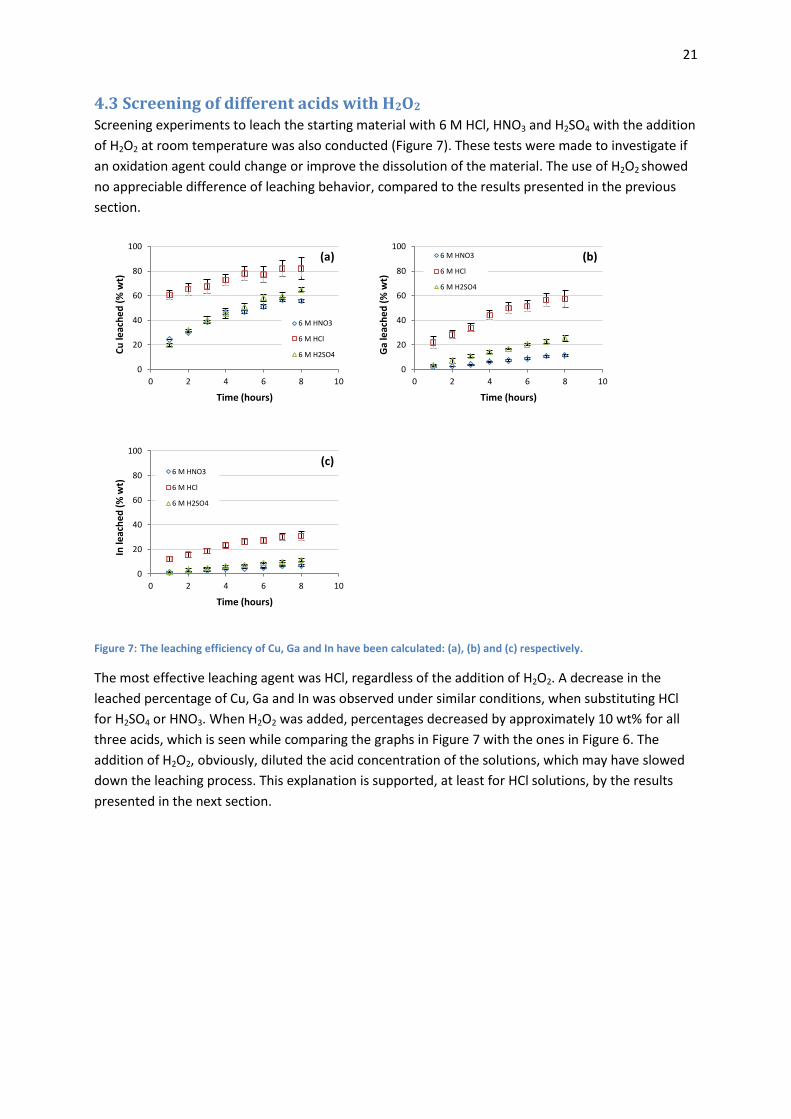
4.3 Screening of different acids with H2O2
Screening experiments to leach the starting material with 6 M HCl, HNO3 and H2SO4 with the addition
of H2O2 at room temperature was also conducted (Figure 7). These tests were made to investigate if
an oxidation agent could change or improve the dissolution of the material. The use of H2O2 showed
no appreciable difference of leaching behavior, compared to the results presented in the previous
section.
Figure 7: The leaching efficiency of Cu, Ga and In have been calculated: (a), (b) and (c) respectively.
The most effective leaching agent was HCl, regardless of the addition of H2O2. A decrease in the
leached percentage of Cu, Ga and In was observed under similar conditions, when substituting HCl
for H2SO4 or HNO3. When H2O2 was added, percentages decreased by approximately 10 wt% for all
three acids, which is seen while comparing the graphs in Figure 7 with the ones in Figure 6. The
addition of H2O2, obviously, diluted the acid concentration of the solutions, which may have slowed
down the leaching process. This explanation is supported, at least for HCl solutions, by the results
presented in the next section.
0
20
40
60
80
100
0 2 4 6 8 10
Cu
leac
he
d (
% w
t)
Time (hours)
(a)
6 M HNO3
6 M HCl
6 M H2SO4
0
20
40
60
80
100
0 2 4 6 8 10G
a le
ach
ed
(%
wt)
Time (hours)
(b) 6 M HNO3
6 M HCl
6 M H2SO4
0
20
40
60
80
100
0 2 4 6 8 10
In le
ach
ed
(%
wt)
Time (hours)
(c) 6 M HNO3
6 M HCl
6 M H2SO4
22
4.4 Leaching with different acid concentrations The material has been leached with 1, 3 and 6 M HCl solutions for up to 94 h at room temperature (Figure 8). It is seen that leaching percentages for all three metals were affected by HCl concentration, as seen in this Figure. A picture of a spent solution, representative for all three concentrations used in this study, is seen in Figure 9. In contrast to what the graphs in Figure 9 suggests, this image show that the material was not fully dissolved.
Figure 8: The leaching efficiency of Cu, Ga and In have been calculated: (a), (b) and (c) respectively.
Figure 9: After 94 h of leaching with 3 M HCl solution, a photo was taken of a solution. The black color, present in the bottom of the vessel, is undissolved starting material. This image was representative to the other solutions of 1 and 6 M HCl.
0
20
40
60
80
100
120
0 20 40 60 80 100 120
Cu
leac
he
d (
% w
t)
Time (hours)
(a)
1 M HCl
3 M HCl
6 M HCl
0
20
40
60
80
100
120
0 20 40 60 80 100 120G
a le
ach
ed
(%
wt)
Time (hours)
(b)
1 M HCl
3 M HCl
6 M HCl
0
20
40
60
80
100
120
0 20 40 60 80 100 120
In le
ach
ed
(%
wt)
Time (hours)
(c) 1 M HCl
3 M HCl
6 M HCl
23
The material appear to be not fully digested in Figure 9, compared to the reported leaching
percentages of Cu and Ga in Figure 8, which are both close to 100 wt%. It is believed that the
difference of result is coupled to the non-homogeneity of material. As mentioned in section 4.1 the
comparison between acid concentrations should still be valid. That is, leaching rates of the metals
increased with increased HCl concentration. Therefore the results support the explanation that the
addition of H2O2 diluted the leaching solutions so that the leaching efficiency were decreased.
With the current results in Figure 8, it cannot be distinguished if it is the concentration of HCl alone
that is important for leaching the material. It may be so that the increase of chloride ions increases
the solubility of the metal ions, which leads to the increase of leaching rates. If the concentration of
acid could be substituted, with e.g. NaCl, an industrial process could become more economically
feasible. The substitution of HCl with NaCl to maintain leaching properties has been previously
discussed [24].
The leaching rates for Cu and Ga, but not for In, starts to converge after 24 h, using 6 M HCl. It is
difficult, however, to compare these results to the ones obtained in experiments conducted up to 8
h, because of errors coupled to non-homogenous material. For In, the leaching percentage was lower
(63 wt%) compared to Cu (95 wt%) and Ga (93 wt%). With the aspect of the required leaching times
and low yield of In, the current method to dissolve the material is not industrially feasible. Because of
converging leaching rates, the solid to liquid ratio of dissolution is advised to be further investigated.
4.5 Leaching at elevated temperature
In order to make the leaching step more suitable for industrial applications, leaching rates had to be increased. Therefore leaching tests with 6 M HCl and addition of H2O2 at 75 ˚C was performed. The results of these tests have been quantified (Figure 10). The appearance of a typical leaching solution from after these experiments is seen in Figure 11. It was visually observed in the practical work that the material visually appeared to be fully digested after 0.5 h of leaching.
Figure 6: The amount of leached metals has been calculated from leaching studies at elevated temperatures.
0
20
40
60
80
100
120
0 2 4 6 8 10
Me
tall
leac
he
d (
% w
t)
Time (hours)
Ga In Cu
24
Figure 71: A typical solution (initially 6 M HCl) after it has leached the material during addition of H2O2 at 75 ˚C. The solution is very transparent. The solution is viewed from the side (left picture) and from above (right picture).
Both the appearance of the solution and the reported leaching percentages of metals show that the
material was almost fully dissolved within 0.5 h. After this time percentages were 97 wt% (Cu), 98
wt% (Ga) and 96 wt% (In).
With increase leaching time there was a decrease of metal concentration in solution. This behavior
has not been fully understood, but it is thought to be coupled calculation assumptions. It was
assumed that the amount of K in the solution was constant. During the experiment could be possible
that a small portion of this element precipitated. It is believed that the hot liquid with high
concentration of metals, splashed off during stirring to cooler surfaces of the reaction vessel. Once
the liquid was cooled the solubility of K decreased so that some of it precipitated. In time the
reduced amount of K in the solution could start to have a significant impact on the results.
The elevated temperature in combination with 6 M HCl and H2O2 was expected to fully dissolve the
material in shorter time than 8 h. Unfortunately, it is not possible to decouple the combined effects
of high temperature, HCl concentration and addition of H2O2 on the leaching of the material. Still, the
results of complete digestion in short time, is satisfactory for industrial aspects. The use of this
method should be weighed against associated increase of energy costs. On the other hand, the costs
can be validated as the various leaching results conclusively show that In was most difficult to leach
from the material.
For economic aspects, it is important to investigate how the leaching method can be optimized.
These optimizations should aim to also determine the final concentration of HCl of the leaching
method, as it is important to couple the leaching step to subsequent solvent extraction.
25
4.6 Screening of extractants at different HCl concentrations Extractions of Cu, Ga, and In with several commercially available extractants from various aqueous
HCl phases, initially 0.01-6 M, have been performed. The results of the extraction of these metals
using Cyanex 923 and TOPO are seen in Figure 12. It was deemed from all investigated reagents, that
these two extractants were the most promising in terms of extraction and separation of the metals.
Extractions of the three metals from these aqueous solutions using TBP, D2EHPA, LIX 984 and Cyanex
272 are reported in appendix C.
Figure 128: The D values were calculated for the extraction of Cu, Ga and In from the initial aqueous phases: 0.01, 0.1, 1, 3 and 6 M HCl, using Cyanex 923 (a) and TOPO (b).
For all the extraction results in this section and appendix C there is a large standard deviation. These
deviations can be explained by the procedure in the collection of samples. The procedure of using a
napkin to absorb organic phase, in the outermost liquid inside the pipette, was not performed in this
test. This method in combination of an overall low metal concentrations and sample volumes should
explain these deviations.
For both Cyanex 923 and TOPO the extraction of all the three metals was similar. This similarity was
not unexpected as these reagents have similar molecular structure and share the solvating extraction
mechanism. From aqueous solutions exceeding 3 M HCl, both Ga and In were extracted with high D
values (approximately 500 respectively 70). Cu is not extracted to the same extent, where only some
of the metal is extracted.
Using Cyanex 923, the extraction of Ga and Cu at concentrated HCl aqueous media is confirmed by
previous work [31]. A contribution to this article is that In is also extracted in these conditions. The
extraction of In using TOPO was, however, not in agreement with previous investigations [34]. In the
results of Hasegawa et al. (1979) it was shown that Ga was extracted from aqueous phases greater
than 1 M HCl, but not In. These differences in results may be attributed to the use of different
solvents. In the mentioned article the solvent was n-heptane, whereas for this project kerosene was
used. The different organic phases can lead to different activities of the extracted complexes. Thus,
the D value can change, depending which solvent is used. It can therefore be contributed that the
use of solvents of TOPO and kerosene also extracts In from highly concentrated HCl phases,
exceeding 3 M.
-6
-4
-2
0
2
4
6
0.01 0.1 1
log D
log initial HCl conc.
(a) Cu In Ga
-6
-4
-2
0
2
4
6
0.01 0.1 1
log D
log initial HCl conc.
(b) Cu In Ga
26
Since neither reagent, in kerosene, has been previously reported to extract In from high acidic HCl
media there is a need to verify these extractions through stripping experiments. This verification is
important as the presented results are based on concentration differences, before and after the
extraction, of the aqueous phase.
With the high D values of Ga and In from aqueous phases exceeding 3 M HCl, it is clear that both
Cyanex 923 and TOPO can be used to separate Cu from Ga and In. Using a fresh and similar aqueous
phase, the co-extracted Cu can be stripped selectively. The feasibility to use Cyanex 923 and TOPO is
coupled to the leaching solution, which will probably be of high HCl concentration.
27
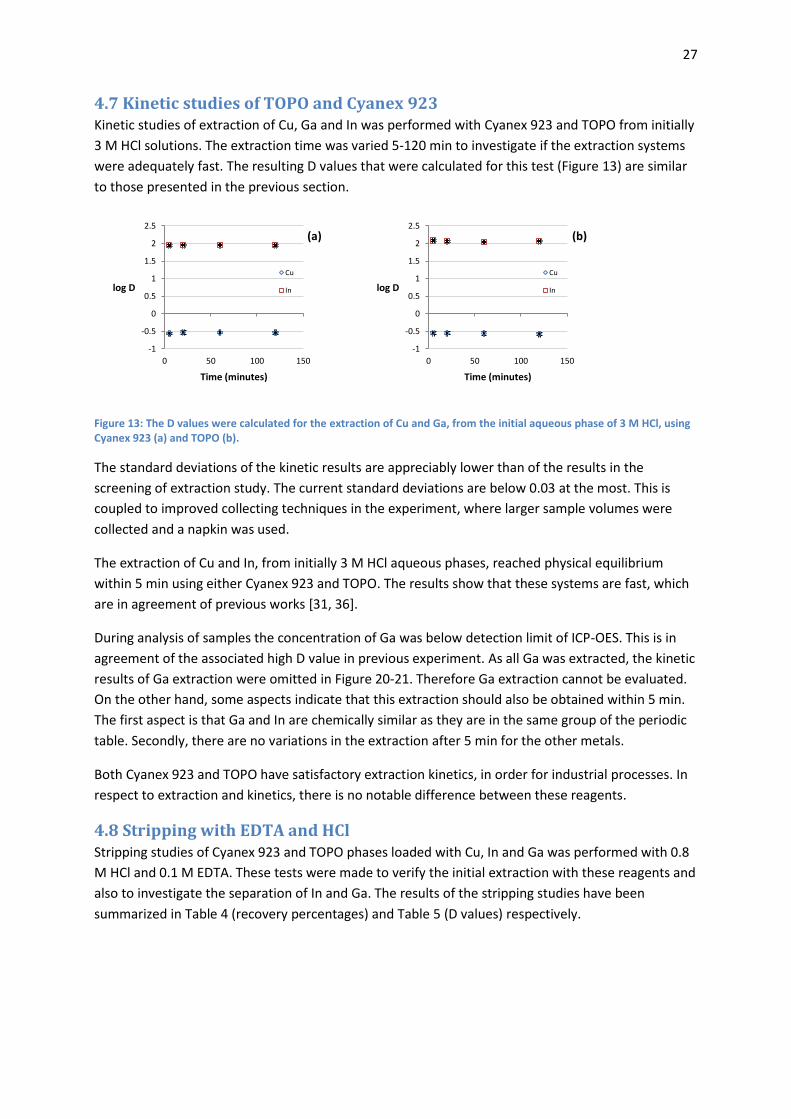
4.7 Kinetic studies of TOPO and Cyanex 923 Kinetic studies of extraction of Cu, Ga and In was performed with Cyanex 923 and TOPO from initially
3 M HCl solutions. The extraction time was varied 5-120 min to investigate if the extraction systems
were adequately fast. The resulting D values that were calculated for this test (Figure 13) are similar
to those presented in the previous section.
Figure 13: The D values were calculated for the extraction of Cu and Ga, from the initial aqueous phase of 3 M HCl, using Cyanex 923 (a) and TOPO (b).
The standard deviations of the kinetic results are appreciably lower than of the results in the
screening of extraction study. The current standard deviations are below 0.03 at the most. This is
coupled to improved collecting techniques in the experiment, where larger sample volumes were
collected and a napkin was used.
The extraction of Cu and In, from initially 3 M HCl aqueous phases, reached physical equilibrium
within 5 min using either Cyanex 923 and TOPO. The results show that these systems are fast, which
are in agreement of previous works [31, 36].
During analysis of samples the concentration of Ga was below detection limit of ICP-OES. This is in
agreement of the associated high D value in previous experiment. As all Ga was extracted, the kinetic
results of Ga extraction were omitted in Figure 20-21. Therefore Ga extraction cannot be evaluated.
On the other hand, some aspects indicate that this extraction should also be obtained within 5 min.
The first aspect is that Ga and In are chemically similar as they are in the same group of the periodic
table. Secondly, there are no variations in the extraction after 5 min for the other metals.
Both Cyanex 923 and TOPO have satisfactory extraction kinetics, in order for industrial processes. In
respect to extraction and kinetics, there is no notable difference between these reagents.
4.8 Stripping with EDTA and HCl Stripping studies of Cyanex 923 and TOPO phases loaded with Cu, In and Ga was performed with 0.8
M HCl and 0.1 M EDTA. These tests were made to verify the initial extraction with these reagents and
also to investigate the separation of In and Ga. The results of the stripping studies have been
summarized in Table 4 (recovery percentages) and Table 5 (D values) respectively.
-1
-0.5
0
0.5
1
1.5
2
2.5
0 50 100 150
log D
Time (minutes)
(a)
Cu
In
-1
-0.5
0
0.5
1
1.5
2
2.5
0 50 100 150
log D
Time (minutes)
(b)
Cu
In
28
Table 4 The recover percentages are summarized for the stripping experiment.
Phase Strip
solution Strip step Cu (% recovered) Ga (% recovered) In (% recovered)
Cyanex 923 0.8 M HCl 1 2 3
96±5 102±5 106±5
88±1 105±2 107±2
3±0 6±0 8±0
TOPO 0.8 M HCl 1 2 3
120±0 120±0 120±0
92±0 106±0 109±0
3±0 6±0
10±0
Cyanex 923 0.1 M EDTA 1 2 3
103±3 103±3 103±3
91±2 93±2 94±2
82±3 84±3 85±3
TOPO 0.1 M EDTA 1 2 3
111±11 111±11 111±11
89±1 91±1 92±1
64±2 67±2 68±2
Table 5 The D values are summarized for the stripping experiment.
Loaded phase Strip
solution Strip step
Cyanex 923 0.8 M HCl 1 2 3
0.04±0.05 n/a n/a
0.13±0.02 n/a n/a
35.79±1.20 34.38±1.55 32.78±3.85
TOPO 0.8 M HCl 1 2 3
n/a n/a n/a
0.09±0.01 n/a n/a
33.13±0.13 31.98±0.45 25.09±0.31
Cyanex 923 0.1 M EDTA 1 2 3
n/a n/a n/a
0.10±0.02 4.64±0.88 5.06±1.12
0.22±0.04 9.45±1.99
11.41±3.18
TOPO 0.1 M EDTA 1 2 3
n/a n/a n/a
0.13±0.01 5.88±0.58 7.82±0.97
0.56±0.04 13.57±0.89 21.55±1.51
Using 0.8 M HCl or 0.1 M EDTA, different recovery percentages were achieved (Table 4). The recovery
of 120 % Cu from TOPO phases, have not been fully understood. It is believed that a few % error is
contributed from experimental procedures. In the absent of any explanation, these results cannot be
fully trusted. On the other hand, the lower D values of extraction of Cu and Ga from 1 M HCl solution
(seen in Figure 12) support that a lot of these metals was recovered using 0.8 M HCl solution. As
EDTA is known to be a strong complexing agent and therefore it is expected that it was able to, some
extent, strip the Cyanex 923 and TOPO phases of the three metals.
The extraction of Cu and Ga from initially 3 M HCl aqueous solution (section 4.6), using Cyanex 923
and TOPO has been verified with the strip results (Table 4). The extraction of In from this phase has
not been verified, which is problematic since it is the most abundant critical metal in the leaching
solution. In respect to the overall recycling method, it is therefore important that In is quantitatively
recovered.
29
The increase of D values of In using EDTA with subsequent strips, indicates that the concentration of
this reagent was too high to fully recover this metal. According to theory the D values should be
constant if the activities of the stripping systems are constant. Obviously, it was not the case
throughout these experiments. It is therefore believed that with further investigations, In can be fully
recovered by using less concentrated solutions of EDTA.
Using HCl and EDTA in specific orders can make it possible to achieve a separation between all three
metals. The approximate differences in D values of Ga (0.1) and In (35) when 0.8 M HCl solution
stripped the organic phases, are deemed as satisfactory. Since this solution recovered all of the Cu
and most of the Ga, it is important that the organic phase is initially stripped from Cu using
concentrated HCl, at high concentration. Subsequently EDTA should, with further development, be
able to recover the remaining In.
Cyanex 923 is argued to be more feasible to use in a separation method, as more In was recovered in
the stripping investigations. This extractant has also been reported to withstand extraction
degradation in 5 M HCl for up to 50 days [40], which further supports its uses.
30
4.9 Calculations of a process separation
The results of the simulations of a separation process described in section 3.9, can be seen in Table 6.
This simulation was made to couple and evaluate the solvent extraction/stripping results. To achieve
the goal of less than 1 wt% of total impurities in the respective fractions of Ga and In, 3 steps of the
sub processes strip 2 and 3 were required.
Table 6 Obtained fractions from process simulations.
nE ms1 ms2 ms3 process Fraction Cu (wt%) In (wt%) Ga (wt%)
1 1 1 1
Extraction Strip 1 Strip 2 Strip 3
3
99.2 96.5 4.2 3.1
0.5 2.4 0.9
68.7
0.3 1.1
94.8 28.2
1 2 2 1
Extraction Strip 1 Strip 2 Strip 3
3
99.2 97.1 1.2 0.3
0.5 2.0 0.9
94.8
0.3 0.9
97.9 4.9
1 3 3 1
Extraction Strip 1 Strip 2 Strip 3
3
99.2 97.2 0.3 0.0
0.5 1.9 0.9
99.3
0.3 0.9
98.8 0.7
There are some uncertainties coupled to the results of the simulation. The calculations were based
on constant D values of both extraction and stripping. However, stripping experiment showed that
the D values changed with increased number of subsequent stripping steps. Therefore the
simulations using more than 1 step become uncertain.
The simulation shows that a separation of the leached material is possible, but improvements should
be made in terms of more efficient sub processes. In order to investigate increased efficiency of the
processes, both concentrations of reagents and organic to aqueous volume ratios can be varied. With
these improvements, it is believed that the combination of Cyanex 923, HCl and EDTA can provide an
economically feasible separation of the metals.
31
6 Conclusions
6.1 Conclusions of leaching experiments From the leaching tests it was concluded that HCl was the most feasible leachant to dissolve the
material, at room temperature. This acid could, in comparison to H2SO4 and HNO3, leach more Cu, In
and Ga. Adding H2O2 had no increasing effect on the leaching process, for any of the three acids.
An increase in leaching rate was observed with an increase in HCl concentration. It suggested that
salt containing chloride ions can substitute some HCl, in order to obtain the same results. The
leaching kinetics at room temperature are, however, slow. It was not possible to digest the material
at this temperature.
Since the material was fully digested within 0.5 h, using 6 M HCl and H2O2 at 75 ˚C, it shows that
elevated temperatures improve the leaching process significantly. This method satisfies the goal of
complete dissolution at short time. Further studies should investigate the possibility to obtain
same/better results using less energy and amount of chemicals.
6.2 Conclusions of the solvent extraction and stripping experiments The solvent extraction and stripping experiments of this project focused on aqueous phases that
initially was 3 M HCl and contained the three metals. Therefore the conclusions that are presented in
this section refer this phase.
Among the investigated extractants in this project, Cyanex 923 was the most suitable reagent to
separate the metals from each other. It was expected and verified that TOPO showed similar
extraction behavior, as it is a constituent in Cyanex 923. The extraction of In from concentrated HCl
solution has not been fully verified by stripping experiments. Still, it can be contributed to the
general knowledge that these two extractants, to a certain extent, extracts In from such solutions.
The difference between Cyanex 923 and TOPO is most obvious in the stripping separation processes.
It is more convenient to use Cyanex 923 as In was more easily stripped from this phase. This
extractant is also very stable in concentrated HCl media.
The separation of Cu, Ga and In was achieved using Cyanex 923 as extractant, and HCl and EDTA as
stripping agents. In the extraction of Ga and In, some Cu is co-extracted. It is necessary to first strip
the organic phase of Cu. It can be achieved by using fresh leaching solution. In order to separate Ga
and In from each other, the organic phase is stripped of Ga using 0.8 M HCl. Most of the remaining In
can be recovered using 0.1 M EDTA.
The suggested method using solvent extraction and stripping can be improved. Simulations showed
that, with an arbitrary goal of fractions with 1 wt % impurities, only few steps in a cascade counter
current process are required. With improvements, the suggested separation method can become
efficient. More investigations should be made to achieve a more effective separation of the Cu, Ga
and In. If such improvements are made, the presented method can be used to recycle the critical
metals Ga and In from the investigated material.
32
7 Future work The hydrometallurgical process steps that have been investigated in this project were leaching,
solvent extraction and stripping. Each of these steps needs to be further investigated in order to
increase the efficiency of the overall separation process of Cu, In and Ga. For the leaching step the
following aspects need further study:
Optimization of the leaching process regarding temperature, concentration of HCl and rate of
H2O2 addition;
The possibility to reduce the amount of HCl in the leaching solution, by adding chloride ions
in the form of salt;
Optimizing the leaching step in respect to the solid to liquid ratio.
There should also be a focus on the coupling between the leaching solution and the solvent
extraction step. In the extraction respectively stripping step it is of interest to further investigate:
The change in D values of Ga during extraction in respect to time;
Which concentration(s) of EDTA is required to quantitatively recover In from Cyanex 923 in
kerosene;
How much metal can be loaded into the organic phase (Cyanex 923 and kerosene). An
efficient use of the flows in the process increases its economic potential;
The effect of variations of organic to aqueous volume ratio on the extraction and stripping
processes.
33
References 1. UN. Our Common Future. 1987 [cited 2014 0317]; Available from:
http://conspect.nl/pdf/Our_Common_Future-Brundtland_Report_1987.pdf. 2. Zervos, A., Re-thinking 2050: A 100 % Renewable Energy Vision for the European Union. 2010:
EREC. 3. MCCrone, A.U., E. Sonntag-O'brien, V. Moslener, U. Grüning, C. Global Trends in Renewable
Energy Investment 2013. 2013 [cited 2014 0317]; Available from: www.fs-unep-centre.org. 4. Choi, J.-K. and V. Fthenakis, Economic Feasibility of Recycling Photovoltaic Modules. Journal
of Industrial Ecology, 2010. 14(6): p. 947-964. 5. Marwede, M., et al., Recycling paths for thin-film chalcogenide photovoltaic waste – Current
feasible processes. Renewable Energy, 2013. 55(0): p. 220-229. 6. Miyazaki, H., Recycling of CIGS absorber layer for deposition of CIGS film. physica status solidi
(c), 2013. 10(7-8): p. 1031-1034. 7. PV Waste and Legislation. 2014 [cited 2014 0317]; Available from:
http://www.solarwaste.eu/pv-waste-legislation. 8. Berger, W., Sapich G. and Weimann, K. Recovery of Solar Valuable Materials, Enrichment and
Decontamination. 2008 [cited 2013 2013-07-10]; Available from: www.resolved.bam.de/eng_home-index.htm.
9. Group, A.-h.W. Critical Raw Materials for the EU 2010 [cited 2014 0317]; Available from: http://ec.europa.eu/.
10. Moss, R.L.T., E. Kara, H. Willis, P. Kooroshy, J. Critical Metals in Strategic Energy Technologies. 2011 [cited 2014 0309]; Available from: http://setis.ec.europa.eu/publications/jrc-setis-reports.
11. Price, J.G., Energy critical elements: Securing materials for emerging technologies. Mining Engineering, 2011. 8(63): p. 33-34.
12. Palitzsch, W. and U. Loser. Results from scaling up the new universal chemical recycling procedure for CIS, CIGS and CdTe photovoltaic waste. in Photovoltaic Specialists Conference (PVSC), 2011 37th IEEE. 2011.
13. Palitzsch, W. and U. Loser. Economic PV waste recycling solutions — Results from R&D and practice. in Photovoltaic Specialists Conference (PVSC), 2012 38th IEEE. 2012.
14. Berger, W., et al., A novel approach for the recycling of thin film photovoltaic modules. Resources, Conservation and Recycling, 2010. 54(10): p. 711-718.
15. Gustafsson, A.M.K., M.R.S. Foreman, and C. Ekberg, Recycling of high purity selenium from CIGS solar cell waste materials. Waste Management, 2014(0).
16. Fthenakis, V., W. Wang, and H.C. Kim, Life cycle inventory analysis of the production of metals used in photovoltaics. Renewable and Sustainable Energy Reviews, 2009. 13(3): p. 493-517.
17. Bautista, R.G. and N.A.T.O.S.A. Division, Hydrometallurgical process fundamentals. 1984: Published in cooperation with NATO Scientific Affairs Division [by] Plenum Press.
18. Hudson, M.J., An introduction to some aspects of solvent extraction chemistry in hydrometallurgy. Hydrometallurgy, 1982. 9(2): p. 149-168.
19. Rydberg, J., ed. Solvent extraction principles and practice. 2004, Marcel Dekker Inc. 20. Chapter 4 Hydrometallurgical processes, in Waste Management Series, S.R. Rao, Editor. 2006,
Elsevier. p. 71-108. 21. Tunsu, C., Leaching and solvent extraction of rare earth metals from fluorescent lamp waste,
in Department of Chemistry and Biotechnology, Industrial materials recycling. 2014, Chalmers University of Technology: Gothenburg, Sweden.
22. Yang, J., Recovery of Indium from End-of-Life Liquid Crystal Displays, in Department of Chemical and Biological Engineering, Industrial Materials Recycling. 2012, Chalmers University of Technology: Gothenburg, Sweden.
34
23. Blesa, M.A., A.E. Regazzoni, and P.J. Morando, Chemical dissolution of metal oxides. 1993, Boca Raton: CRC Press.
24. Gupta, C.K. and T.K. Mukherjee, Hydrometallurgy in Extraction Processes. 1990: Taylor & Francis.
25. Sipos, P., T. Megyes, and O. Berkesi, The Structure of Gallium in Strongly Alkaline, Highly Concentrated Gallate Solutions—a Raman and 71Ga-NMR Spectroscopic Study. Journal of Solution Chemistry, 2008. 37(10): p. 1411-1418.
26. Geer, W.C., Contributions to the chemistry of indium. 1912, Easton, Pa.: Eschenbach printing company. 56 p.
27. Strehblow, H.H. and H.D. Speckmann, Corrosion and layer formation of passive copper in alkaline solutions. Materials and Corrosion, 1984. 35(11): p. 512-519.
28. Burgot, J.L., Ionic Equilibria in Analytical Chemistry. 2012: Springer. 29. Larsson, K., Hydrometllurgical Treatment of NiMH Batteries. 2012, Chalmers University of
Technology: Gothenburg. 30. Gupta, B., N. Mudhar, and I. Singh, Separations and recovery of indium and gallium using
bis(2,4,4-trimethylpentyl)phosphinic acid (Cyanex 272). Separation and Purification Technology, 2007. 57(2): p. 294-303.
31. Ahmed, I.M., Y.A. El-Nadi, and N.E. El-Hefny, Extraction of gallium(III) from hydrochloric acid by Cyanex 923 and Cyanex 925. Hydrometallurgy, 2013. 131–132(0): p. 24-28.
32. de San Miguel, E.R., et al., Extraction of Cu(II), Fe(III), Ga(III), Ni(II), In(III), Co(II), Zn(II) and Pb(II) with LIX® 984 dissolved in n-heptane. Hydrometallurgy, 1997. 47(1): p. 19-30.
33. Lu, J. and D. Dreisinger, Solvent extraction of copper from chloride solution I: Extraction isotherms. Hydrometallurgy, 2013. 137: p. 13-17.
34. Hasegawa, Y., T. Shimada, and M. Niitsu, Solvent extraction of 3B group metal ions from hydrochloric acid with trioctylphosphine oxide. Journal of Inorganic and Nuclear Chemistry, 1980. 42(10): p. 1487-1489.
35. Virolainen, S., D. Ibana, and E. Paatero, Recovery of indium from indium tin oxide by solvent extraction. Hydrometallurgy, 2011. 107(1–2): p. 56-61.
36. Mitchell, J.W. and J.E. Riley Jr, Substoichiometric neutron-activation determination of gallium: Extraction from HCl with tri-n-octylphosphine oxide in cyclohexane. Talanta, 1975. 22(7): p. 567-570.
37. De, A.K. and A.K. Sen, Solvent extraction and separation of gallium(III), indium(III), and thallium(III) with tributylphosphate. Talanta, 1967. 14(6): p. 629-635.
38. Ren, et al., Extraction Equilibria of Copper(II) with D2EHPA in Kerosene from Aqueous Solutions in Acetate Buffer Media. Journal of Chemical & Engineering Data, 2007. 52(2): p. 438-441.
39. Jilska, M.P. and W.S. Geoff, Use of Emulsion Liquid Membrane Systems in Chemical and Biotechnological Separations, in Handbook of Membrane Separations. 2008, CRC Press. p. 709-740.
40. Gupta, B., A. Deep, and P. Malik, Extraction and recovery of cadmium using Cyanex 923. Hydrometallurgy, 2001. 61(1): p. 65-71.
41. Staszak, K., et al., Copper(II) sulphate solutions treatment by solvent extraction with Na-Cyanex 272. Separation and Purification Technology, 2012. 85(0): p. 183-192.
42. Sole, K.C. and J.B. Hiskey, Solvent extraction of copper by Cyanex 272, Cyanex 302 and Cyanex 301. Hydrometallurgy, 1995. 37(2): p. 129-147.
43. BASF. Global Mining Solutions LIX 984 Solvent Extraction Reagent. 2012 [cited 2014 03014]; Available from: www.mining-solutions.basf.com.
44. Lu, J. and D. Dreisinger, Solvent extraction of copper from chloride solution I: Extraction isotherms. Hydrometallurgy, 2013. 137(0): p. 13-17.
45. Lee, M.S., J.G. Ahn, and E.C. Lee, Solvent extraction separation of indium and gallium from sulphate solutions using D2EHPA. Hydrometallurgy, 2002. 63(3): p. 269-276.
35
46. Son-Ki, I., L. Hwa-Young, and L. Dong-Hui, Kinetic study of the extraction of copper(ii) by di(2-ethylhexyl)phosphoric acid in a Lewis-type cell. Journal of Membrane Science, 1988. 37(2): p. 181-191.
36
A Calculations
A.1 ICP-OES data All the samples that were analyzed with ICP-OES had been diluted with solutions, referred to as
blanks, which contained internal standard (Y). The concentration of Y was roughly 2 ppm and the
dilution of Y was calculated, based on the concentration of the blank and pipetting volumes
(25)
From the ICP-OES calibration a linear relationship from the calibration was obtained
(26)
where is the standardized net intensity ratio and x is the concentration of a metal in ppm. A
dilution of the sample was done to reach the calibration range before analysis. The dilution factor
was obtained by pipetting volumes (similar to Eq 25). The concentration of a sample could therefore
be calculated as
(27)
A.2 ICP-MS data In the analysis with ICP-MS, no calibration was performed. In this analysis, the intensities for the
aqueous phase before and after extraction experiments were only of interest. Before the data was
treated, the intensities for each isotope were standardized to Y intensity (internal standard). The
background noise was also deducted. The intensity of the samples was calculated as
(28)
For this analysis the concentrations were small and more sensitive to dilution errors, compared to
analysis of samples with ICP-OES. Therefore the dilution factor was calculated based on a
combination of weighing of samples and pipetting volumes. Since the dilution occurred with the
same solution, it was possible to calculate a mean value of the density.
A linear relationship of the intensities were assumed, and the theoretical D value of extraction could
therefore be calculated as
(29)
37
A.3 Standardizing leached amount of metal to reference content in the
starting material In the characterization of the material the weight of the solid powder had been noted. Using Eq 27,
the amount of metal A in the material was calculated according to Eq 30.Through ICP-OES analysis
and Eq 27 the amount of metal A in the starting material was
(30)
For each leaching test the material was aslo weighed and the volume of leaching solution was
recorded. By combining Eq 27 for the sample at time t with Eq 30 the amount (wt%) leached metal
was calculated
(31)
For the leaching studies of different 6 M acids with/without addition of H2O2, the initial volume of 25
ml was used for calculations. The concentration of K was measured with ICP-OES and calculated for
each sample in these studies. The for the data was calculated as
(32)
The volume of 25 ml was assumed to be constant in the treatment of data for the leaching test with
1-6 M HCl solutions. In calculations for the leaching study using 6 M HCl at 75 ˚C and addition of
H2O2, there was a different approach. The concentration of K in this acidic solution was measured
and calculated for the stock solution. For each sample that was analyzed concentration of K was also
investigated. In the standardization of these data the initial value of K was different, where
was assumed.
A.4 Theoretical D value For the extraction and stripping studies that were analyzed with ICP-OES the theoretical D value was
calculated based on concentrations. The expression is similar to Eq 28 but instead of intensities the
concentrations were known through Eq 27. In some cases the concentrations were below
background noise and thus omitted.
38
A.5 amount (% recovered) from the organic phase For the stripping experiments the concentration of metal A of the original aqueous phase was
determined through ICP-OES. A known amount of aqueous and organic phase was mixed. The
theoretical concentration of metal A in the organic phase is the difference in aqueous concentration
before and after shaking
(33)
A portion of the organic phase was isolated and stripping agent was brought into contact of this
phase. After shaking, a sample of the aqueous stripping phase is collected. At this point the %
recovered is obtained with Eq 27 and
(34)
39
B Experimental
B.1 Chemical specification All chemicals used in this project can be reviewed in Table 7. The reagents were used without any
further purification.
Table 7 Various chemicals that have been used in the practical work for this project are reviewed here.
MilliQwater Millipore Q-POD (machine) 18.2 MΩcm at 25 C
Cu standard (ICP-OES) Ulta Scientific 1000 g/ml
Ga standard (ICP-OES) Ulta Scientific 1000 g/ml
In standard (ICP-OES) Ulta Scientific 1000 g/ml
K standard (ICP-OES) Ulta Scientific 1000 g/ml
Se standard (ICP-OES) Ulta Scientific 1000 g/ml
Y standard (ICP-OES) Ulta Scientific 1000 g/ml
Y standard (ICP-MS) VHG Labs 10 g/ml
B.2 ICP-OES Analysis and calibration The calibration of the ICP-OES analysis was made through measurement of the intensities of the
calibration standard solutions. The concentrations of the standards were prepared to 0.1 or 0.5, 1.0,
10 and 40 ppm for respective element. The intensities were standardized in respect to the internal
standard and readjusted with Eq 18. The element that was used for internal standard was Y. The
standardized intensity of the background was also deducted from each calibration standard solution.
In Figure 15 the graph of a typical calibration curve of a metal is presented. For all analyses with
either 0.1 M HNO3 or MilliQwater, the calibrations curves looked similar to this graph. It can be seen
in this graph that the calibration was linear up to 40 ppm of Cu.
40
Figure 15: The calibration curve show a typical linearity of standardized intensity and concentration of metal. In this graph, the wavelength 327.3 nm (Cu) is used.
In Table 8 the emission wavelengths (lines) that were used for analysis with ICP-OES are presented.
Table 8 The different excitation states with corresponding emissions wavelengths have been used for the analysis of aqueous samples with ICP-OES, for this project.
Metal (state) Wavelength (nm)
Cu (2) 224.7
Cu (1) 324.7
Cu (1) 327.3
Ga (1) 287.4
Ga (1) 294.3
Ga (1) 403.2
Ga (1) 417.2
In (1) 303.9
In (1) 325.6
K (1) 766.4
K (1) 769.8
Y (1) 362.0
Y (2) 371.0
Even though 2nd state lines for Ga, In and K was not included in the analysis it is believed that the
selected lines were stable enough during ICP-OES analysis to give accurate calculations of
concentrations.
y = 6.592x - 0.1131 R² = 1
0
50
100
150
200
250
300
0 20 40 60Stan
dar
diz
ed
inte
nsi
ty (
Ct/
s C
u
pe
r C
t/s
Y)
concentration Cu (ppm)
41
C Additional results from the screening of extractants experiment In the extraction experiments to screen suitable extractants for extracting the three metals from HCl
aqueous media (0.01-6 M HCl), several results were omitted from section 4.6. The results of using the
extractants Cyanex 272, LIX 984, TBP respectively D2EHPA are seen in Figure 16. By comparing the
various D values of the metals, it was deemed that was not feasible to use these extractants in the
separation of the metals. Only in the case of D2EHPA both Ga and In are extracted from 0.01 M HCl
solution. The standard deviations are in the same magnitude as for the extraction with Cyanex 923
and TOPO respectively.
Figure 16: The D values were calculated for the extraction of Cu, Ga and In from the initial aqueous phases: 0.01, 0.1, 1, 3 and 6 M HCl, using Cyanex 272 (a), LIX 984 (b), TBP (c) and D2EHPA (d).