ABSTRACTRecent research brought awareness of the issue of bots on socialmedia and the significant risks of mass manipulation of public opin-ion in the context of political discussion. In this work, we leverageTwitter to study the discourse during the 2018 US midterm electionsand analyze social bot activity and interactions with humans. Wecollected 2.6 million tweets for 42 days around the election dayfrom nearly 1 million users. We use the collected tweets to answerthree research questions: (i)Do social bots lean and behave accordingto a political ideology? (ii) Can we observe different strategies amongliberal and conservative bots? (iii) How effective are bot strategies inengaging humans?
We show that social bots can be accurately classified accordingto their political leaning and behave accordingly. Conservative botsshare most of the topics of discussion with their human counter-parts, while liberal bots show less overlap and a more inflammatoryattitude. We studied bot interactions with humans and observeddifferent strategies. Finally, we measured bots embeddedness inthe social network and the extent of human engagement with eachgroup of bots. Results show that conservative bots are more deeplyembedded in the social network and more effective than liberal botsat exerting influence on humans.
CCS CONCEPTS•Networks→ Socialmedia networks; •Human-centered com-puting → Social network analysis.
KEYWORDSsocial media; political elections; social bots; political manipulation
∗Also with USC Information Sciences Institute.
L. Luceri & A. Deb contributed equally to this work.
ACM Reference Format:Luca Luceri, Ashok Deb, Adam Badawy, and Emilio Ferrara. 2019. RedBots Do It Better: Comparative Analysis of Social Bot Partisan Behavior. InCompanion Proceedings of the 2019 World Wide Web Conference (WWW ’19Companion), May 13–17, 2019, San Francisco, CA, USA. ACM, New York, NY,USA, 6 pages. https://doi.org/10.1145/3308560.3316735
1 INTRODUCTIONDuring the last decade, social media have become the conventionalcommunication channel to socialize, share opinions, and accessthe news. Accuracy, truthfulness, and authenticity of the sharedcontent are necessary ingredients to maintain a healthy onlinediscussion. However, in recent times, social media have been dealingwith a considerable growth of false content and fake accounts. Theresulting wave of misinformation (and disinformation) highlightsthe pitfalls of social media and their potential harms to severalconstituents of our society, ranging from politics to public health.
In fact, social media networks have been used for maliciouspurposes to a great extent [11]. Various studies raised awarenessabout the risk of mass manipulation of public opinion, especiallyin the context of political discussion. Disinformation campaigns [2,5, 12, 14–17, 22, 24, 26, 30] and social bots [3, 4, 21, 23, 25, 29, 31,32] have been indicated as factors contributing to social mediamanipulation.
The 2016 US Presidential election represents a prime example ofthe significant perils of mass manipulation of political discourse.Badawy et al. [1] studied the Russian interference in the electionand the activity of Russian trolls on Twitter. Im et al. [18] suggestedthat troll accounts are still active to these days. The presence ofsocial bots does not show any sign of decline [10, 32] despite theattempts from social network providers to suspend suspected, mali-cious accounts. Various research efforts have been focusing on theanalysis, detection, and countermeasures development against so-cial bots. Ferrara et al. [13] highlighted the consequences associatedwith bot activity in social media. The online conversation relatedto the 2016 US presidential election was further examined [3] toquantify the extent of social bots activity. More recently, Stella et al.[27] discussed bots’ strategy of targeting influential humans to ma-nipulate online conversation during the Catalan referendum forindependence, whereas Shao et al. [25] analyzed the role of socialbots in spreading articles from low credibility sources. Deb et al.
[10] focused on the 2018 US Midterms elections with the objectiveto find instances of voter suppression.
In this work, we investigate social bots behavior by analyzingtheir activity, strategy, and interactions with humans. We aim toanswer the following research questions (RQs) regarding socialbots behavior during the 2018 US Midterms election.RQ1: Do social bots lean and behave according to a political ideology?
We investigate whether social bots can be classified based ontheir political inclination into liberal or conservative leaning.Further, we explore to what extent they act similarly to thecorresponding human counterparts.
RQ2: Can we observe different strategies among liberal and conser-vative bots? We examine the differences between social botstrategies to mimic humans and infiltrate political discus-sion. For this purpose, we measure bot activity in terms ofvolume and frequency of posts, interactions with humans,and embeddedness in the social network.
RQ3: How effective are bot strategies in engaging humans? We in-troduce four metrics to estimate the effectiveness of botstrategies in involving humans in their conversation and toevaluate the degree of human interplay with social bots.
We leverage Twitter to capture the political discourse duringthe 2018 US midterm elections. We collected 2.6 million tweets for42 days around election day from nearly 1 million users. We thenexplore collected data and attain the following findings:
• We show that social bots are embedded in each political sideand behave accordingly. Conservative bots abide by the topicdiscussed by the human counterpart more than liberal bots,which in turn exhibit a more provocative attitude.
• We examined bots’ interactions with humans and observeddifferent strategies. Conservative bots stand in a more cen-tral social network position, and divide their interactionsbetween humans and other conservative bots, whereas lib-eral bots focused mainly on the interplay with the humancounterparts.
• We measured the extent of human engagement with botsand recognized the strategy of conservative bots as the mosteffective in terms of influence exerted on human users.
2 DATAIn this study, we use Twitter to investigate the partisan behaviorof malicious accounts during the 2018 US midterm elections. Forthis purpose, we carried out a data collection from the month prior(October 6, 2018) to two weeks after (November 19, 2018) the dayof the election. We kept the collection running after the electionday as several races remained unresolved. We employed the Pythonmodule Twyton to collect tweets through the Twitter StreamingAPI using the following keywords as a filter: 2018midtermelections,2018midterms, elections, midterm, and midtermelections. As a result,we gathered 2.7 million tweets, whose IDs are publicly availablefor download.1 From this set, we first removed any duplicate tweet,which may have been captured by accidental redundant queriesto the Twitter API. Then,we filtered out all the tweets not writtenin English language and those that were out of the context of this
1https://github.com/A-Deb/midterms
Table 1: Dataset statistics
Statistic Count# of Tweets 452,288# of Retweets 1,869,313# of Replies 267,973# of Users 997,406
study. Overall, we retain nearly 2.6millions tweets, whose aggregatestatistics are reported in Table 1.
3 METHODOLOGY3.1 Bot DetectionNowadays, bot detection is a fundamental asset for understandingsocial media manipulation and, more specifically, to reveal ma-licious accounts. In the last few years, the problem of detectingautomated accounts gathered both attention and concern [13], alsobringing a wide variety of approaches to the table [7, 8, 20, 28].While increasingly sophisticated techniques keep emerging [20],in this study, we employ the widely used Botometer.2
Botometer is a machine learning-based tool developed by IndianaUniversity [9, 29] to detect social bots in Twitter. It is based on anensemble classifier [6] that aims to provide an indicator, namely botscore, used to classify an account either as a bot or as a human. Tofeed the classifier, the Botometer API extracts about 1,200 featuresrelated to the Twitter account under analysis. These features fall insix broad categories and characterize the account’s profile, friends,social network, temporal activity patterns, language, and sentiment.Botometer outputs a bot score: the lower the score, the higher theprobability that the user is human. In this study we use versionv3 of Botometer, which brings some innovations, as detailed in[32]. Most importantly, the bot scores are now rescaled (and notcentered around 0.5 anymore) through a non-linear re-calibrationof the model.
In Figure 1, we depict the bot score distribution of the 997,406distinct users in our datasets. The distribution exhibits a right skew:most of the probability mass is in the range [0, 0.2] and some peakscan be noticed around 0.3. Prior studies used the 0.5 threshold to sep-arate humans from bots. However, according to the re-calibrationintroduced in Botometer v3 [32], along with the emergence of in-creasingly more sophisticated bots, we here lower the bot scorethreshold to 0.3 (i.e., a user is labeled as a bot if the score is above0.3). This threshold corresponds to the same level of sensitivitysetting of 0.5 in prior versions of Botometer (cf. Fig 5 from [32]).
According to this choice, we classified 21.1% of the accounts asbots, which in turn generated 30.6% of the tweets in our data set.Overall, Botometer did not return a score for 35,029 users that corre-sponds to 3.5% of the accounts. We used the Twitter API to furtherinspect them. Interestingly, 99.4% of these accounts were suspendedby Twitter, whereas the remaining percentage of users protectedtheir tweets turning on the privacy settings of their accounts.
3.2 Political Ideology InferenceIn parallel to the bot detection analysis, we examine the politicalleaning of both bots and humans in our dataset. To classify usersbased on their political ideology, we rely on the political leaning of2https://botometer.iuni.iu.edu/
the media outlets they share. Wemake use of a list of partisan mediaoutlets released by third-party organizations, such as AllSides3 andMedia Bias/Fact Check.4 We combine liberal and liberal-center me-dia outlets into one list (composed of 641 outlets) and conservativeand conservative-center into another (composed of 398 outlets).To cross reference these media URLs with the URLs in the Twitterdataset, we need to get the expanded URLs for most of the links inthe dataset, as most of them are shortened. However, this process isquite time-consuming, thus, we decided to rank the top 5,000 URLsby popularity and retrieve the long version only for those. Thesetop 5,000 URLs accounts for more than 254K, or more than 1/3 of allthe URLs in the dataset. After cross-referencing the 5,000 extendedURLs with the media URLs, we observe that 32,115 tweets in thedataset contain a URL that points to one of the liberal media outletsand 25,273 tweets with a URL pointing to one of the conservativemedia outlets.
To label Twitter accounts as liberal or conservative, we use apolarity rule based on the number of tweets they produce with linksto liberal or conservative sources. Thereby, if an account has moretweets with URLs pointing to liberal sources, it is labeled as liberaland vice versa. Although the overwhelming majority of accountsinclude URLs that are either liberal or conservative, we remove anyaccount that has equal number of tweets from each side. Our finalset of labeled accounts includes 38,920 users.
Finally, we use label propagation to classify the remaining ac-counts in a similar way to previous work (cf. [1]). For this purpose,we construct a social network based on the retweets exchangedbetween users. The nodes of the retweet network are the users,which are connected by a direct link if one user retweeted a post ofanother user. To validate results of the label propagation algorithm,we apply a stratified cross (5-fold) validation to a set composed of38,920 seed accounts. We train the algorithm using 80% of the seedsand we evaluate the performance on the remaining 20%. Finally,we compute precision and recall by reiterating the validation of the5-folds. Both precision and recall scores show value around 0.89with bounds from 0.88 to 0.90. Both the scores for liberals are about0.87 with 0.85-0.88 bounds, while for conservatives the scores arearound 0.93 with 0.92-0.93 bounds. To further validate the proposedapproach, we use as a ground truth the political leaning of themedia outlet that users shared in their profile, obtaining precisionand recall scores in line with the previous approach.
Liberal ConservativeHumans 386,391 (38.7%) 122,761 (12.3%)Bots 82,118 (8.2%) 49,488 (4.9%)
(a) Number (percentage) of users per group
Liberal ConservativeHumans 957,726 (37.0%) 476,231 (18.4%)Bots 288,659 (11.1%) 364,727 (14.1%)
(b) Number (percentage) of tweets per group
3.3 Human-Bot InteractionWe next introduce four metrics to estimate the effectiveness of botactions in involving humans and, at the same time, measure to whatextent humans rely upon, and interact with the content generatedby social bots. Thereby, we propose the following metrics:
• Retweet Pervasiveness (RTP ) measures the intrusiveness ofbot-generated content in human-generated retweets:
RTP =no. of human retweets from bot tweets
no. of human retweets(1)
• Reply Rate (RR) measures the percentage of replies given byhumans to social bots:
RR =no. of human replies to bot tweets
no. of human replies(2)
• Human to Bot Rate (H2BR) quantifies human interaction withbots over all the human activities in the social network:
H2BR =no. of humans interaction with bots
no. of humans activity, (3)
where the numerator counts for human replies/retweets to/ofbots generated content, while the denominator is the sum ofthe number of human tweets, retweets, and replies.
• Tweet Success Rate (TSR) is the percentage of tweets gener-ated by bots that obtained at least one retweet by a human:
TSR =no. of tweet retweeted at least once by a human
no. of bots tweets(4)
4 RESULTSNext, we address the research questions discussed in the Intro-duction. We examine social bot partisanship and, accordingly, weanalyze bots’ strategies and measure the effectiveness of their ac-tions in terms of human engagement.
4.1 RQ1: Bot Political LeaningThe combination of the outcome from the bot detection algorithmand the political ideology inference allowed us to identify fourgroups of users, namely Liberal Humans, Conservative Humans,Liberal Bots, and Conservative Bots. In Table 2a, we show the per-centage of users per group. Note that percentages do not sum upto 100 as either the political ideology inference was not able toclassify every user, or Botometer did not return a score, as we pre-viously mentioned. In particular, we were able to assign a politicalleaning to 63% of bots and 67% of humans. We find that the liberaluser population is almost three times larger than the conservativecounterpart. This discrepancy is also present, but less evident, forthe bot accounts, which exhibit an unbalance in favor of liberal
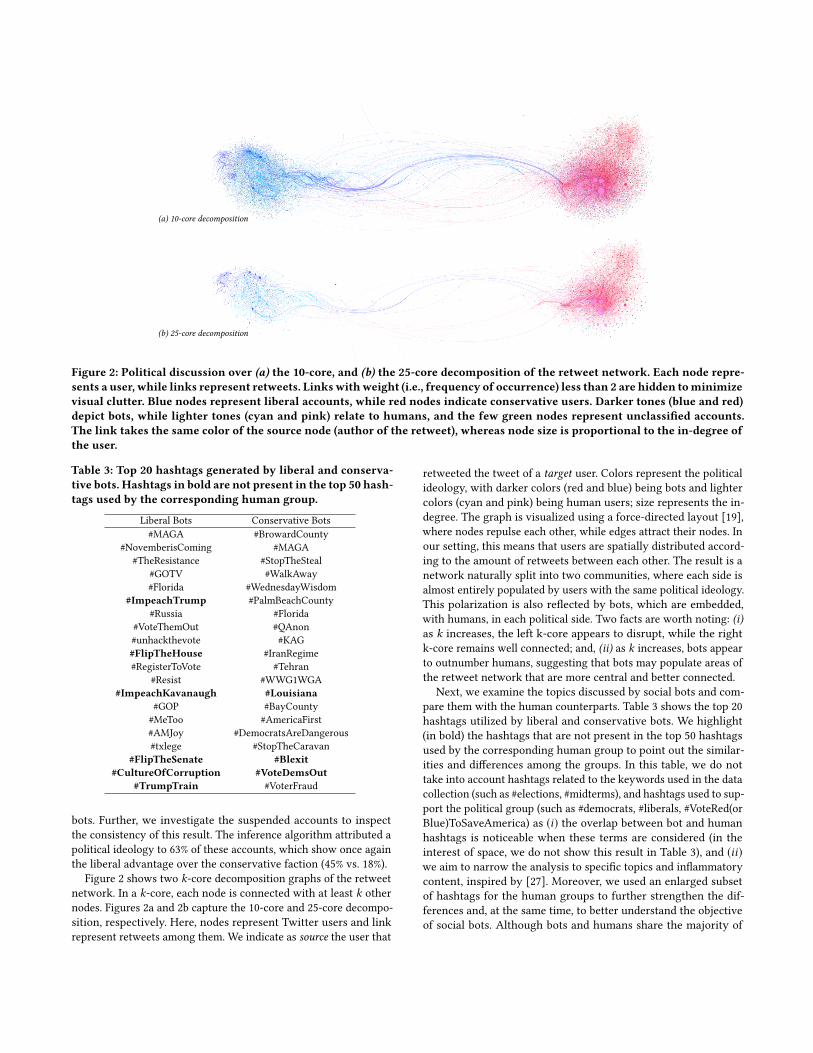
Figure 2: Political discussion over (a) the 10-core, and (b) the 25-core decomposition of the retweet network. Each node repre-sents a user, while links represent retweets. Linkswithweight (i.e., frequency of occurrence) less than 2 are hidden tominimizevisual clutter. Blue nodes represent liberal accounts, while red nodes indicate conservative users. Darker tones (blue and red)depict bots, while lighter tones (cyan and pink) relate to humans, and the few green nodes represent unclassified accounts.The link takes the same color of the source node (author of the retweet), whereas node size is proportional to the in-degree ofthe user.
Table 3: Top 20 hashtags generated by liberal and conserva-tive bots. Hashtags in bold are not present in the top 50 hash-tags used by the corresponding human group.
Liberal Bots Conservative Bots#MAGA #BrowardCounty
bots. Further, we investigate the suspended accounts to inspectthe consistency of this result. The inference algorithm attributed apolitical ideology to 63% of these accounts, which show once againthe liberal advantage over the conservative faction (45% vs. 18%).
Figure 2 shows two k-core decomposition graphs of the retweetnetwork. In a k-core, each node is connected with at least k othernodes. Figures 2a and 2b capture the 10-core and 25-core decompo-sition, respectively. Here, nodes represent Twitter users and linkrepresent retweets among them. We indicate as source the user that
retweeted the tweet of a target user. Colors represent the politicalideology, with darker colors (red and blue) being bots and lightercolors (cyan and pink) being human users; size represents the in-degree. The graph is visualized using a force-directed layout [19],where nodes repulse each other, while edges attract their nodes. Inour setting, this means that users are spatially distributed accord-ing to the amount of retweets between each other. The result is anetwork naturally split into two communities, where each side isalmost entirely populated by users with the same political ideology.This polarization is also reflected by bots, which are embedded,with humans, in each political side. Two facts are worth noting: (i)as k increases, the left k-core appears to disrupt, while the rightk-core remains well connected; and, (ii) as k increases, bots appearto outnumber humans, suggesting that bots may populate areas ofthe retweet network that are more central and better connected.
Next, we examine the topics discussed by social bots and com-pare them with the human counterparts. Table 3 shows the top 20hashtags utilized by liberal and conservative bots. We highlight(in bold) the hashtags that are not present in the top 50 hashtagsused by the corresponding human group to point out the similar-ities and differences among the groups. In this table, we do nottake into account hashtags related to the keywords used in the datacollection (such as #elections, #midterms), and hashtags used to sup-port the political group (such as #democrats, #liberals, #VoteRed(orBlue)ToSaveAmerica) as (i) the overlap between bot and humanhashtags is noticeable when these terms are considered (in theinterest of space, we do not show this result in Table 3), and (ii)we aim to narrow the analysis to specific topics and inflammatorycontent, inspired by [27]. Moreover, we used an enlarged subsetof hashtags for the human groups to further strengthen the dif-ferences and, at the same time, to better understand the objectiveof social bots. Although bots and humans share the majority of
Table 4: Average network centrality measures
Liberal ConservativeHumans 2.66 ·10−6 4.14 ·10−6Bots 3.70 ·10−6 7.81 ·10−6
(a) Out-degree centrality
Liberal ConservativeHumans 2.52 ·10−6 4.24 ·10−6Bots 2.53 ·10−6 6.22 ·10−6
(b) In-degree centrality
hashtags, two main differences can be noticed. First, conservativebots abide by the corresponding human counterpart more than theliberal bots. Second, liberal bots focus on more inflammatory andprovocative content (e.g., #ImpeachTrump, #ImpeachKavanaugh,#FlipTheSenate) w.r.t. conservative bots.
4.2 RQ2: Bot Activity and StrategiesIn this Section, we investigate social bot activity based on theirpolitical leaning. We explore their strategies in interacting withhumans and the degree of embeddedness in the social network.
Table 2b depicts the number (and percentage) of tweets generatedby each group. Despite the group composed of conservative botsis the smallest in terms of number of accounts, it produced moretweets than liberal bots and closely approaches the number oftweets generated by the human counterpart. The resulting tweetper user ratio shows that conservative bots produce 7.4 tweets peraccount, which is more than twice the ratio related to the liberalbots (3.5), almost the double of the human counterpart (3.9), andnearly three times the ratio of liberal humans (2.5).
To investigate the interplay between bots and humans, we con-sider the previously described retweet network. Figure 3 shows theinteraction among the four groups. We maintain the same colormapping described before, with darker color (on the bottom) rep-resenting bots and lighter color (on top) indicating humans. Nodesize is proportional to the percentage of accounts in each group,while edge size is proportional to the percentage of interactionsbetween each group. In Figure 3a, this percentage is computedconsidering all the interactions in the retweet network, while inFigure 3b we consider each group separately, therefore, the edgesize gives a measure of the group propensity to interact with theother groups. Consistently with Figure 2, we observe that there is alimited amount of interaction between the two political sides. Themajority of interactions are either intra-group or between groupsof the same political leaning. From Figure 3b, we can observe thatthe two bot factions adopted different strategies. Conservative botsbalanced their interactions by retweeting group members 43% ofthe time, and the human counterpart 52% of the time. On the otherhand, liberal bots mainly retweeted liberal humans (71% of the time)and limited the intra-group interactions to the 22% of their retweetactivity. Interestingly, conservative humans interacted with theconservative bots (28% of the time) much more than the liberalcounterpart (16%) with the liberal bots. To better understand theseresults and to measure the extent of human engagement with bots,in the next Section we evaluate the four metrics introduced earlierin this paper.
Figure 3: Interactions according to political ideology
Figure 4: k-core decomposition, liberal vs. conservativeusers
Finally, we examine the degree of embeddedness of both hu-mans and bots within the retweet network. For this purpose, wefirst compute different network centrality measures, and then weadopt the k-core decomposition technique to identify the mostcentral nodes in the graph. In Table 4, we show the average out-and in-degree centrality for each group of users. Out-degree cen-trality measures the quantity of outgoing links, while in-degreecentrality considers the number of of incoming links. Both of thesemeasures are normalized by the maximum possible degree of thegraph. Overall, conservative groups have higher centrality mea-sures than the liberal ones. We can notice that conservative botsachieve the highest values both for the out- and in-degree centrality.To further investigate bots embeddedness in the social network,we use the k-core decomposition. The objective of this techniqueis to determine the set of nodes deeply embedded in a graph. Thek-core is a subgraph of the original graph in which every node hasa degree equal to or greater than a given value k . We extractedthe k-cores from the retweet network by varying k in the rangebetween 0 and 30. Figure 4 depicts the percentage of liberal andconservative users as a function of k . We can notice that, as k grows,the fraction of conservative bots increases, while the percentageof liberal bots remains almost stationary. On the human side, theliberal fraction drops with k , whereas the conservative percentageremains approximately steady. Overall, conservative bots sit in amore central position in the social network and are more deeplyconnected if compared to the liberal counterpart.
Table 5: Bot Effectiveness in Human Engagement
Metric Liberal Bots Conservative BotsRT P 14.1% 25.6%RR 4.5% 15.5%
H2BR 12.3% 23.2%TSR 35.3% 35.0%
4.3 RQ3: Bot Effectiveness in HumanEngagement
In this Section, we aim to estimate the effectiveness of bot strategiesin involving humans and measure to what extent humans rely upon,and interact with the content generated by social bots. We examinethe effect of bot activities by means of the four metrics described inSection Human-Bot Interaction. We evaluate each political side sep-arately, thus, we compare the interaction between bots and humanswith the same leaning. In Table 5, we depict the results for eachgroup of bots. Diverse aspects are worthy of consideration. We canobserve that conservative bots are significantly more effective ininvolving humans in their conversations than the liberal counter-part. Although the TSRs of the red and blue bots are comparable,the gap between the two groups, with respect to the other metrics,is significant. To carefully interpret this result, it should also benoticed that (i) the TSR is inversely proportional to the numberof tweets generated by bots, and (ii) conservative bots tweetedmore than the liberal counterpart, as depicted in Table 2b. Overall,conservative bots received a larger degree of interaction with (andlikely trust from) human users. In fact, conservative humans inter-acted with the bot counterpart almost twice with retweets (RTP ),and more than three times with replies (RR) if compared to theliberal group. Finally, the H2BR highlights a remarkable amount ofhuman activities that involve social bots: almost one in four actionsperformed by conservative humans goes towards red bots.
5 CONCLUSIONS & FUTUREWORKIn this work, we conducted an investigation to analyze social botsactivity during the 2018 USMidterm election.We showed that socialbots are embedded in each political wing and behave accordingly.We observed different strategies between conservative and liberalbots. Specifically, conservative bots stand in a more central positionin the social network and abide by the topic discussed by the humancounterpart more than the liberal bots, which in turn exhibit aninflammatory attitude. Further, conservative bots balanced theirinteraction with humans and bots of the red wing, whereas liberalbots focused mainly on the interplay with the human counterpart.
Finally, we inspected the effectiveness of these strategies in termsof human engagement and recognized the strategy of the conser-vative bots as the most effective. However, these results open thedoor to further interpretation and discussion. Are conservative botsmore effective because of their strategy or because of the humanineptitude to distinguish their nature? This, and related analysis,will be expanded in future work.
Acknowledgements. The authors gratefully acknowledge support by the AirForce Office of Scientific Research (award #FA9550-17-1-0327). L. Luceri is funded bythe Swiss National Science Foundation (SNSF) via the CHIST-ERA project UPRISE-IoT.
REFERENCES[1] Adam Badawy, Emilio Ferrara, and Kristina Lerman. 2018. Analyzing the Digital
Traces of PoliticalManipulation: The 2016 Russian Interference Twitter Campaign.In Int. Conference on Advances in Social Networks Analysis and Mining. 258–265.
[2] Adam Badawy, Kristina Lerman, and Emilio Ferrara. 2019. Who Falls for OnlinePolitical Manipulation? Companion of the The Web Conference 2019 (2019).
[3] Alessandro Bessi and Emilio Ferrara. 2016. Social bots distort the 2016 USPresidential election online discussion. First Monday 21, 11 (2016).
[4] Olga Boichak, Sam Jackson, Jeff Hemsley, and Sikana Tanupabrungsun. 2018.Automated Diffusion? Bots and Their Influence During the 2016 US PresidentialElection. In International Conference on Information. Springer, 17–26.
[5] Alexandre Bovet and Hernán A Makse. 2019. Influence of fake news in Twitterduring the 2016 US presidential election. Nature communications 10, 1 (2019), 7.
[6] Leo Breiman. 2001. Random forests. Machine learning 45, 1 (2001), 5–32.[7] Nikan Chavoshi, Hossein Hamooni, and Abdullah Mueen. 2016. DeBot: Twitter
Bot Detection via Warped Correlation.. In ICDM. 817–822.[8] Zhouhan Chen and Devika Subramanian. 2018. An Unsupervised Approach to
Detect Spam Campaigns that Use Botnets on Twitter. arXiv:1804.05232 (2018).[9] Clayton Allen Davis, Onur Varol, Emilio Ferrara, Alessandro Flammini, and
Filippo Menczer. 2016. Botornot: A system to evaluate social bots. In Proceedingsof the 25th International Conference Companion on World Wide Web.
[10] Ashok Deb, Luca Luceri, Adam Badawy, and Emilio Ferrara. 2019. Perils andChallenges of Social Media and Election Manipulation Analysis: The 2018 USMidterms. Companion of the The Web Conference 2019 (2019).
[11] Emilio Ferrara. 2015. Manipulation and abuse on social media. ACM SIGWEBNewsletter Spring (2015), 4.
[12] Emilio Ferrara. 2017. Disinformation and Social Bot Operations in the Run Up tothe 2017 French Presidential Election. First Monday 22, 8 (2017).
[13] Emilio Ferrara, Onur Varol, Clayton Davis, Filippo Menczer, and AlessandroFlammini. 2016. The rise of social bots. Commun. ACM 59, 7 (2016), 96–104.
[14] Emilio Ferrara, Onur Varol, Filippo Menczer, and Alessandro Flammini. 2016.Detection of promoted social media campaigns. In ICWSM. 563–566.
[15] Nir Grinberg, Kenneth Joseph, Lisa Friedland, Briony Swire-Thompson, andDavidLazer. 2019. Fake news on Twitter during the 2016 U.S. presidential election.Science 363, 6425 (2019), 374–378.
[16] Andrew Guess, Jonathan Nagler, and Joshua Tucker. 2019. Less than you think:Prevalence and predictors of fake news dissemination on Facebook. ScienceAdvances 5, 1 (2019), eaau4586.
[17] Philip N Howard, Gillian Bolsover, Bence Kollanyi, Samantha Bradshaw, andLisa-Maria Neudert. 2017. Junk news and bots during the US election: What wereMichigan voters sharing over Twitter. CompProp, OII, Data Memo (2017).
[18] Jane Im, Eshwar Chandrasekharan, Jackson Sargent, Paige Lighthammer, TaylorDenby, Ankit Bhargava, Libby Hemphill, David Jurgens, and Eric Gilbert. 2019.Still out there: Modeling and Identifying Russian Troll Accounts on Twitter.arXiv:1901.11162 (2019).
[19] Mathieu Jacomy, Tommaso Venturini, Sebastien Heymann, and Mathieu Bastian.2014. ForceAtlas2, a continuous graph layout algorithm for handy networkvisualization designed for the Gephi software. PloS one 9, 6 (2014), e98679.
[20] Sneha Kudugunta and Emilio Ferrara. 2018. Deep Neural Networks for BotDetection. Information Sciences 467, October (2018), 312–322.
[21] Bjarke Mønsted, Piotr Sapieżyński, Emilio Ferrara, and Sune Lehmann. 2017.Evidence of Complex Contagion of Information in Social Media: An ExperimentUsing Twitter Bots. Plos One 12, 9 (2017), e0184148.
[22] Nathaniel Persily. 2017. The 2016 US Election: Can democracy survive theinternet? Journal of democracy 28, 2 (2017), 63–76.
[23] Iacopo Pozzana and Emilio Ferrara. 2018. Measuring bot and human behavioraldynamics. arXiv:1802.04286 (2018).
[24] Dietram A Scheufele and Nicole M Krause. 2019. Science audiences, misinforma-tion, and fake news. PNAS (2019), 201805871.
[25] Chengcheng Shao, Giovanni Luca Ciampaglia, Onur Varol, Kai-Cheng Yang,Alessandro Flammini, and Filippo Menczer. 2018. The spread of low-credibilitycontent by social bots. Nature communications 9, 1 (2018), 4787.
[26] Kai Shu, Amy Sliva, Suhang Wang, Jiliang Tang, and Huan Liu. 2017. Fake newsdetection on social media: A data mining perspective. ACM SIGKDD ExplorationsNewsletter 19, 1 (2017), 22–36.
[27] Massimo Stella, Emilio Ferrara, and Manlio De Domenico. 2018. Bots increase ex-posure to negative and inflammatory content in online social systems. Proceedingsof the National Academy of Sciences 115, 49 (2018), 12435–12440.
[29] Onur Varol, Emilio Ferrara, Clayton A Davis, Filippo Menczer, and AlessandroFlammini. 2017. Online human-bot interactions: Detection, estimation, andcharacterization. In Int. AAAI Conference on Web and Social Media. 280–289.
[30] Soroush Vosoughi, Deb Roy, and Sinan Aral. 2018. The spread of true and falsenews online. Science 359, 6380 (2018), 1146–1151.
[31] Samuel Woolley and Douglas Guilbeault. 2017. Computational propaganda in theUnited States of America: Manufacturing consensus online. CompProp (2017).
[32] Kai-Cheng Yang, Onur Varol, Clayton A Davis, Emilio Ferrara, Alessandro Flam-mini, and Filippo Menczer. 2019. Arming the public with artificial intelligence tocounter social bots. Human Behavior and Emerging Technologies (2019), e115.