Red Cedar River Erosion and Habitat Assessment Report March 24, 2014 Prepared for: Tainter Menomin Lake Improvement Association, Inc. P.O. Box 185 Menomonie, WI 54751 Red Cedar River Erosion Partnership
Transcript
Red Cedar River Erosion and HabitatAssessment Report
March 24, 2014
Prepared for:
Tainter Menomin Lake Improvement Association, Inc.P.O. Box 185
Menomonie, WI 54751
Red Cedar River Erosion Partnership
RED CEDAR RIVER EROSION AND HABITAT ASSESSMENTDRAFT REPORT
Prepared for:
Tainter Menomin Lake Improvement Association, Inc.P.O. Box 185
Menomonie, WI 54751
Red Cedar River Erosion Partnership
Citizen Representatives: Dale Styer and Mark Mosey
Prepared by
Inter-fluve, Inc.301 S. Livingston St., Suite 200
Madison, WI 53703608-441-0342
March 24, 2014
Red Cedar River Erosion Report
i | P a g e
EXECUTIVE SUMMARYTainter Lake is a 1,690 acre reservoir located in north central Dunn County, Wisconsin createdby the Cedar Falls Dam near Menomonie, WI. The lake is highly eutrophic and experiencessevere summer algae blooms and poor water clarity, which are largely associated with elevatedphosphorus concentrations. Additionally, sediment from the encroaching Red Cedar River deltahas been filling the east end of the lake at a rough rate of 19 feet/year. Over 60 erosion sites havebeen identified along the channel within Dunn County (Dunn County LCD, 2008), includingsites with adjacent infrastructure such as the Village of Colfax wastewater treatment facility. Itis assumed that sediment from these erosion sites is responsible for the expansion of the delta.The combination of impacts has degraded water quality and ecological function, reduced access,impaired fishing and other recreational activities, and decreased aesthetics for residents livingalong its shoreline and potential visitors.
The Tainter Menomin Lake Improvement Association, Inc. (TMLIA), and its partners(Appendix H), aim to reduce both the sediment and phosphorus impacts to Tainter Lake.Because phosphorus is largely transported attached to fine sediment, and because the Red CedarRiver is delivering relatively large volumes of sediment to the impoundment, limiting upstreamerosion could potentially decrease both the nutrient and sediment inputs. By reducing erosion atcritical sites along the river, they hope to effectively address both impacts. This study aims toidentify and quantify erosion issues along the Red Cedar River upstream of Tainter Lake andidentify potential treatment options. In part, it builds on an initial bank erosion survey completedby the Dunn County Land Conservation Division (2006).
For this study, the Red Cedar River banks within Dunn County were digitized on a series ofaerial photographs, including photos from 1938, 1974, 1992, 2005, and 2012. The channels andphotographs were overlaid in a Geographic Information System project (GIS; ESRI ArcGIS10.1) in order to observe general trends in channel behavior and provide detailed data on channelchange over the period between photographs. At the outset, the digitized bank lines suggestedthe channel could be divided into two reaches where 1) upstream of Colfax, WI, the channel isrelatively stable, and 2) downstream of Colfax, the channel is relatively active. In both reaches,the channel is eroding banks at the outside of meander bends and depositing material on barsopposite of the erosion, which in general, is how similar rivers operate. However, along thedownstream reach, the meander bends appear to be eroding banks at a higher rate. Additionally,the downstream channel has changed position (i.e., avulsed, cutoff) in the floodplain during largefloods in the 1960s and 1980s, and is now trying to erode new meander bends.
The glacially-derived sands comprising the higher bluffs and lower floodplain soils have littlecohesion, high permeability, and little ability to hold water to support vegetation at steep slopes,and therefore are easily mobilized. The air photo analysis shows that the river reach betweenColfax and Tainter Lake has been very active via both meander migration and chute
Red Cedar River Erosion Report
ii | P a g e
cutoffs/avulsions over the last 75 years, and likely much longer (100s to 1000s of years). Theerosion and subsequent sediment transport that would normally proceed downstream is beingdeposited at the upper end of the lake in the form of a delta. The process appears to be naturaland consistent with river function.
Our analysis indicates that sediment is sourced within the project reach from two primarymechanisms, bluff erosion and channel cutoffs and subsequent adjustment. Erosion is occurringamong several bluff sites where the river is interacting with higher valley wall. For relativelyminor lateral erosion or channel migration a large volume of sediment is washed into river fromthe taller bluffs, especially at the Dobbs Landing Bend. At sites where the channel has avulsedand either cut or reactivated a new channel, a large volume of sediment is also put intodownstream transport via the initial cut and subsequent meander establishment.
What has not been quantified is the total load of sediment carried by the river. Additionalsources for this may be sediment sourced from normal bank scour at the interface of the channeland floodplain (non-bluff sites) and sediment delivered by tributaries. Temporary and permanentsediment storage within point bar and island deposits, or on the floodplain, also affect the totalload that might reach Tainter Lake in any given year. Some attempt to discern the total loadcontributed to the Tainter Lake delta has been made and appears to range from a low of about15,000 CY/year to 60,000 CY/year. Sediment volume from specific erosion sites upstream ofTainter Lake is estimated at approximately 50,000 CY/year, of which about 30% is from bluffsites. The Dobbs Landing site comprises 17% of the estimated total sediment volume from theassessed erosion and 58% of the estimated erosion at bluff sites.
This report indicates that deliberate and natural processes appear to be at work within the RedCedar River and stopping, or even managing these processes on a large scale, will be difficult. Italso indicates that reducing channel erosion will have little impact on the phosphorus inputs intoTainter Lake. In addition, the lake creates an unnatural condition within the river that willcontinue to collect sediment derived from the relatively active meander migration upstream. Forthis reason, we recommend sediment management efforts include an active plan within the deltaitself, likely focused on dredging. However; although stopping the natural process at work abovethe lake isn’t possible, the rates of sediment delivery to Tainter Lake might be influenced in theshort term (decades). This action, in combination with sediment management at the delta, mightpresent a reasonable approach to balancing the natural process with the less desirableconsequences within Tainter Lake.
To begin the process of slowing the rate of sediment delivery, bluff stabilization including somecombination of engineered riprap, rock or log barbs, log cribwalls, floodplain benchconstruction, and toe scour protection can be implemented. Bluff erosion protection does notprovide protection against avulsion not related to the erosion control project. Dobbs Landingwould be a primary location to begin, followed by bends adjacent to infrastructure, such as along
Red Cedar River Erosion Report
iii | P a g e
the Colfax wastewater treatment facility, the Colfax School, or residences on the south side ofthe river in Colfax.
At all of the bluff erosion sites, we recommend providing either passive or active sloperevegetation and installation of a vegetated buffer at the top of the slope. The vegetation should benative woody vegetation, forbs and grasses. Upper slope buffer vegetation will prevent runofffrom concentrating; thereby limiting the potential for gullying and rilling on the slope face, andkeeping extra sediment from reaching the channel. Gully erosion on the Dobbs Landing Bend(52) face has likely contributed as much sediment as many of the eroding banks elsewhere in thereach. The gullying may have been prevented by a buffer instead of the row crops that extend tothe slope break.
Red Cedar River Erosion Report
iv | P a g e
Table of ContentsEXECUTIVE SUMMARY.............................................................................................................. i
INTRODUCTIONTainter Lake is a 1,690 acre reservoir located in north central Dunn County, Wisconsin. The lakewas created by a hydroelectric dam at Cedar Falls in Menomonie, Wisconsin, that impounds theHay and Red Cedar Rivers just downstream of their confluence. The lake is highly eutrophicand experiences severe summer algae blooms and poor water clarity, which are largelyassociated with elevated phosphorus concentrations. Phosphorus concentrations in the lake areoften higher than 50ug/L. Additionally, sediment from the encroaching Red Cedar River deltahas been filling the east end of Tainter Lake. The combination of impacts has degraded waterquality and ecological function, reduced access, impaired fishing and other recreationalactivities, and decreased aesthetics for residents living along its shoreline and potential visitors.
The Red Cedar River drains approximately 1,480 square miles of mixed deciduous forest andagricultural land upstream of Tainter Lake. The area soils are primarily derived of glacial sandsand gravels, which are often easily eroded by rivers and streams. Along the Red Cedar River, thebanks are often steep, with exposed soil, downed trees, and little vegetation cover, indicating thatthe channel has been historically active.
The Tainter Menomin Lake Improvement Association, Inc. (TMLIA), and its partners(Appendix H), aim to reduce both the sediment and phosphorus impacts to Tainter Lake.Because phosphorus is largely transported attached to fine sediment, and because the Red CedarRiver is delivering relatively large volumes of sediment to the impoundment, limiting upstreamerosion could potentially decrease both the nutrient and sediment inputs. By reducing erosion atcritical sites along the river, they hope to effectively address both impacts. This study aims toidentify and quantify erosion issues along the Red Cedar River upstream of Tainter Lake andidentify potential treatment options. In part, it builds on an initial bank erosion survey completedby the Dunn County Land Conservation Division (2006).
Existing ConditionsPhysiologic SettingThe Red Cedar River Watershed encompasses over 1,890 square miles in west centralWisconsin. The river primarily flows south and southwest through Barron and Dunn Countiesbefore finally joining the Chippewa River near Dunnsville, WI (Figure 1). The watershedencompasses a wide range of soils and landscapes ranging from low relief glacial till and sandyoutwash areas, to loess-capped high relief sandstone uplands. The area receives between 30-34inches of annual precipitation, with warm, humid summers and cold winters. Average snowfall isaround 43 inches (NRCS 2004, 2008; WDNR 2014). Agriculture accounts for 58% of thelanduse in the watershed, and forest land accounts for another 35% of the area, although forestscovered 90% of the watershed in the late 1800s (NRCS 2008). Small industry, agriculture,forestry, outdoor recreation, and tourism drive the local economy (NRCS 2008).
Red Cedar River Erosion Report
2 | P a g e
Figure 1. Red Cedar River Watershed (See Appendix A).
Red Cedar River Erosion Report
3 | P a g e
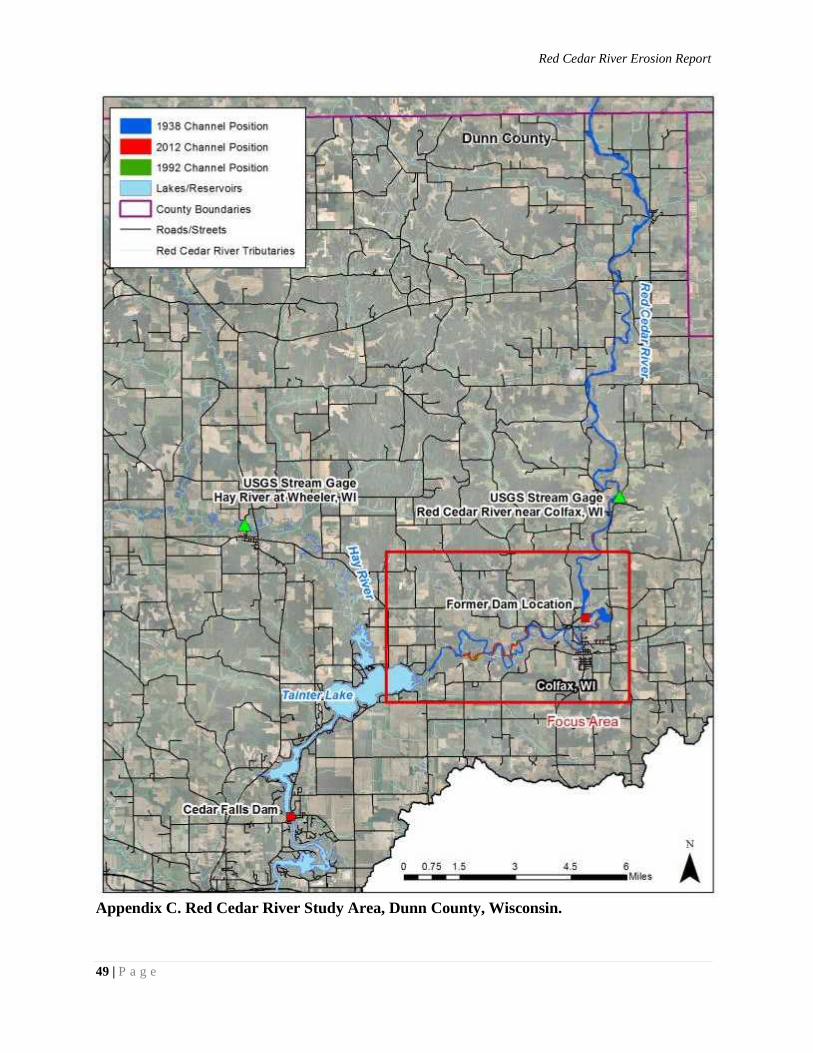
Figure 2. Red Cedar River Study Area, Dunn County, Wisconsin (See Appendix B).
Red Cedar River Erosion Report
4 | P a g e
Geology and Soils
Figure 3. Quaternary Geology Map from Goerbel et al. 1983. The red box represents the study area and theblack circle demarcates the confluence of the Hay and Red Cedar Rivers. Tlp – loamy soil formed in groundmoraine materials, often over shallow bedrock. Gg – Glacial outwash deposits of sand and gravel.
Red Cedar River Erosion Report
5 | P a g e
The study area is largely focused on the southern end of the Red Cedar River, between the DunnCounty Line in the north and Tainter Lake to the south (Figure 2). Along this reach, the landscapetransitions from predominantly undulating till plains in the north to the more dissected, ridge andvalley system more characteristic of the driftless area in the south. The hills are mantled in loamysoils formed in loess, silty and sandy alluvium, sandy and loamy colluvium, or sandy loam till(tlp; Figure 3). They range from excessively drained to somewhat poorly drained and generallyhave silt loam to loamy sand surface textures, moderate to rapid permeability, and moderate tolow available water capacity. On the ridges, many of the soils are relatively thin over sandstonebedrock (NRCS 2004; 2008).
As glaciers retreated to the north, meltwater deposited sand and gravel along the major outwashchannels, which now line the valleys of the Hay and Red Cedar Rivers (gg; Figure 3). As therivers developed after the ice age, the channel cut through the sands and gravels, leaving thecoarse material behind in terraces. The resulting bluffs are often associated with the excessivelydrained sand of the Plainfield soils and the sandy loam of the Forkhorn soil group which havedeveloped in the terrace material. Stream cutting and deposition also formed swamps, sloughs,and marshes along the river floodplain. The floodplain soils formed in sandy and loamy alluviumor muck, range from moderately well drained to very poorly drained, and are subject to periodicflooding (NRCS 2004; 2008).
The surficial geology map indicates that the area enclosing the Hay-Red Cedar River confluenceis wider than the valleys upstream of the confluence (Figure 3). This wider area may haveallowed for additional sediment storage in this part of the system, or it may have supported aglacial lake. There is also the possibility that flood water and sediment deposition associatedwith alternating glacial outwash floods down the Hay or Red Cedar River forced the non-flooding branch to back up and deposit its excess sediment. This change may be partlyresponsible for the more active potion of the channel at the downstream end of the focus reach,but more study would be needed to understand the true cause of the increased activity.
HydrologyA U.S. Geological Survey stream flow gage was located within the project area along the RedCedar River near Colfax, WI (Site 05367500; http://waterdata.usgs.gov/wi/nwis/), locatedupstream of the village on County Highway M (Figure 2). The gage provided annual maximumflow (peak flow) data from 1914 through 1990 (Figure 4). More recent peak flow data wereestimated using a regression equation formed by comparing measured floods on the Red CedarRiver stream gage data and data for the same floods (by year) at an existing U.S. GeologicalSurvey stream gage on the Hay River at Wheeler, WI (Site 05368000). The latter estimatesappear to omit at least one significant flood in 2010 (Styer, personal communication).
Red Cedar River Erosion Report
6 | P a g e
Most of the historic annual peak flows range between approximately 2,000 and 10,000 ft3/s(cfs), with large floods exceeding 15,000 cfs (1938, 1989, and 1965) and extreme floodsexceeding 20,000 cfs (1934 and 1967). Table 1 provides the statistical return intervals for theannual peak floods. To estimate these flows, we fit the log-Pearson Type III (LP3) probabilitydistribution (IACWD, 1982) to t h e annual peak flood data at the Red Cedar River gage.Results from similar peak flow analyses performed for FEMA (2011) are also provided in Table1.
Figure 4. Annual peak flood magnitudes at the Red Cedar River near Colfax, WI stream gage (Site 05367500).
Table 1. Flood quantiles at the Red Cedar River near Colfax, WI stream gage (Site 05367500). The gageprovided peak flow data from 1914 through 1990.
HydraulicsThe U.S. Army Corps of Engineers Hydraulic Engineering Center’s River Analysis System(HEC RAS) model (HEC, 2010) was developed using total station survey data collected by theTMLIA and Dunn County Land Conservation Division in the autumn of 2013. The data wereonly collected along the section of river adjacent to the Colfax wastewater treatment facility,with the exception of one site downstream of Dobb’s Landing. The reach included a bluff on thesouth side of the channel and extensive floodplain on the north, as well as a transition to a riffleand island at the downstream end. The bed material ranged from sand to coarse gravel, withsmall cobbles at the riffle head. Although the site may not be representative of the entire system,its similarities to other observed reaches allow for some insight into general hydraulicconditions.
Red Cedar River Erosion Report
7 | P a g e
The data were processed in both ArcGIS and Microsoft Excel in order to obtain distancesbetween survey points and cross sections. In addition to the cross sections, survey pointsincluded thalweg positions used to create a reach alignment and longitudinal profile. Reachlengths between cross sections were measured along this alignment, as were overland flowpathdistances.
In HEC-RAS, roughness values, (Manning’s n; a measure of resistance to flow based on channeland bed materials and form) of 0.038 were assigned to the channel and 0.1 to floodplain. Thechannel roughness values were based upon Arcement and Schneider’s (1989) predictions forgravel bed channels with moderate irregularity, little variation in channel cross section, andminor obstructions. In the floodplain, the roughness values were consistent with minorirregularities and obstructions and large vegetation (vegetation greater than floodplain flowdepth).
The cross section geometry used in the model provided a conservative estimate of maximumwater levels as the survey data was limited to the bankfull channel and flow above the bankfullelevation was not allowed to spill onto the entire floodplain on the north side of the channel(Figure 5). Consequently, predicted water surface elevations from the model were valid only upto the floodplain elevation. Above this elevation, the predicted water surfaces were artificiallyhigher. The results of the hydraulic model indicate that the channel has a flow capacityapproximating the 2 year return interval flood (Figure 5), which is within the expected range forgravel bed rivers.
Figure 5. A cross section from the HEC RAS model at the upstream end of the wastewater treatment facilityreach. Note that the channel bank tops (red dots) are reached during the 2-year flood. At the 100-year flood,less than 4 feet of water is on the floodplain.
Red Cedar River Erosion Report
8 | P a g e
In the waste water facility reach, the channel generates between 0.3 and 1.0 lbs/square foot ofshear stress on the channel bed during a typical flood event (1.5 -2 year return interval; Figure 6).This shear stress can initiate transport of coarse gravel along most of the bed, and small cobblesat the head of the downstream riffle (station 220; estimated by Shields parameter; Julien, 2010).At larger flows (e.g., 50 – 100 year return intervals), the maximum shear stresses shift upstreamand are capable of moving small to moderate sized cobbles. Overall, the HEC RAS analysisindicates the channel and bed sediment are, in general, adjusted to the hydraulics of this reach.
Figure 6. Shear stress results from HEC RAS model. At floods with recurrence intervals of at least 5 years, theshear stresses are large enough to mobilize coarse gravels. Extreme floods can move larger cobbles.
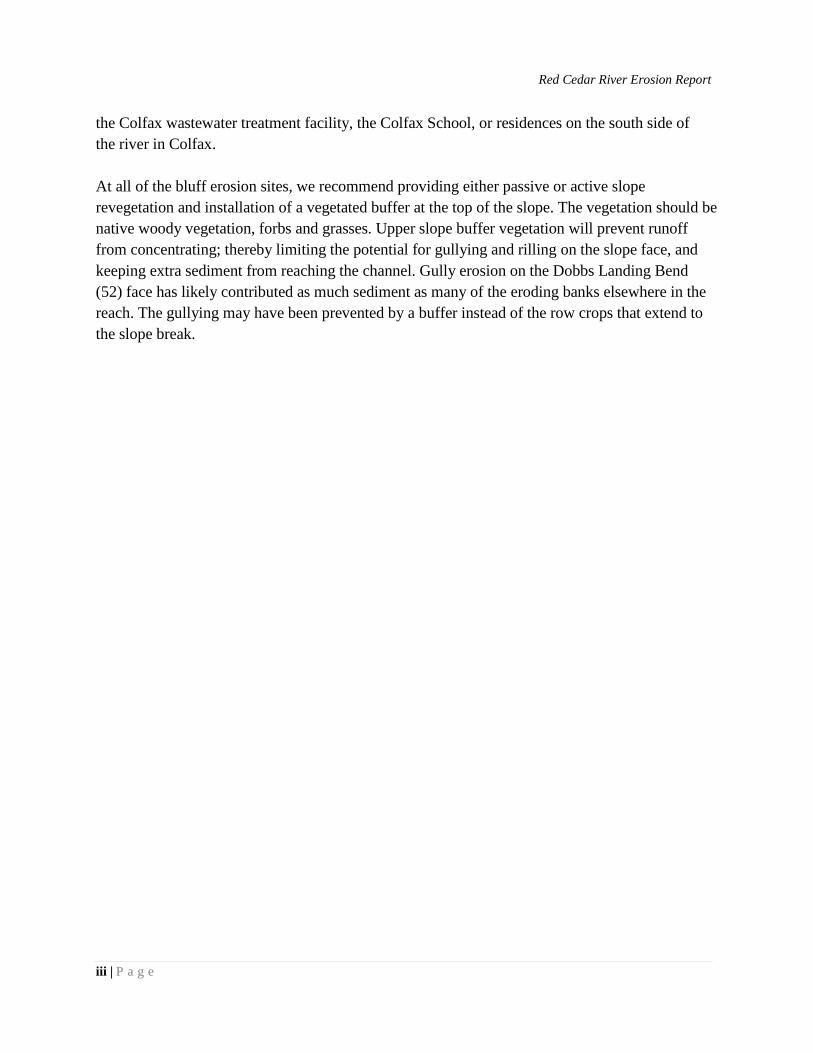
GEOMORPHOLOGY AND BANK EROSIONRivers and streams evolve and adjust to efficiently pass the sediment and water delivered themfrom upstream. When the energy associated with the flow and channel slope balance thesediment load and bed material size, the channel is considered stable and in equilibrium (Figure7). Although resilient, large or consistent changes in flood flows related to climate ormanagement (e.g., dam operations) will likely result in a change in channel dimensions toaccommodate the new conditions. Increases in flow will lead to erosion and a larger channel, anddiminished flows will result in deposition and a smaller channel. Similarly, increases in sedimentdelivery will usually result in channel deposition and a decrease in sediment delivery oftenresults in erosion along the bed and banks (Figure 7).
Red Cedar River Erosion Report
9 | P a g e
Figure 7. Lane’s Balance – Channels in equilibrium balance their slope and flow capacity with their sedimentload and sediment size.
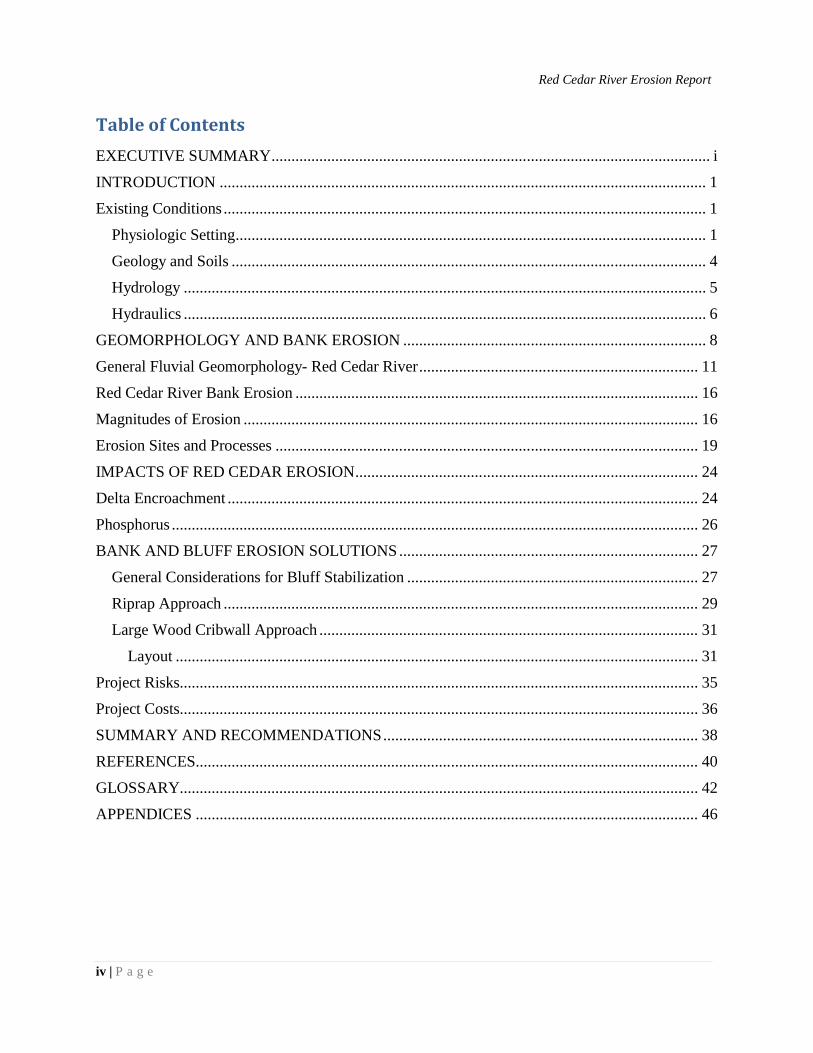
Excessive channel migration or bank erosion can be a symptom of a hydrologic and/or sedimentimbalance along a channel. Deposition in the channel often creates sand or gravel bars that forceflow along banks, eroding them while creating a wider channel. Conversely, incising ordowncutting channels often create over-steepened banks that result in failure. However, not allbank erosion is a sign of channel instability. Under equilibrium conditions, many channels stillcontinually erode at the outside of bends while depositing a similar amount of material on pointbars at the inside of the bends (Figure 8). This process is natural, and allows the channel todissipate energy, maintain sediment in the channel, and yet still move stored sedimentdownstream. It also helps create and maintain a diverse floodplain environment.
Figure 8. Typical meander bend dynamics in equilibrium systems. The channel erodes on the outside of bendsand builds a point bar/floodplain on the inside of the bends.
Red Cedar River Erosion Report
10 | P a g e
One characteristic of meandering channels is that as bends get larger or tighter, the channel isgetting longer. Therefore, the channel slope (i.e., rise/run) is decreasing because the run isgetting larger as the rise stays the same. Everything else equal, a channel with a lower slope hasa decreased ability to move water and sediment. When the length becomes too extreme, themeander loop is cutoff to bring the channel back into balance, either at the neck of the bend orthrough a chute through the floodplain, usually during a flood event. The occurrence of cutoffevents, although sporadic, is a key component in the complex dynamics of meandering rivers(Camporeale, et al 2005). Cutoffs remove older meanders, limiting the number and shape of thebends, which stabilizes the river geometry around a general steady state, equilibrium planformshape. Meander bends also create a perturbation that impacts meander dynamics all along thechannel. The energy configuration following the cutoff impacts meanders up and downstream,and a new pattern begins to develop in the chute channel. In these systems, the constant shiftingof channel position often allows riparian flora and fauna, evolved to these conditions, to developa diverse patchwork within the floodplain (Figure 9).
Figure 9. Typical meandering channel system with diverse floodplain habitats and consistent meander widththrough the valley walls.
Red Cedar River Erosion Report
11 | P a g e
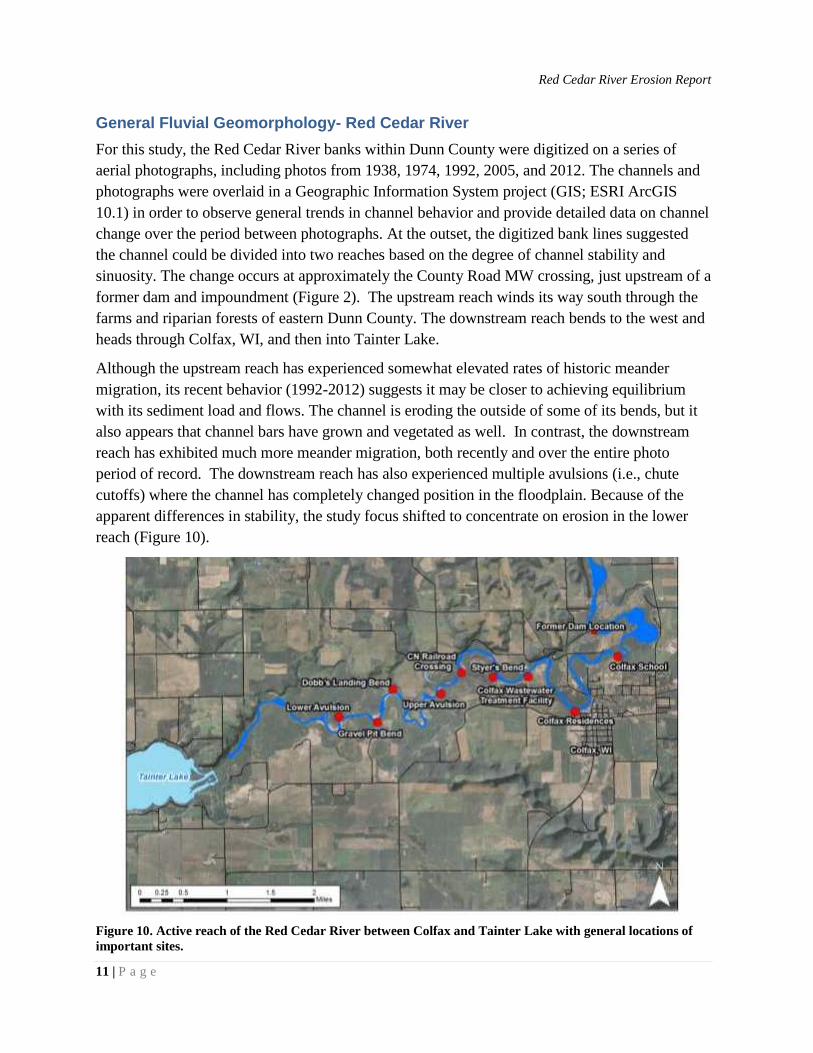
General Fluvial Geomorphology- Red Cedar RiverFor this study, the Red Cedar River banks within Dunn County were digitized on a series ofaerial photographs, including photos from 1938, 1974, 1992, 2005, and 2012. The channels andphotographs were overlaid in a Geographic Information System project (GIS; ESRI ArcGIS10.1) in order to observe general trends in channel behavior and provide detailed data on channelchange over the period between photographs. At the outset, the digitized bank lines suggestedthe channel could be divided into two reaches based on the degree of channel stability andsinuosity. The change occurs at approximately the County Road MW crossing, just upstream of aformer dam and impoundment (Figure 2). The upstream reach winds its way south through thefarms and riparian forests of eastern Dunn County. The downstream reach bends to the west andheads through Colfax, WI, and then into Tainter Lake.
Although the upstream reach has experienced somewhat elevated rates of historic meandermigration, its recent behavior (1992-2012) suggests it may be closer to achieving equilibriumwith its sediment load and flows. The channel is eroding the outside of some of its bends, but italso appears that channel bars have grown and vegetated as well. In contrast, the downstreamreach has exhibited much more meander migration, both recently and over the entire photoperiod of record. The downstream reach has also experienced multiple avulsions (i.e., chutecutoffs) where the channel has completely changed position in the floodplain. Because of theapparent differences in stability, the study focus shifted to concentrate on erosion in the lowerreach (Figure 10).
Figure 10. Active reach of the Red Cedar River between Colfax and Tainter Lake with general locations ofimportant sites.
Red Cedar River Erosion Report
12 | P a g e
The sinuosity (i.e., channel length/valley length) along the focus reach increases to 1.8 comparedto 1.4 along the upstream reach. Based on both field observations and the GIS data, meanchannel widths are approximately 200 feet; however the GIS data predicts slightly higher meanwidth for the upstream reach (210 feet) than the downstream reach (195 feet). Mean bankfulldepths observed at limited field locations were estimated at around 5 feet, but maximum depthsare likely around 10 feet (Figure 5), and maybe higher in areas of severe scouring.
Based on survey data included in the Federal Emergency Management Agency (FEMA 2011)Flood Insurance Study for Dunn County, the average slope of the river within the county is0.08%. There is a slight break in slope at station 224000 where the upstream reach gradient of0.07% increases slightly to 0.09% along the downstream focus reach, further supporting thereach division (Figure 11). Along the downstream reach, the channel bed slope varies. Forinstance, it is relatively flat along the waste water treatment facility and downstream of DobbsLanding Bend, but it is steeper downstream of the wastewater facility (Dale Styer’s Bend) andthrough the straight reach where the chute cutoff occurred downstream of Dobb’s Landing(Figure 12). These variations are likely related to shifts in sinuosity and sediment storageassociated with cutoffs.
Figure 11. Long Profile of the Red Cedar River through Dunn County, WI. “Flood Elevation” represents thestatistical 100 year return interval flood (from Dunn County Flood Insurance Study, FEMA 2008).
Figure 12. Long Profile of the Red Cedar River through the focus reach of the Red Cedar River study area,from the Tainter Lake delta to the abandoned dam upstream of Colfax to.
Red Cedar River Erosion Report
13 | P a g e
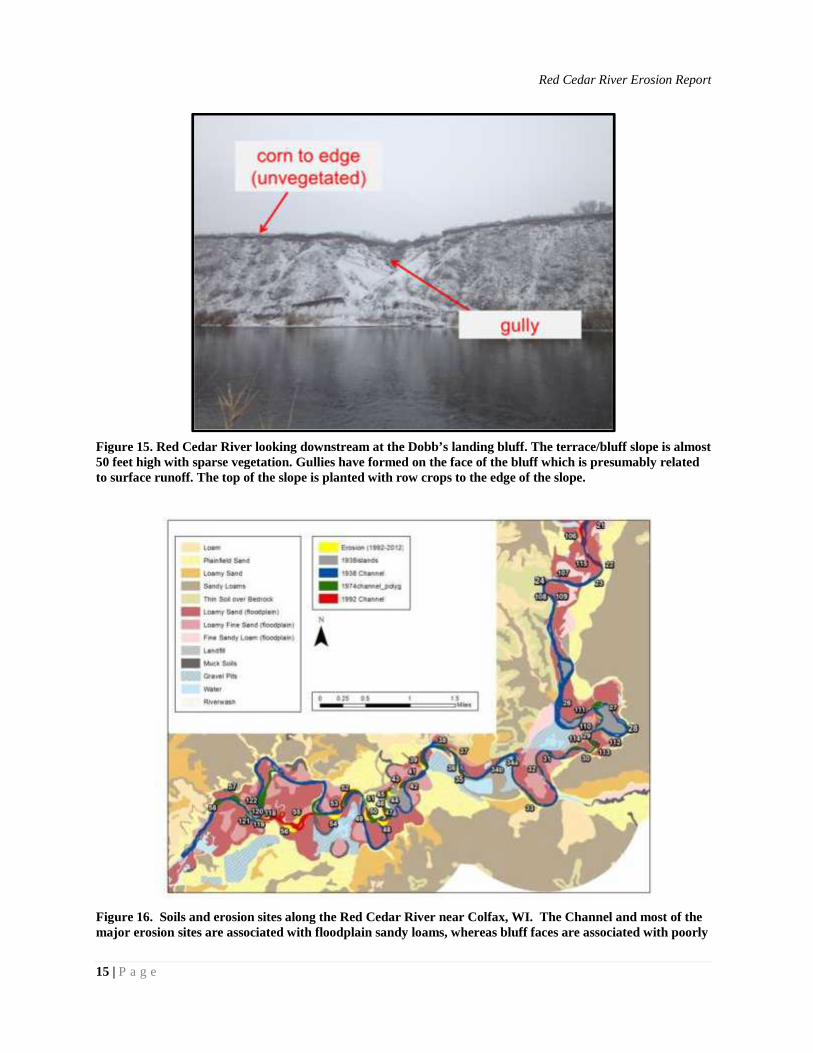
Field visits and photographs of channel margins indicate that much of the channel is bordered bylower elevation, sandy, floodplain deposits supporting riparian deciduous forests (i.e., floodplainbanks). Most of the channel remains completely within the floodplain, which in the lowersection features the Algansee-Kalmerville Complex of fine sandy loam and sandy loam. The soilis relatively deep and exposed to flooding and high water tables. Most of the documentederosion occurs within these soils along the floodplain banks (Figure 16).
Where the channel abuts the valley wall, it generally flows along 10 to 50 foot high, steep, sandybluffs (Figure 13-15). The bluffs represent the exposed faces of terrace deposits comprisingexposed glacial outwash sand and gravel left behind after the river downcut in response to glacialretreat. The bluff soils are primarily Plainfield Sand, with some Forkhorn Sandy Loam (Figure16). The sandy loam often comprises the terrace treads and the exposed bluff face is usually theless developed Plainfield soil. Many erosion sites identified by the TMLIA and Dunn CountyLand Resource Department (2008) are associated with the bluff areas; however, erosion offsetsat some of these sites, especially those characterized as sandy loam, are often less than at nearbyfloodplain sites.
The bluffs have little vegetation, presumably because the sand and gravel cannot hold enoughmoisture to support plant survival and possibly, because the surface materials are easilytransported via sloughing or rotational failures, making plant establishment difficult. To somedegree, the steep slopes and inability of the sand to hold water, and therefore support vegetation,lengthens recovery time and makes the banks appear worse than they actually are. However,many of the bluff sites are quite active as well, especially Dobbs Landing Bend (site 52) whichcontributes a significant amount of sediment to the system.
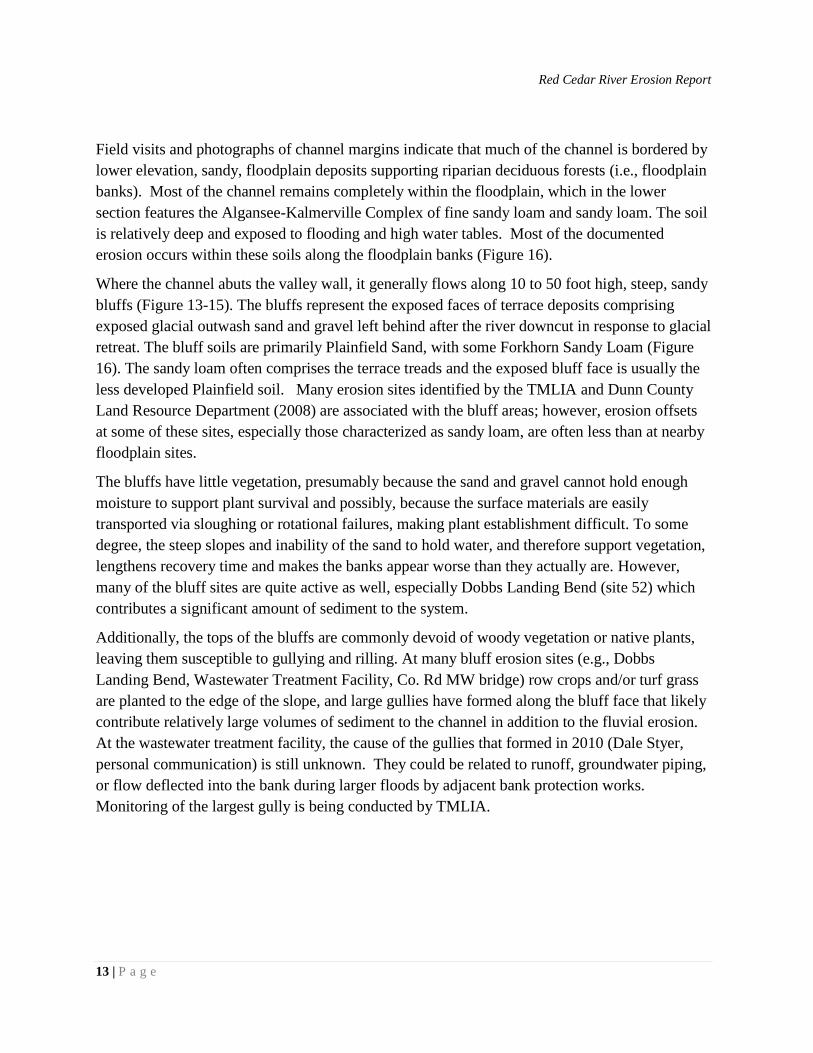
Additionally, the tops of the bluffs are commonly devoid of woody vegetation or native plants,leaving them susceptible to gullying and rilling. At many bluff erosion sites (e.g., DobbsLanding Bend, Wastewater Treatment Facility, Co. Rd MW bridge) row crops and/or turf grassare planted to the edge of the slope, and large gullies have formed along the bluff face that likelycontribute relatively large volumes of sediment to the channel in addition to the fluvial erosion.At the wastewater treatment facility, the cause of the gullies that formed in 2010 (Dale Styer,personal communication) is still unknown. They could be related to runoff, groundwater piping,or flow deflected into the bank during larger floods by adjacent bank protection works.Monitoring of the largest gully is being conducted by TMLIA.
Red Cedar River Erosion Report
14 | P a g e
Figure 13. Red Cedar River looking downstream along the wastewater treatment facility (left). The terracesare relatively high with sparse vegetation and the floodplains (right) are relatively low and well vegetated.
Figure 14. Red Cedar River looking downstream below the wastewater treatment facility. The terrace/bluffslopes are relatively high with sparse vegetation. The conifers on the left provide little bank protection andare being left along the bank and the opposing bar (right), which is forcing flow against the left bank.
Red Cedar River Erosion Report
15 | P a g e
Figure 15. Red Cedar River looking downstream at the Dobb’s landing bluff. The terrace/bluff slope is almost50 feet high with sparse vegetation. Gullies have formed on the face of the bluff which is presumably relatedto surface runoff. The top of the slope is planted with row crops to the edge of the slope.
Figure 16. Soils and erosion sites along the Red Cedar River near Colfax, WI. The Channel and most of themajor erosion sites are associated with floodplain sandy loams, whereas bluff faces are associated with poorly
Red Cedar River Erosion Report
16 | P a g e
developed sand soils.
Based on site observations, the channel bed primarily includes sand and gravel, with somecobbles, despite the sand entering the channel from bank erosion. The amount of sand increasesmoving downstream, where it is a large component of expanding point bars in cutoff reaches,and where it becomes the dominant bed material at the downstream end of the channel. In mostsubreaches of the focus channel, large woody debris does not appear to be a major component ofthe river environment. A few log jams were observed at individual sites, and individual fallentrees were observed on bars, but despite the relatively large amount of erosion, wood volumeappears to be limited.
Red Cedar River Bank ErosionStream bank erosion inventories were conducted by the Dunn County Land ConservationDivision (LCD) in the fall of 2006 on both the Red Cedar River and the Hay River upstreamfrom Tainter Lake. This study estimated that the Red Cedar River was displacing 14,271 cubicyards per year and the Hay River was displacing 7,978 cubic yards per year. The eroding streambanks were inventoried for length, height, and angle of recession and located via GPS. Thecurrent study aimed to build on the LCD inventory by looking at system-wide channel planformdynamics and calculating erosion rates based on overlaying channel banklines digitized fromsequential aerial photography.
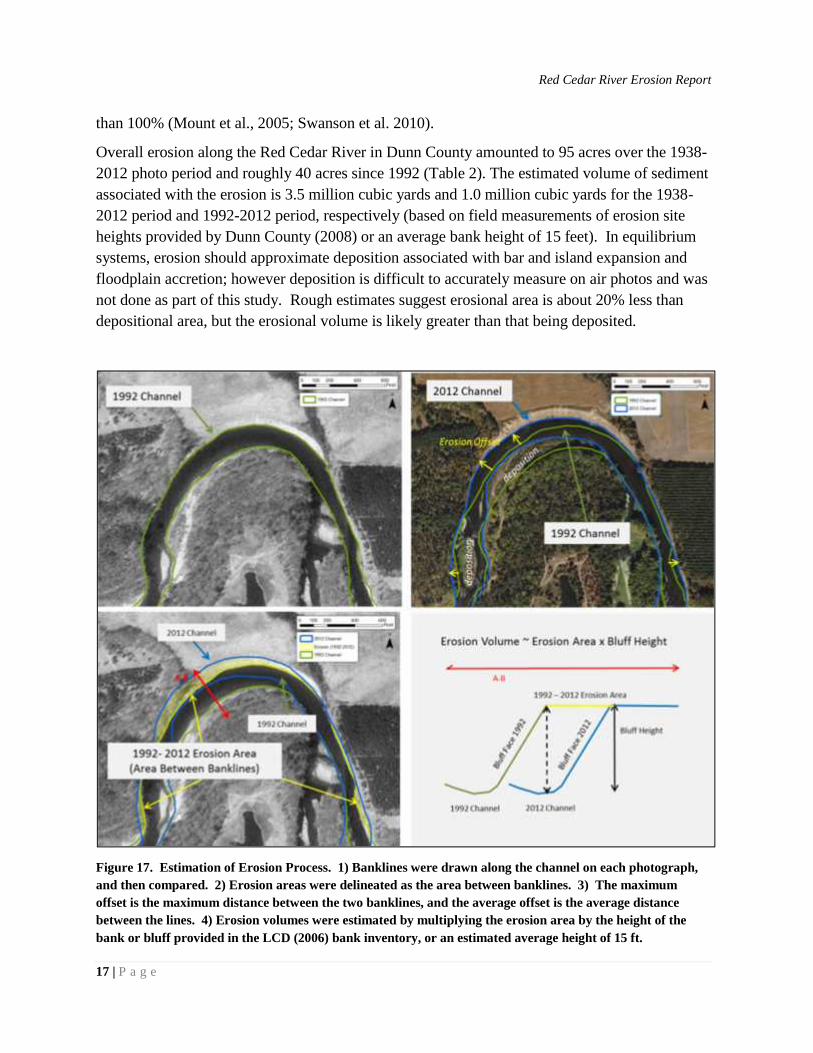
Magnitudes of ErosionEstimating erosion area and volume was a continuation of the air photo overlay used to identifyerosion problems in the study reach. Banklines were drawn along the channel on eachphotograph, and then compared (Figure 17). Erosion areas were delineated as the area betweenbanklines, so the 1992-2012 erosion is the planform (horizontal) area between the 1992 and 2012banklines. The maximum offset is the maximum distance between the two banklines, and theaverage offset is the average distance between the lines, measured by dividing the area by thelength of the bank. Erosion volumes were estimated by multiplying the erosion area by theheight of the bank or bluff provided in the LCD (2006) bank inventory, or an estimated averageheight of 15 ft (Figure 17). The air photo based inventory conducted in this study included theentire river within Dunn County, as opposed to individual banks.
Although the air photos were matched to the 2012 image (georeferenced), they still includedsome error associated with the pitch and yaw of the airplane and georeferencing process.Additionally, bank delineation is often limited by the photographic scale, photo texture,differences in water level, overhanging vegetation, shadows, and other issues. The Red CedarRiver banklines were digitized at a scale of 1500:1 on relatively high resolution, good quality airphotos, and the channel banks are generally steep making delineation easier, but overall error islikely 10% and at individual sites where offsets are smaller than 5 feet, error might be greater
Red Cedar River Erosion Report
17 | P a g e
than 100% (Mount et al., 2005; Swanson et al. 2010).
Overall erosion along the Red Cedar River in Dunn County amounted to 95 acres over the 1938-2012 photo period and roughly 40 acres since 1992 (Table 2). The estimated volume of sedimentassociated with the erosion is 3.5 million cubic yards and 1.0 million cubic yards for the 1938-2012 period and 1992-2012 period, respectively (based on field measurements of erosion siteheights provided by Dunn County (2008) or an average bank height of 15 feet). In equilibriumsystems, erosion should approximate deposition associated with bar and island expansion andfloodplain accretion; however deposition is difficult to accurately measure on air photos and wasnot done as part of this study. Rough estimates suggest erosional area is about 20% less thandepositional area, but the erosional volume is likely greater than that being deposited.
Figure 17. Estimation of Erosion Process. 1) Banklines were drawn along the channel on each photograph,and then compared. 2) Erosion areas were delineated as the area between banklines. 3) The maximumoffset is the maximum distance between the two banklines, and the average offset is the average distancebetween the lines. 4) Erosion volumes were estimated by multiplying the erosion area by the height of thebank or bluff provided in the LCD (2006) bank inventory, or an estimated average height of 15 ft.
Red Cedar River Erosion Report
18 | P a g e
Average rates of offset for the 1992-2012 period were around 1 foot/year over all the delineatedsites and overall rates of sediment input to the Red Cedar River were around 50,000 cubicyards/year. This estimated rate of sediment erosion is much higher than the rate predicted by theDunn County survey of approximately 14,000 cubic yards/year. This discrepancy is largelyrelated to a number of sites not being documented as part of the county’s survey, which focusedprimarily on bluff erosion. Additionally, the erosion rates used in the county study, which used amaximum of 1 ft/year, were often underestimated (see Table 3 for rates at individual sites)
Table 2 also indicates that erosion rates for the 1938-1992 photo period were less than theerosion rates for the 1992-2012 period. The difference is likely due to relatively rapidadjustments occurring along the chute cutoffs in the downstream section of channel. In theearlier photographs, meander dynamics were more typical, with cutting at the outside of bends atrates near the mean. After the cutoff occurred, developing bends along the avulsions erodedmaterial at rates almost twice those documented at bends located out of the avulsions and up to 7times faster than the average erosion rate.
Table 2. Overall erosion magnitudes and rates for the Red Cedar River in Dunn County.
Photo Period Area Area Volume Average Offset Rate Rate Rate
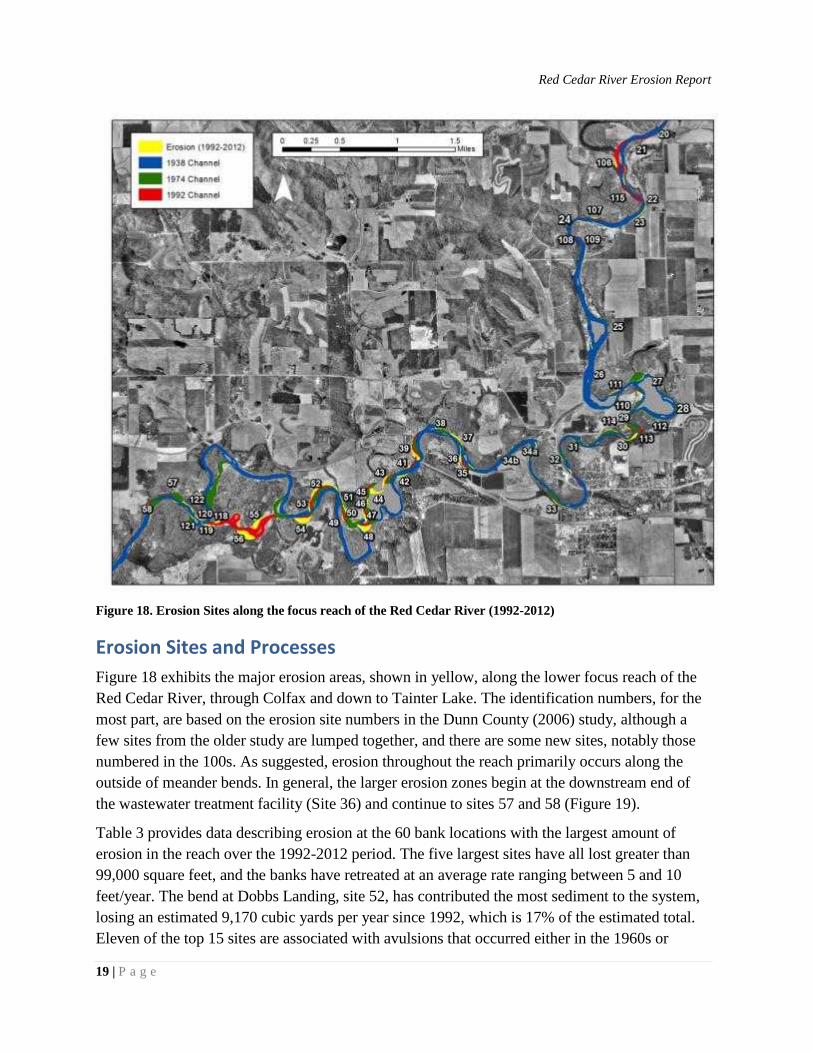
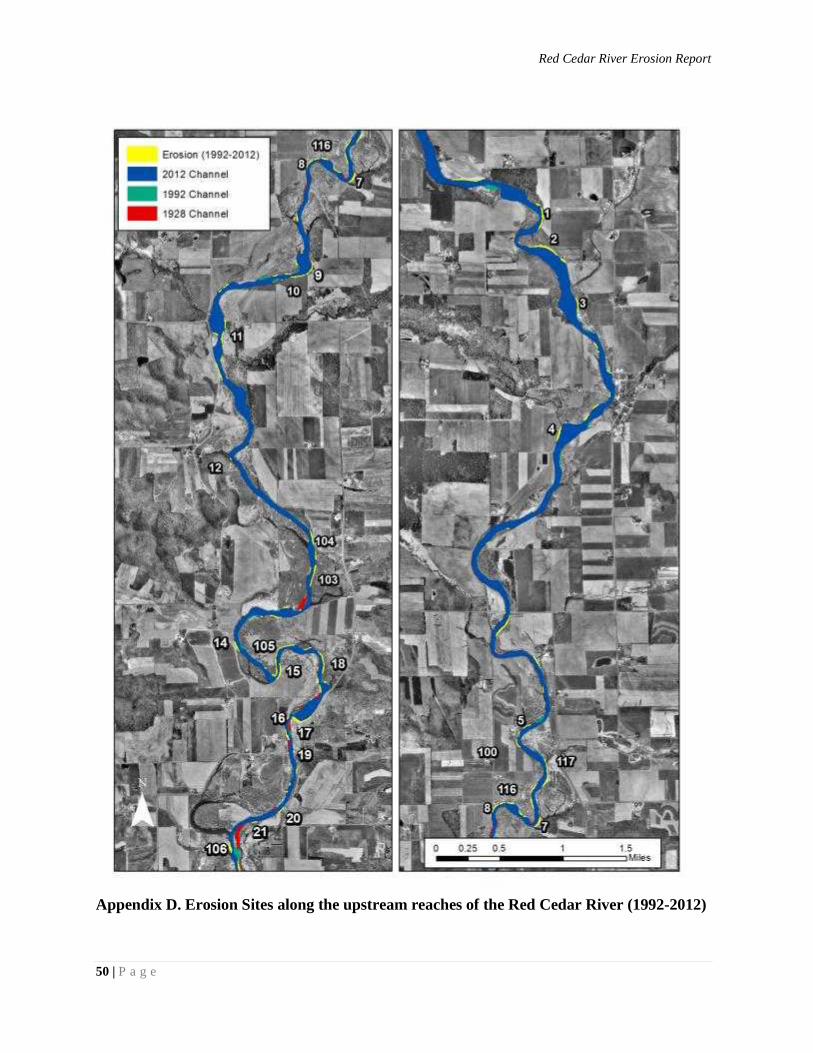
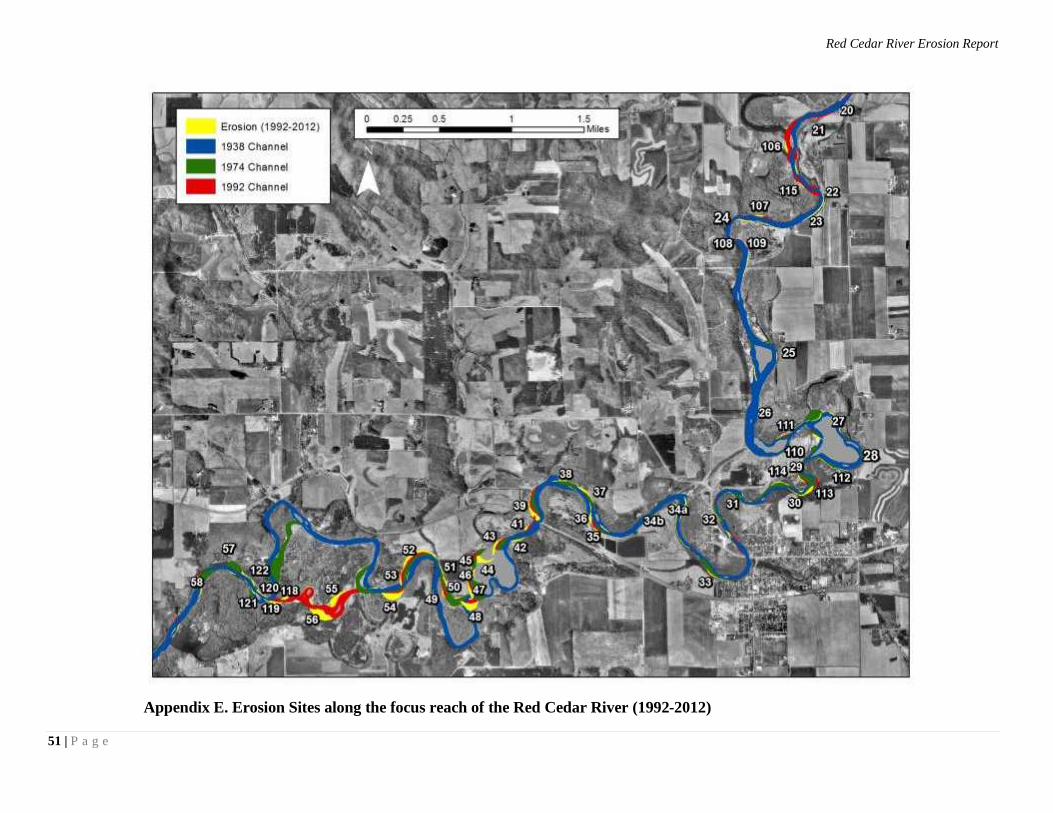
Figure 18. Erosion Sites along the focus reach of the Red Cedar River (1992-2012)
Erosion Sites and ProcessesFigure 18 exhibits the major erosion areas, shown in yellow, along the lower focus reach of theRed Cedar River, through Colfax and down to Tainter Lake. The identification numbers, for themost part, are based on the erosion site numbers in the Dunn County (2006) study, although afew sites from the older study are lumped together, and there are some new sites, notably thosenumbered in the 100s. As suggested, erosion throughout the reach primarily occurs along theoutside of meander bends. In general, the larger erosion zones begin at the downstream end ofthe wastewater treatment facility (Site 36) and continue to sites 57 and 58 (Figure 19).
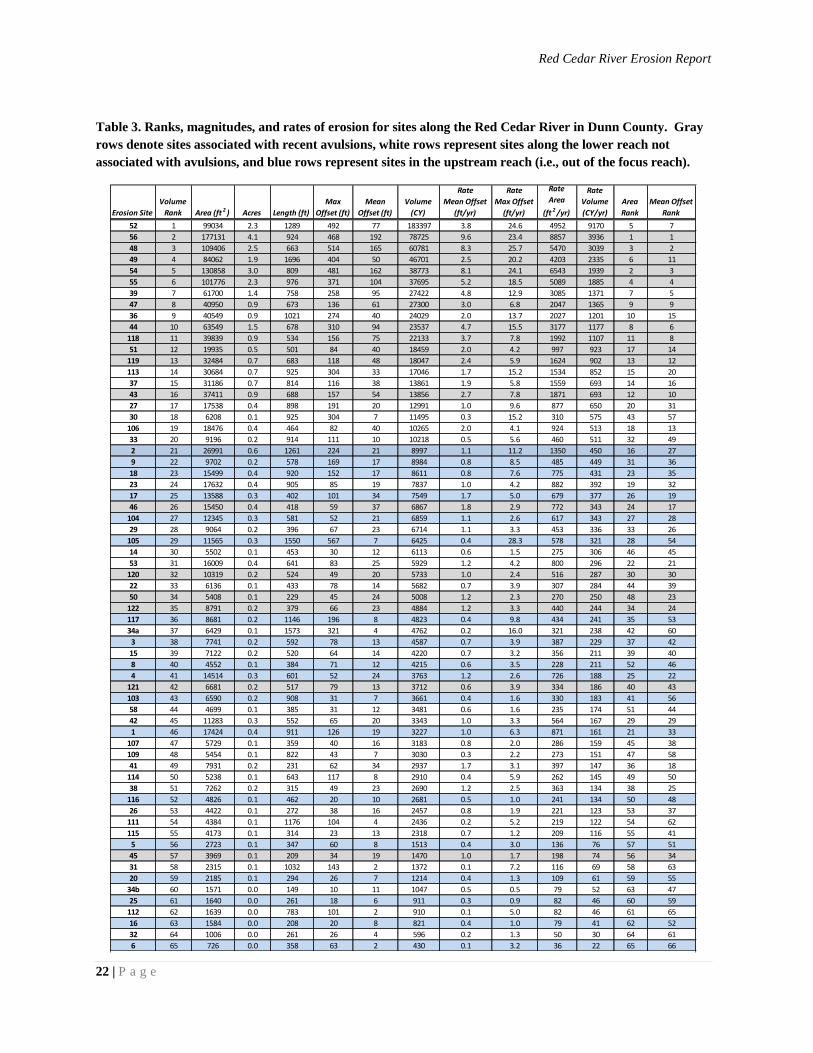
Table 3 provides data describing erosion at the 60 bank locations with the largest amount oferosion in the reach over the 1992-2012 period. The five largest sites have all lost greater than99,000 square feet, and the banks have retreated at an average rate ranging between 5 and 10feet/year. The bend at Dobbs Landing, site 52, has contributed the most sediment to the system,losing an estimated 9,170 cubic yards per year since 1992, which is 17% of the estimated total.Eleven of the top 15 sites are associated with avulsions that occurred either in the 1960s or
Red Cedar River Erosion Report
20 | P a g e
1980s, and no site lying upstream of the focus reach makes the top twenty. In addition, siteswhere nearby infrastructure is a concern, such as the wastewater treatment plant (34b, 35),Colfax residences (32, 33), and the Colfax School (30) sites, have all exhibited some erosion, butat relatively low rates (<0.5feet/year). At the wastewater treatment site, riprap and vegetatedgroins have helped reduce erosion at the site, and similar bank protection measures have limitederosion through Colfax.
It is apparent that most of the recent erosion is concentrated in a relatively unstable reach of theRed Cedar River lying at the downstream end of the focus reach (Figure 19). In this stretch, thechannel has experienced a number of chute cutoffs, with some likely occurring during the largefloods in the 1960s and a substantial avulsion occurring sometime in the 1980s. The basicchannel migration processes acting before or away from the cutoffs can be seen at many of themeander bends in the system (Figures 8, 9, and 21). The channel removes material at the toe ofthe bank, over-steepening or undercutting the upper material until it slides and (or) topples intothe channel. At high, sandy, unvegetated bluffs, erosion occurs relatively easily and anyvegetation on top of the banks or bluffs is moved as well. Through this action, the bends expandthrough the floodplain, elongating the channel and depositing finer material as they pass (Figure21). At some point, the channel is hit by a large flood and the floodwaters find and erode a moredirect path across the floodplain, often following old channel paths or side channels (Figure 21).In the case of the downstream avulsion, sediment deposition at a tight bend at the upstream endof the chute, as well as sediment inputs from several gullies along the previous channel positionmay have helped back up flood flows and force high water into its new position (Figure 21).Woody debris may have played a role in blocking and deflecting flow as well. The new,straighter, steeper section then begins eroding new meander bends at a relative fast rate,apparently cutting through the alluvial floodplain sand and undercutting and removing theriparian vegetation relatively easily (Figure 20 and 21). The finer material eroded from thebanks (i.e., sands and silts) are carried downstream and deposited on expanding and aggradingpoint bars or in the Tainter Lake delta.
Channel change is generally controlled by changes in sediment or water moving through thesystem. However, the hydrology data do not indicate a trend in annual peak discharge andlanduse does not appear to have changed much over the last 50 years. The presence of numerousmeander scars in the floodplain at the downstream end of the focus reach indicates this section ofthe Red Cedar River has been active for over 100 years. The root cause of the changesdocumented in this stretch of the Red Cedar River are unclear and would require a broaderinvestigation including a more detailed soils/geology study and more detailed examination of theimpact of dam construction, logging, grazing, row cropping, and tile drainage on hydrology,channel dimensions, channel sediment, and hydraulics. Our focus is on recent trends and thefuture evolution of the river channel given the modern hydrologic and landuse regime.
Red Cedar River Erosion Report
21 | P a g e
Figure 19. Erosion Sites along the focus reach, downstream of the Colfax wastewater treatment facility (1992-2012). This subreach has experienced multiplechute cutoffs since the 1960s, and relatively rapid channel adjustment along these sections since.
Red Cedar River Erosion Report
22 | P a g e
Table 3. Ranks, magnitudes, and rates of erosion for sites along the Red Cedar River in Dunn County. Grayrows denote sites associated with recent avulsions, white rows represent sites along the lower reach notassociated with avulsions, and blue rows represent sites in the upstream reach (i.e., out of the focus reach).
Figure 20. Red Cedar River at the gravel pit location downstream of the Dobb’s Landing Bend (Site 54). Thechannel is undercutting woody riparian vegetation along the sandy floodplain bank on both sides of the river.
Figure 21. Channel adjustments at the downstream avulsion sight since 1938. 1938 (blue)-1974 (green)>Bends expand through the floodplain, elongating the channel and depositing finer material as they pass.1974(green) – 1992(yellow)> The channel is hit by a large flood and the floodwaters find and erode a moredirect path across the floodplain. Sediment deposition at a tight bend at the upstream end of the chute (right),as well as sediment inputs from several gullies along the previous channel position may have helped back upflood flows and force high water into its new position. 1992-2012> The new, straighter, steeper section beginseroding new meander bends at a relative fast rate.
Red Cedar River Erosion Report
24 | P a g e
IMPACTS OF RED CEDAR EROSION
Delta EncroachmentA 2005 bathymetric study of Tainter Lake showed that 1,667 acre feet (8%) of the storage hadbeen lost since 1960. This equals almost 2.7 million cubic yards of sediment deposited in TainterLake over that time period, or about 60,000 cubic yards per year. Figure 23 shows the expansionof the delta between 1938 and 2012. Although the data do not account for differences in waterlevel, it suggests that the general planform area of the emergent delta, including distributarychannels, increased from approximately 70 to 150 acres, and the delta has prograded into TainterLake an average of 19 feet/year (Table 4). Assuming a depth of 10 feet, the delta has stored anestimated1.3 million cubic yards of material since 1938, at a rate of 18,000 cubic yards per year.That rate increases to 32,500 CY/yr. It also appears the rate of expansion has tripled over thattime. Delta expansion has diminished access to the east end of the lake and has reducedrecreation activities as well.
Table 4. Estimates of delta expansion at the mouth of the Red Cedar River in Tainter Lake.
Figure 22. The lower reach of the HayRiver also appears to be active as itenters the Tainter Lake valley.
Red Cedar River Erosion Report
25 | P a g e
Figure 23. Expansion of the Red Cedar River delta into the east end of Tainter Lake(1938-2012).
Not all the eroded sediment from upstream ends up in the delta immediately, but estimatedannual erosion volume and lake deposition rates indicate that a large percent of the material ispassed through the system annually. Limiting erosion in the focus reach could slow the growthof the delta, but in order to greatly reduce the overall volume of material, work would berequired over large subreaches of the channel. A long term program of bluff stabilization wouldhave more impact on delta sedimentation than treating just a few channel locations. The possibleexception is the Dobbs Landing Bend site (52), which contributes approximately 9,000 cubicyards of material to the channel per year, which is 17% of the estimated total in the study reach.
Red Cedar River Erosion Report
26 | P a g e
PhosphorusPhosphorus is usually transported through river systems adsorbed to fine material such as silts,clays, and organics. It usually enters rivers via runoff, although some likely enters with erodedsediment. Modeling described later in the WDNR’s 2012 Total Maximum Daily Load study forphosphorus in the Red Cedar River estimated the 9 year average total phosphorus load to TainterLake at 506,000 pounds per year. The inputs are primarily attributed to excessive application ofmanure and other fertilizers to agricultural fields, barnyard waste, and natural forest inputs. Thephosphorus contributed to Tainter Lake via the Red Cedar River helps maintain elevatedphosphorus concentrations in the lake (~50µg/L), which in turn, contributes to large algal bloomsand vegetation growth.
In 2013, the TMLIA and Dunn County sampled bluff sediments at forested, urban, and row cropsites along the Red Cedar River focus reach for soil-bound phosphorus (i.e, soil samples, notwater samples). The results showed phosphorus concentrations ranging from 79 ppm waterextractable phosphorus (WEP; soil shaken in water for given time period) at the top of the slopeto 17 ppm at the base, with an average concentration of 39 ppm (TMLIA 2013). Applying themean concentration to the total estimated annual volume of erosion (1992-2012) predicts thatbank retreat along the Red Cedar River contributes 5,700 pounds of phosphorus per year, or1.1% of the expected total load (Table 5). Therefore, reducing erosion along the channel likelywill not significantly impact phosphorus levels in Tainter Lake.
Table 5. Estimated Phosphorus loads attributable to Red Cedar River bank erosion based on soilconcentration samples collected at the Colfax School bluff erosion site (30) by TMLIA in 2013.
Red Cedar River Erosion Report
27 | P a g e
BANK AND BLUFF EROSION SOLUTIONSThe primary performance goal for projects conducted along the Red Cedar River is to reduceerosion and downstream transport of eroded sediment. TMLIA and its project partners wouldlike to accomplish this goal while meeting secondary aims of creating a natural looking solutionthat improves fish habitat.
More specifically, project criterion should include the following:
Stabilize the toe of eroding bluffs to minimize soil loss contributing to dry granular flowand rotational failure of the upper slope (mass wasting) and encourage long-term (10+years) vegetative stabilization of the bluff toe and face.
Design the stabilization measures to withstand flood discharges up to 20,000 cfs.
Allow the stream to adjust to floods at rates consistent with natural conditions
Increase in-stream habitat complexity for fish and other aquatic and riparian habitat.
Possible erosion solutions range from traditional site treatments using large rock (riprap) to morebioengineered solutions that include the use of trees, vegetation, and rock to provide stabilizationat the toe of the slope.
General Considerations for Bluff Stabilization
Bluff toe protection is constructed by building a floodplain bench that moves the toe of the slopeaway from the existing bluff. The floodplain bench adds weight to the bluff toe which helps tominimize mass wasting. The highest shear stresses are then encountered at the log or stoneportion of the crib, and not at the bluff toe. Thus, the bluff stabilizes naturally and vegetationbegins to move up the slope (Figure 24).
Figure 24. Existing, proposed and expected typical cross section at a typical bluff stabilization site. Theexisting ground (black line) shows the channel scouring at the toe of the bluff on the right side of the valley.The proposed channel (red line) will be excavated away from the bluff toe to allow room for placement of thetreatmeant (riprap or cribwall) and to provide room for the upper bank material to slump over (green line).
114511501155116011651170117511801185119011951200
0 50 100 150 200 250 300
Elev
atio
n (fe
et)
Distance (feet)
Existing
Bench
Red Cedar River Erosion Report
28 | P a g e
In some cases, moving the channel away from the eroding bluff entirely may be more practicalfrom both a construction standpoint and project effectiveness. Under this scenario, the insidebend of the meander is moved slightly inward and the excavated material is used to backfill thecrib and floodplain bench (Figure 25). The constructed floodplain should then be planted withnative trees, shrubs, and understory plants.
Constructing the treatment (cribwall or otherwise) will alter the dimensions of the observedbankfull channel geometry, essentially narrowing the channel. The top width of the stream willbe narrowed by the width of the treatment. Typically, an equal, if not slightly larger area can beshaved from the opposing bank. In the latter case, the channel should be sized similarly, butslightly larger, than the existing channel. We propose adding this extra capacity as there isvariability in the range of bankfull geometry and a larger, wider channel will initially produceless shear stress, limiting erosion concerns and trapping incoming sediment.
Figure 25. Planview schematic of a log cribwall stabilization project with a new channel constructed on theinside of the bend, and the existing channel filled and converted to floodplain.
Red Cedar River Erosion Report
29 | P a g e
Riprap Approach
Riprap can be an effective approach to stabilization as it is easily designed and contractors arefamiliar with its placement (Figure 26). In the past, site treatments along the focus reach of theRed Cedar River, and adjacent systems, have primarily used traditional riprap placement. Ripraphas been proposed at the Colfax School site, placed at CTH Y and in Colfax, and along thewastewater treatment facility bank in conjunction with vegetated groins. The riprap appears tohave been effective at the latter two sites, though thorough reviews of the projects were notconducted.
Riprap is typically placed from the top of the slope and allowed to roll down into the toe area ofthe slope, where stabilization is necessary. In some cases, riprap may require “keying” in to thetoe to protect against scour, an element that can be investigated in design. Given the fine sandsthat are likely to persist at the toe of the bluff, a geotextile or similar filter design may berequired to prevent winnowing of material from among the voids of the rock.
Drawbacks of utilizing riprap usually focus on the often unsightly aesthetics and detraction fromthe existing natural system. The latter can be somewhat mitigated by planting among the voids todevelop a vegetative cover over the rock (Figure 27). Usually, the preferred plant is a live stake,easily threaded into the void spaces. However, frequent inundation often keeps perennialvegetation from establishing along the lower end of the slope and in the channel (Figure 28).Depending on water level fluctuations on the river, this may be a challenge. Habitat benefits arelimited to near bank cavities for smaller fish to occupy. Wood placement along the riprap can beused to alleviate these issues.
Figure 26. Riprap here was placed carefully from the bottom of the slope to preserve the existing trees. Thismay be possible at some sites where access is permits
Red Cedar River Erosion Report
30 | P a g e
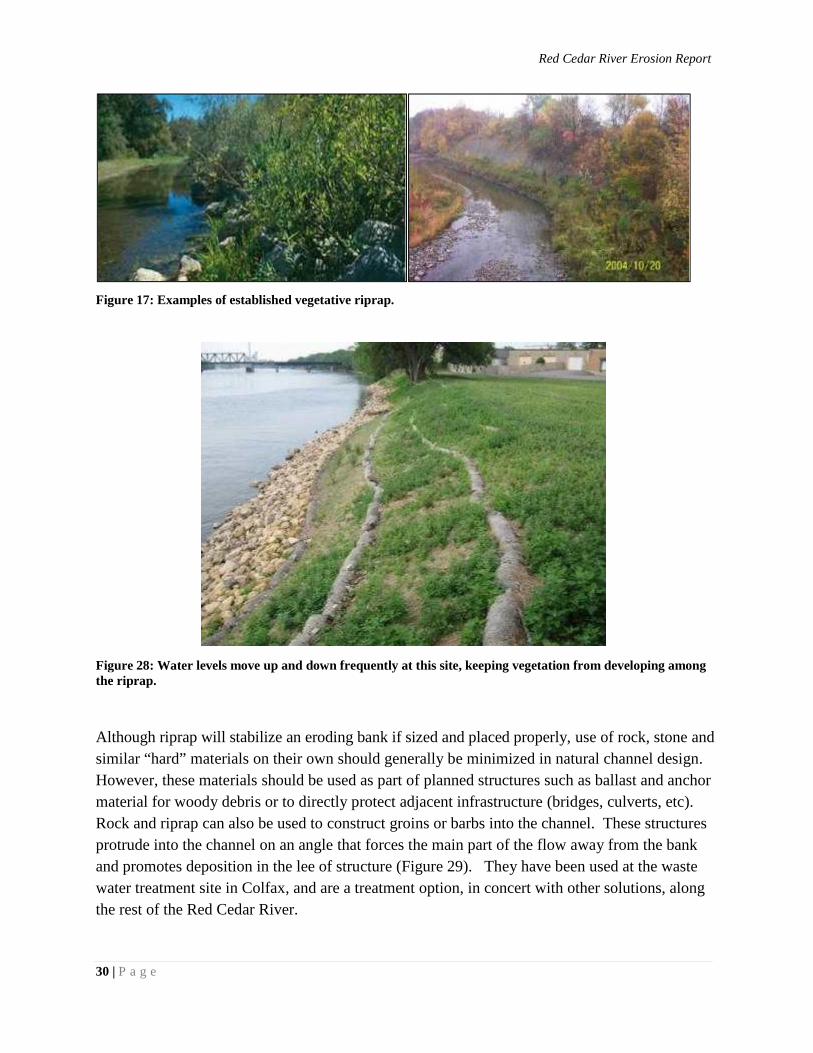
Figure 17: Examples of established vegetative riprap.
Figure 28: Water levels move up and down frequently at this site, keeping vegetation from developing amongthe riprap.
Although riprap will stabilize an eroding bank if sized and placed properly, use of rock, stone andsimilar “hard” materials on their own should generally be minimized in natural channel design.However, these materials should be used as part of planned structures such as ballast and anchormaterial for woody debris or to directly protect adjacent infrastructure (bridges, culverts, etc).Rock and riprap can also be used to construct groins or barbs into the channel. These structuresprotrude into the channel on an angle that forces the main part of the flow away from the bankand promotes deposition in the lee of structure (Figure 29). They have been used at the wastewater treatment site in Colfax, and are a treatment option, in concert with other solutions, alongthe rest of the Red Cedar River.
Red Cedar River Erosion Report
31 | P a g e
Figure 29: Rock/riprap barbs forcing the flow to the right and catching sand on their downstream sides.
Large Wood Cribwall Approach
As an alternative or in combination with hard toe treatments like riprap, large wood placementmeets multiple project performance criteria including the prevention of river migration into thebluffs, improving in-stream habitat, and allowing a more natural looking vegetated bank todevelop over time.
Layout
In this case, wood placement refers to the use of engineered log cribs or log cribwalls. Cribwallsare a lattice-like structure of logs, placed both horizontally and vertically, with slash, localboulders, and soil intermixed within the log matrix (Figures 30 to 33). Logs exposed to wet/drycycles are expected to decay in 15 to 30 years, and submerged wood can last as much as 200years or more. As with any bioengineering treatment, by the time the structural elements havedegraded, natural vegetation will have established and root structures make the bank strongerover time. Trees with vegetative reproduction qualities (e.g. black willow, cottonwood) can beincorporated into the structure, which then becomes a living entity with added structural stabilityfrom root growth. Boulders and cobbles can be added to the structure to provide self-armoringmaterial for added toe protection long term.
Red Cedar River Erosion Report
32 | P a g e
Figure 30. Schematic of a cross section through a log cribwall.
Figure 31. Planview schematic of a log cribwall stabilization project.
Red Cedar River Erosion Report
33 | P a g e
Figure 32. Example of a large wood cribwall under construction at the toe of a failing sand bluff inMinnesota. The space between the interlocking logs was filled by additional wood and rock, before beingcovered with soil. After construction, the bench will be planted with native vegetation.
Figure 33. Vegetation established on the bench and slope face behind the cribwall noted above.
Red Cedar River Erosion Report
34 | P a g e
Cribwalls are generally placed at the toe of the bank and extend into the channel, creating abench along the bend (Figures 30-33). For most bluffs, the logs should extend from thebeginning to the end of the exposed slope face and large wood should be tied into the exposedsediment to prevent overbank flows from scouring the area between the large wood cribwall andthe bluff toe. The bottom elevations of the logs should extend below the channel bed to accountfor local scour and additional minor incision that may occur. With the bottom of the cribwallbelow the bed, the structure should not be undermined and will allow for some systemicdegradation of the channel bed. Specific dimensions and plans for any proposed structures willbe developed later in the planning process, during the design phase.
Finally, there are other materials and techniques that can be used to stabilize eroding bluffs andbanks. Technical materials, such as geotextiles and(or) geocells (Figure 34) can be used to holdbank materials in place, although are generally not ideal for protecting the channel below thewater line. Additionally, more intrusive, and more expensive, approaches can be taken, wherethe entire channel is realigned and regraded to a more stable form. This usually includes use ofrock and wood structures for bank stabilization as well as grade control to keep the channel fromdowncutting. In addition to the expense, this latter option is usually not recommended along anaturally dynamic system with little adjacent infrastructure, like along the Red Cedar River.
Figure 34. Example of geocells being used along steep banks. The cells are filled with soil and then vegetated.They are usually used in concert with riprap or wood along the bank toe.
GeoCells
Red Cedar River Erosion Report
35 | P a g e
Project RisksIt is impossible to eliminate every potential risk with a proposed project. Projects are generallydesigned to be stable for specific failure modes; however, other geomorphic processes couldoccur along the Red Cedar River that result in destabilization of the stream such as extreme floodevents, channel incision, or avulsions due to unpredictable natural events.
Large wood jams and riprap are usually designed to remain stable during all floods up to theestimated 100 year return interval flood (22,000 cfs in this case). In the case of riprap, thematerial is sized to withstand lift and drag forces generated by large flows, and they ofteninclude fabrics and filter material to slow the removal of fines behind the revetment. Withwoody debris, buoyant and drag forces are counterbalanced by ballast such as rock, soil, wood,driven piles and deadman anchors. Log piles as vertical pieces will be driven down adjacent tolateral pieces, preventing downstream movement and providing ballast (Figure 32). In riverenvironments, both the riprap and wood structures have lifespans of 50 years or better, althoughin the case of wood, it is shorter if not permanently submerged. In both cases, woody vegetationestablishment will greatly strengthen and prolong the lifespan of the structures.
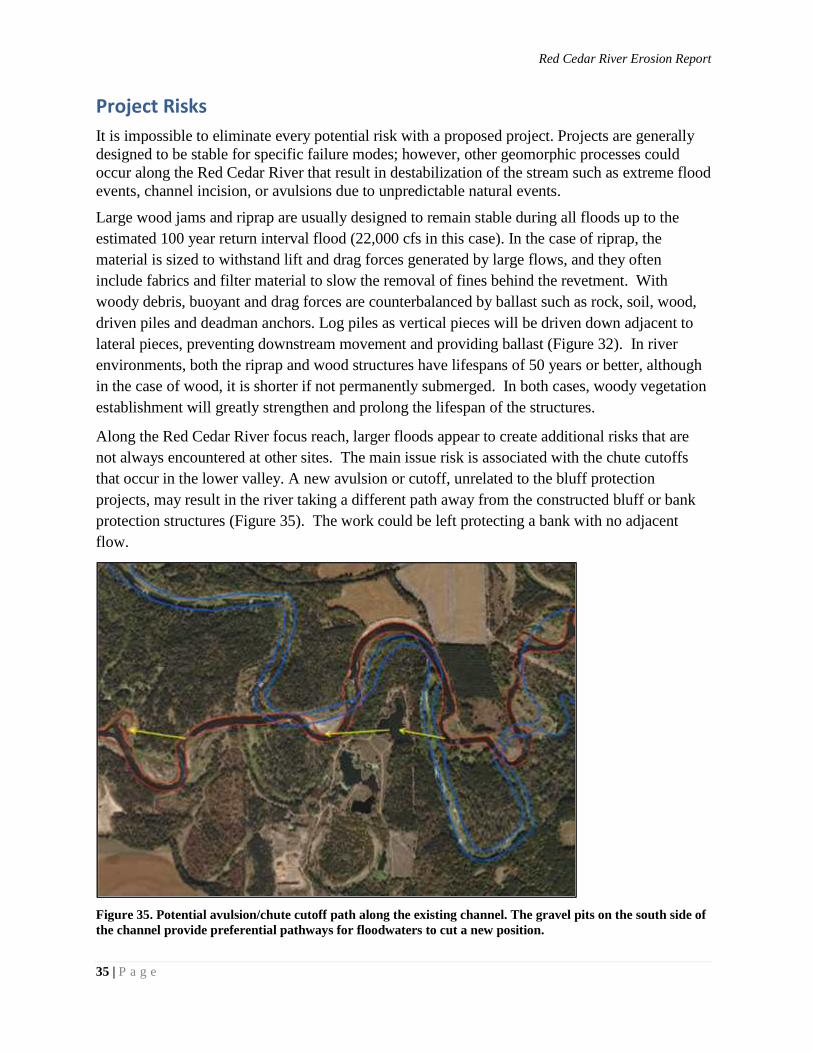
Along the Red Cedar River focus reach, larger floods appear to create additional risks that arenot always encountered at other sites. The main issue risk is associated with the chute cutoffsthat occur in the lower valley. A new avulsion or cutoff, unrelated to the bluff protectionprojects, may result in the river taking a different path away from the constructed bluff or bankprotection structures (Figure 35). The work could be left protecting a bank with no adjacentflow.
Figure 35. Potential avulsion/chute cutoff path along the existing channel. The gravel pits on the south side ofthe channel provide preferential pathways for floodwaters to cut a new position.
Red Cedar River Erosion Report
36 | P a g e
Project CostsCosts for river projects vary widely due to a number of factors, including the availability ofmaterials, the complexity of site access, the need and complexity of water management for in-channel work, the experience of the contractor, and economies of scale. Materials can be one ofthe biggest factors, in particular the local supply of wood and rock. Many projects have a readysupply of culled wood from local sources, whereas other projects require the contractor toharvest, transport, and install the wood which quickly drives unit prices to the high end of thespectrum. Understanding the logistics of locally sourcing materials will help narrow the costsspecific to the Red Cedar River and move beyond the averages and ranges provided in thisfeasibility assessment.
Riprap or rock placement has long been the common bank protection treatment. The proposedwork at the Colfax School site, which relies heavily on rock riprap, was estimated to cost around$145/cubic yard of placed rock. Table 6 provides similar estimates using an average cost, basedon Inter-Fluve projects, of $120/cubic yard.
Table 6. Preliminary cost estimates for rock riprap revetment installation at specific sites along the RedCedar River
Inter-Fluve has constructed cribwalls under a wide range and combination of circumstances.Two recent projects provide examples of the variance of costs associated with this work. ClarkCreek was a low complexity project constructed by a WDNR construction crew in Fall of 2013.Logs were cut on site and staged by a private contractor at an approximate fee of $180/tree.WDNR habitat crews performed the work with their equipment and labor and Inter-Fluveprovided oversight. Total treatment length was 3,100 Face Feet (treatment length x height = FaceFeet) with +/- 400 logs. Cost was $32/Face Foot.
The Sheboygan River, WI project was built in Fall 2012 by a private contractor. It included ahigh level of complexity due largely to the need to dewater much of the site and deal withcontaminated sediments. The city of Sheboygan supplied over 300 logs for the project.Contractor cost to install city supplied logs was $600/log vs. $920/log if the contractor sourcedthe logs, which was not done. A total of 2000 Face Feet were constructed. Costs were $90/FaceFoot without the necessary dewatering and $153/Face Foot with the dewatering added.
Site Linear FeetBank Height
(ft)Live Stakes
($3/FF)
Placed RockCosts
($120/CY) Total CostDobbs Landing Bend 1800 8 $10,800.00 $192,000 $202,800
For the purposes of cost estimating on the Red Cedar, we have assumed a mid-level unit cost of$60 /Face Foot for planning purposes. Fabric lifts are often typically added to allow vegetationestablishment and prevent soil loss during floods. Fabric lifts are common components ofprojects and costs typically average about $25 / Face Foot for their construction (Table 7). Asnoted, additional design level investigation into site specific hydraulics, subsurface conditions,sources and logistics of materials, and discussion with local contractors can further refine theexpected costs for specific to the sites on the Red Cedar.
Table 7. Preliminary cost estimates for log cribwall installation at specific sites along the Red Cedar River.
The impetus for the investigation of the Red Cedar River was to slow the growth of the delta inTainter Lake. Dredging provides a means to accomplish this goal and is included here briefly.Dredging consists of two primary types: 1) hydraulic dredging that sucks a sand/water slurryfrom the dredge area and pumps it to a dewatering area; and 2) mechanical dredging, whichincludes using a backhoe or other equipment to excavate sand and deposit it in a waste pile.Hydraulic dredging costs are dictated by the nature of the material and the associated distanceand size of the dewatering area. Sand is readily dewatered and would be among the bestmaterials to work with, reducing costs. The location of a permanent spoil area is the secondcomponent. If the delta itself could be used to decant and store the sand, costs would be lower.Dredging may be deemed a wetland impact, however, and material may require hauling to anoffsite locale for disposal, thereby considerably increasing costs. The numbers used belowassume $25/CY for hydraulic dredging with the spoils staying near the site, and $8/CY formechanical dredging under the same assumption (Table 7). If material must be deposited farfrom the site, costs should be doubled or tripled depending on the distance.
Site Linear FeetCribwall
Height (ft)FES Lift
Height (ft)Cribwall Cost
($60/FF)FES Lift Cost
($25/FF) Total CostDobbs Landing Bend 1800 4 2 $432,000 $90,000 $522,000
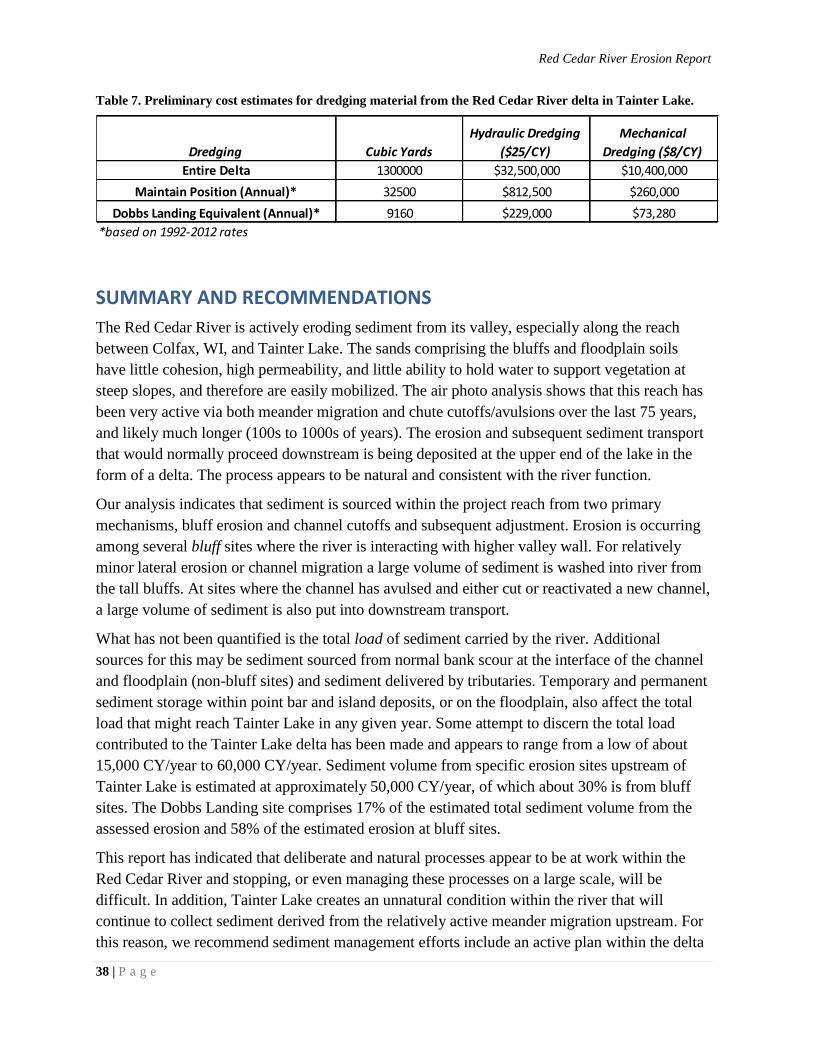
Table 7. Preliminary cost estimates for dredging material from the Red Cedar River delta in Tainter Lake.
SUMMARY AND RECOMMENDATIONSThe Red Cedar River is actively eroding sediment from its valley, especially along the reachbetween Colfax, WI, and Tainter Lake. The sands comprising the bluffs and floodplain soilshave little cohesion, high permeability, and little ability to hold water to support vegetation atsteep slopes, and therefore are easily mobilized. The air photo analysis shows that this reach hasbeen very active via both meander migration and chute cutoffs/avulsions over the last 75 years,and likely much longer (100s to 1000s of years). The erosion and subsequent sediment transportthat would normally proceed downstream is being deposited at the upper end of the lake in theform of a delta. The process appears to be natural and consistent with the river function.
Our analysis indicates that sediment is sourced within the project reach from two primarymechanisms, bluff erosion and channel cutoffs and subsequent adjustment. Erosion is occurringamong several bluff sites where the river is interacting with higher valley wall. For relativelyminor lateral erosion or channel migration a large volume of sediment is washed into river fromthe tall bluffs. At sites where the channel has avulsed and either cut or reactivated a new channel,a large volume of sediment is also put into downstream transport.
What has not been quantified is the total load of sediment carried by the river. Additionalsources for this may be sediment sourced from normal bank scour at the interface of the channeland floodplain (non-bluff sites) and sediment delivered by tributaries. Temporary and permanentsediment storage within point bar and island deposits, or on the floodplain, also affect the totalload that might reach Tainter Lake in any given year. Some attempt to discern the total loadcontributed to the Tainter Lake delta has been made and appears to range from a low of about15,000 CY/year to 60,000 CY/year. Sediment volume from specific erosion sites upstream ofTainter Lake is estimated at approximately 50,000 CY/year, of which about 30% is from bluffsites. The Dobbs Landing site comprises 17% of the estimated total sediment volume from theassessed erosion and 58% of the estimated erosion at bluff sites.
This report has indicated that deliberate and natural processes appear to be at work within theRed Cedar River and stopping, or even managing these processes on a large scale, will bedifficult. In addition, Tainter Lake creates an unnatural condition within the river that willcontinue to collect sediment derived from the relatively active meander migration upstream. Forthis reason, we recommend sediment management efforts include an active plan within the delta
itself, likely focused on dredging. However; although stopping the natural process at work abovethe lake isn’t possible, the rates of sediment delivery to Tainter Lake might be influenced in theshort term (decades. This action, in combination with sediment management at the delta, mightpresent a reasonable approach to balancing the natural process with the less desirableconsequences within Tainter Lake.
To begin the process of slowing the rate of sediment delivery, bluff stabilization including somecombination of engineered log cribwalls, floodplain bench construction, and toe scour protectioncan be implemented. Bluff erosion protection does not provide protection against avulsion notrelated to the erosion control project. Dobbs Landing would be a primary location to begin,followed by bends adjacent to infrastructure, such as along the Colfax wastewater treatmentfacility (34b, 35, 36), the Colfax School (30), residences on the south side of the river in Colfax(33), or upstream of the CN Railway (39).
At all of the bluff erosion sites, we recommend providing either passive or active sloperevegetation and installation of a vegetated buffer at the top of the slope. The vegetation should benative woody vegetation, forbs and grasses. Upper slope buffer vegetation will prevent runofffrom concentrating; thereby limiting the potential for gullying and rilling on the slope face, andkeeping extra sediment from reaching the channel. Gully erosion on the Dobbs Landing Bend(52) face has likely contributed as much sediment as many of the eroding banks elsewhere in thereach. The gullying may have been prevented by a buffer instead of the row crops that extend tothe slope break. Similarly, gullying at the wastewater treatment plant may be prevented by leavinga strip of native riparian plants along the top of the slope.
Future planning and work for the Red Cedar River study area should include continueddiscussions with community leaders and residents about the erosion processes observed along thechannel, their impacts to Tainter Lake, and potential solutions. Because of the natural activity ofthe channel in the study reach, alternatives and complements to bank protection projects, such asdredging and upland work should also be investigated. To advance any proposed in-channelprojects, more detailed data will be required for permitting and design purposes. This informationmay include site specific material availability and costs, survey data, and hydraulic modeling. Abroader inquiry into how projects will affect upstream flood elevations will also likely berequired.
Red Cedar River Erosion Report
40 | P a g e
REFERENCESArcement, G.J., and V.R. Schneider. 1989. Guide for selecting Manning’s roughness coefficientsfor natural channels and flood plains. U.S. Geological Survey Water-Supply Paper 2339.
Camporeale, C., P. Perona, A. Porporato, and L. Ridolfi. 2005. On the long-term behavior ofmeandering rivers. Water Resources Research, 41: W12403, doi:10.1029/2005WR004109
D’Aoust, S., and R.G. Milar. 2000. Stability of ballasted wood debris habitat structures. Journalof Hydraulic Engineering, 126(11): 810-817.
Dunn County Land Conservation Division. 2006. Tainter Lake Basin River Inventory Study.
Federal Emergency Management Agency (FEMA). 2011. Flood Insurance Study for DunnCounty, WI.
Gorbel, J.E., D.M. Mickelson, W.R. Ferrand, L. Clayton, J.C. Knox, A. Cahow, H.C. Hobbs, andM.S. Walnut. 1983. Quaternary Geologic Mpa of the Minneapolis Quadrangle, UnitedStates.
Gurnell, A.M., H. Piegay, F.J. Swanson, and S.V. Gregory. 2002. Large wood and fluvialprocesses. Freshwater Biology, 47: 601-619.
Hydrologic Engineering Center (HEC). 2010. HEC-RAS: River analysis system. US ArmyCorps of Engineers, Version 4.1.
Interagency Advisory Committee on Water Data [IACWD]. 1982. Guidelines for determiningflood flow frequency: Bulletin 17B of the Hydrology Subcommittee. U.S. GeologicalSurvey, Office of Water Data Coordination, Reston, VA.
Lauer, J.W., and G. Parker. 2008. Net local removal of floodplain sediment by river meandermigration. Geomorphology, 96: 123-149.
Mount, N.J., Louis, J., Teeuw, R.M, and Stott, T. 2003. Estimation of error in bankfull widthcomparisons from temporally sequenced raw and corrected aerial photographs.Geomorphology 56.1: 65-77.
Natural Resource Conservation Service (NRCS). 2004. Soil Survey of Dunn County, WI.,United States Department of Agriculture, Natural Resources Conservation Service,incooperation with the Dunn County Land Conservation Department and the ResearchDivision of the College of Agricultural and Life Sciences, University of Wisconsin.Prepared by Theron Meyer.
Natural Resource Conservation Service (NRCS). 2008. Rapid Watershed Assessment – RedCedar River Watershed.
Swanson, B.J., G.A. Meyer, and J. Coonrod. 2011. Historical channel narrowing along the RioGrande near Albuquerque, New Mexico in response to peak discharge reductions andengineering: magnitude and uncertainty from airphoto measurements. Earth SurfaceProcesses and Landforms 36.7: 885-900.
Red Cedar River Erosion Report
41 | P a g e
Tainter /Menomin Lake Improvement Association. 2013. Laboratory report on sedimentphosphorus concentrations from UW Agricultural Extension Laboratory, Menominie, WI.
Wisconsin Department of Natural Resources (WDNR). 2014. The ecological landscapes ofWisconsin:an assessment of ecological resources and a guide to planning sustainablemanagement.Wisconsin Department of Natural Resources, PUB-SS-1131 2014,Madison.
Wisconsin Department of Natural Resources (WDNR). 2012. Phosphorus Total Maximum DailyLoads (TMDLs) Tainter Lake and Lake Menomin, Dunn County, Wisconsin. WisconsinDepartment of Natural Resources,Western District, Eau Claire WI. May 31, 2012.
Red Cedar River Erosion Report
42 | P a g e
GLOSSARY
AggradationThe increase in land elevation due to the deposition of sediment. Aggradation occurs in areas inwhich the supply of sediment is greater than the amount of material that the system is ableto transport
AlluviumThe loose, unconsolidated sediment which has been eroded by a stream or river, transported andreshaped, and then redeposited downstream.
AvulsionThe rapid abandonment of a river channel and the formation of a new river channel. Avulsionsoccur as a result of channel slopes that are much lower than the slope needed to maintainsediment transport and to efficiently pass flood flows.
BankfullThe bankfull stage is associated with the flow that just fills the channel to the top of its banks andwater begins to overflow onto the floodplain. It is often associated with flows that occur every1.5 to 2 years, on average. Bankfull depth, height, width, slope, etc. are the characteristics of thechannel at bankfull stage.
ColluviumThe loose, unconsolidated sediments that have been deposited at the base of hillslopes by non-stream associated hillslope processes, such as sheetwash, slow continuous downslope creep.Materials are usually a wide range of sizes.
ConfluenceThe junction where two rivers or streams join to become one.
CutbankThe outside bank of stream or river bend which is continually undergoing erosion.
CutoffA meander cutoff occurs when a meander bend in a river is breached by a shorter channel thatconnects the two closest parts of the bend. This causes the flow to abandon the meander andcontinue straight downslope. Cutoffs are a natural part of the evolution of meandering riversAvulsions, or chute cutoffs, are channels that form as meander cutoffs over relatively longdistances, as opposed to only at the neck of the meander bend. The new channels usuallycapture an existing low point in the floodplain. The stagnant part of the river abandoned after the
Red Cedar River Erosion Report
43 | P a g e
cutoff event will sometimes form an Oxbow lake.
DegradationThe lowering of a stream or river bed or floodplain through erosional processes. Degradation ischaracteristic of channel networks that are transporting more material than they are depositing.
DeltaA landform that occurs where the river flows into an ocean, sea, estuary, lake, or reservoir. Thechange in flow velocity (i.e., less energy) as the channel enters the larger waterbody results in therelatively rapid deposition of the materials carried by the river.
DepositionThe accumulation of sediment left behind as forces responsible for its transportation are nolonger sufficient to overcome the sediments’ weight and the friction with the bed.
Driftless Area
A region of Wisconsin, Minnesota, and Iowa characterized by deeply carved river valleys inbedrock valleys. The area’s terrain results from escaping glaciation in the last glacial period.
ErosionThe process by which soil and rock are removed from hillslopes and floodplains by wind orwater flow, and other activities. It general, erosion occurs when the driver, such as water flow,has enough energy to overcome the weight, friction, and attachment forces holding sediment orrock particles in place.
EutrophicThe ecosystem condition where the addition of nutrients (e.g., nitrates and phosphates) to awaterbody leads to negative impacts. The impacts often include algal blooms, which result inoxygen depletion, which in turn, reduces productivity and diversity for other species such asfishes and macroinvertebrates.
ImpoundmentA lake or pond formed behind a dam.
LoamLoam is soil composed of sand, silt, and clay in relatively even proportions. Loam is consideredideal for agricultural uses because it retains nutrients well and retains water while still allowingexcess water to drain away.
Loess
Red Cedar River Erosion Report
44 | P a g e
Sediment derived of accumulated fine, wind-blown silts and fine sands. They often form finesoils well suited to agriculture.
Meander BendA bend in a watercourse or river generally formed when the moving water in the river erodes theouter banks and sediment is deposited along the inner part of the river where the flow has lessless energy .
MoraineThe accumulation of glacially eroded material. In ground moraines the till is left behind as theglacier rapidly retreats. They are usually characterized by gently rolling hills or plains. Endmoraines represent the maximum advance of a glacier. They are areas where the edge of theglacier was generally in the same place over a relatively long period, so the material moved inthe ice, which generally acts as a conveyer belt for sediment, accumulated to form relatively highridges and hills when the ice receded.
PermeabilityThe ability for water to move through a rock or soil.
Point BarA depositional feature made of sand and gravel that accumulates on the inside bendof streams and rivers, where the energy is reduced. Under equilibrium conditions, a point barshould grow at the same rate as the erosion on the opposing cutbank.
ReservoirA lake or pond formed behind a dam
Return/Recurrence IntervalAn estimate of the likelihood of an river flow (e.g. flood) to occur. It is a statistical measurementtypically based on historic data denoting the average recurrence interval over an extended periodof time, and is usually used for risk analysis. Channels are thought to evolve to pass annualfloods with a 1.5-2 year return interval.
RiffleA short, relatively shallow and coarse-bedded length of stream over which the stream flows athigher velocity and higher turbulence than adjacent stream sections.
Red Cedar River Erosion Report
45 | P a g e
Shear StressThe force per area traveling parallel to the surface of the material. In rivers, it is primarilyassociated with the depth of slope of the flow. When the combination of the water’s depth andgradient are large enough to overcome the weight, friction, and attachment forces of thesediment it flows over, then sediment transport can occur.
SinuosityA measure of a river or stream’s bendiness or curviness based on the ratio of its channel lengthand its valley length (a perfectly straight channel has a sinuosity of 1).
TerraceThe remnants of a former floodplain surface of a stream or river formed by the downcutting of ariver or stream channel, followed by the formation of a new river and floodplain system at alower elevation, and the abandonment and lateral erosion of the former floodplain. Bluffs areusually areas where the existing channel is eroding terrace sediments.
ThalwegThe line of lowest elevation point along a river or stream, or the deepest part of the channelalong its path.
Till/Glacial TillUnsorted sediments deposited directly by glaciers as they retreat. Till materials are usually finegrained but vary widely from clays to mixtures of clay, sand, gravel and boulders.
Water CapacityThe amount of water that a soil can store that is available for use by plants.
Red Cedar River Erosion Report
46 | P a g e
APPENDICES
Appendix A. Red Cedar River Erosion Partnership Team
Appendix B. Red Cedar River Watershed
Appendix C. Red Cedar River Study Area, Dunn County, Wisconsin.
Appendix D. Erosion Sites along the upstream reaches of the Red Cedar River (1992-2012)
Appendix E. Erosion Sites along the focus reach of the Red Cedar River (1992-2012)
Appendix F. Erosion Sites along the focus reach, downstream of the Colfax wastewatertreatment facility (1992-2012)
Appendix G . Soils and erosion sites along the Red Cedar River near Colfax, WI.
Appendix H. Schematic of a cross section through a log cribwall.
Appendix I. Schematic of a cross section through a log cribwall.
Appendix J . Planview schematic of a log cribwall stabilization project.
Appendix K. Planview schematic of a log cribwall stabilization project with a new channelconstructed on the inside of the bend, and the existing channel filled and convertedto floodplain.
Red Cedar River Erosion Report
47 | P a g e
UW-Stout Construction Honor Students provided surveying support for streambank and river cross-sections for this project.
Appendix A. Red Cedar River Erosion Partnership Team
Last Name First Name Title Affiliation
Campbell Nathan Regulatory Project Manager US Army Corps of Engineers
DeFelice Dustin Water Regulations & Zoning Engineer WI Department of Natural Resources
Engel Marty Fisheries Biologist WI Department of Natural ResourcesGaetzke Chris Conservationist Dunn County Land Conservation DivisionHarings Mark Water Management Specialist WI Department of Natural ResourcesKaner Bob Conservationist Dunn County Land Conservation DivisionMosey Mark Science Teacher Colfax High SchoolPrestebak Dan Conservationist Dunn County Land Conservation DivisionSelle Andy Fisheries Biologist/ Engineer Inter-Fluve, Inc.Sippl John District Conservationist USDA Natural Resource Conservation ServiceSorge Patrick "Buzz" West Central Lake Coordinator WI Department of Natural ResourcesSours John Trout Habitat Coordinator WI Department of Natural ResourcesStyer Dale Landowner LandownerSwanson Ben Fluvial Geomorphologist Inter-Fluve, Inc.Verdon Ron President, Landowner Tainter Menomin Lake Improvement AssociationZerr Dan Natural Resources Educator UW-Extension Regional EducatorZien Terry R. Program Manager US Army Corps of Engineers
Red Cedar River Erosion Report
48 | P a g e
Appendix B. Red Cedar River Watershed
Red Cedar River Erosion Report
49 | P a g e
Appendix C. Red Cedar River Study Area, Dunn County, Wisconsin.
Red Cedar River Erosion Report
50 | P a g e
Appendix D. Erosion Sites along the upstream reaches of the Red Cedar River (1992-2012)
Red Cedar River Erosion Report
51 | P a g e
Appendix E. Erosion Sites along the focus reach of the Red Cedar River (1992-2012)
Red Cedar River Erosion Report
52 | P a g e
Appendix F. Erosion Sites along the focus reach, downstream of the Colfax wastewater treatment facility (1992-2012).
Red Cedar River Erosion Report
53 | P a g e
Appendix G. Soils and erosion sites along the Red Cedar River near Colfax, WI.
Red Cedar River Erosion Report
54 | P a g e
Appendix H. Estimation of Erosion Process. 1) Banklines were drawn along the channel on each photograph, and then compared. 2) Erosion areas were delineated asthe area between banklines. 3) The maximum offset is the maximum distance between the two banklines, and the average offset is the average distance between the lines.4) Erosion volumes were estimated by multiplying the erosion area by the height of the bank or bluff.
Red Cedar River Erosion Report
55 | P a g e
Appendix I. Schematic of a cross section through a log cribwall.
Red Cedar River Erosion Report
56 | P a g e
Appendix J. Planview schematic of a log cribwall stabilization project.
Red Cedar River Erosion Report
57 | P a g e
Appendix K. Planview schematic of a log cribwall stabilization project with a new channel constructed on the inside of the bend, and the existing channel filled and converted to floodplain.