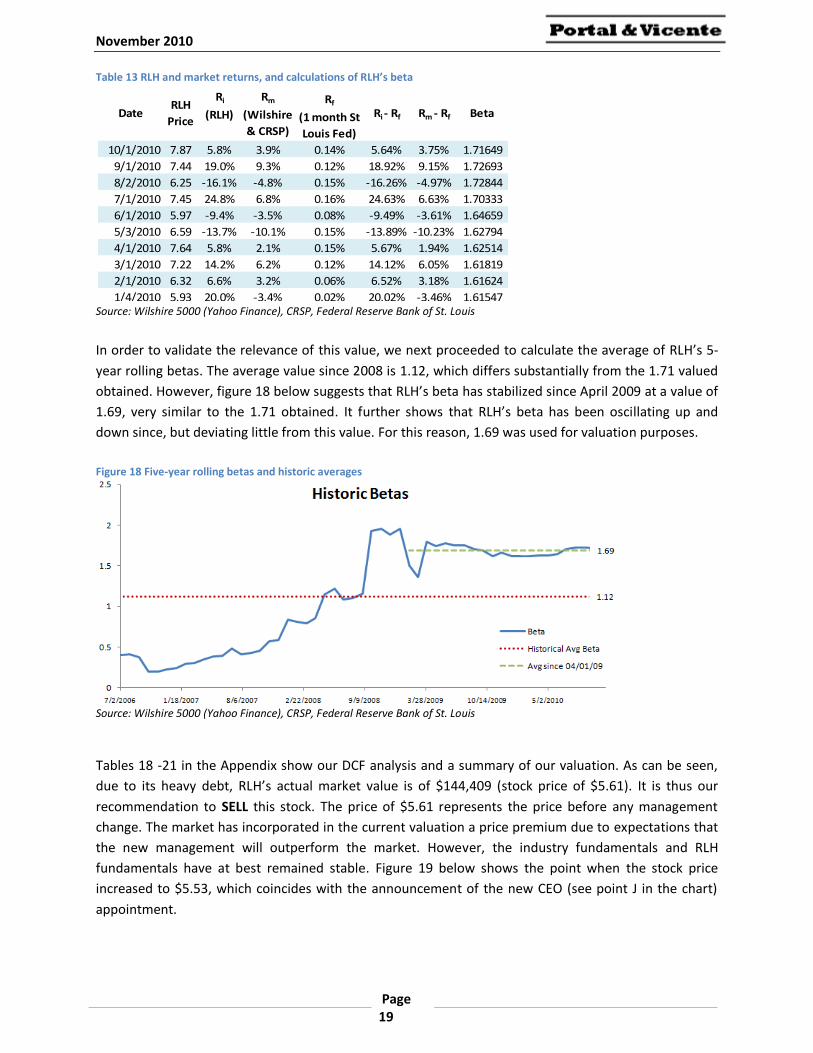
Monday, November 29, 2010 Adrian Portal [email protected]Marcos Vicente Blanco [email protected]Red Lion Hotels Corp. (NYSE: RLH) Closing Price (11/26/10) $7.80 Target Price $5.61 52 week Low $4.31 52 week High $8.24 Shares Outstanding 18.52M Market Cap $144.41M ROE -5.15% EPS -0.54 Beta 1.69 Source: MSN money, Google Finance, Company Data (c) 2010 Red Lion Hotels Corporation New hotel directors do not change fundamentals Highlights 1. Heavy dependence on third-party lending and uncertainty to secure future loans threatens RLH’s survival 2. Expected growth for the next 10 years to be in line with Real GDP growth, at most 3. Management projections cannot be trusted, as it has proven to be consistently unreliable (e.g. objectives set for the past five years have not been met) 4. 1% of current revenue stream (franchises) cannot lead to the turnaround of the business 5. Potential M&A target Source: Google Finance Please see the disclaimer in the next page for important information Recommendation: SELL
Market Cap $144.41M ROE -5.15% EPS -0.54 Beta 1.69 Source: MSN money, Google Finance, Company Data
(c) 2010
Red Lion Hotels Corporation New hotel directors do not change fundamentals
Highlights
1. Heavy dependence on third-party lending and uncertainty to secure future loans threatens RLH’s survival
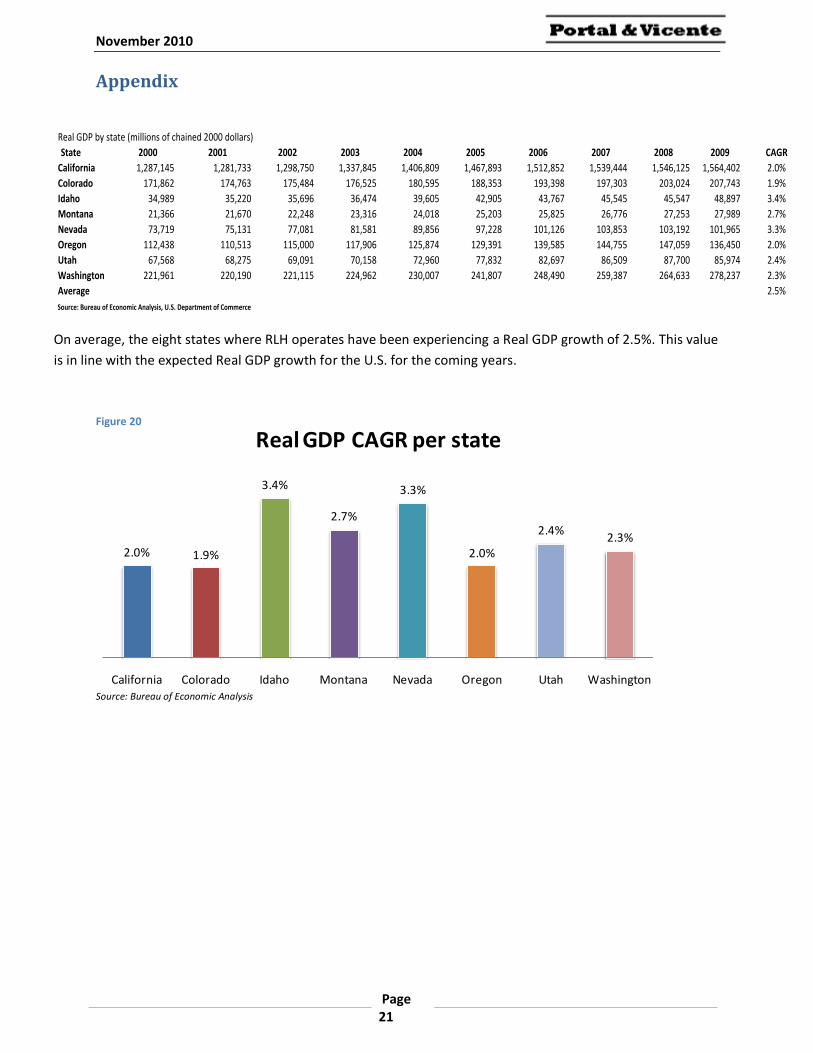
2. Expected growth for the next 10 years to be in line with Real GDP growth, at most
3. Management projections cannot be trusted, as it has proven to be consistently unreliable (e.g. objectives set for the past five years have not been met)
4. 1% of current revenue stream (franchises) cannot lead to the turnaround of the business
5. Potential M&A target
Source: Google Finance
Please see the disclaimer in the next page for important information
Please read this document before reading this report.
This report has been written by MBA students at Yale's School of Management in partial fulfillment of their course requirements. The report is a student and not a professional report. It is intended solely to serve as an example of student work at Yale’s School of Management. It is not intended as investment advice. It is based on publicly available information and may not be complete analyses of all relevant data.
If you use this report for any purpose, you do so at your own risk. YALE UNIVERSITY, YALE SCHOOL OF MANAGEMENT, AND YALE UNIVERSITY’S OFFICERS, FELLOWS, FACULTY, STAFF, AND STUDENTS MAKE NO REPRESENTATIONS OR WARRANTIES, EXPRESS OR IMPLIED, ABOUT THE ACCURACY OR SUITABILITY FOR ANY USE OF THESE REPORTS, AND EXPRESSLY DISCLAIM RESPONSIBIITY FOR ANY LOSS OR DAMAGE, DIRECT OR INDIRECT, CAUSED BY USE OF OR RELIANCE ON THESE REPORTS.
November 2010
Page 4
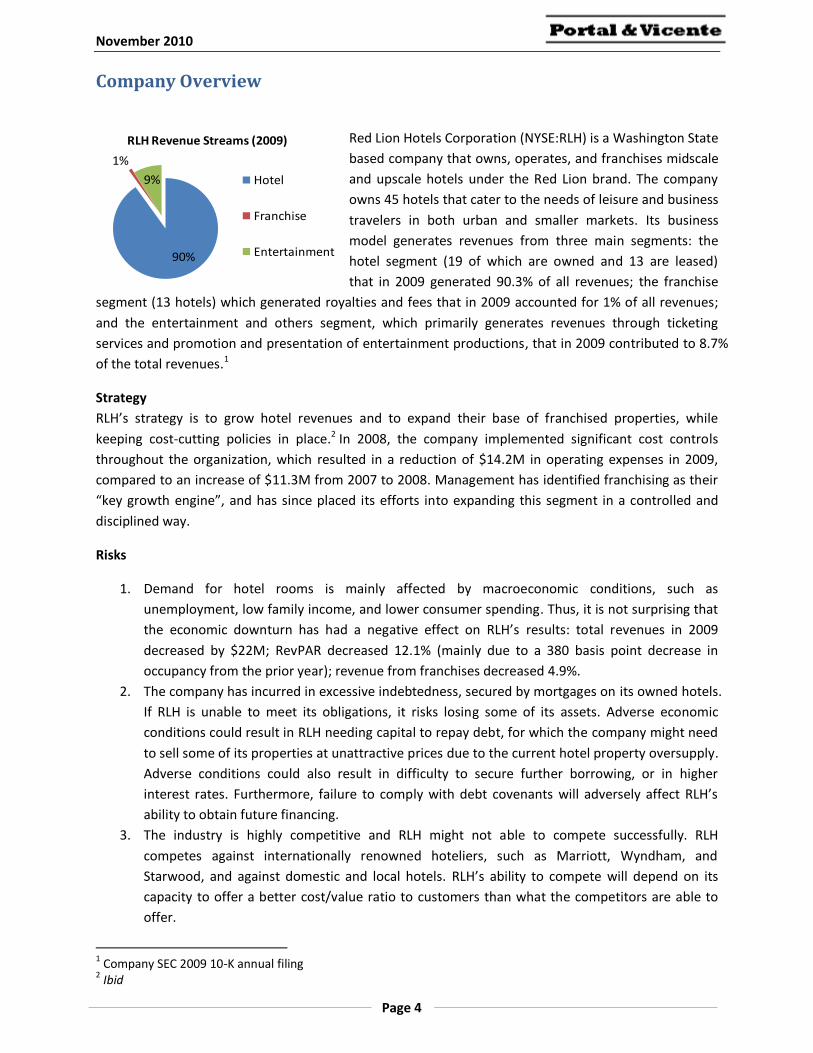
90%
1%
9%
RLH Revenue Streams (2009)
Hotel
Franchise
Entertainment
Company Overview
Red Lion Hotels Corporation (NYSE:RLH) is a Washington State
based company that owns, operates, and franchises midscale
and upscale hotels under the Red Lion brand. The company
owns 45 hotels that cater to the needs of leisure and business
travelers in both urban and smaller markets. Its business
model generates revenues from three main segments: the
hotel segment (19 of which are owned and 13 are leased)
that in 2009 generated 90.3% of all revenues; the franchise
segment (13 hotels) which generated royalties and fees that in 2009 accounted for 1% of all revenues;
and the entertainment and others segment, which primarily generates revenues through ticketing
services and promotion and presentation of entertainment productions, that in 2009 contributed to 8.7%
of the total revenues.1
Strategy
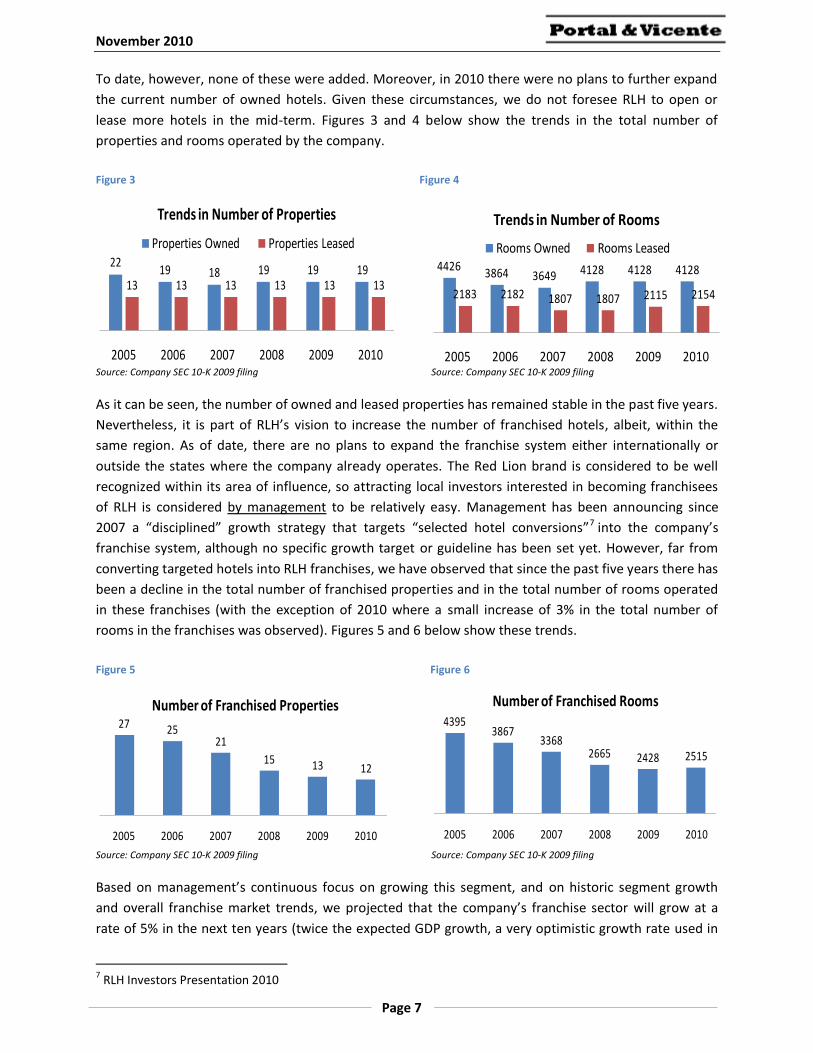
RLH’s strategy is to grow hotel revenues and to expand their base of franchised properties, while
keeping cost-cutting policies in place.2 In 2008, the company implemented significant cost controls
throughout the organization, which resulted in a reduction of $14.2M in operating expenses in 2009,
compared to an increase of $11.3M from 2007 to 2008. Management has identified franchising as their
“key growth engine”, and has since placed its efforts into expanding this segment in a controlled and
disciplined way.
Risks
1. Demand for hotel rooms is mainly affected by macroeconomic conditions, such as
unemployment, low family income, and lower consumer spending. Thus, it is not surprising that
the economic downturn has had a negative effect on RLH’s results: total revenues in 2009
decreased by $22M; RevPAR decreased 12.1% (mainly due to a 380 basis point decrease in
occupancy from the prior year); revenue from franchises decreased 4.9%.
2. The company has incurred in excessive indebtedness, secured by mortgages on its owned hotels.
If RLH is unable to meet its obligations, it risks losing some of its assets. Adverse economic
conditions could result in RLH needing capital to repay debt, for which the company might need
to sell some of its properties at unattractive prices due to the current hotel property oversupply.
Adverse conditions could also result in difficulty to secure further borrowing, or in higher
interest rates. Furthermore, failure to comply with debt covenants will adversely affect RLH’s
ability to obtain future financing.
3. The industry is highly competitive and RLH might not able to compete successfully. RLH
competes against internationally renowned hoteliers, such as Marriott, Wyndham, and
Starwood, and against domestic and local hotels. RLH’s ability to compete will depend on its
capacity to offer a better cost/value ratio to customers than what the competitors are able to
offer.
1 Company SEC 2009 10-K annual filing 2 Ibid
November 2010
Page 5
4. Volatility in the financial and credit markets impact RLH’s fair value measurement. In 2009,
assets with a book value of $28.4M were written down to $19.7M, with a resulting non-cash
impairment loss of $8.7M. Changes like this in the valuation of long-lived assets affect the
company’s financial condition while illustrating a lower demand for hotel properties than in the
past.
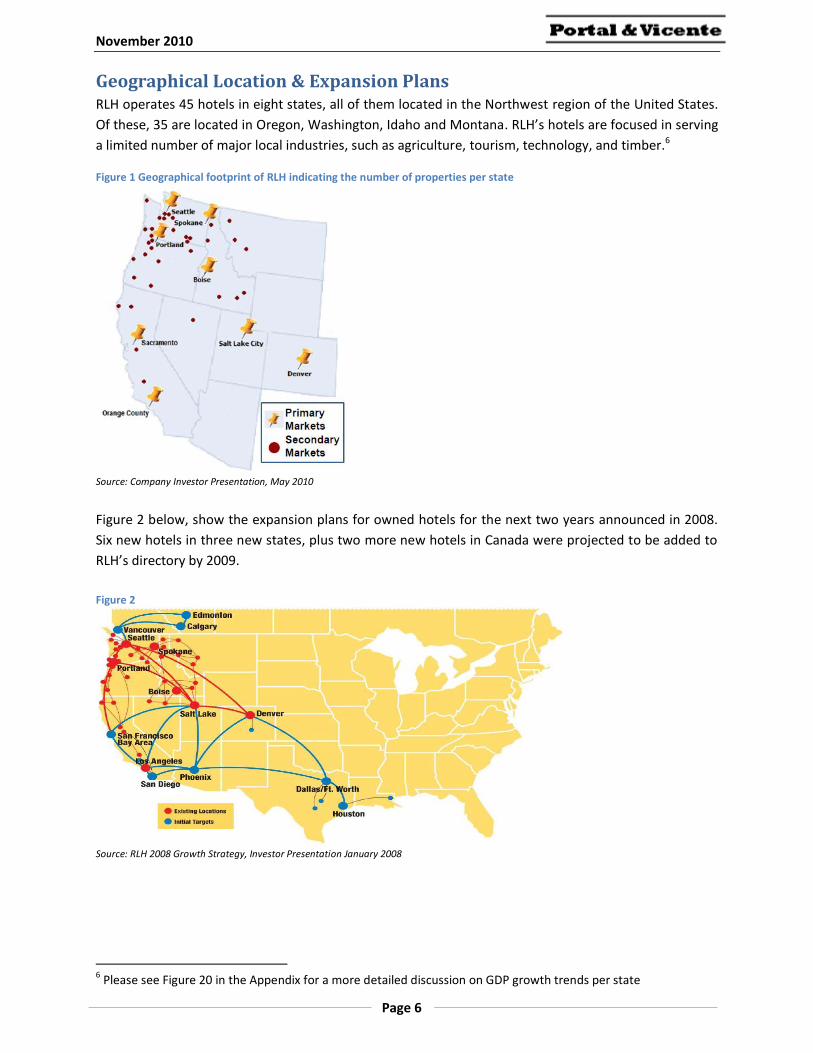
5. RLH’s properties are too concentrated in the Northwest region of the U.S. (see figure 1), which
could affect negatively the company if adverse events, such as natural disasters, hit the zone.
Executive Management
The company has seen major changes in the senior managers that run the business. These changes have
had a big financial impact on RLH. Overall, the market has reacted very positively to all these changes,
an indicator that the former management was not very well regarded.
February 2008, the President and CEO retired. His retirement packaged accounted for $3.7M in
separation payments. The company appointed Mr. Jon E. Eliassen, a director since 2003, as new
President and CEO in January 2010.3 The market had a positive reaction after the announcement
and in less than a week the stock price went from $4.85 to $5.75 (+18.56%).
October of 2008, the company terminated the employment agreement with its Executive Vice
President for Operations, which resulted in an expense of nearly $1M in separation payments. The
position was covered in 2009 by Mr. George H. Schweitzer, a former Senior Vice President since
2008.4 There was no reaction from the market.
September 2010, the company’s CFO decided to leave the company. His position was filled by Mr.
Dan Jackson, who was previously the CFO and EVP of KinderCare Learning Centers, Inc.5 The market
reacted positively, with an immediate stock price increase of $0.10.
September 2010, the previously vacant position of Corporate Controller is covered by Sandi
Heffernan, former Senior Director at NightHawk Radiology Holdings, Inc. Once again, the market
reacted very positively, with an immediate stock price increase from $7.20 to $7.97 (+10.69%).
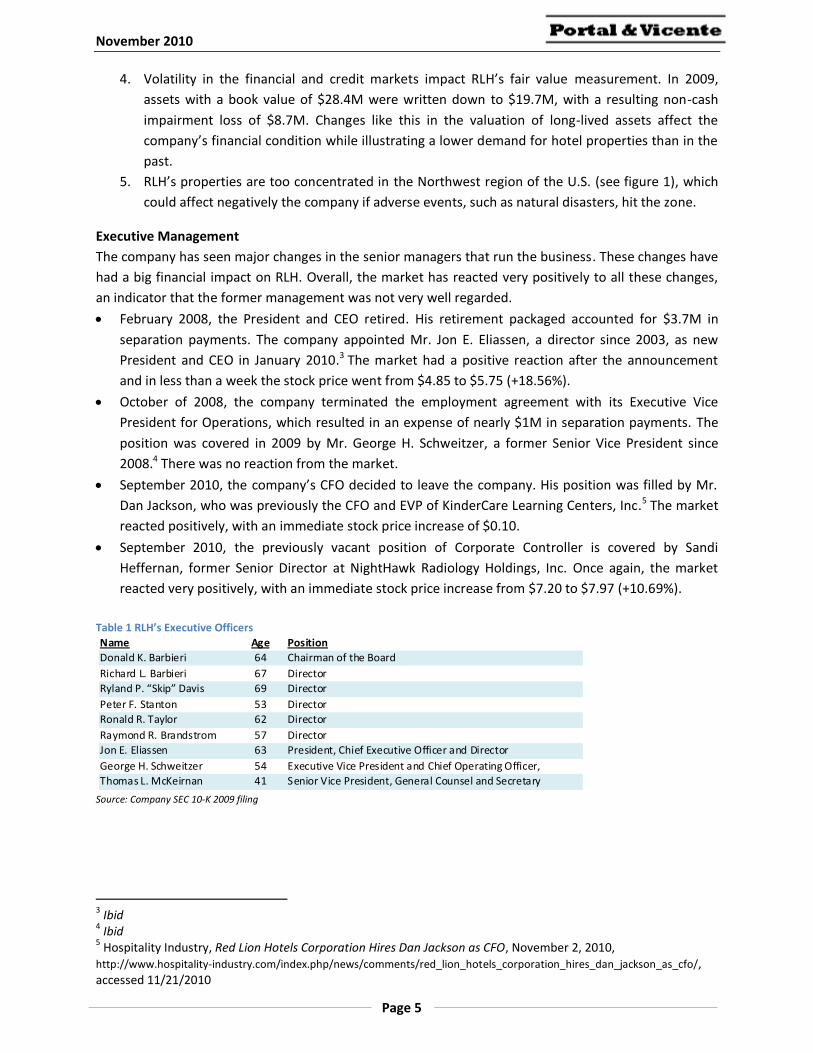
Table 1 RLH’s Executive Officers
Source: Company SEC 10-K 2009 filing
3 Ibid 4 Ibid 5 Hospitality Industry, Red Lion Hotels Corporation Hires Dan Jackson as CFO, November 2, 2010, http://www.hospitality-industry.com/index.php/news/comments/red_lion_hotels_corporation_hires_dan_jackson_as_cfo/, accessed 11/21/2010
Name Age Position
Donald K. Barbieri 64 Chairman of the Board
Richard L. Barbieri 67 Director
Ryland P. “Skip” Davis 69 Director
Peter F. Stanton 53 Director
Ronald R. Taylor 62 Director
Raymond R. Brandstrom 57 Director
Jon E. Eliassen 63 President, Chief Executive Officer and Director
George H. Schweitzer 54 Executive Vice President and Chief Operating Officer,
Thomas L. McKeirnan 41 Senior Vice President, General Counsel and Secretary
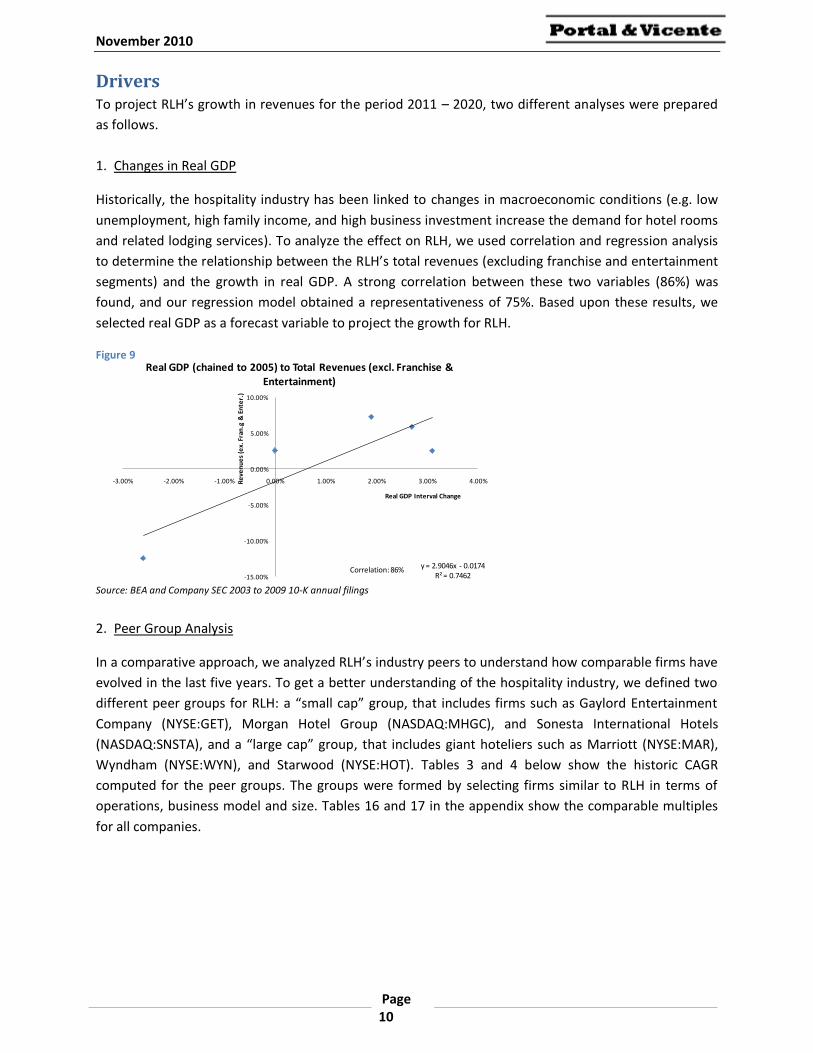
Real GDP (chained to 2005) to Total Revenues (excl. Franchise & Entertainment)
Correlation: 86%
November 2010
Page 11
Table 3 Small Cap Peer Group’s Historic Revenues
Source: Companies Annual Reports
Below is a short description of each peer company
Source: Google Finance
The figure 10 below shows that YTD the company has been consistently following industry trends and
that is has had an average past performance in the stock market, relative to peers similar in size.
Figure 10
Source: Google Finance
Small Cap Group in thousands 2005 2006 2007 2008 2009 2010 CAGR
RLH Total Revenue 163,053 170,368 186,893 187,570 165,388 157,669 -0.56%
GET Total Revenue 644,536 722,272 747,723 930,869 879,121 776,412 3.15%
MHGC Total Revenue 260,349 247,049 322,985 314,467 232,645 220,368 -2.74%
SNSTA Total Revenue 102,668 98,832 86,685 80,517 64,819 77,344 -4.61%
Small Cap Group Total Revenue 1,170,606 1,238,521 1,344,286 1,513,423 1,341,973 1,231,793 0.85%
GET
MHGC
SNSTA
Gaylord Entertainment Company is engaged in the business of hospitality. The Company’s operations are organized
into three principal business segments: Hospitality, which includes its hotel operations; Opry and Attractions,and
Corporate and Other. The Company’s Hospitality, and Opry and Attractions business segments represented
approximately 92.6% and 7.4% respectively, of total revenues for the year ended December 31, 2009.
Morgans Hotel Group Co. is a fully integrated hospitality company that operates, owns, acquires, develops and
redevelops boutique hotels primarily in gateway cities and select resort markets in the United States, Europe and in
select international locations. At December 31, 2009, the Company owned or partially owned, and managed a portfolio
of 13 luxury hotel properties, comprising approximately 4,700 rooms.
Sonesta International Hotels Corporation is engaged in the operation of hotels that it owns in, Massachusetts, and
leases in Louisiana. It also operates hotels in Florida, Egypt (including six Nile River cruise vessels) and Costa Rica.
The Company also has franchise agreements for hotels in St. Maarten, Brazil, Chile, Colombia and Peru. The
Company launched a domestic franchise program during the year ended December 31, 2009. The Company's hotels
are metropolitan and resort hotels in vacation areas. The Company operates the Royal Sonesta Hotel, in New
Orleans, Louisiana under a long-term lease.
November 2010
Page 12
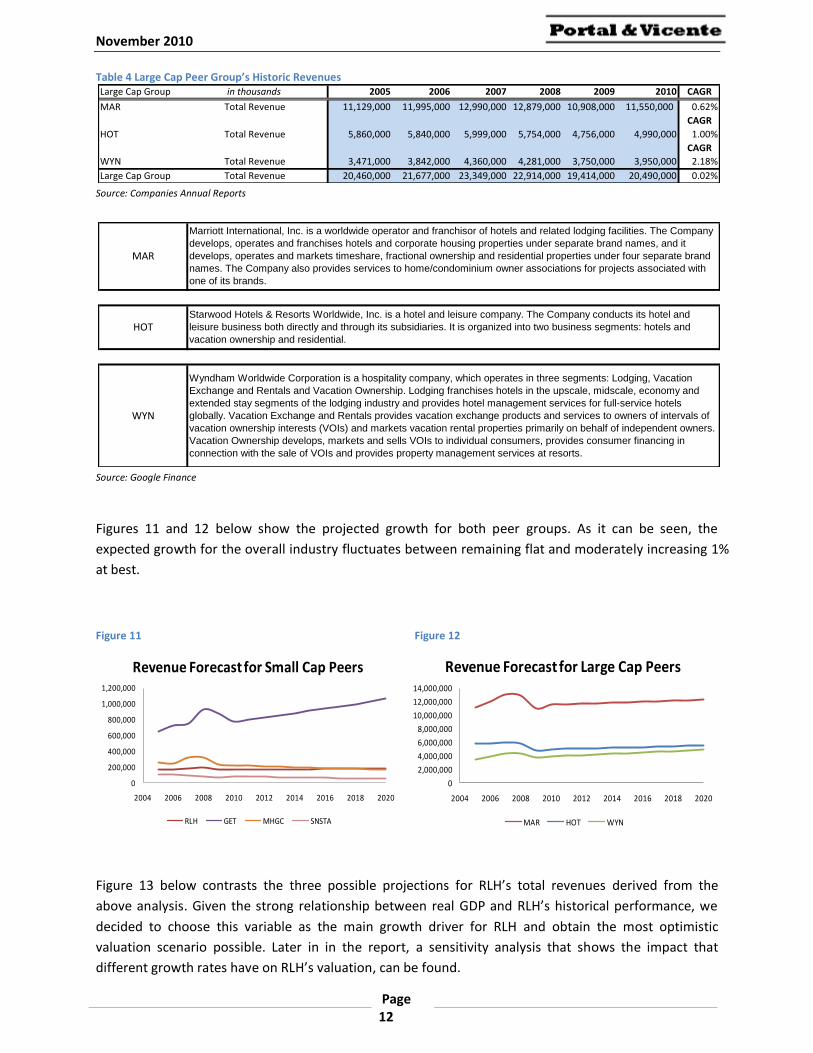
Table 4 Large Cap Peer Group’s Historic Revenues
Source: Companies Annual Reports
Source: Google Finance
Figures 11 and 12 below show the projected growth for both peer groups. As it can be seen, the
expected growth for the overall industry fluctuates between remaining flat and moderately increasing 1%
at best.
Figure 11 Figure 12
Figure 13 below contrasts the three possible projections for RLH’s total revenues derived from the
above analysis. Given the strong relationship between real GDP and RLH’s historical performance, we
decided to choose this variable as the main growth driver for RLH and obtain the most optimistic
valuation scenario possible. Later in in the report, a sensitivity analysis that shows the impact that
different growth rates have on RLH’s valuation, can be found.
Large Cap Group in thousands 2005 2006 2007 2008 2009 2010 CAGR
MAR Total Revenue 11,129,000 11,995,000 12,990,000 12,879,000 10,908,000 11,550,000 0.62%
CAGR
HOT Total Revenue 5,860,000 5,840,000 5,999,000 5,754,000 4,756,000 4,990,000 1.00%
CAGR
WYN Total Revenue 3,471,000 3,842,000 4,360,000 4,281,000 3,750,000 3,950,000 2.18%
Large Cap Group Total Revenue 20,460,000 21,677,000 23,349,000 22,914,000 19,414,000 20,490,000 0.02%
HOT
WYN
MAR
Marriott International, Inc. is a worldwide operator and franchisor of hotels and related lodging facilities. The Company
develops, operates and franchises hotels and corporate housing properties under separate brand names, and it
develops, operates and markets timeshare, fractional ownership and residential properties under four separate brand
names. The Company also provides services to home/condominium owner associations for projects associated with
one of its brands.
Starwood Hotels & Resorts Worldwide, Inc. is a hotel and leisure company. The Company conducts its hotel and
leisure business both directly and through its subsidiaries. It is organized into two business segments: hotels and
vacation ownership and residential.
Wyndham Worldwide Corporation is a hospitality company, which operates in three segments: Lodging, Vacation
Exchange and Rentals and Vacation Ownership. Lodging franchises hotels in the upscale, midscale, economy and
extended stay segments of the lodging industry and provides hotel management services for full-service hotels
globally. Vacation Exchange and Rentals provides vacation exchange products and services to owners of intervals of
vacation ownership interests (VOIs) and markets vacation rental properties primarily on behalf of independent owners.
Vacation Ownership develops, markets and sells VOIs to individual consumers, provides consumer financing in
connection with the sale of VOIs and provides property management services at resorts.
0
200,000
400,000
600,000
800,000
1,000,000
1,200,000
2004 2006 2008 2010 2012 2014 2016 2018 2020
Revenue Forecast for Small Cap Peers
RLH GET MHGC SNSTA
0
2,000,000
4,000,000
6,000,000
8,000,000
10,000,000
12,000,000
14,000,000
2004 2006 2008 2010 2012 2014 2016 2018 2020
Revenue Forecast for Large Cap Peers
MAR HOT WYN
November 2010
Page 13
Figure 13
Source: RHL’s SEC 2005 to 2009 10-K annual filings, EIU, and small and large cap peer groups’ SEC 2005 to 2009 10-K annual filings
Valuation Real GDP Projections 2010 – 2020: To estimate the growth Real GDP for the coming ten years, several
different sources were consulted to get a sense of where the economy is heading at. The most relevant
sources found were:8
1. The Congressional Budget Office. In a communication from the CBO’s Director, Douglas W.
Elmendorf, dated September 28, 2001, the office acknowledged several mistakes in its 2020
GDP forecast, and recognized that its projections should be revised to a slower rate. Given this
fact, we chose not to use the CBO published numbers.
2. The Federal Reserve Bank of Philadelphia offers projections of Real GDP growth based on the
opinion of professional forecasters. Studies on the accuracy of the Survey of Professional
Forecasters (SPF) exist, and it has been found that the SPF’s projections generally outperform
other projections for the very short-term (i.e. one quarter). The SPF’s accuracy, however, falls
sharply at quarterly horizons beyond the first.9 On average, our analysis found that this source’s
forecasts are 58 basis points off from actual GDP growth.
3. The Economist, through its Economist Intelligence Unit (EIU), offers on its webpage Real GDP
projections for the period 2010-2020. On average, these forecasts have been 35 basis points off
the actual GDP growth.
The results of our analyses on GDP accuracy can be found in the Appendix. Table 14 shows the recorded
accuracy for the Federal Reserve Bank of Philadelphia and the EIU. Since the EIU outperforms the
Philadelphia Fed, we chose to use these numbers as our estimators.
8 Portal & Vicente, Choice Hotels International, Inc.: Keep your luggage in the closet, September 22, 2010, Yale SOM 9 Stark, Tom. Realistic Evaluation of Real-Time Forecasts in the Survey of Professional Forecasters, Federal Reserve Bank of Philadelphia, May 28, 2010
November 2010
Page 14
Total Revenues: RLH generates revenues through its Hotel (owned and leased properties), Franchise,
and Entertainment and Other segments. An analysis of RLH’s revenue sources illustrates that the CAGR
has declined by 0.56%, while Hotels (leased) and Entertainment and Other segments have primarily
contributed to this trend with CAGRs of -3.59% and -2.46% respectively. Hotels (owned) and Franchise,
however, have shown moderate growth with CAGRs of 1.01% and 0.20% respectively. The subsequent
section will offer further insights into the assumptions that were used in valuing RLH’s future revenue
streams.
Table 5
Source: Company SEC 2005 to 2009 10-K annual filings, EIU
Hotels (owned and leased): Historically RLH’s major revenue sources, representing between 89%
and 90.5% of its revenues. The conducted statistical analyses previously described demonstrate
strong correlation (86%) between real GDP and Hotel (owned and leased) revenue. Therefore,
the expected real GDP until 2020 was projected in accordance to the EIU’s forecasts, so that
Hotels (owned and forecasted) are forecasted on an individual basis per year. It should be
reemphasized that the EIU’s real GDP forecasts and thus revenue growth expectations are
significantly more “aggressive” and optimistic (average revenue growth expectations of 2.52%
per year) than RLH’s historical revenue development.
Franchise: In order to determine a franchise revenue growth rate, two peer groups were defined
that like RLH receive revenue inflows from franchising (small cap and large cap, described
above). While this was done to study the impact of size differences on revenue growth rates for
both peers group, the CAGR for the last five years fluctuated between 0.27% and 4.6%. Whereas
RLH management has been reiterating in its financial reports and conference calls that
franchising will be grown to become a major revenue source, Table 15 above (with revenues
mainly flat) does not substantiate this statement.10 However, we have still assumed in our
projection an optimistic annual franchise revenue growth rate of 5%, thus assuming that RLH
will outperform current small and large cap franchising competitors.
Entertainment & Other: Also for this business segment a very optimistic demand outlook was
assumed by linking it to EIU’s real GDP growth expectations. This despite the fact that RLH has
been losing ground in the Entertainment & Other segment as a result of losing the promotion
rights to shows such as The Lion King in Honolulu in 2008 and overall a declining number of
10 Company SEC 2005-2010 10-K annual filing and Earnings Conference Call (2009)
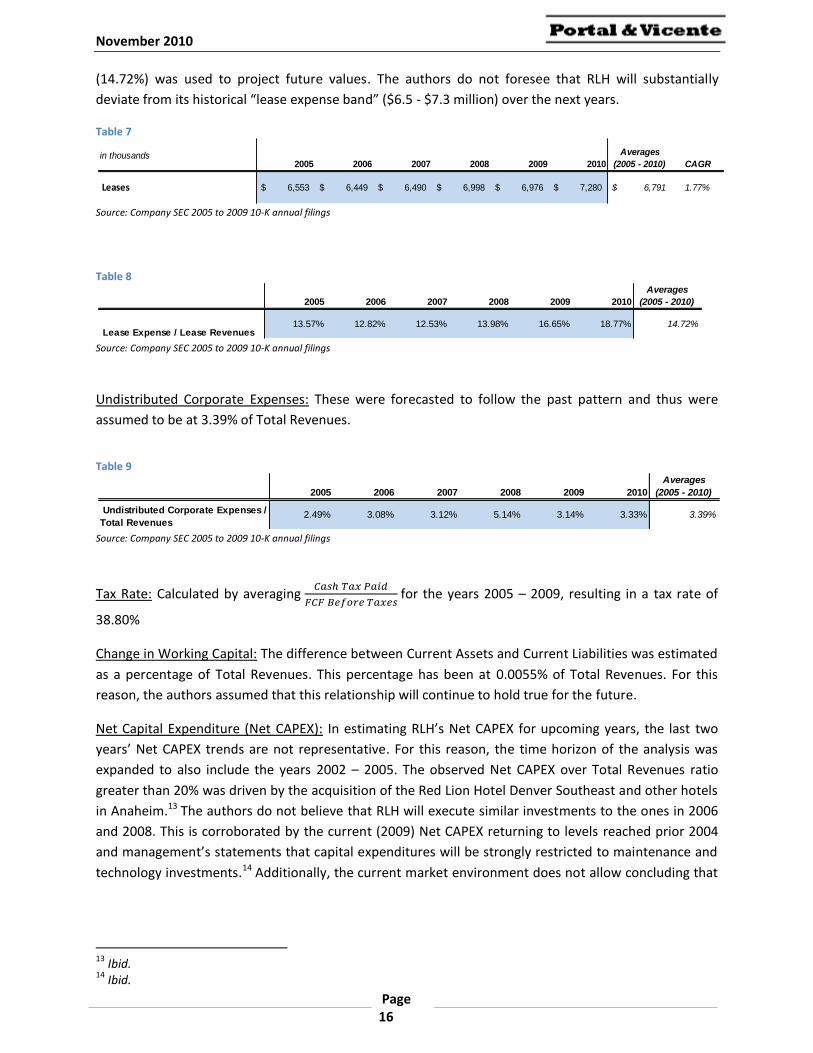
in thousands 2005 2006 2007 2008 2009 2010Averages
Total Revenues 2.49% 3.08% 3.12% 5.14% 3.14% 3.33% 3.39%
November 2010
Page 17
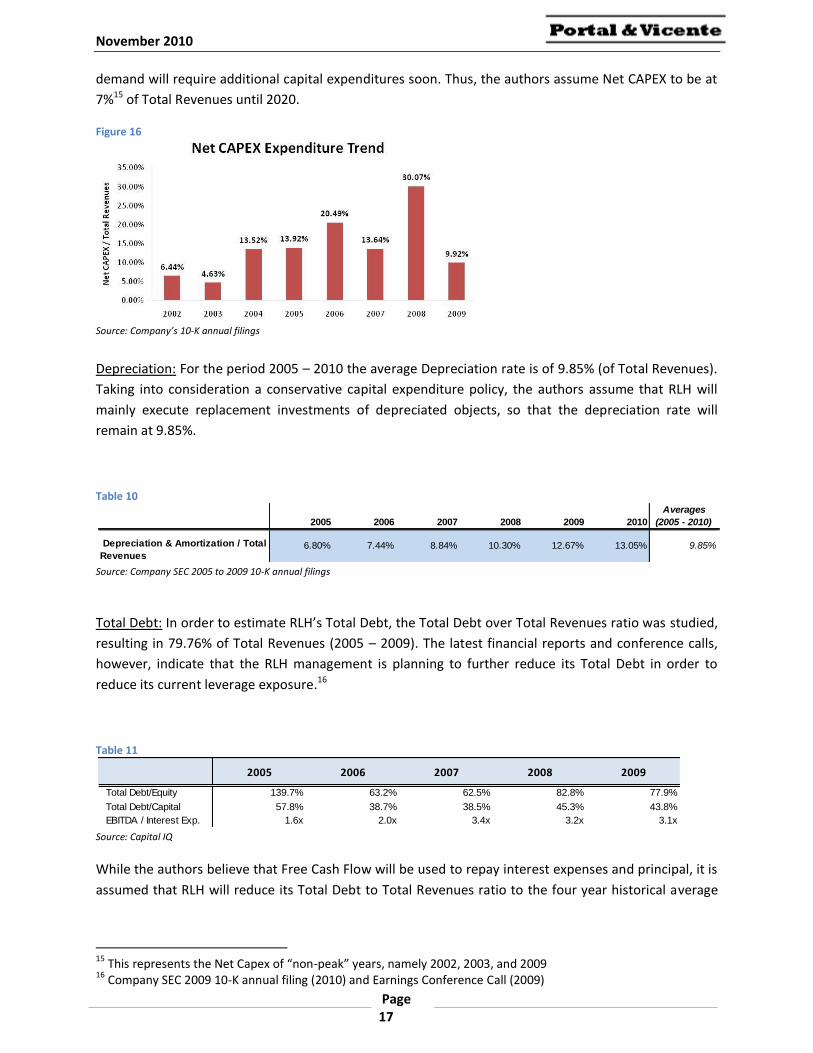
demand will require additional capital expenditures soon. Thus, the authors assume Net CAPEX to be at
7%15 of Total Revenues until 2020.
Figure 16
Source: Company’s 10-K annual filings
Depreciation: For the period 2005 – 2010 the average Depreciation rate is of 9.85% (of Total Revenues).
Taking into consideration a conservative capital expenditure policy, the authors assume that RLH will
mainly execute replacement investments of depreciated objects, so that the depreciation rate will
remain at 9.85%.
Table 10
Source: Company SEC 2005 to 2009 10-K annual filings
Total Debt: In order to estimate RLH’s Total Debt, the Total Debt over Total Revenues ratio was studied,
resulting in 79.76% of Total Revenues (2005 – 2009). The latest financial reports and conference calls,
however, indicate that the RLH management is planning to further reduce its Total Debt in order to
reduce its current leverage exposure.16
Table 11
Source: Capital IQ
While the authors believe that Free Cash Flow will be used to repay interest expenses and principal, it is
assumed that RLH will reduce its Total Debt to Total Revenues ratio to the four year historical average
15 This represents the Net Capex of “non-peak” years, namely 2002, 2003, and 2009 16 Company SEC 2009 10-K annual filing (2010) and Earnings Conference Call (2009)