30
RED RIVER ALLUVIAL AQUIFER SUMMARY, 2010 AQUIFER SAMPLING AND ASSESSMENT PROGRAM APPENDIX 3 TO THE 2012 TRIENNIAL SUMMARY REPORT PARTIAL FUNDING PROVIDED BY THE CWA
RED RIVER ALLUVIAL AQUIFER SUMMARY, 2010 AQUIFER SAMPLING AND ASSESSMENT PROGRAM
APPENDIX 3 TO THE 2012 TRIENNIAL SUMMARY REPORT PARTIAL FUNDING PROVIDED BY THE CWA
Page 2
RED RIVER ALLUVIAL AQUIFER SUMMARY REPORT, 2010ASSET PROGRAM
Contents
BACKGROUND ............................................................................................................................ 4
GEOLOGY .................................................................................................................................... 4
HYDROGEOLOGY ....................................................................................................................... 4
PROGRAM PARAMETERS .......................................................................................................... 5
INTERPRETATION OF DATA ...................................................................................................... 6
Field and Conventional Parameters .......................................................................................... 6
Inorganic (Total Metals) Parameters ......................................................................................... 6
Volatile Organic Compounds ..................................................................................................... 7
Semi-Volatile Organic Compounds ........................................................................................... 7
Pesticides and PCBs ................................................................................................................. 7
WATER QUALITY TRENDS AND COMPARISON TO HISTORICAL ASSET DATA ................... 8
SUMMARY AND RECOMMENDATIONS ..................................................................................... 9
Table 3-1: List of Wells Sampled, Red River Alluvial Aquifer – FY 2010 ........................................... 10
Table 3-2: Summary of Field and Conventional Data, Red River Alluvial Aquifer – FY 2010 ............ 11
Table 3-3: Summary of Inorganic Data (Total Metals), Red River Alluvial Aquifer – FY 2010 ........... 12
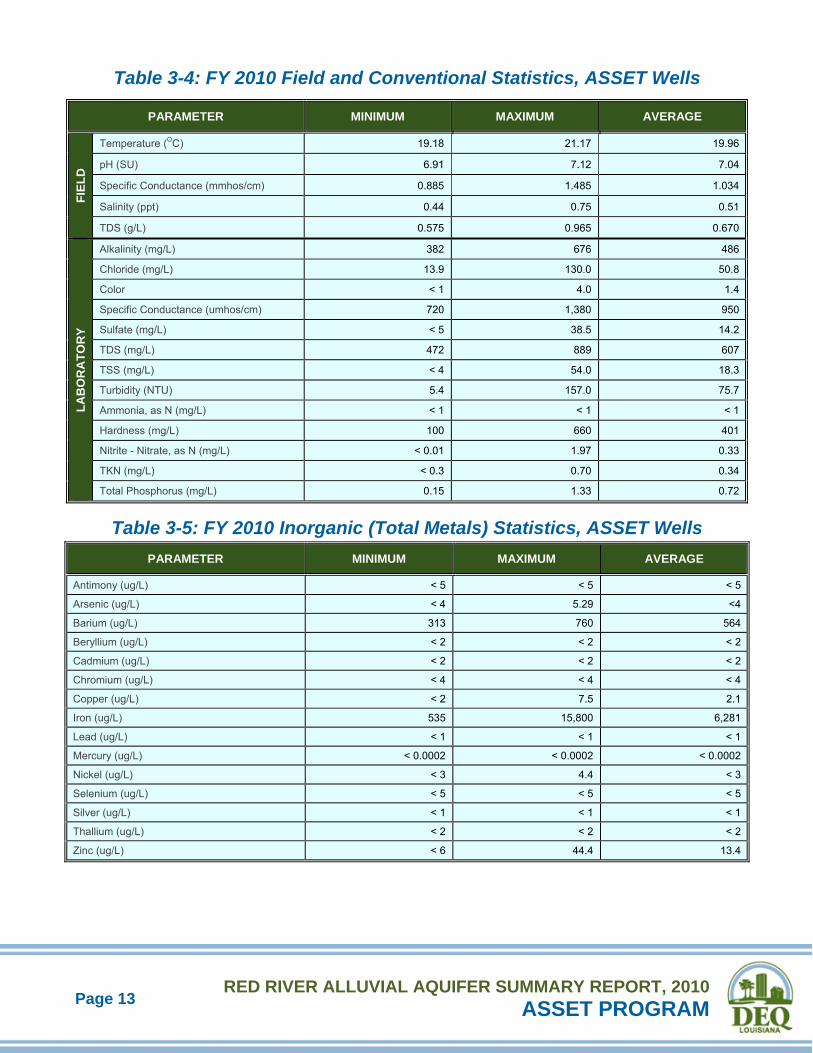
Table 3-4: FY 2010 Field and Conventional Statistics, ASSET Wells ................................................ 13
Table 3-5: FY 2010 Inorganic (Total Metals) Statistics, ASSET Wells ............................................... 13
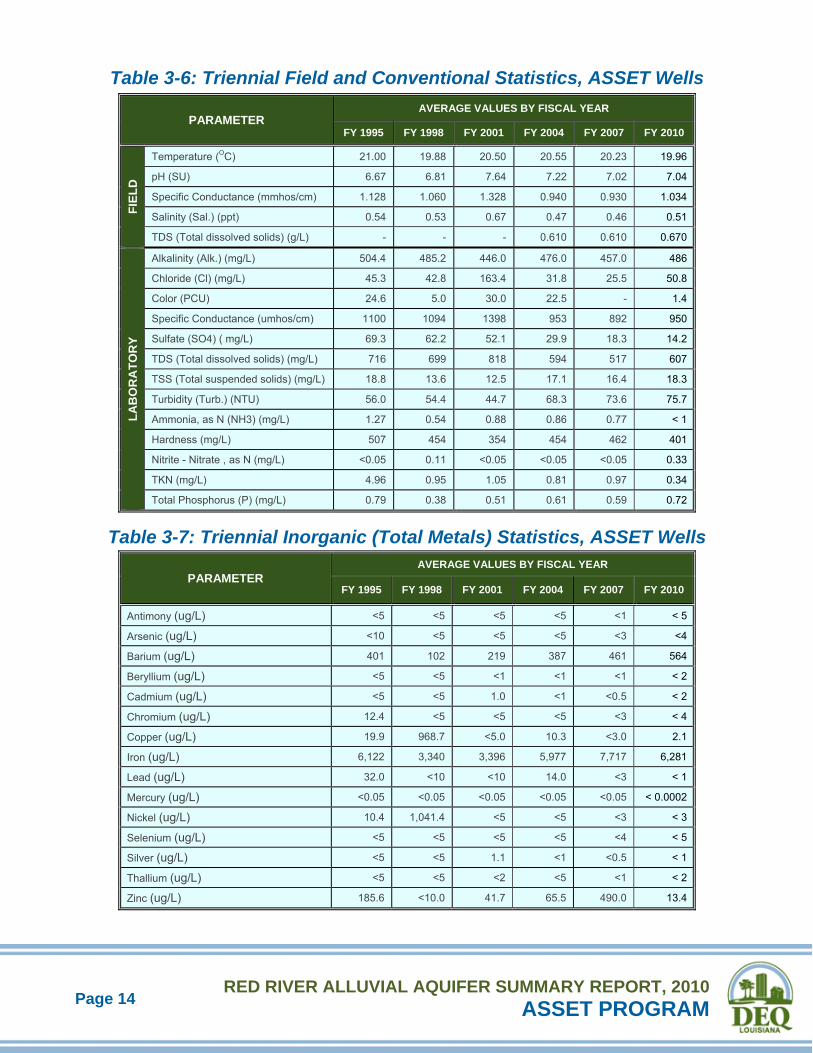
Table 3-6: Triennial Field and Conventional Statistics, ASSET Wells ................................................ 14
Table 3-7: Triennial Inorganic (Total Metals) Statistics, ASSET Wells ............................................... 14
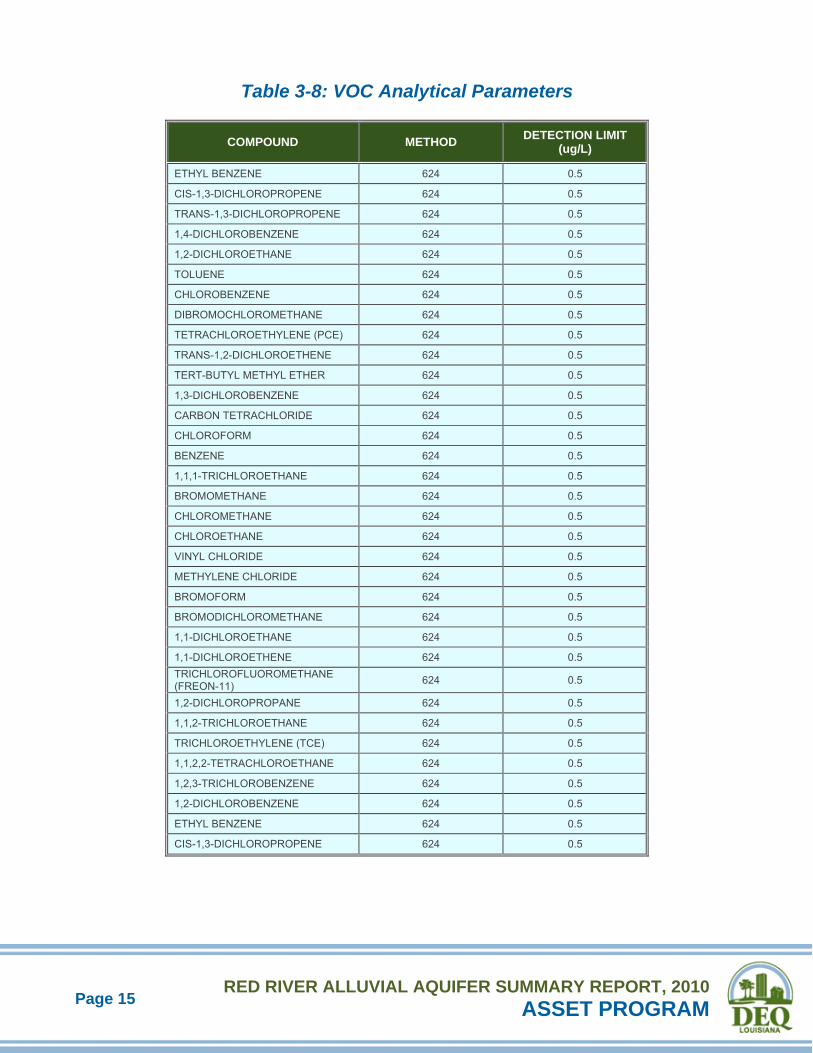
Table 3-8: VOC Analytical Parameters ............................................................................................... 15
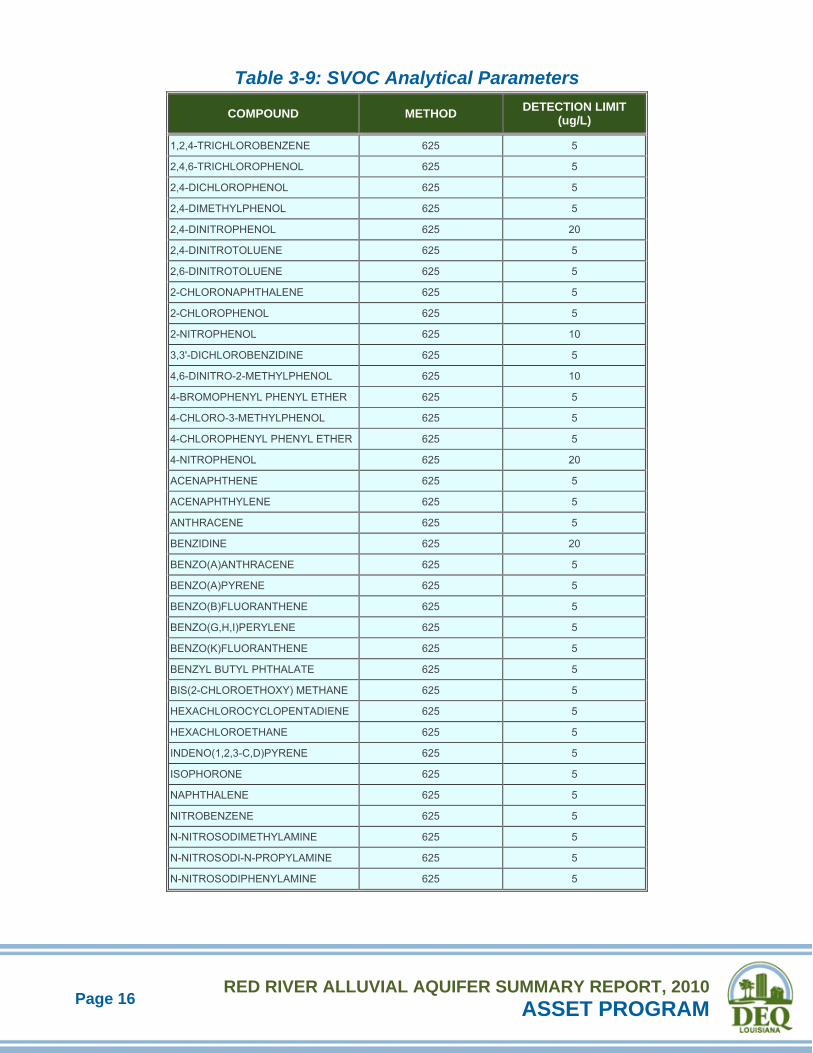
Table 3-9: SVOC Analytical Parameters ............................................................................................. 16
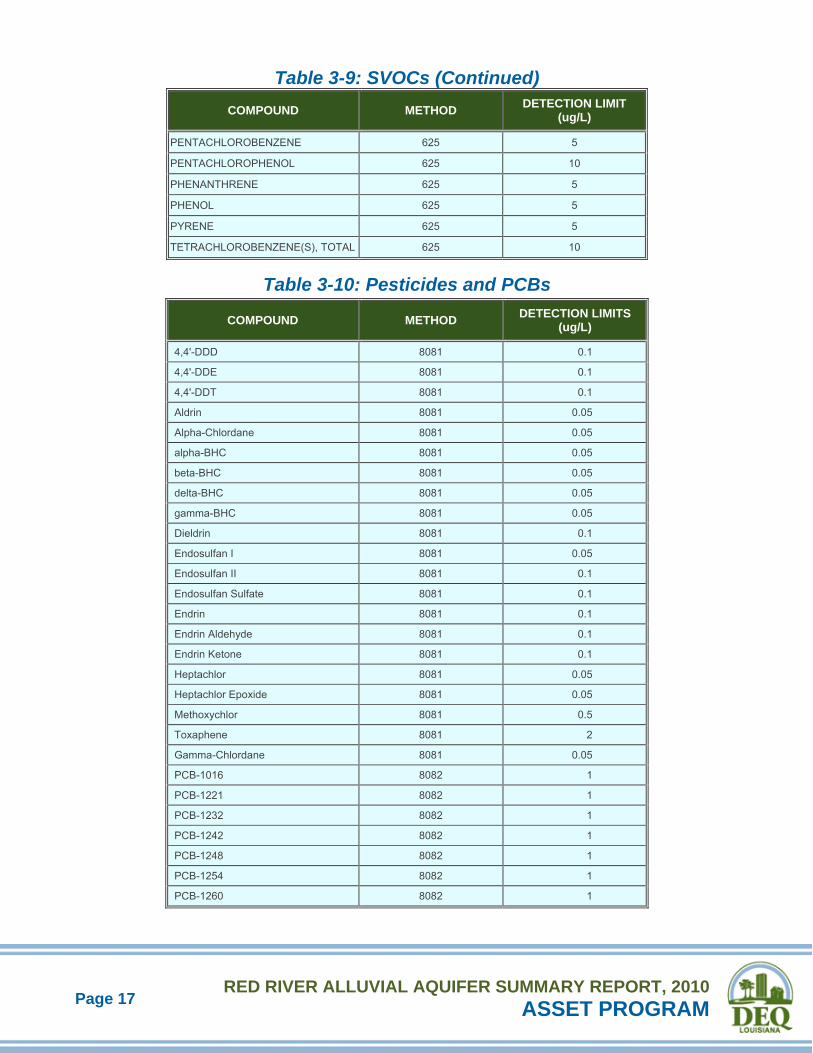
Table 3-10: Pesticides and PCBs ....................................................................................................... 17
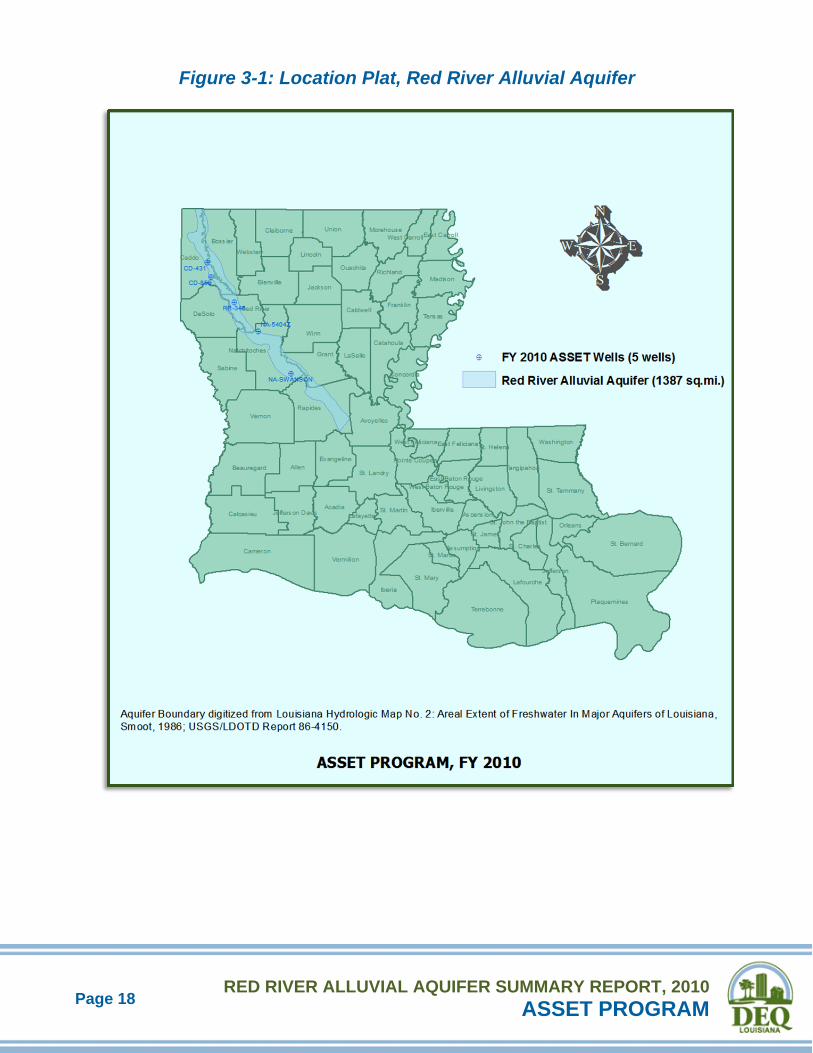
Figure 3-1: Location Plat, Red River Alluvial Aquifer .......................................................................... 18
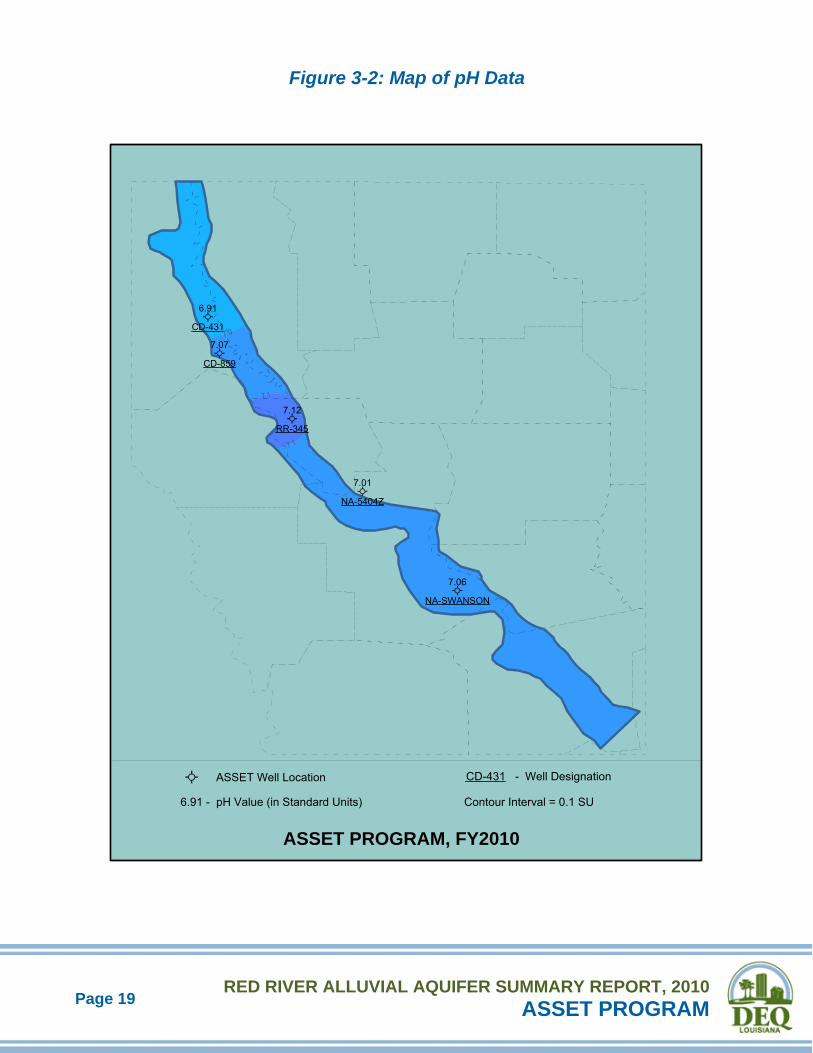
Figure 3-2: Map of pH Data ................................................................................................................. 19
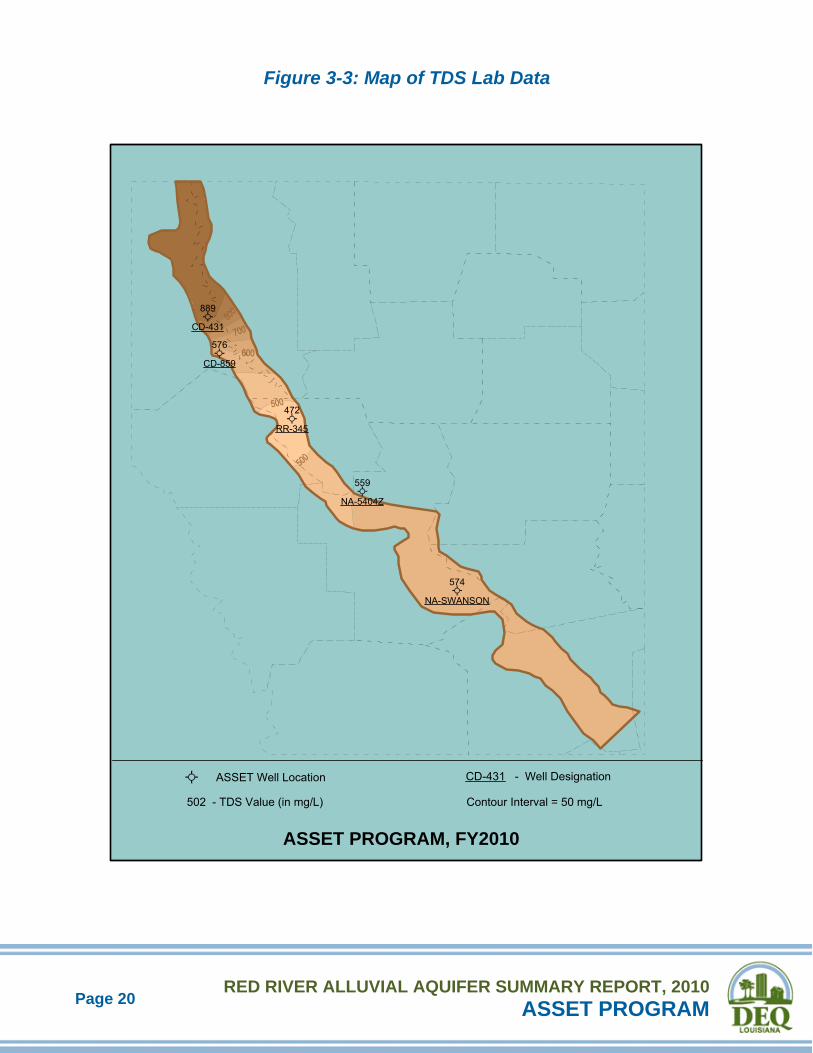
Figure 3-3: Map of TDS Lab Data ....................................................................................................... 20
Figure 3-4: Map of Chloride Data ........................................................................................................ 21
Figure 3-5: Map of Iron Data ............................................................................................................... 22
Chart 3-1: Temperature Trend ............................................................................................................ 23
Chart 3-2: pH Trend ............................................................................................................................ 23
Chart 3-3: Field Specific Conductance Trend ..................................................................................... 24
Chart 3-4: Lab Specific Conductance Trend ....................................................................................... 24
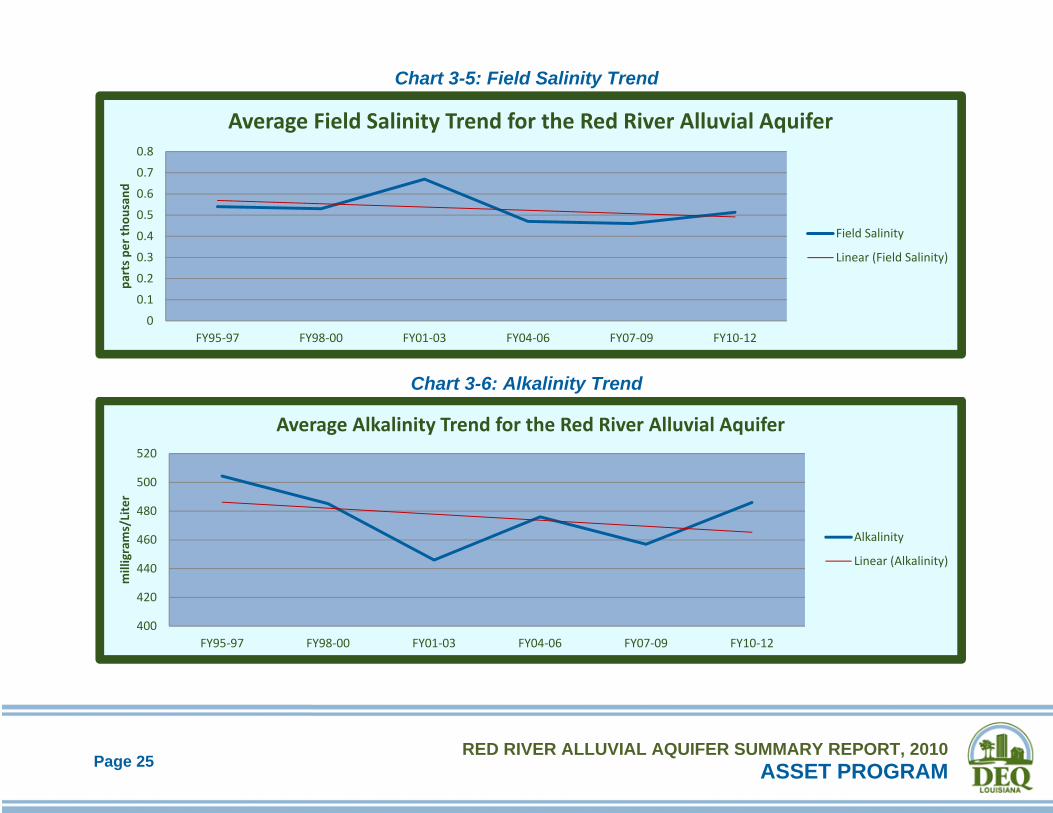
Chart 3-5: Field Salinity Trend ............................................................................................................ 25
Page 3
RED RIVER ALLUVIAL AQUIFER SUMMARY REPORT, 2010ASSET PROGRAM
Chart 3-6: Alkalinity Trend ................................................................................................................... 25
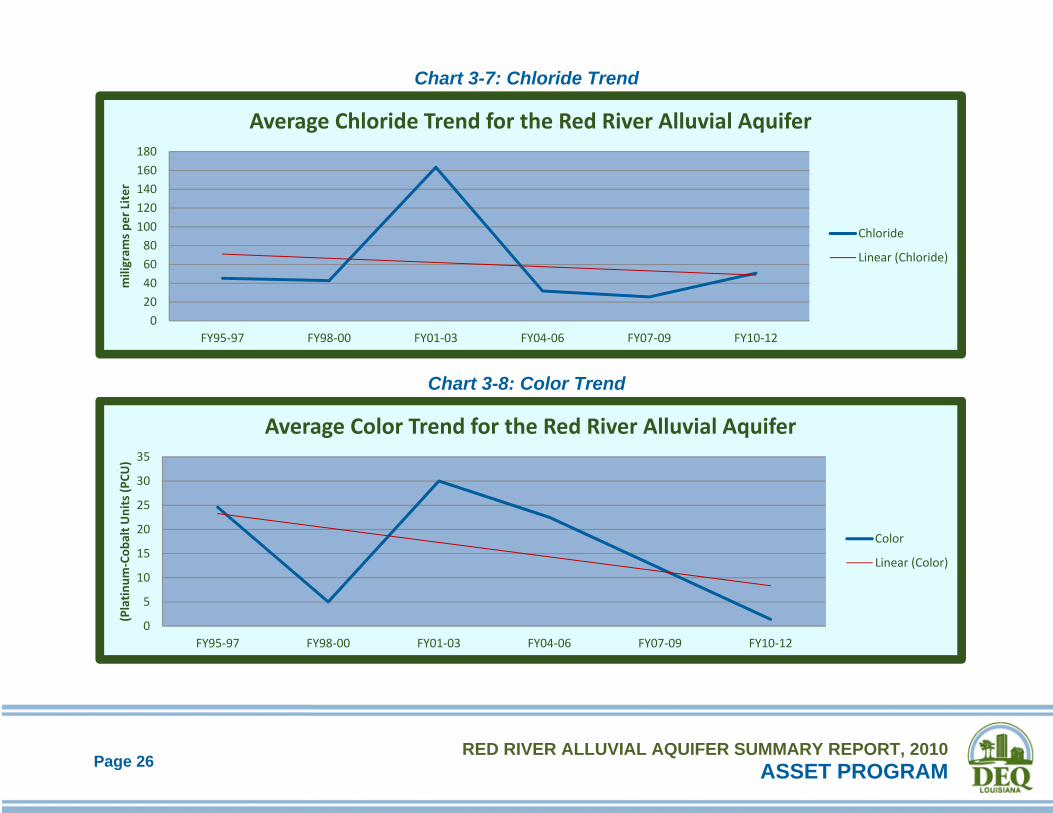
Chart 3-7: Chloride Trend ................................................................................................................... 26
Chart 3-8: Color Trend ........................................................................................................................ 26
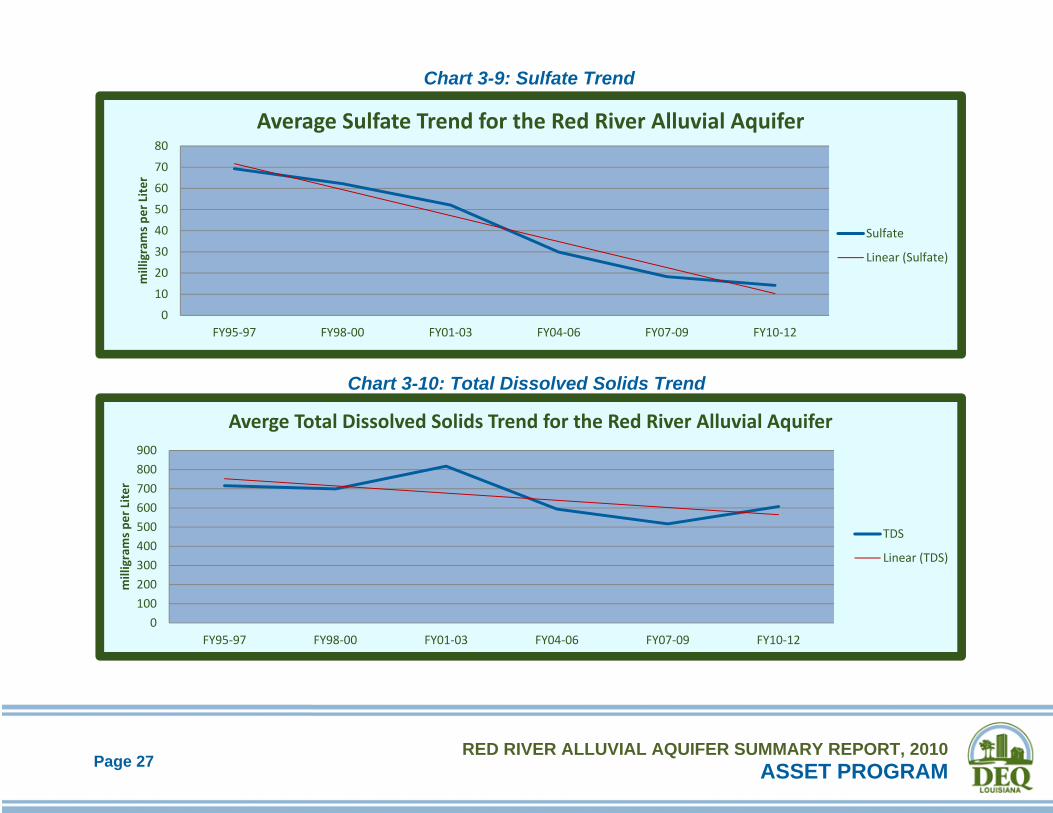
Chart 3-9: Sulfate Trend ...................................................................................................................... 27
Chart 3-10: Total Dissolved Solids Trend ........................................................................................... 27
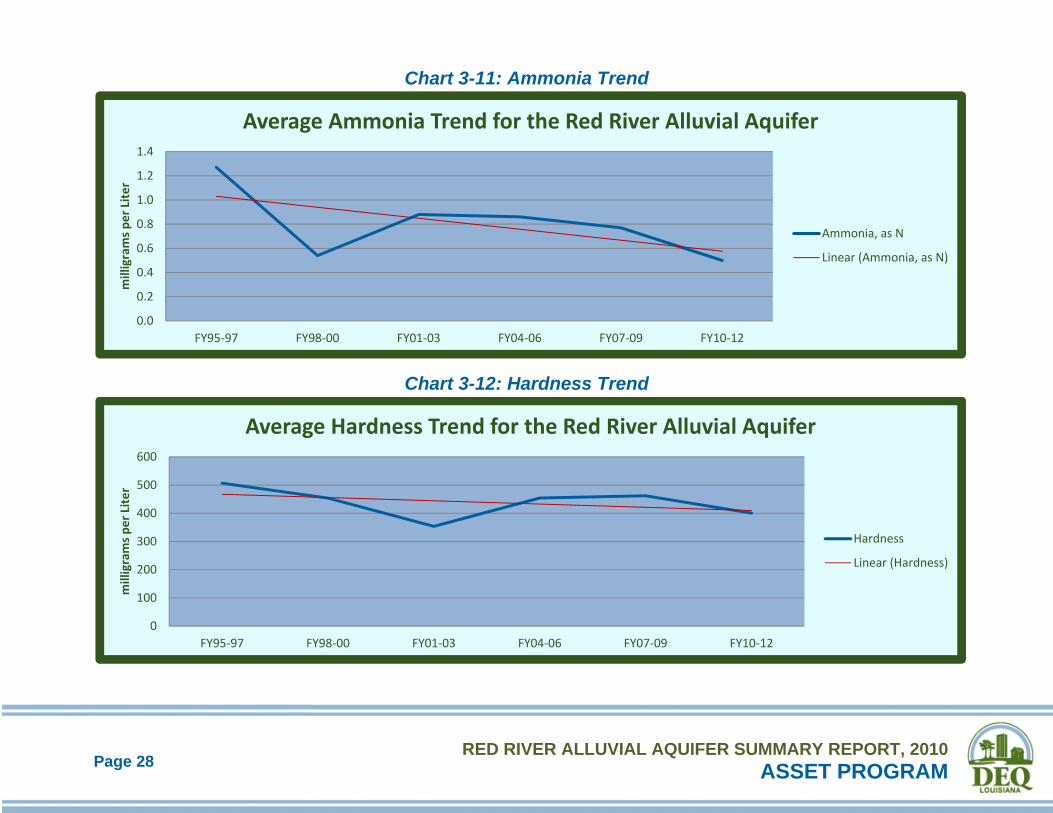
Chart 3-11: Ammonia Trend ................................................................................................................ 28
Chart 3-12: Hardness Trend ............................................................................................................... 28
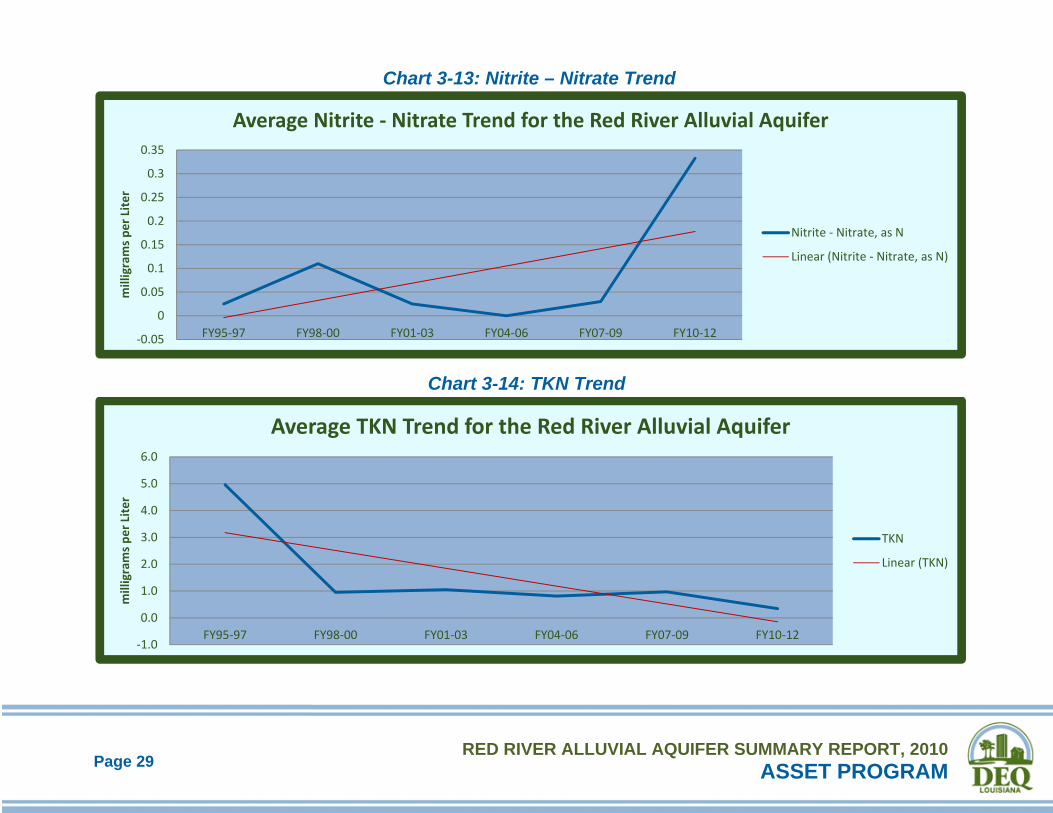
Chart 3-13: Nitrite – Nitrate Trend ....................................................................................................... 29
Chart 3-14: TKN Trend ........................................................................................................................ 29
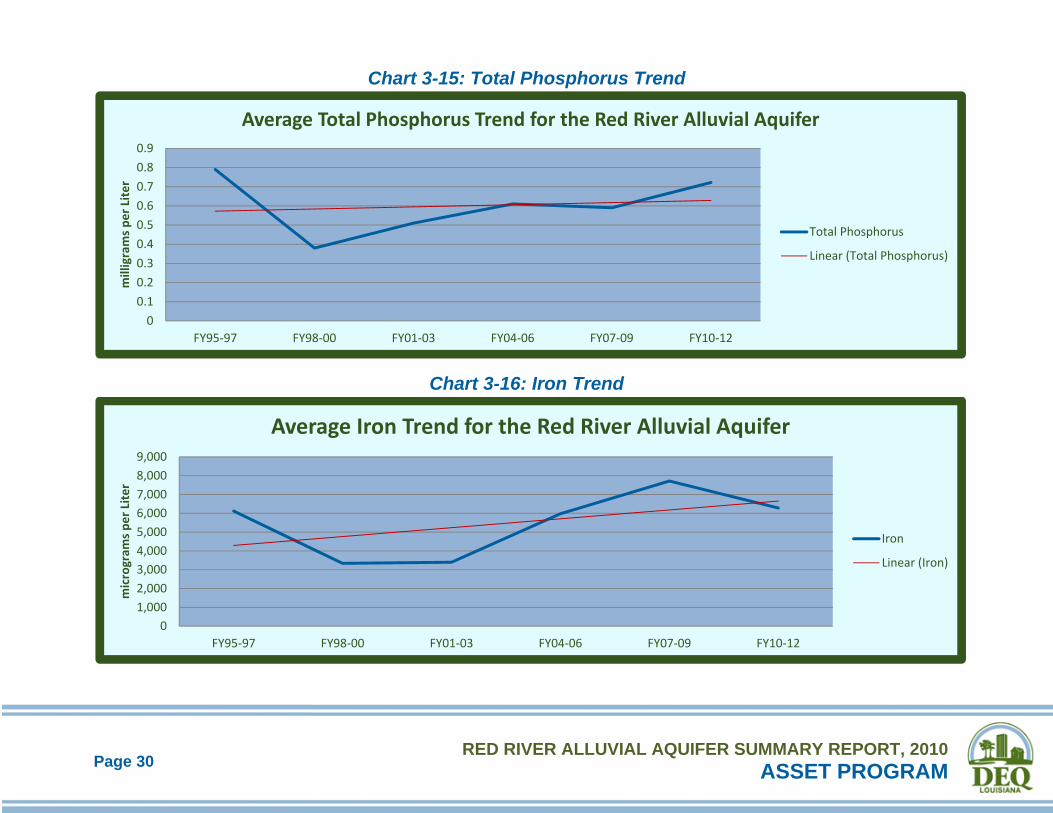
Chart 3-15: Total Phosphorus Trend .................................................................................................. 30
Chart 3-16: Iron Trend ......................................................................................................................... 30
Page 4
RED RIVER ALLUVIAL AQUIFER SUMMARY REPORT, 2010ASSET PROGRAM
BACKGROUND
The Louisiana Department of Environmental Quality's (LDEQ) Aquifer Sampling and Assessment Program (ASSET) is an ambient monitoring program established to determine and monitor the quality of groundwater produced from Louisiana's major freshwater aquifers. The ASSET Program samples approximately 200 water wells located in 14 aquifers and aquifer systems across the state. The sampling process is designed so that all fourteen aquifers and aquifer systems are monitored on a rotating basis, within a three-year period so that each well is monitored every three years.
In order to better assess the water quality of a particular aquifer, an attempt is made to sample all ASSET Program wells producing from it in a narrow time frame. To more conveniently and economically promulgate those data collected, a summary report on each aquifer is prepared separately. Collectively, these aquifer summaries will make up, in part, the ASSET Program's Triennial Summary Report for 2012.
Analytical and field data contained in this summary were collected from wells producing from the Red River Alluvial aquifer, during the 2010 state fiscal year (July 1, 2009 - June 30, 2010). This summary will become Appendix 3 of ASSET Program Triennial Summary Report for 2012.
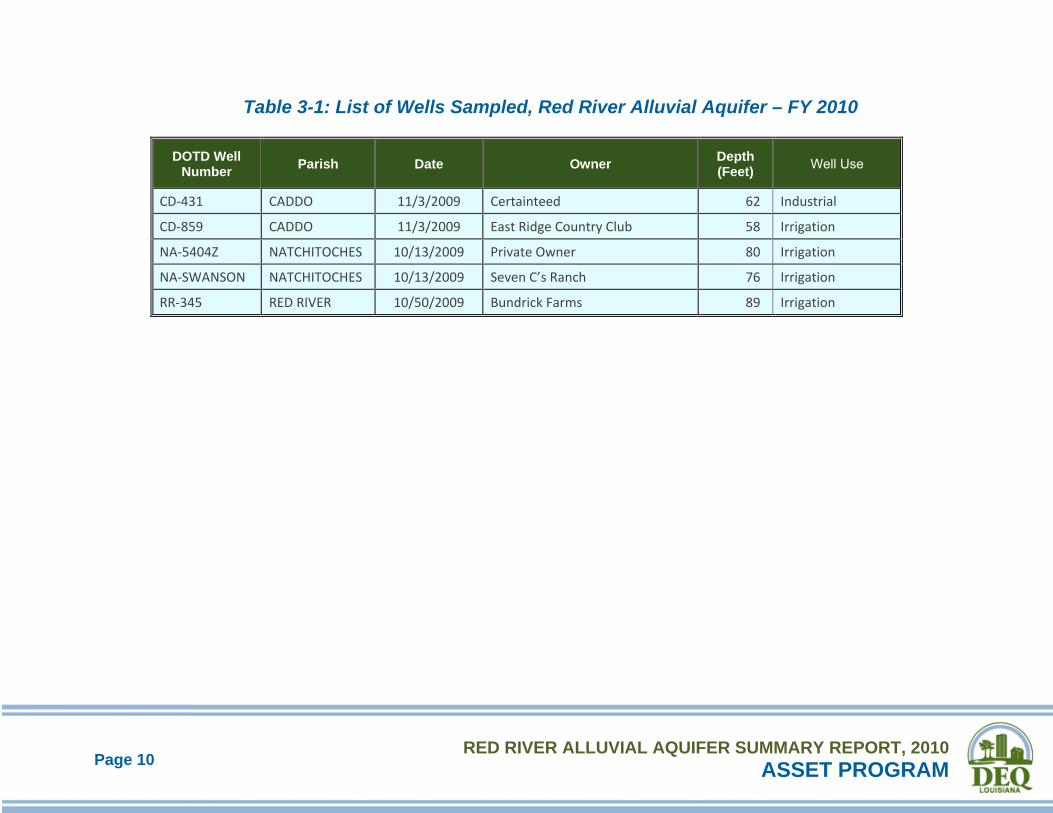
These data show that in October and November 2009, 5 wells were sampled which produce from the Red River Alluvial aquifer. Four of the 5 are classified as irrigation and 1 as domestic. The wells are located in 3 parishes along the Red River in northwest Louisiana.
Figure 3-1 shows the geographic locations of the Red River Alluvial aquifer and the associated wells, whereas Table 3-1 lists the wells in the aquifer along with their total depths, use made of produced waters, and date sampled.
Well data for registered water wells were obtained from the Louisiana Department of Transportation and Development’s Water Well Registration Data file.
GEOLOGY
Red River alluvium consists of fining upward sequences of gravel, sand, silt, and clay. The aquifer is poorly to moderately well sorted, with fine-grained to medium-grained sand near the top, grading to coarse sand and gravel in the lower portions. It is confined by layers of silt and clay of varying thicknesses and extent.
HYDROGEOLOGY
The Red River Alluvial aquifer is hydraulically connected with the Red River and its major streams. Recharge is accomplished by direct infiltration of rainfall in the river valley, lateral and upward movement of water from adjacent and underlying aquifers, and overbank stream flooding. The amount of recharge from rainfall depends on the thickness and permeability of the silt and clay layers overlying it. Water levels fluctuate seasonally in response to precipitation trends and river stages. Water levels are generally within 30 to 40 feet of the land surface and
Page 5
RED RIVER ALLUVIAL AQUIFER SUMMARY REPORT, 2010ASSET PROGRAM
movement is downgradient and toward rivers and streams. Natural discharge occurs by seepage of water into the Red River and its streams, but some water moves into the aquifer when stream stages are above aquifer water levels. The hydraulic conductivity varies between 10 and 530 feet/day.
The maximum depths of occurrence of freshwater in the Red River Alluvial range from 20 feet above sea level, to 160 feet below sea level. The range of thickness of the fresh water interval in the Red River Alluvial is 50 to 200 feet. The depths of the Red River Alluvial wells that were monitored in conjunction with the ASSET Program range from 58 to 89 feet.
PROGRAM PARAMETERS
The field parameters checked at each ASSET well sampling site and the list of conventional parameters analyzed in the laboratory are shown in Table 3-2. The inorganic (total metals) parameters analyzed in the laboratory are listed in Table 3-3. These tables also show the field and analytical results determined for each analyte. For quality control, a duplicate sample was taken for each parameter at well NA-SWANSON.
In addition to the field, conventional and inorganic analytical parameters, the target analyte list includes three other categories of compounds: volatiles, semi-volatiles, and pesticides/PCBs. Due to the large number of analytes in these categories, tables were not prepared showing the analytical results for these compounds. A discussion of any detections from any of these three categories, if necessary, can be found in their respective sections. Tables 3-8, 3-9 and 3-10 list the target analytes for volatiles, semi-volatiles and pesticides/PCBs, respectively.
Tables 3-4 and 3-5 provide a statistical overview of field and conventional data, and inorganic data for the Red River Alluvial aquifer, listing the minimum, maximum, and average results for these parameters collected in the FY 2010 sampling. Tables 3-6 and 3-7 compare these same parameter averages to historical ASSET-derived data for the Red River Alluvial aquifer, from fiscal years 1995, 1998, 2001, 2004, and 2007.
The average values listed in the above referenced tables are determined using all valid, reported results, including non-detects. Per Departmental policy concerning statistical analysis, one-half of the detection limit (DL) is used in place of zero when non-detects are encountered. However, the minimum value is reported as less than the DL, not one-half the DL. If all values for a particular analyte are reported as non-detect, then the minimum, maximum, and average values are all reported as less than the DL. For contouring purposes, one-half the DL is also used for non-detects in the figures and charts referenced below.
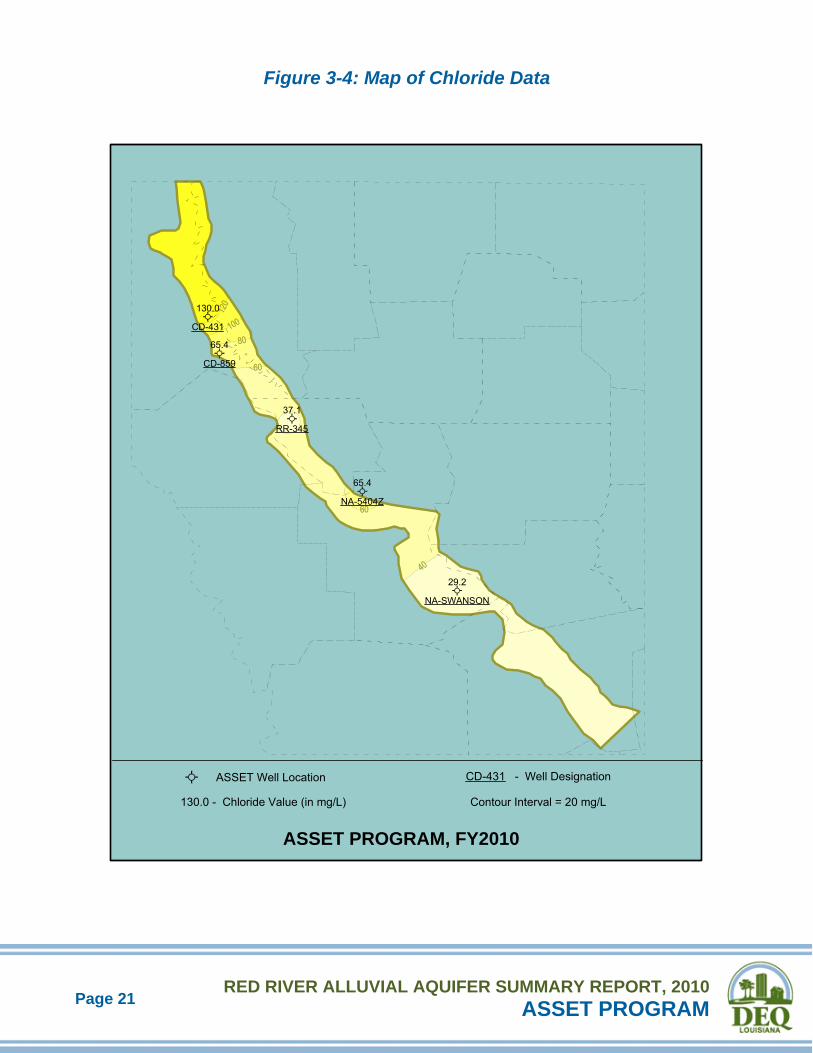
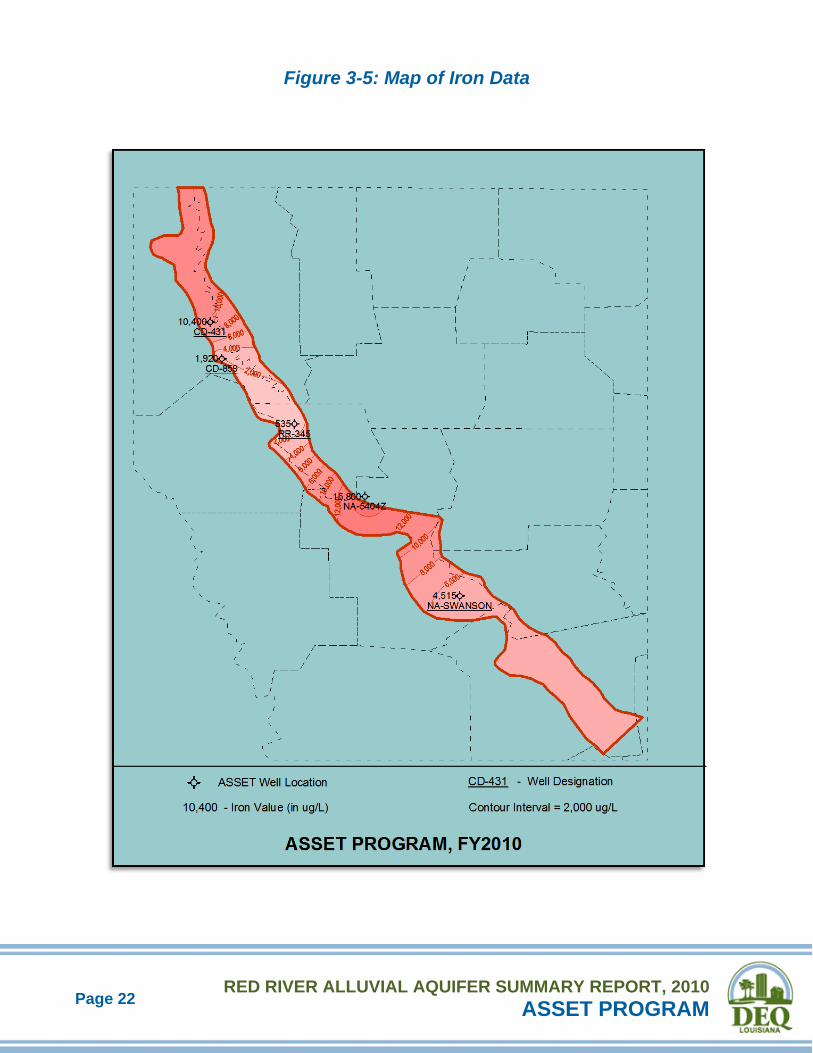
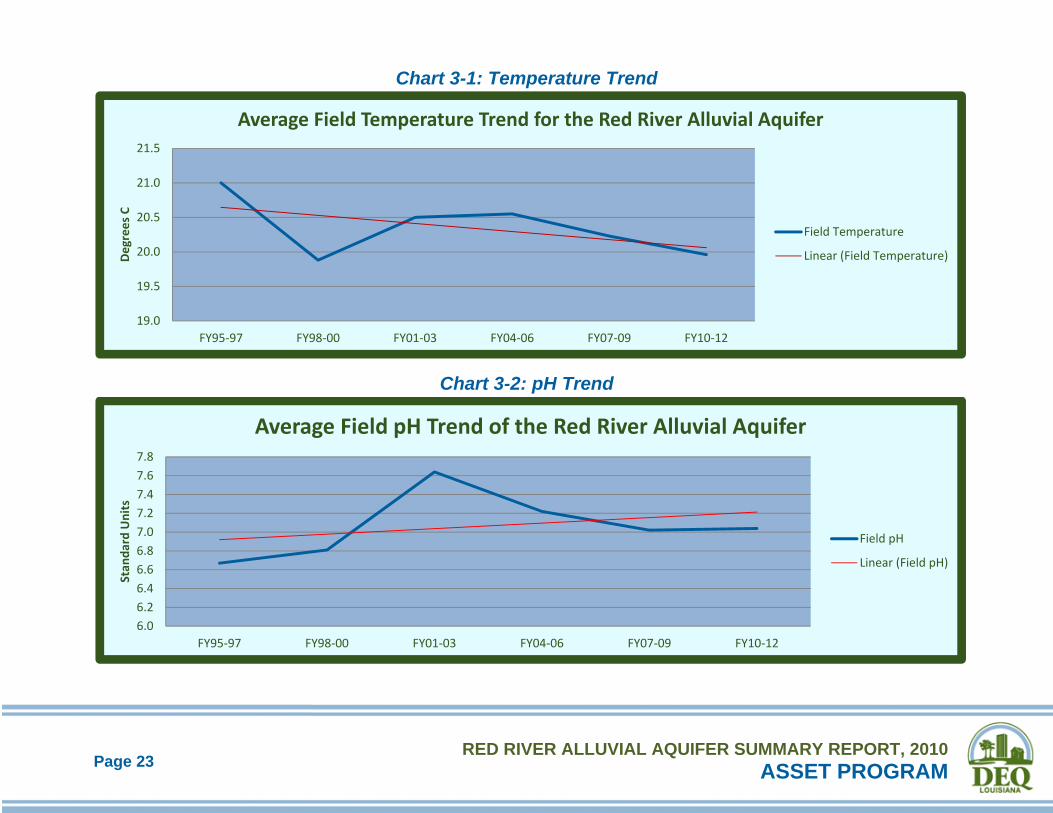
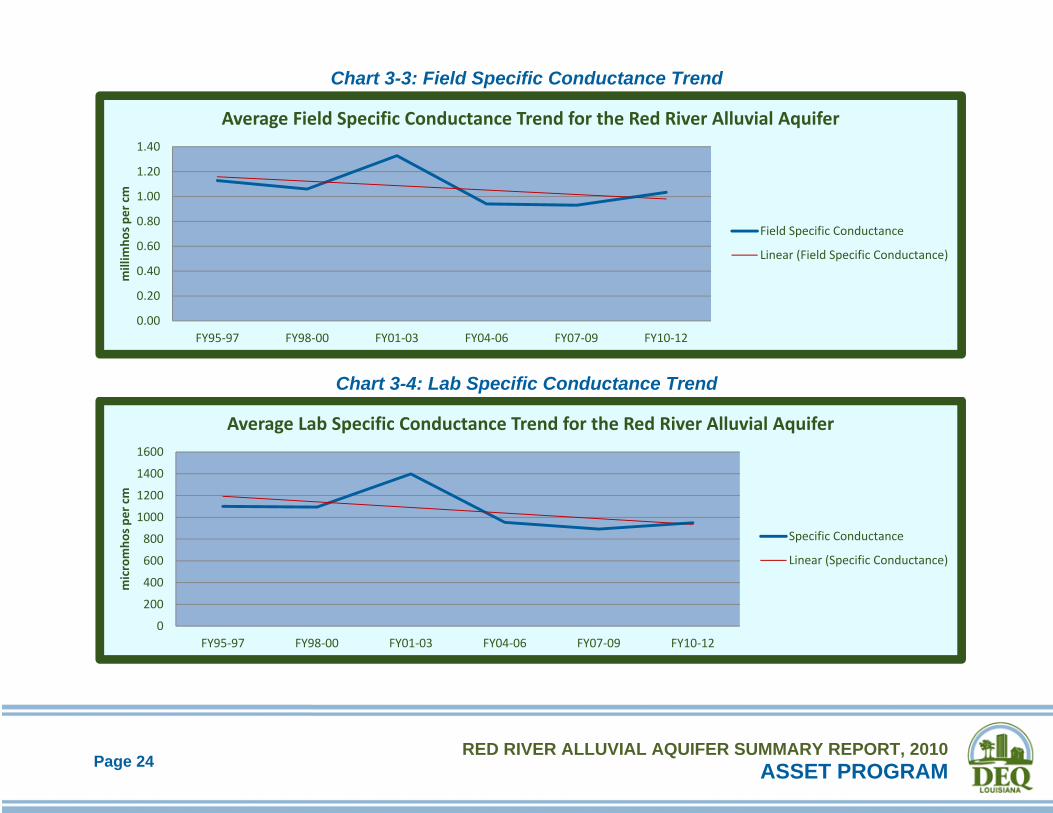
Figures 3-2, 3-3, 3-4, and 3-5 respectively, represent the contoured data for pH, total dissolved solids, chloride, and iron. Charts 3-1 through 3-16 represent the trend of the graphed parameter, based on the averaged value of that parameter for each three-year reporting period. Discussion of historical data and related trends is found in the Water Quality Trends and Comparison to Historical ASSET Data section.
Page 6
RED RIVER ALLUVIAL AQUIFER SUMMARY REPORT, 2010ASSET PROGRAM
INTERPRETATION OF DATA
Under the Federal Safe Drinking Water Act, EPA has established maximum contaminant levels (MCLs) for pollutants that may pose a health risk in public drinking water. An MCL is the highest level of a contaminant that EPA allows in public drinking water. MCLs ensure that drinking water does not pose either a short-term or long-term health risk. While not all wells sampled were public supply wells, the ASSET Program uses MCLs as a benchmark for further evaluation.
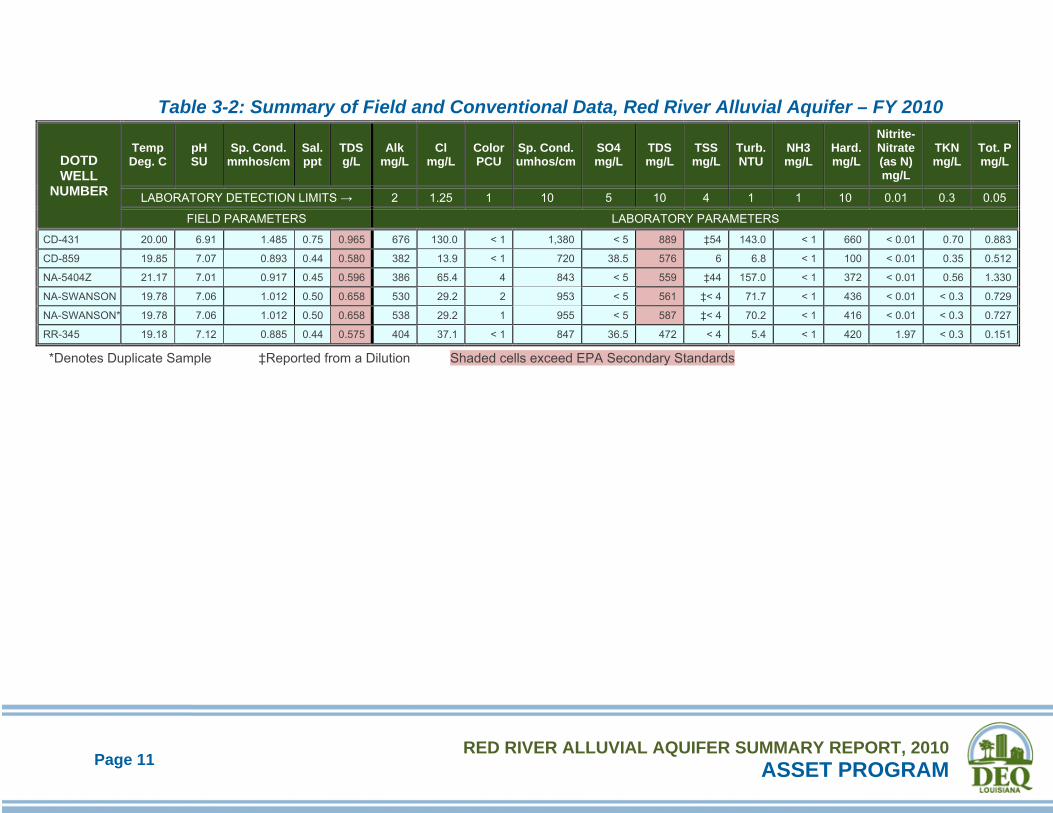
EPA has set Secondary MCLs (SMCLs), which are defined as non-enforceable taste, odor, or appearance guidelines. Field and laboratory data contained in Tables 3-2 and 3-3 show that one or more SMCLs were exceeded in all of the five wells sampled in the Red River Alluvial aquifer, with a total of nine SMCLs being exceeded.
Field and Conventional Parameters Table 3-2 shows the field and conventional parameters for which samples are collected at each well and the analytical results for those parameters. Table 3-4 provides an overview of this data for the Red River Alluvial aquifer, listing the minimum, maximum, and average results for these parameters.
Federal Primary Drinking Water Standards: A review of the analysis listed in Table 3-2 shows that no MCL was exceeded for field or conventional parameters for this reporting period. Those ASSET wells reporting turbidity levels greater than 1.0 NTU do not exceed the MCL of 1.0, as this standard applies to public supply water wells that are under the direct influence of surface water. The Louisiana Department of Health and Hospitals has determined that no public water supply well in Louisiana was in this category.
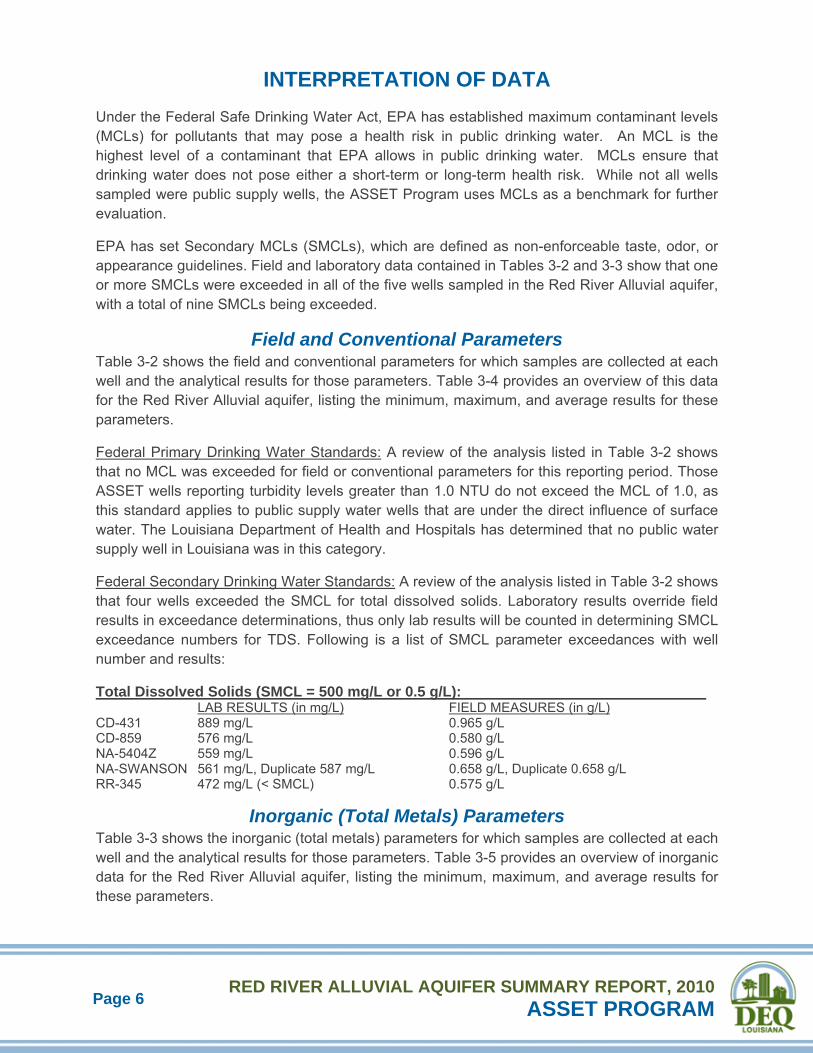
Federal Secondary Drinking Water Standards: A review of the analysis listed in Table 3-2 shows that four wells exceeded the SMCL for total dissolved solids. Laboratory results override field results in exceedance determinations, thus only lab results will be counted in determining SMCL exceedance numbers for TDS. Following is a list of SMCL parameter exceedances with well number and results:
Total Dissolved Solids (SMCL = 500 mg/L or 0.5 g/L): LAB RESULTS (in mg/L) FIELD MEASURES (in g/L) CD-431 889 mg/L 0.965 g/L CD-859 576 mg/L 0.580 g/L NA-5404Z 559 mg/L 0.596 g/L NA-SWANSON 561 mg/L, Duplicate 587 mg/L 0.658 g/L, Duplicate 0.658 g/L RR-345 472 mg/L (< SMCL) 0.575 g/L
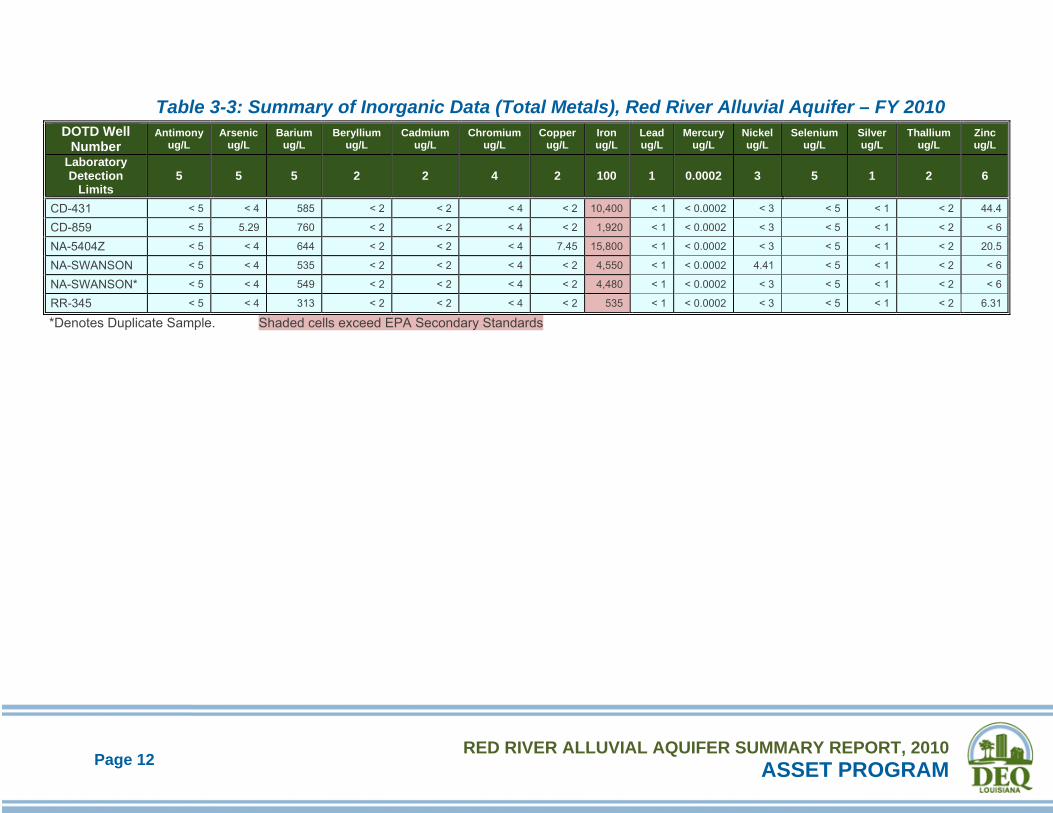
Inorganic (Total Metals) Parameters Table 3-3 shows the inorganic (total metals) parameters for which samples are collected at each well and the analytical results for those parameters. Table 3-5 provides an overview of inorganic data for the Red River Alluvial aquifer, listing the minimum, maximum, and average results for these parameters.
Page 7
RED RIVER ALLUVIAL AQUIFER SUMMARY REPORT, 2010ASSET PROGRAM
Federal Primary Drinking Water Standards: A review of the analyses listed on Table 3-3 shows that no primary MCL was exceeded for inorganics (total metals).
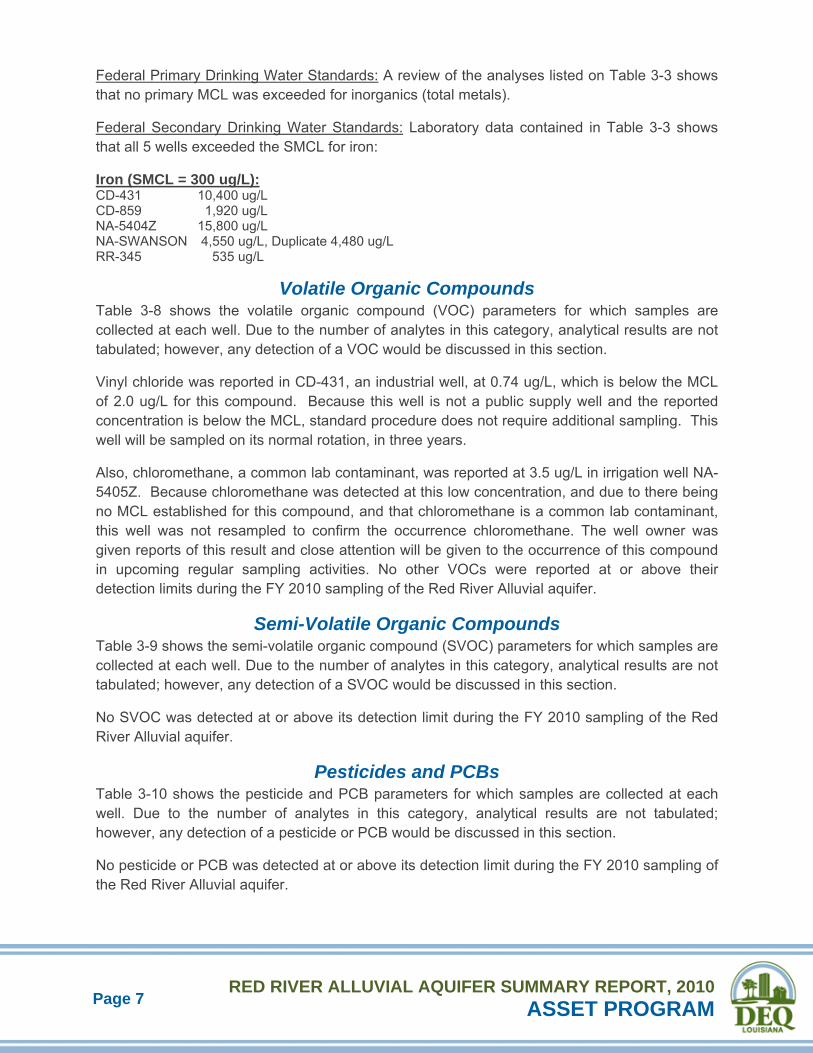
Federal Secondary Drinking Water Standards: Laboratory data contained in Table 3-3 shows that all 5 wells exceeded the SMCL for iron:
Iron (SMCL = 300 ug/L): CD-431 10,400 ug/L CD-859 1,920 ug/L NA-5404Z 15,800 ug/L NA-SWANSON 4,550 ug/L, Duplicate 4,480 ug/L RR-345 535 ug/L
Volatile Organic Compounds Table 3-8 shows the volatile organic compound (VOC) parameters for which samples are collected at each well. Due to the number of analytes in this category, analytical results are not tabulated; however, any detection of a VOC would be discussed in this section.
Vinyl chloride was reported in CD-431, an industrial well, at 0.74 ug/L, which is below the MCL of 2.0 ug/L for this compound. Because this well is not a public supply well and the reported concentration is below the MCL, standard procedure does not require additional sampling. This well will be sampled on its normal rotation, in three years.
Also, chloromethane, a common lab contaminant, was reported at 3.5 ug/L in irrigation well NA-5405Z. Because chloromethane was detected at this low concentration, and due to there being no MCL established for this compound, and that chloromethane is a common lab contaminant, this well was not resampled to confirm the occurrence chloromethane. The well owner was given reports of this result and close attention will be given to the occurrence of this compound in upcoming regular sampling activities. No other VOCs were reported at or above their detection limits during the FY 2010 sampling of the Red River Alluvial aquifer.
Semi-Volatile Organic Compounds Table 3-9 shows the semi-volatile organic compound (SVOC) parameters for which samples are collected at each well. Due to the number of analytes in this category, analytical results are not tabulated; however, any detection of a SVOC would be discussed in this section.
No SVOC was detected at or above its detection limit during the FY 2010 sampling of the Red River Alluvial aquifer.
Pesticides and PCBs Table 3-10 shows the pesticide and PCB parameters for which samples are collected at each well. Due to the number of analytes in this category, analytical results are not tabulated; however, any detection of a pesticide or PCB would be discussed in this section.
No pesticide or PCB was detected at or above its detection limit during the FY 2010 sampling of the Red River Alluvial aquifer.
Page 8
RED RIVER ALLUVIAL AQUIFER SUMMARY REPORT, 2010ASSET PROGRAM
WATER QUALITY TRENDS AND COMPARISON TO HISTORICAL ASSET DATA
Analytical and field data show that the quality and characteristics of groundwater produced from the Red River aquifer exhibit some changes when comparing current data to that of the five previous sampling rotations (three, six, nine, twelve, and fifteen years prior). These comparisons can be found in Tables 3-6 and 3-7, and in Charts 3-1 to 3-16 of this summary. Over the fifteen-year period, 4 analytes have shown a general increase in concentration. These analytes are pH, iron, turbidity, and to a lesser degree, nitrate-nitrite. For this same time period, 14 analytes have demonstrated a decrease in concentrations: temperature, field and lab specific conductance, salinity, alkalinity, chloride, color, sulfate, TDS, ammonia, hardness, TKN, copper, lead and zinc. All other analytes demonstrate only subtle fluctuations or have remained non-detect.
Current sample results show that all 5 wells reported one or more secondary exceedances with a total of 9 SMCL exceedances. The FY 2006 sampling of the Red River Alluvial aquifer shows that all 5 wells also reported one or more SMCL exceedances with a total of 8 exceedances.
Page 9
RED RIVER ALLUVIAL AQUIFER SUMMARY REPORT, 2010ASSET PROGRAM
SUMMARY AND RECOMMENDATIONS
In summary, the data show that the groundwater produced from this aquifer is very hard1 but is of good quality when considering short-term or long-term health risk guidelines. Laboratory data show that no program well that was sampled during the Fiscal Year 2010 monitoring of the Red River Alluvial aquifer exceeded a primary MCL. The data also show that this aquifer is of poorquality when considering taste, odor, or appearance guidelines, with at least one secondary MCL being exceeded in each of the wells monitored.
Comparison to historical ASSET-derived data shows some change in the quality or characteristics of the Red River Alluvial aquifer, with 4 parameters showing consistent increases in concentration and 14 parameters decreasing in concentration.
It is recommended that the wells assigned to the Red River Alluvial aquifer be re-sampled as planned in approximately three years. In addition, several wells should be added to those currently in place to increase the well density for this aquifer.
1 Classification based on hardness scale from: Peavy, H.S. et al. Environmental Engineering. New York: McGraw-Hill. 1985.
Page 10
RED RIVER ALLUVIAL AQUIFER SUMMARY REPORT, 2010ASSET PROGRAM
Table 3-1: List of Wells Sampled, Red River Alluvial Aquifer – FY 2010
DOTD Well Number
Parish Date Owner Depth (Feet)
Well Use
CD‐431 CADDO 11/3/2009 Certainteed 62 Industrial
CD‐859 CADDO 11/3/2009 East Ridge Country Club 58 Irrigation
NA‐5404Z NATCHITOCHES 10/13/2009 Private Owner 80 Irrigation
NA‐SWANSON NATCHITOCHES 10/13/2009 Seven C’s Ranch 76 Irrigation
RR‐345 RED RIVER 10/50/2009 Bundrick Farms 89 Irrigation
Page 11
RED RIVER ALLUVIAL AQUIFER SUMMARY REPORT, 2010ASSET PROGRAM
Table 3-2: Summary of Field and Conventional Data, Red River Alluvial Aquifer – FY 2010
DOTD WELL
NUMBER
Temp Deg. C
pH SU
Sp. Cond. mmhos/cm
Sal. ppt
TDS g/L
Alk mg/L
Cl mg/L
Color PCU
Sp. Cond. umhos/cm
SO4 mg/L
TDS mg/L
TSS mg/L
Turb. NTU
NH3 mg/L
Hard. mg/L
Nitrite- Nitrate (as N) mg/L
TKN mg/L
Tot. P mg/L
LABORATORY DETECTION LIMITS → 2 1.25 1 10 5 10 4 1 1 10 0.01 0.3 0.05
FIELD PARAMETERS LABORATORY PARAMETERS
CD-431 20.00 6.91 1.485 0.75 0.965 676 130.0 < 1 1,380 < 5 889 ‡54 143.0 < 1 660 < 0.01 0.70 0.883
CD-859 19.85 7.07 0.893 0.44 0.580 382 13.9 < 1 720 38.5 576 6 6.8 < 1 100 < 0.01 0.35 0.512
NA-5404Z 21.17 7.01 0.917 0.45 0.596 386 65.4 4 843 < 5 559 ‡44 157.0 < 1 372 < 0.01 0.56 1.330
NA-SWANSON 19.78 7.06 1.012 0.50 0.658 530 29.2 2 953 < 5 561 ‡< 4 71.7 < 1 436 < 0.01 < 0.3 0.729
NA-SWANSON* 19.78 7.06 1.012 0.50 0.658 538 29.2 1 955 < 5 587 ‡< 4 70.2 < 1 416 < 0.01 < 0.3 0.727
RR-345 19.18 7.12 0.885 0.44 0.575 404 37.1 < 1 847 36.5 472 < 4 5.4 < 1 420 1.97 < 0.3 0.151
*Denotes Duplicate Sample ‡Reported from a Dilution Shaded cells exceed EPA Secondary Standards
Page 12
RED RIVER ALLUVIAL AQUIFER SUMMARY REPORT, 2010ASSET PROGRAM
Table 3-3: Summary of Inorganic Data (Total Metals), Red River Alluvial Aquifer – FY 2010
*Denotes Duplicate Sample. Shaded cells exceed EPA Secondary Standards
DOTD Well Number
Antimony ug/L
Arsenic ug/L
Barium ug/L
Beryllium ug/L
Cadmium ug/L
Chromium ug/L
Copper ug/L
Iron ug/L
Lead ug/L
Mercury ug/L
Nickel ug/L
Selenium ug/L
Silver ug/L
Thallium ug/L
Zinc ug/L
Laboratory Detection
Limits 5 5 5 2 2 4 2 100 1 0.0002 3 5 1 2 6
CD-431 < 5 < 4 585 < 2 < 2 < 4 < 2 10,400 < 1 < 0.0002 < 3 < 5 < 1 < 2 44.4
CD-859 < 5 5.29 760 < 2 < 2 < 4 < 2 1,920 < 1 < 0.0002 < 3 < 5 < 1 < 2 < 6
NA-5404Z < 5 < 4 644 < 2 < 2 < 4 7.45 15,800 < 1 < 0.0002 < 3 < 5 < 1 < 2 20.5
NA-SWANSON < 5 < 4 535 < 2 < 2 < 4 < 2 4,550 < 1 < 0.0002 4.41 < 5 < 1 < 2 < 6
NA-SWANSON* < 5 < 4 549 < 2 < 2 < 4 < 2 4,480 < 1 < 0.0002 < 3 < 5 < 1 < 2 < 6
RR-345 < 5 < 4 313 < 2 < 2 < 4 < 2 535 < 1 < 0.0002 < 3 < 5 < 1 < 2 6.31
Page 13
RED RIVER ALLUVIAL AQUIFER SUMMARY REPORT, 2010ASSET PROGRAM
Table 3-4: FY 2010 Field and Conventional Statistics, ASSET Wells
Table 3-5: FY 2010 Inorganic (Total Metals) Statistics, ASSET Wells
PARAMETER MINIMUM MAXIMUM AVERAGE
Antimony (ug/L) < 5 < 5 < 5
Arsenic (ug/L) < 4 5.29 <4
Barium (ug/L) 313 760 564
Beryllium (ug/L) < 2 < 2 < 2
Cadmium (ug/L) < 2 < 2 < 2
Chromium (ug/L) < 4 < 4 < 4
Copper (ug/L) < 2 7.5 2.1
Iron (ug/L) 535 15,800 6,281
Lead (ug/L) < 1 < 1 < 1
Mercury (ug/L) < 0.0002 < 0.0002 < 0.0002
Nickel (ug/L) < 3 4.4 < 3
Selenium (ug/L) < 5 < 5 < 5
Silver (ug/L) < 1 < 1 < 1
Thallium (ug/L) < 2 < 2 < 2
Zinc (ug/L) < 6 44.4 13.4
PARAMETER MINIMUM MAXIMUM AVERAGE
FIE
LD
Temperature (OC) 19.18 21.17 19.96
pH (SU) 6.91 7.12 7.04
Specific Conductance (mmhos/cm) 0.885 1.485 1.034
Salinity (ppt) 0.44 0.75 0.51
TDS (g/L) 0.575 0.965 0.670
LA
BO
RA
TO
RY
Alkalinity (mg/L) 382 676 486
Chloride (mg/L) 13.9 130.0 50.8
Color < 1 4.0 1.4
Specific Conductance (umhos/cm) 720 1,380 950
Sulfate (mg/L) < 5 38.5 14.2
TDS (mg/L) 472 889 607
TSS (mg/L) < 4 54.0 18.3
Turbidity (NTU) 5.4 157.0 75.7
Ammonia, as N (mg/L) < 1 < 1 < 1
Hardness (mg/L) 100 660 401
Nitrite - Nitrate, as N (mg/L) < 0.01 1.97 0.33
TKN (mg/L) < 0.3 0.70 0.34
Total Phosphorus (mg/L) 0.15 1.33 0.72
Page 14
RED RIVER ALLUVIAL AQUIFER SUMMARY REPORT, 2010ASSET PROGRAM
Table 3-6: Triennial Field and Conventional Statistics, ASSET Wells
Table 3-7: Triennial Inorganic (Total Metals) Statistics, ASSET Wells
PARAMETER AVERAGE VALUES BY FISCAL YEAR
FY 1995 FY 1998 FY 2001 FY 2004 FY 2007 FY 2010
Antimony (ug/L) <5 <5 <5 <5 <1 < 5
Arsenic (ug/L) <10 <5 <5 <5 <3 <4
Barium (ug/L) 401 102 219 387 461 564
Beryllium (ug/L) <5 <5 <1 <1 <1 < 2
Cadmium (ug/L) <5 <5 1.0 <1 <0.5 < 2
Chromium (ug/L) 12.4 <5 <5 <5 <3 < 4
Copper (ug/L) 19.9 968.7 <5.0 10.3 <3.0 2.1
Iron (ug/L) 6,122 3,340 3,396 5,977 7,717 6,281
Lead (ug/L) 32.0 <10 <10 14.0 <3 < 1
Mercury (ug/L) <0.05 <0.05 <0.05 <0.05 <0.05 < 0.0002
Nickel (ug/L) 10.4 1,041.4 <5 <5 <3 < 3
Selenium (ug/L) <5 <5 <5 <5 <4 < 5
Silver (ug/L) <5 <5 1.1 <1 <0.5 < 1
Thallium (ug/L) <5 <5 <2 <5 <1 < 2
Zinc (ug/L) 185.6 <10.0 41.7 65.5 490.0 13.4
PARAMETER AVERAGE VALUES BY FISCAL YEAR
FY 1995 FY 1998 FY 2001 FY 2004 FY 2007 FY 2010 F
IEL
D
Temperature (OC) 21.00 19.88 20.50 20.55 20.23 19.96
pH (SU) 6.67 6.81 7.64 7.22 7.02 7.04
Specific Conductance (mmhos/cm) 1.128 1.060 1.328 0.940 0.930 1.034
Salinity (Sal.) (ppt) 0.54 0.53 0.67 0.47 0.46 0.51
TDS (Total dissolved solids) (g/L) - - - 0.610 0.610 0.670
LA
BO
RA
TO
RY
Alkalinity (Alk.) (mg/L) 504.4 485.2 446.0 476.0 457.0 486
Chloride (Cl) (mg/L) 45.3 42.8 163.4 31.8 25.5 50.8
Color (PCU) 24.6 5.0 30.0 22.5 - 1.4
Specific Conductance (umhos/cm) 1100 1094 1398 953 892 950
Sulfate (SO4) ( mg/L) 69.3 62.2 52.1 29.9 18.3 14.2
TDS (Total dissolved solids) (mg/L) 716 699 818 594 517 607
TSS (Total suspended solids) (mg/L) 18.8 13.6 12.5 17.1 16.4 18.3
Turbidity (Turb.) (NTU) 56.0 54.4 44.7 68.3 73.6 75.7
Ammonia, as N (NH3) (mg/L) 1.27 0.54 0.88 0.86 0.77 < 1
Hardness (mg/L) 507 454 354 454 462 401
Nitrite - Nitrate , as N (mg/L) <0.05 0.11 <0.05 <0.05 <0.05 0.33
TKN (mg/L) 4.96 0.95 1.05 0.81 0.97 0.34
Total Phosphorus (P) (mg/L) 0.79 0.38 0.51 0.61 0.59 0.72
Page 15
RED RIVER ALLUVIAL AQUIFER SUMMARY REPORT, 2010ASSET PROGRAM
Table 3-8: VOC Analytical Parameters
COMPOUND METHOD DETECTION LIMIT
(ug/L)
ETHYL BENZENE 624 0.5
CIS-1,3-DICHLOROPROPENE 624 0.5
TRANS-1,3-DICHLOROPROPENE 624 0.5
1,4-DICHLOROBENZENE 624 0.5
1,2-DICHLOROETHANE 624 0.5
TOLUENE 624 0.5
CHLOROBENZENE 624 0.5
DIBROMOCHLOROMETHANE 624 0.5
TETRACHLOROETHYLENE (PCE) 624 0.5
TRANS-1,2-DICHLOROETHENE 624 0.5
TERT-BUTYL METHYL ETHER 624 0.5
1,3-DICHLOROBENZENE 624 0.5
CARBON TETRACHLORIDE 624 0.5
CHLOROFORM 624 0.5
BENZENE 624 0.5
1,1,1-TRICHLOROETHANE 624 0.5
BROMOMETHANE 624 0.5
CHLOROMETHANE 624 0.5
CHLOROETHANE 624 0.5
VINYL CHLORIDE 624 0.5
METHYLENE CHLORIDE 624 0.5
BROMOFORM 624 0.5
BROMODICHLOROMETHANE 624 0.5
1,1-DICHLOROETHANE 624 0.5
1,1-DICHLOROETHENE 624 0.5
TRICHLOROFLUOROMETHANE (FREON-11)
624 0.5
1,2-DICHLOROPROPANE 624 0.5
1,1,2-TRICHLOROETHANE 624 0.5
TRICHLOROETHYLENE (TCE) 624 0.5
1,1,2,2-TETRACHLOROETHANE 624 0.5
1,2,3-TRICHLOROBENZENE 624 0.5
1,2-DICHLOROBENZENE 624 0.5
ETHYL BENZENE 624 0.5
CIS-1,3-DICHLOROPROPENE 624 0.5
Page 16
RED RIVER ALLUVIAL AQUIFER SUMMARY REPORT, 2010ASSET PROGRAM
Table 3-9: SVOC Analytical Parameters
COMPOUND METHOD DETECTION LIMIT
(ug/L)
1,2,4-TRICHLOROBENZENE 625 5
2,4,6-TRICHLOROPHENOL 625 5
2,4-DICHLOROPHENOL 625 5
2,4-DIMETHYLPHENOL 625 5
2,4-DINITROPHENOL 625 20
2,4-DINITROTOLUENE 625 5
2,6-DINITROTOLUENE 625 5
2-CHLORONAPHTHALENE 625 5
2-CHLOROPHENOL 625 5
2-NITROPHENOL 625 10
3,3'-DICHLOROBENZIDINE 625 5
4,6-DINITRO-2-METHYLPHENOL 625 10
4-BROMOPHENYL PHENYL ETHER 625 5
4-CHLORO-3-METHYLPHENOL 625 5
4-CHLOROPHENYL PHENYL ETHER 625 5
4-NITROPHENOL 625 20
ACENAPHTHENE 625 5
ACENAPHTHYLENE 625 5
ANTHRACENE 625 5
BENZIDINE 625 20
BENZO(A)ANTHRACENE 625 5
BENZO(A)PYRENE 625 5
BENZO(B)FLUORANTHENE 625 5
BENZO(G,H,I)PERYLENE 625 5
BENZO(K)FLUORANTHENE 625 5
BENZYL BUTYL PHTHALATE 625 5
BIS(2-CHLOROETHOXY) METHANE 625 5
HEXACHLOROCYCLOPENTADIENE 625 5
HEXACHLOROETHANE 625 5
INDENO(1,2,3-C,D)PYRENE 625 5
ISOPHORONE 625 5
NAPHTHALENE 625 5
NITROBENZENE 625 5
N-NITROSODIMETHYLAMINE 625 5
N-NITROSODI-N-PROPYLAMINE 625 5
N-NITROSODIPHENYLAMINE 625 5
Page 17
RED RIVER ALLUVIAL AQUIFER SUMMARY REPORT, 2010ASSET PROGRAM
Table 3-9: SVOCs (Continued)
COMPOUND METHOD DETECTION LIMIT
(ug/L)
PENTACHLOROBENZENE 625 5
PENTACHLOROPHENOL 625 10
PHENANTHRENE 625 5
PHENOL 625 5
PYRENE 625 5
TETRACHLOROBENZENE(S), TOTAL 625 10
Table 3-10: Pesticides and PCBs
COMPOUND METHOD DETECTION LIMITS
(ug/L)
4,4'-DDD 8081 0.1
4,4'-DDE 8081 0.1
4,4'-DDT 8081 0.1
Aldrin 8081 0.05
Alpha-Chlordane 8081 0.05
alpha-BHC 8081 0.05
beta-BHC 8081 0.05
delta-BHC 8081 0.05
gamma-BHC 8081 0.05
Dieldrin 8081 0.1
Endosulfan I 8081 0.05
Endosulfan II 8081 0.1
Endosulfan Sulfate 8081 0.1
Endrin 8081 0.1
Endrin Aldehyde 8081 0.1
Endrin Ketone 8081 0.1
Heptachlor 8081 0.05
Heptachlor Epoxide 8081 0.05
Methoxychlor 8081 0.5
Toxaphene 8081 2
Gamma-Chlordane 8081 0.05
PCB-1016 8082 1
PCB-1221 8082 1
PCB-1232 8082 1
PCB-1242 8082 1
PCB-1248 8082 1
PCB-1254 8082 1
PCB-1260 8082 1
Page 18
RED RIVER ALLUVIAL AQUIFER SUMMARY REPORT, 2010ASSET PROGRAM
Figure 3-1: Location Plat, Red River Alluvial Aquifer
Page 19
RED RIVER ALLUVIAL AQUIFER SUMMARY REPORT, 2010ASSET PROGRAM
Figure 3-2: Map of pH Data
NA-SWANSON
RR-345
CD-431
CD-859
NA-5404Z
7.06
7.12
6.91
7.07
7.01
ASSET PROGRAM, FY2010
6.91 - pH Value (in Standard Units) Contour Interval = 0.1 SU
- Well DesignationCD-431ASSET Well Location
Page 20
RED RIVER ALLUVIAL AQUIFER SUMMARY REPORT, 2010ASSET PROGRAM
Figure 3-3: Map of TDS Lab Data
NA-SWANSON
RR-345
CD-431
CD-859
NA-5404Z
574
472
889
576
559
ASSET PROGRAM, FY2010
502 - TDS Value (in mg/L) Contour Interval = 50 mg/L
- Well DesignationCD-431ASSET Well Location
Page 21
RED RIVER ALLUVIAL AQUIFER SUMMARY REPORT, 2010ASSET PROGRAM
Figure 3-4: Map of Chloride Data
NA-SWANSON
RR-345
CD-431
CD-859
NA-5404Z
29.2
37.1
130.0
65.4
65.4
ASSET PROGRAM, FY2010
130.0 - Chloride Value (in mg/L) Contour Interval = 20 mg/L
- Well DesignationCD-431ASSET Well Location
Page 22
RED RIVER ALLUVIAL AQUIFER SUMMARY REPORT, 2010ASSET PROGRAM
Figure 3-5: Map of Iron Data
RED RIVER ALLUVIAL AQUIFER SUMMARY REPORT, 2010ASSET PROGRAMPage 23
Chart 3-1: Temperature Trend
Chart 3-2: pH Trend
19.0
19.5
20.0
20.5
21.0
21.5
FY95‐97 FY98‐00 FY01‐03 FY04‐06 FY07‐09 FY10‐12
Degrees C
Average Field Temperature Trend for the Red River Alluvial Aquifer
Field Temperature
Linear (Field Temperature)
6.0
6.2
6.4
6.6
6.8
7.0
7.2
7.4
7.6
7.8
FY95‐97 FY98‐00 FY01‐03 FY04‐06 FY07‐09 FY10‐12
Stan
dard Units
Average Field pH Trend of the Red River Alluvial Aquifer
Field pH
Linear (Field pH)
RED RIVER ALLUVIAL AQUIFER SUMMARY REPORT, 2010ASSET PROGRAMPage 24
Chart 3-3: Field Specific Conductance Trend
Chart 3-4: Lab Specific Conductance Trend
0.00
0.20
0.40
0.60
0.80
1.00
1.20
1.40
FY95‐97 FY98‐00 FY01‐03 FY04‐06 FY07‐09 FY10‐12
millim
hos p
er cm
Average Field Specific Conductance Trend for the Red River Alluvial Aquifer
Field Specific Conductance
Linear (Field Specific Conductance)
0
200
400
600
800
1000
1200
1400
1600
FY95‐97 FY98‐00 FY01‐03 FY04‐06 FY07‐09 FY10‐12
micromho
s per cm
Average Lab Specific Conductance Trend for the Red River Alluvial Aquifer
Specific Conductance
Linear (Specific Conductance)
RED RIVER ALLUVIAL AQUIFER SUMMARY REPORT, 2010ASSET PROGRAMPage 25
Chart 3-5: Field Salinity Trend
Chart 3-6: Alkalinity Trend
0
0.1
0.2
0.3
0.4
0.5
0.6
0.7
0.8
FY95‐97 FY98‐00 FY01‐03 FY04‐06 FY07‐09 FY10‐12
parts p
er th
ousand
Average Field Salinity Trend for the Red River Alluvial Aquifer
Field Salinity
Linear (Field Salinity)
400
420
440
460
480
500
520
FY95‐97 FY98‐00 FY01‐03 FY04‐06 FY07‐09 FY10‐12
milligrams/Liter
Average Alkalinity Trend for the Red River Alluvial Aquifer
Alkalinity
Linear (Alkalinity)
RED RIVER ALLUVIAL AQUIFER SUMMARY REPORT, 2010ASSET PROGRAMPage 26
Chart 3-7: Chloride Trend
Chart 3-8: Color Trend
0
20
40
60
80
100
120
140
160
180
FY95‐97 FY98‐00 FY01‐03 FY04‐06 FY07‐09 FY10‐12
miligram
s per Lite
rAverage Chloride Trend for the Red River Alluvial Aquifer
Chloride
Linear (Chloride)
0
5
10
15
20
25
30
35
FY95‐97 FY98‐00 FY01‐03 FY04‐06 FY07‐09 FY10‐12
(Platin
um‐Cob
alt U
nits (P
CU)
Average Color Trend for the Red River Alluvial Aquifer
Color
Linear (Color)
RED RIVER ALLUVIAL AQUIFER SUMMARY REPORT, 2010ASSET PROGRAMPage 27
Chart 3-9: Sulfate Trend
Chart 3-10: Total Dissolved Solids Trend
0
10
20
30
40
50
60
70
80
FY95‐97 FY98‐00 FY01‐03 FY04‐06 FY07‐09 FY10‐12
milligrams p
er Lite
rAverage Sulfate Trend for the Red River Alluvial Aquifer
Sulfate
Linear (Sulfate)
0
100
200
300
400
500
600
700
800
900
FY95‐97 FY98‐00 FY01‐03 FY04‐06 FY07‐09 FY10‐12
milligrams p
er Lite
r
Averge Total Dissolved Solids Trend for the Red River Alluvial Aquifer
TDS
Linear (TDS)
RED RIVER ALLUVIAL AQUIFER SUMMARY REPORT, 2010ASSET PROGRAMPage 28
Chart 3-11: Ammonia Trend
Chart 3-12: Hardness Trend
0.0
0.2
0.4
0.6
0.8
1.0
1.2
1.4
FY95‐97 FY98‐00 FY01‐03 FY04‐06 FY07‐09 FY10‐12
milligrams p
er Lite
rAverage Ammonia Trend for the Red River Alluvial Aquifer
Ammonia, as N
Linear (Ammonia, as N)
0
100
200
300
400
500
600
FY95‐97 FY98‐00 FY01‐03 FY04‐06 FY07‐09 FY10‐12
milligrams p
er Lite
r
Average Hardness Trend for the Red River Alluvial Aquifer
Hardness
Linear (Hardness)
RED RIVER ALLUVIAL AQUIFER SUMMARY REPORT, 2010ASSET PROGRAMPage 29
Chart 3-13: Nitrite – Nitrate Trend
Chart 3-14: TKN Trend
‐0.05
0
0.05
0.1
0.15
0.2
0.25
0.3
0.35
FY95‐97 FY98‐00 FY01‐03 FY04‐06 FY07‐09 FY10‐12
milligrams p
er Lite
rAverage Nitrite ‐ Nitrate Trend for the Red River Alluvial Aquifer
Nitrite ‐ Nitrate, as N
Linear (Nitrite ‐ Nitrate, as N)
‐1.0
0.0
1.0
2.0
3.0
4.0
5.0
6.0
FY95‐97 FY98‐00 FY01‐03 FY04‐06 FY07‐09 FY10‐12
milligrams p
er Lite
r
Average TKN Trend for the Red River Alluvial Aquifer
TKN
Linear (TKN)
RED RIVER ALLUVIAL AQUIFER SUMMARY REPORT, 2010ASSET PROGRAMPage 30
Chart 3-15: Total Phosphorus Trend
Chart 3-16: Iron Trend
0
0.1
0.2
0.3
0.4
0.5
0.6
0.7
0.8
0.9
FY95‐97 FY98‐00 FY01‐03 FY04‐06 FY07‐09 FY10‐12
milligrams p
er Lite
rAverage Total Phosphorus Trend for the Red River Alluvial Aquifer
Total Phosphorus
Linear (Total Phosphorus)
0
1,000
2,000
3,000
4,000
5,000
6,000
7,000
8,000
9,000
FY95‐97 FY98‐00 FY01‐03 FY04‐06 FY07‐09 FY10‐12
microgram
s per Lite
r
Average Iron Trend for the Red River Alluvial Aquifer
Iron
Linear (Iron)


