The Astrophysical Journal, 764:115 (11pp), 2013 February 20 doi:10.1088/0004-637X/764/2/115 C 2013. The American Astronomical Society. All rights reserved. Printed in the U.S.A. RED SUPERGIANT STARS AS COSMIC ABUNDANCE PROBES. II. NLTE EFFECTS IN J-BAND SILICON LINES Maria Bergemann 1 , Rolf-Peter Kudritzki 1 ,2 ,5 , Matthias W ¨ url 1 , Bertrand Plez 3 , Ben Davies 4 , and Zach Gazak 2 1 Max-Planck-Institute for Astrophysics, Karl-Schwarzschild-Str.1, D-85741 Garching, Germany; [email protected], [email protected]2 Institute for Astronomy, University of Hawaii, 2680 Woodlawn Drive, Honolulu, HI 96822, USA; [email protected], [email protected]3 Laboratoire Univers et Particules de Montpellier, Universit´ e Montpellier 2, CNRS, F-34095 Montpellier, France; [email protected]4 Institute of Astronomy, University of Cambridge, Madingley Road, Cambridge, CB3 OHA, UK; [email protected]Received 2012 October 15; accepted 2012 December 10; published 2013 January 30 ABSTRACT Medium-resolution J-band spectroscopy of individual red supergiant stars is a promising tool to investigate the chemical composition of the young stellar population in star-forming galaxies. As a continuation of recent work on iron and titanium, detailed non-LTE (NLTE) calculations are presented to investigate the influence of NLTE on the formation of silicon lines in the J-band spectra of red supergiants. Substantial effects are found resulting in significantly stronger absorption lines of neutral silicon in NLTE. As a consequence, silicon abundances determined in NLTE are significantly smaller than in local thermodynamic equilibrium (LTE) with the NLTE abundance corrections varying smoothly between −0.4 dex and −0.1 dex for effective temperatures between 3400 K and 4400 K. The effects are largest at low metallicity. The physical reasons behind the NLTE effects and the consequences for extragalactic J-band abundance studies are discussed. Key words: galaxies: abundances – line: formation – radiative transfer – stars: abundances – stars: late-type – supergiants Online-only material: color figures 1. INTRODUCTION With their enormous luminosities of 10 5 to ∼10 6 L/L (Humphreys & Davidson 1979) emitted at infrared wavelengths, red supergiant stars (RSGs) are ideal probes of extragalactic cosmic abundances. The J-band spectra of RSGs are dominated by strong and isolated atomic lines of iron, titanium, silicon, and magnesium, while the molecular lines of OH, H 2 O, CN, and CO are weak. In consequence, medium-resolution spectroscopy in this spectral range is sufficient to derive stellar parameters and chemical abundances of RSGs from these atomic lines. This has been demonstrated recently by Davies et al. (2010, hereinafter DKF10), who introduced a novel technique using MARCS model atmosphere spectra (Gustafsson et al. 2008) to determine metallicities with an accuracy of ∼0.15 dex per individual star. With existing telescopes and forthcoming new efficient MOS spectrographs such as MOSFIRE at Keck and KMOS at the Very Large Telescope the technique can be applied to an investigation of metallicities of galaxies up to a distance of 10 Mpc. Even more exciting are the perspectives of the use of future adaptive optics MOS IR spectrographs at the next generation of extremely large telescopes. Evans et al. (2011) estimate that with instruments like EAGLE at the E-ELT and IRMS at the TMT it would be possible to measure abundances of α- and iron-group elements of individual RSGs out to the enormous distance of 70 Mpc. This is a substantial volume of the local universe containing entire groups and clusters of galaxies, for which the formation and evolution could be studied through the determination of accurate abundances from individual stars. So far, most of our information about the metal content of star-forming galaxies is obtained from a simplified analysis of the strongest H ii region emission lines. As discussed by Kudritzki et al. (2008, 2012) and 5 University Observatory Munich, Scheinerstr. 1, D-81679 Munich, Germany. Bresolin et al. (2009) these “strong-line methods” are subject to large systematic uncertainties, which are poorly understood. In consequence, alternative methods using stars such as blue supergiants (Kudritzki et al. 2012) or RSGs are highly desirable. We have, therefore, started to investigate the DKF10 J-band method and its possible limitations and systematic uncertainties in more detail. Since the MARCS model atmosphere spectra are calculated in local thermodynamic equilibrium (LTE), an obvious part of such an investigation is the assessment of the influence of departures from LTE, which might be important because of the extremely low gravities and hence low densities encountered in the atmospheres of RSGs. In a first step, we have carried out non-LTE (NLTE) line formation calculations in RSG atmospheres for iron and titanium and have discussed the consequences of NLTE-effects for the J-band analysis (Bergemann et al. 2012, hereafter Paper I). It was found that NLTE-effects are small for J-band iron lines, but significant for titanium. Now we extend this work and present detailed NLTE calculations for silicon. There are four strong subordinate Si i lines observed in J-band spectra of RSGs, which provide crucial abundance information. We investigate the influence of NLTE effects on the formation of these lines. The paper is structured as follows. In Section 2 we describe the model atmospheres and the details of the line formation calculations. Section 3 presents the results: departure coeffi- cients, line profiles and equivalent widths in LTE and NLTE and NLTE abundance corrections for chemical abundance stud- ies. Section 4 discusses the consequences for the new J-band diagnostic technique and aspects of future work. 2. MODEL ATMOSPHERES AND NON-LTE LINE FORMATION As in Paper I we use MARCS model atmospheres (Gustafsson et al. 2008) for the underlying atmospheric structure and 1
RED SUPERGIANT STARS AS COSMIC ABUNDANCE PROBES. II.NLTE EFFECTS IN J-BAND SILICON LINES
Maria Bergemann1, Rolf-Peter Kudritzki1,2,5, Matthias Wurl1, Bertrand Plez3, Ben Davies4, and Zach Gazak21 Max-Planck-Institute for Astrophysics, Karl-Schwarzschild-Str.1, D-85741 Garching, Germany;
4 Institute of Astronomy, University of Cambridge, Madingley Road, Cambridge, CB3 OHA, UK; [email protected] 2012 October 15; accepted 2012 December 10; published 2013 January 30
ABSTRACT
Medium-resolution J-band spectroscopy of individual red supergiant stars is a promising tool to investigate thechemical composition of the young stellar population in star-forming galaxies. As a continuation of recent workon iron and titanium, detailed non-LTE (NLTE) calculations are presented to investigate the influence of NLTE onthe formation of silicon lines in the J-band spectra of red supergiants. Substantial effects are found resultingin significantly stronger absorption lines of neutral silicon in NLTE. As a consequence, silicon abundancesdetermined in NLTE are significantly smaller than in local thermodynamic equilibrium (LTE) with the NLTEabundance corrections varying smoothly between −0.4 dex and −0.1 dex for effective temperatures between3400 K and 4400 K. The effects are largest at low metallicity. The physical reasons behind the NLTE effects andthe consequences for extragalactic J-band abundance studies are discussed.
With their enormous luminosities of 105 to ∼106L/L�(Humphreys & Davidson 1979) emitted at infrared wavelengths,red supergiant stars (RSGs) are ideal probes of extragalacticcosmic abundances. The J-band spectra of RSGs are dominatedby strong and isolated atomic lines of iron, titanium, silicon, andmagnesium, while the molecular lines of OH, H2O, CN, andCO are weak. In consequence, medium-resolution spectroscopyin this spectral range is sufficient to derive stellar parametersand chemical abundances of RSGs from these atomic lines.This has been demonstrated recently by Davies et al. (2010,hereinafter DKF10), who introduced a novel technique usingMARCS model atmosphere spectra (Gustafsson et al. 2008)to determine metallicities with an accuracy of ∼0.15 dex perindividual star. With existing telescopes and forthcoming newefficient MOS spectrographs such as MOSFIRE at Keck andKMOS at the Very Large Telescope the technique can be appliedto an investigation of metallicities of galaxies up to a distanceof 10 Mpc. Even more exciting are the perspectives of the useof future adaptive optics MOS IR spectrographs at the nextgeneration of extremely large telescopes. Evans et al. (2011)estimate that with instruments like EAGLE at the E-ELT andIRMS at the TMT it would be possible to measure abundancesof α- and iron-group elements of individual RSGs out to theenormous distance of 70 Mpc.
This is a substantial volume of the local universe containingentire groups and clusters of galaxies, for which the formationand evolution could be studied through the determination ofaccurate abundances from individual stars. So far, most of ourinformation about the metal content of star-forming galaxies isobtained from a simplified analysis of the strongest H ii regionemission lines. As discussed by Kudritzki et al. (2008, 2012) and
5 University Observatory Munich, Scheinerstr. 1, D-81679 Munich, Germany.
Bresolin et al. (2009) these “strong-line methods” are subjectto large systematic uncertainties, which are poorly understood.In consequence, alternative methods using stars such as bluesupergiants (Kudritzki et al. 2012) or RSGs are highly desirable.
We have, therefore, started to investigate the DKF10 J-bandmethod and its possible limitations and systematic uncertaintiesin more detail. Since the MARCS model atmosphere spectraare calculated in local thermodynamic equilibrium (LTE), anobvious part of such an investigation is the assessment of theinfluence of departures from LTE, which might be importantbecause of the extremely low gravities and hence low densitiesencountered in the atmospheres of RSGs. In a first step, wehave carried out non-LTE (NLTE) line formation calculationsin RSG atmospheres for iron and titanium and have discussedthe consequences of NLTE-effects for the J-band analysis(Bergemann et al. 2012, hereafter Paper I). It was found thatNLTE-effects are small for J-band iron lines, but significant fortitanium. Now we extend this work and present detailed NLTEcalculations for silicon. There are four strong subordinate Si ilines observed in J-band spectra of RSGs, which provide crucialabundance information. We investigate the influence of NLTEeffects on the formation of these lines.
The paper is structured as follows. In Section 2 we describethe model atmospheres and the details of the line formationcalculations. Section 3 presents the results: departure coeffi-cients, line profiles and equivalent widths in LTE and NLTEand NLTE abundance corrections for chemical abundance stud-ies. Section 4 discusses the consequences for the new J-banddiagnostic technique and aspects of future work.
2. MODEL ATMOSPHERES AND NON-LTELINE FORMATION
As in Paper I we use MARCS model atmospheres (Gustafssonet al. 2008) for the underlying atmospheric structure and
The Astrophysical Journal, 764:115 (11pp), 2013 February 20 Bergemann et al.
Figure 1. Complete silicon atomic model.
the DETAIL NLTE code (Butler & Giddings 1985) for thecalculation of NLTE occupation numbers. Line profiles andNLTE abundance corrections are computed with the separatecode SIU (Reetz 1999) using the level departure coefficientsfrom DETAIL. SIU and DETAIL share the same physics andline lists. For all details such as model structure and geometry,background opacities, solar abundance mixture, etc., we referthe reader to Paper I.
To assess the importance of NLTE effects for the J-band Si ilines we use a small grid of models computed assuming a stellarmass of 15 M� with five effective temperatures (Teff = 3400,3800, 4000, 4200, 4400 K), three gravities (log g = 1.0, 0.0,−0.5 (cgs)), and three metallicities ([Z] ≡ log Z/Z� = −0.5,0.0, +0.5). The microturbulence is fixed to ξt = 2 km s−1. Thisgrid covers the range of atmospheric parameters expected forRSGs (see DKF10 and Paper I).
2.1. Model Atom
Our model atom consists of the first three ionization stages ofsilicon. It has 289 levels of Si i (mostly singlet and triplet termsand one quintet term) and 50 levels of Si ii (duplet and quartetterms). Si iii is represented by its ground state only because ofthe low effective temperatures of RSGs, for which Si i is thedominating ionization stage in the atmospheric layers where theIR lines investigated in this study form. Fine structure splittingis taken into account for all Si i levels with excitation energies
smaller than 7.45 eV and all Si ii levels with excitation energiessmaller than 6.20 eV. Most of the information on energy levelswere drawn form the NIST database (Kramida et al. 2012).6
Also, 147 theoretically predicted Si i levels were included fromthe Kurucz database.7 Atomic completeness at energies close tofirst ionization threshold is important for statistical equilibriumof the neutral atom.
The radiative bound–bound transitions between energy levelsof Si i were extracted from the Kurucz database, while the Si iidata have been taken from the NIST database. There is no needfor a more refined model of Si ii since the ion is unaffectedby NLTE for FGKM stars, which is also confirmed by our testcalculations. In fact, on these grounds the whole Si ii stage couldbe excluded completely. Only transitions between 0.1 μm and30 μm with log gf -values greater than −8 were included. Intotal, the model atom contains 2956 allowed transitions, 2826 forSi i and 130 for Si ii, respectively. Figure 1 shows the completeatomic model.
While Figure 1 gives an impression of the total effort madein calculating NLTE effects for the silicon atom, it is not wellsuited for discussing the conditions leading to the formation ofthe IR J-band Si i lines. For this purpose, we give Figure 2, whichshows only transitions from and to the upper and lower levelsof these lines. Figure 3 zooms into this figure and displays the
The Astrophysical Journal, 764:115 (11pp), 2013 February 20 Bergemann et al.
Figure 2. Silicon NLTE atomic model showing only transitions to and from the levels leading to the J-band IR transitions. Strong transition with log gf -values largerthan −1.0 are solid, weaker transitions are dotted. The IR transitions are highlighted in red.
(A color version of this figure is available in the online journal.)
Figure 3. Fine structure splitting of the Si i IR J-band lines.
(A color version of this figure is available in the online journal.)
corresponding fine structure splitting. The detailed informationabout the lines is given in Table 1.
Photoionization cross-sections calculated in the close cou-pling approximation using the R-matrix method were taken fromthe TOPbase database (Cunto et al. 1993) and are limited to aminimum of photon wavelengths of 1000 Å. About 20% of veryhigh levels with excitation energy above 6 eV were missing in
this database and for those the hydrogenic approximation wasadopted.
Electron collisions for excitation and ionization were cal-culated using the approximations by van Regemorter (1962)and Seaton (1962), respectively, as also given by Cox (2000,Sections 3.6.1 and 3.6.2). Bound–bound and bound–free colli-sion cross-sections due to collisions with H i atoms were cal-culated according to the generalized formula given by Lambert(1993, A10).
2.2. Test Calculations for the Sun
As a test of our approach in modeling the formation ofsilicon lines we have calculated Si i and Si ii lines for theSun and determined their NLTE silicon abundances. For theoptical lines, the gf and C6 values were taken from Shi et al.(2008), and the microturbulence set to 1 km s−1. The result islog ASi = 7.56 ± 0.05 in a very good agreement with the NLTEanalysis by Shi et al. (2008) and Wedemeyer (2001). The NLTEabundance corrections for the lines in common are also fullyconsistent with the latter investigations: the NLTE effects in theoptical Si i transitions are minor, typically within −0.01 ± 0.01dex, but become increasingly important for the IR lines, reaching−0.1 dex.
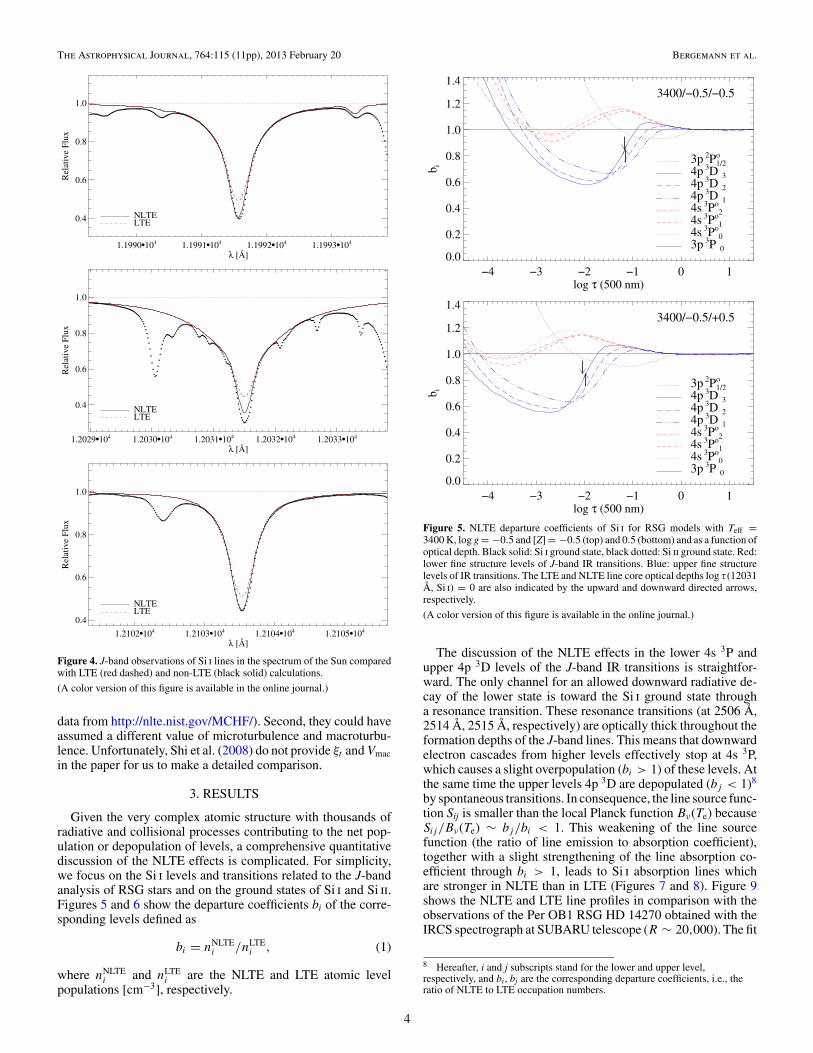
A comparison with the observed silicon IR J band in the solarKPNO flux spectrum is given in Figure 4. The gf -values arethat recommended by the VALD2 database, i.e., Kurucz (2007).The NLTE calculations agree well with the observations in theline cores as well as in the wings. This confirms that the atomicdata used for the lines (gf -values, radiative, and collisionalbroadening) are reliable. The LTE line profiles are substantiallyweaker, showing that LTE is a poor approximation for thesolar IR Si i lines and leading to 0.05–0.1 dex overestimatedabundances.
Based on the solar analysis, we do not find any need for anarbitrary scaling of the cross-sections in the NLTE calculations,contrary to Shi et al. (2008). They obtain a somewhat betterfit for the 12031 Å Si i line by adopting a lower efficiency ofH i inelastic collisions. There could be several reasons for that.First, they used a different source of gf -values (Hartree–Fock
3
The Astrophysical Journal, 764:115 (11pp), 2013 February 20 Bergemann et al.
Figure 4. J-band observations of Si i lines in the spectrum of the Sun comparedwith LTE (red dashed) and non-LTE (black solid) calculations.
(A color version of this figure is available in the online journal.)
data from http://nlte.nist.gov/MCHF/). Second, they could haveassumed a different value of microturbulence and macroturbu-lence. Unfortunately, Shi et al. (2008) do not provide ξt and Vmacin the paper for us to make a detailed comparison.
3. RESULTS
Given the very complex atomic structure with thousands ofradiative and collisional processes contributing to the net pop-ulation or depopulation of levels, a comprehensive quantitativediscussion of the NLTE effects is complicated. For simplicity,we focus on the Si i levels and transitions related to the J-bandanalysis of RSG stars and on the ground states of Si i and Si ii.Figures 5 and 6 show the departure coefficients bi of the corre-sponding levels defined as
bi = nNLTEi /nLTE
i , (1)
where nNLTEi and nLTE
i are the NLTE and LTE atomic levelpopulations [cm−3], respectively.
−4 −3 −2 −1 0 1log τ (500 nm)
0.0
0.2
0.4
0.6
0.8
1.0
1.2
1.4
b i
3400/−0.5/−0.5
4s 3Po 0
4s 3Po 1
4s 3Po 2
4p 3D 1
4p 3D 2
4p 3D 3
3p 2Po1/2
3p 3P 0
−4 −3 −2 −1 0 1log τ (500 nm)
0.0
0.2
0.4
0.6
0.8
1.0
1.2
1.4
b i
3400/−0.5/+0.5
4s 3Po 0
4s 3Po 1
4s 3Po 2
4p 3D 1
4p 3D 2
4p 3D 3
3p 2Po1/2
3p 3P 0
Figure 5. NLTE departure coefficients of Si i for RSG models with Teff =3400 K, log g = −0.5 and [Z] = −0.5 (top) and 0.5 (bottom) and as a function ofoptical depth. Black solid: Si i ground state, black dotted: Si ii ground state. Red:lower fine structure levels of J-band IR transitions. Blue: upper fine structurelevels of IR transitions. The LTE and NLTE line core optical depths log τ (12031Å, Si i) = 0 are also indicated by the upward and downward directed arrows,respectively.
(A color version of this figure is available in the online journal.)
The discussion of the NLTE effects in the lower 4s 3P andupper 4p 3D levels of the J-band IR transitions is straightfor-ward. The only channel for an allowed downward radiative de-cay of the lower state is toward the Si i ground state througha resonance transition. These resonance transitions (at 2506 Å,2514 Å, 2515 Å, respectively) are optically thick throughout theformation depths of the J-band lines. This means that downwardelectron cascades from higher levels effectively stop at 4s 3P,which causes a slight overpopulation (bi > 1) of these levels. Atthe same time the upper levels 4p 3D are depopulated (bj < 1)8
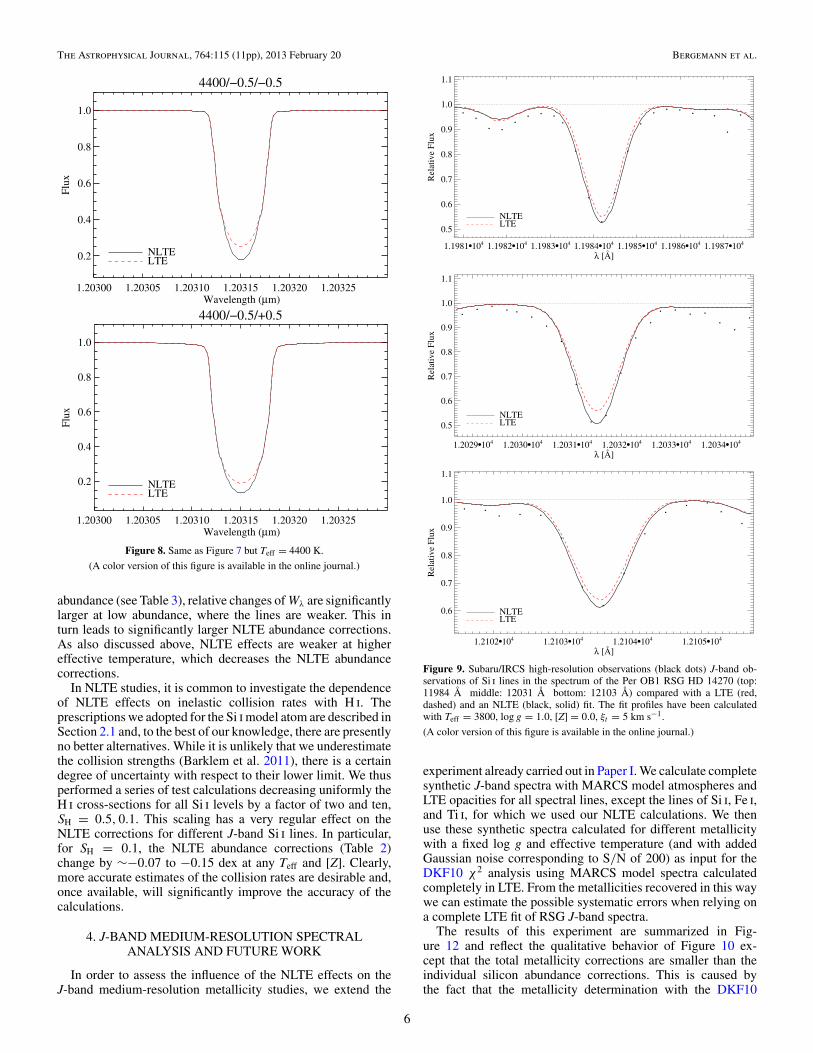
by spontaneous transitions. In consequence, the line source func-tion Sij is smaller than the local Planck function Bν(Te) becauseSij /Bν(Te) ∼ bj/bi < 1. This weakening of the line sourcefunction (the ratio of line emission to absorption coefficient),together with a slight strengthening of the line absorption co-efficient through bi > 1, leads to Si i absorption lines whichare stronger in NLTE than in LTE (Figures 7 and 8). Figure 9shows the NLTE and LTE line profiles in comparison with theobservations of the Per OB1 RSG HD 14270 obtained with theIRCS spectrograph at SUBARU telescope (R ∼ 20,000). The fit
8 Hereafter, i and j subscripts stand for the lower and upper level,respectively, and bi, bj are the corresponding departure coefficients, i.e., theratio of NLTE to LTE occupation numbers.
The Astrophysical Journal, 764:115 (11pp), 2013 February 20 Bergemann et al.
−4 −3 −2 −1 0 1log τ (500 nm)
0.0
0.2
0.4
0.6
0.8
1.0
1.2
1.4b i
4400/−0.5/−0.5
4s 3Po 0
4s 3Po 1
4s 3Po 2
4p 3D 1
4p 3D 2
4p 3D 3
3p 2Po1/2
3p 3P 0
−4 −3 −2 −1 0 1log τ (500 nm)
0.0
0.2
0.4
0.6
0.8
1.0
1.2
1.4
b i
4400/−0.5/+0.5
4s 3Po 0
4s 3Po 1
4s 3Po 2
4p 3D 1
4p 3D 2
4p 3D 3
3p 2Po1/2
3p 3P 0
Figure 6. Same as Figure 5 but for Teff = 4400 K.
(A color version of this figure is available in the online journal.)
profiles have been calculated with Teff = 3800, log g = 1.0, [Z]= 0.0, and ξt = 5 km s−1. The NLTE effects are clearly distin-guishable when compared to the observed spectrum. Therefore,one of our next steps will be to test the new NLTE models on alarge sample of high-resolution spectra of Galactic RSGs.
From inspection of Figure 5 we see that for Teff = 3400 K thedeparture coefficients assume values of bi ∼ 1.15 and bj ∼ 0.6at the depths of the formation of the line cores. These valuesare independent of the silicon abundance (or metallicity [Z]).The only effect of higher abundance is that the line coresform farther out in the atmosphere, while the extreme valuesof the departure coefficients remain the same. In consequence,following the Eddington–Barbier relationship that the emergentflux is roughly given by the source function at optical depth 2/3the relation between the NLTE and LTE emergent flux at the linecenter is H NLTE
0 ∼ (bj/bi)H LTE0 ∼ 0.5H LTE
0 . This is confirmedby the actual calculations of line profiles at both metallicities(Figure 7).
At Teff = 4400 K the NLTE effects are smaller and weobtain bi ∼ 1.1 and bj ∼ 0.7, and H NLTE
0 ∼ 0.64H LTE0
(Figures 6 and 8). The reason is that at higher temperaturethe rate of electron collisions populating or depopulating thehigher and lower levels increases, whereas the depopulation ofthe higher levels through spontaneous emission is temperatureindependent.
The increase of the absorption strengths of the Si i J-bandlines in NLTE has consequences for the determination ofelement abundances. The importance of this effect can be
Figure 7. NLTE (black, solid) and LTE (red, dashed) profiles of the Si i line at12031 Å computed for Teff = 3400 K, log g = −0.5 and with [Z] = −0.5 (top)and 0.5 (bottom). The microturbulence is ξt = 2 km s−1.
(A color version of this figure is available in the online journal.)
assessed by introducing NLTE abundance corrections Δ, where
Δ = log A(Si)NLTE − log A(Si)LTE (2)
is the logarithmic correction, which has to be applied to anLTE silicon abundance determination of a specific line, log A,to obtain the correct value corresponding to the use of NLTEline formation. We calculate these corrections at each point ofour model grid for each line by matching the NLTE equivalentwidth by varying the Si abundance in the LTE calculations. Notethat from the definition of Δ an NLTE abundance correctionis negative, when for the same element abundance the NLTEline equivalent width is larger than the LTE one, because itrequires a higher LTE abundance to fit the NLTE equivalentwidth. Figures 10 and 11 show the NLTE abundance correctionscalculated in this way for the two values of microturbulencebracketing the values found in RSGs (Davies et al. 2010). It canbe seen that the difference between them is small, similar to ourresults for the Fe i and Ti i J-band lines (Bergemann et al. 2012).Therefore, the data are given in Table 2 for ξ = 2 km s−1 only.
The NLTE abundance corrections are substantial with largenegative values between −0.4 and −0.1 dex. The correctionsare strongest at low silicon abundance (or low metallicity [Z]).While as discussed above changes between the LTE and NLTEcentral line intensity and, thus, also changes in the absolutevalue of equivalent widths Wλ are roughly independent of
5
The Astrophysical Journal, 764:115 (11pp), 2013 February 20 Bergemann et al.
(A color version of this figure is available in the online journal.)
abundance (see Table 3), relative changes of Wλ are significantlylarger at low abundance, where the lines are weaker. This inturn leads to significantly larger NLTE abundance corrections.As also discussed above, NLTE effects are weaker at highereffective temperature, which decreases the NLTE abundancecorrections.
In NLTE studies, it is common to investigate the dependenceof NLTE effects on inelastic collision rates with H i. Theprescriptions we adopted for the Si i model atom are described inSection 2.1 and, to the best of our knowledge, there are presentlyno better alternatives. While it is unlikely that we underestimatethe collision strengths (Barklem et al. 2011), there is a certaindegree of uncertainty with respect to their lower limit. We thusperformed a series of test calculations decreasing uniformly theH i cross-sections for all Si i levels by a factor of two and ten,SH = 0.5, 0.1. This scaling has a very regular effect on theNLTE corrections for different J-band Si i lines. In particular,for SH = 0.1, the NLTE abundance corrections (Table 2)change by ∼−0.07 to −0.15 dex at any Teff and [Z]. Clearly,more accurate estimates of the collision rates are desirable and,once available, will significantly improve the accuracy of thecalculations.
4. J-BAND MEDIUM-RESOLUTION SPECTRALANALYSIS AND FUTURE WORK
In order to assess the influence of the NLTE effects on theJ-band medium-resolution metallicity studies, we extend the
Figure 9. Subaru/IRCS high-resolution observations (black dots) J-band ob-servations of Si i lines in the spectrum of the Per OB1 RSG HD 14270 (top:11984 Å middle: 12031 Å bottom: 12103 Å) compared with a LTE (red,dashed) and an NLTE (black, solid) fit. The fit profiles have been calculatedwith Teff = 3800, log g = 1.0, [Z] = 0.0, ξt = 5 km s−1.
(A color version of this figure is available in the online journal.)
experiment already carried out in Paper I. We calculate completesynthetic J-band spectra with MARCS model atmospheres andLTE opacities for all spectral lines, except the lines of Si i, Fe i,and Ti i, for which we used our NLTE calculations. We thenuse these synthetic spectra calculated for different metallicitywith a fixed log g and effective temperature (and with addedGaussian noise corresponding to S/N of 200) as input for theDKF10 χ2 analysis using MARCS model spectra calculatedcompletely in LTE. From the metallicities recovered in this waywe can estimate the possible systematic errors when relying ona complete LTE fit of RSG J-band spectra.
The results of this experiment are summarized in Fig-ure 12 and reflect the qualitative behavior of Figure 10 ex-cept that the total metallicity corrections are smaller than theindividual silicon abundance corrections. This is caused bythe fact that the metallicity determination with the DKF10
6
The Astrophysical Journal, 764:115 (11pp), 2013 February 20 Bergemann et al.
Si I, 11984.2 log g=-0.5
3400 3600 3800 4000 4200 4400Teff (K)
-0.6
-0.4
-0.2
-0.0
0.2Δ
(NL
TE
- L
TE
)Si I, 11984.2 log g=0.0
3400 3600 3800 4000 4200 4400-0.6
-0.4
-0.2
-0.0
0.2
Δ (N
LT
E -
LT
E)
Si I, 11984.2 log g=1.0
3400 3600 3800 4000 4200 4400-0.6
-0.4
-0.2
-0.0
0.2
Δ (N
LT
E -
LT
E)
Si I, 11991.57 log g=-0.5
3400 3600 3800 4000 4200 4400Teff (K)
-0.6
-0.4
-0.2
-0.0
0.2
Δ (N
LT
E -
LT
E)
[Fe/H] = -0.5[Fe/H] = 0.0[Fe/H] = +0.5
Si I, 11991.57 log g=0.0
3400 3600 3800 4000 4200 4400-0.6
-0.4
-0.2
-0.0
0.2Δ
(NL
TE
- L
TE
)Si I, 11991.57 log g=1.0
3400 3600 3800 4000 4200 4400-0.6
-0.4
-0.2
-0.0
0.2
Δ (N
LT
E -
LT
E)
Si I, 12031.50 log g=-0.5
3400 3600 3800 4000 4200 4400Teff (K)
-0.6
-0.4
-0.2
-0.0
0.2
Δ (N
LT
E -
LT
E)
Si I, 12031.50 log g=0.0
3400 3600 3800 4000 4200 4400-0.6
-0.4
-0.2
-0.0
0.2
Δ (N
LT
E -
LT
E)
Si I, 12031.50 log g=1.0
3400 3600 3800 4000 4200 4400-0.6
-0.4
-0.2
-0.0
0.2Δ
(NL
TE
- L
TE
)
Si I, 12103.535 log g=-0.5
3400 3600 3800 4000 4200 4400Teff (K)
-0.6
-0.4
-0.2
-0.0
0.2
Δ (N
LT
E -
LT
E)
Si I, 12103.535 log g=0.0
3400 3600 3800 4000 4200 4400-0.6
-0.4
-0.2
-0.0
0.2
Δ (N
LT
E -
LT
E)
Si I, 12103.535 log g=1.0
3400 3600 3800 4000 4200 4400-0.6
-0.4
-0.2
-0.0
0.2
Δ (N
LT
E -
LT
E)
Figure 10. NLTE abundance corrections as a function of effective temperature for microturbulence ξ = 2 km s−1 for Si i 11984 Å (top), 11991 Å (2nd row), 12031 Å(3rd row), and 12103 Å (bottom). Left column: log g = −0.5, middle column: log g = 0.0, right column: log g = 1.0. Black solid: [Z] = −0.5, blue solid: [Z] = 0.0,red solid: [Z] = +0.5.
(A color version of this figure is available in the online journal.)
7
The Astrophysical Journal, 764:115 (11pp), 2013 February 20 Bergemann et al.
Si I, 11984.2 log g=-0.5
3400 3600 3800 4000 4200 4400Teff (K)
-0.6
-0.4
-0.2
-0.0
0.2Δ
(NL
TE
- L
TE
)Si I, 11984.2 log g=0.0
3400 3600 3800 4000 4200 4400-0.6
-0.4
-0.2
-0.0
0.2
Δ (N
LT
E -
LT
E)
Si I, 11984.2 log g=1.0
3400 3600 3800 4000 4200 4400-0.6
-0.4
-0.2
-0.0
0.2
Δ (N
LT
E -
LT
E)
Si I, 11991.57 log g=-0.5
3400 3600 3800 4000 4200 4400Teff (K)
-0.6
-0.4
-0.2
-0.0
0.2
Δ (N
LT
E -
LT
E)
[Fe/H] = -0.5[Fe/H] = 0.0[Fe/H] = +0.5
Si I, 11991.57 log g=0.0
3400 3600 3800 4000 4200 4400-0.6
-0.4
-0.2
-0.0
0.2Δ
(NL
TE
- L
TE
)Si I, 11991.57 log g=1.0
3400 3600 3800 4000 4200 4400-0.6
-0.4
-0.2
-0.0
0.2
Δ (N
LT
E -
LT
E)
Si I, 12031.50 log g=-0.5
3400 3600 3800 4000 4200 4400Teff (K)
-0.6
-0.4
-0.2
-0.0
0.2
Δ (N
LT
E -
LT
E)
Si I, 12031.50 log g=0.0
3400 3600 3800 4000 4200 4400-0.6
-0.4
-0.2
-0.0
0.2
Δ (N
LT
E -
LT
E)
Si I, 12031.50 log g=1.0
3400 3600 3800 4000 4200 4400-0.6
-0.4
-0.2
-0.0
0.2Δ
(NL
TE
- L
TE
)
Si I, 12103.535 log g=-0.5
3400 3600 3800 4000 4200 4400Teff (K)
-0.6
-0.4
-0.2
-0.0
0.2
Δ (N
LT
E -
LT
E)
Si I, 12103.535 log g=0.0
3400 3600 3800 4000 4200 4400-0.6
-0.4
-0.2
-0.0
0.2
Δ (N
LT
E -
LT
E)
Si I, 12103.535 log g=1.0
3400 3600 3800 4000 4200 4400-0.6
-0.4
-0.2
-0.0
0.2
Δ (N
LT
E -
LT
E)
Figure 11. NLTE abundance corrections as a function of effective temperature for microturbulence ξ = 5 km s−1 for Si i 11984 Å (top), 11991 Å (2nd row), 12031 Å(3rd row), and 12103 Å (bottom). Left column: log g = −0.5, middle column: log g = 0.0, right column: log g = 1.0. Black solid: [Z] = −0.5, blue solid: [Z] = 0.0,red solid: [Z] = +0.5.
(A color version of this figure is available in the online journal.)
8
The Astrophysical Journal, 764:115 (11pp), 2013 February 20 Bergemann et al.
Table 2Non-LTE Abundance Corrections for the Si i Lines (ξ = 2 km s−1)
method is dominated by the numerous Fe i lines, which arerelatively well represented by the LTE approximation (seePaper I). However, at lower effective temperature we stillfind corrections between −0.15 and −0.25 dex equal or evenlarger than the 0.15 dex uncertainties encountered with theDKF10 technique. In consequence, the inclusion of NLTE ef-fects in the Si i, Ti i, and Fe i lines will definitely improvethe accuracy of future extragalactic RSG J-band abundancestudies.
This work was supported by the National Science Foun-dation under grant AST-1108906 to R.P.K. Moreover, R.P.K.
Figure 12. Influence of the Si i, Ti i, and Fe i non-LTE effects on the DKF10J-band χ2 metallicity determination as a function of effective temperature. Thenumerical experiment is described in the text. Top: log g = −0.5, middle: log g= 0.0, bottom: log g = 1.0. Circles: [Z] = −0.5, triangles: [Z] = 0.0, squares:[Z] = 0.5.
(A color version of this figure is available in the online journal.)
9
The Astrophysical Journal, 764:115 (11pp), 2013 February 20 Bergemann et al.
Table 3Equivalent Widthsa of the Si i Lines (ξ = 2 km s−1)
Teff log g [Z] Wλ,Si i Wλ,Si i Wλ,Si i Wλ,Si i Wλ,Si i Wλ,Si i Wλ,Si i Wλ,Si i
acknowledges support by the Alexander-von-Humboldt Foun-dation and the hospitality of the Max-Planck-Institute for As-trophysics in Garching and the University Observatory Munich,where part of this work was carried out.
REFERENCES
Barklem, P. S., Belyaev, A. K., Guitou, M., et al. 2011, A&A, 530, A94Bergemann, M., Kudritzki, R.- P., Plez, B., et al. 2012, ApJ, 751, 156Bresolin, F., Gieren, W., Kudritzki, R.-P., et al. 2009, ApJ, 700, 309
Butler, K., & Giddings, J. 1985, Newsletter on Analysis of Astronomical SpectraNo. 9 (London: University College London)
Cox, A. N. 2000, Allen’s Astrophysical Quantities (4th ed.; New York: Springer)Cunto, W., Mendoza, C., Ochsenbein, F., & Zeippen, C. J. 1993, A&A, 275, L5Davies, B., Kudritzki, R. P., & Figer, D. F. 2010, MNRAS, 407, 1203Evans, C. J., Davies, B., Kudritzki, R. P., et al. 2011, A&A, 527, 50Gustafsson, B., Edvardsson, B., Eriksson, K., Jorgensen, U. G., Nordlund, A.,
& Plez, B. 2008, A&A, 486, 951Humphreys, R. M., & Davidson, K. 1979, ApJ, 232, 409Kramida, A., Ralchenko, Yu., & Reader, J., & NIST ASD Team
The Astrophysical Journal, 764:115 (11pp), 2013 February 20 Bergemann et al.
http://physics.nist.gov/asd [2012, August 6], National Institute of Standardsand Technology, Gaithersburg, MD
Kudritzki, R.-P., Urbaneja, M. A., Bresolin, F., et al. 2008, ApJ, 681, 269Kudritzki, R.-P., Urbaneja, M. A., Gazak, Z., et al. 2012, ApJ, 747, 15Kurucz, R.-L. 2007, Robert L. Kurucz Online Database of Observed and
Predicted Atomic Transitions, http://kurucz.harvard.eduLambert, D. L. 1993, PhST, 47, 186
Reetz, J. 1999, PhD thesis, LMU MunchenSeaton, M. J. 1962, in Atomic and Molecular Processes, ed. D. R. Bates (New
York: Academic Press), 375Shi, J. R., Gehren, T., Butler, K., Mashonkina, L. I., & Zhao, G. 2008, A&A,
486, 303van Regemorter, H. 1962, ApJ, 136, 906Wedemeyer, S. 2001, A&A, 373, 998