Available in: http://www.redalyc.org/articulo.oa?id=17220620025 Scientific Information System Network of Scientific Journals from Latin America, the Caribbean, Spain and Portugal Amara Andrés, Lluís Salafranca, Antonio Solanas Predicting Team Output Using Indices at Group Level The Spanish Journal of Psychology, vol. 14, núm. 2, 2011, pp. 773-788, Universidad Complutense de Madrid España How to cite Complete issue More information about this article Journal's homepage The Spanish Journal of Psychology, ISSN (Printed Version): 1138-7416 [email protected]Universidad Complutense de Madrid España www.redalyc.org Non-Profit Academic Project, developed under the Open Acces Initiative
Transcript
Available in: http://www.redalyc.org/articulo.oa?id=17220620025
Scientific Information SystemNetwork of Scientific Journals from Latin America, the Caribbean, Spain and
Portugal
Amara Andrés, Lluís Salafranca, Antonio Solanas
Predicting Team Output Using Indices at Group Level The Spanish Journal of
Psychology, vol. 14, núm. 2, 2011, pp. 773-788,
Universidad Complutense de Madrid
España
How to cite Complete issue More information about this article Journal's homepage
The present study explores the usefulness of dyadic quantification of group characteristics to predictteam work performance. After reviewing the literature regarding team member characteristics predictinggroup performance, percentages of explained variance between 3% and 18% were found. These studieshave followed an individualistic approach to measure group characteristics (e. g., mean and variance),based on aggregation. The aim of the present work was testing whether by means of dyadic measuresgroup output prediction percentage could be increased. The basis of dyadic measures is data obtainedfrom an interdependent pairs of individuals. Specifically, the present research was intended to develop anew dyadic index to measure personality dissimilarity in groups and to explore whether dyadicmeasurements allow improving groups’ outcome predictions compared to individualistic methods. Bymeans of linear regression, 49.5 % of group performance variance was explained using the skew-symmetry and the proposed dissimilarity index in personality as predictors. These results support theusefulness of the dyadic approach for predicting group outcomes.Keywords: interpersonal perception, dyadic measurements, team work, skew-symmetry index, dissimilarity
in personality.
El presente estudio explora la utilidad de la cuantificación diádica de las características grupales parapredecir el rendimiento en equipos de trabajo. Tras revisar la literatura relacionada con el estudio de lascaracterísticas de los miembros de un grupo para predecir el rendimiento grupal, se encontraron porcentajesde varianza explicada de entre el 3% y el 18%. Estos estudios han seguido el denominado enfoqueindividual, fundamentado en la agregación, para resumir las características de los grupos (e. g., mediay varianza). El objetivo del presente estudio es poner a prueba si, mediante medidas diádicas se puedeincrementar el porcentaje de predicción del rendimiento grupal. La base de las medidas diádicas sondatos obtenidos a partir de pares de individuos interdependientes. Concretamente, en la presenteinvestigación se pretende desarrollar un nuevo índice diádico para medir disimilitud en personalidad engrupos y verificar si las medidas diádicas mejoran la predicción del rendimiento grupal en comparacióncon las predicciones obtenidas mediante índices basados en la perspectiva individual. Mediante regresiónlineal fue explicado el 49.5% de la variabilidad en el rendimiento grupal utilizando como predictoras lasmedidas tomadas mediante los índices diádicos de antisimetría y disimilitud en personalidad. Estosresultados apoyan la utilidad de la perspectiva diádica para predecir el rendimiento grupal.Palabras clave: percepción interpersonal, medidas diádicas, trabajo en equipo, índice de antisimetría,disimilitud en personalidad.
Predicting Team Output Using Indices at Group Level
Amara Andrés, Lluís Salafranca, and Antonio Solanas
Universidad de Barcelona (Spain)
The Spanish Journal of Psychology Copyright 2011 by The Spanish Journal of Psychology2011, Vol. 14, No. 2, 773-788 ISSN 1138-7416http://dx.doi.org/10.5209/rev_SJOP.2011.v14.n2.25
This research was supported by Spanish Ministerio de Educación y Ciencia. Grants PSI2009-07076(PSIC), SEJ2005-07310-C02-01/PSIC and by the Programa de Formación del Profesorado Universitario (FPU) AP2007-01089. We thank Dr Richard Watson forallowing us to employ the Foundation Task.
Correspondence concerning this article should be addressed to Amara Andrés, Departamento de Metodología de las Ciencias delComportamiento, Facultad de Psicología, Universidad de Barcelona, Paseo Vall d’Hebron 171, 08035, Barcelona, (Spain). Phone: +34-933125844. E-mail: [email protected]
773
Team composition is the configuration of memberattributes in a team (Levine & Moreland, 1990) and isthought to have an influence on team processes andoutcomes (Kozlowski & Bell, 2003). Research concerningteam composition can be categorized along threedimensions: characteristics of team members (e.g., numberof team members, members’ abilities, demographics, andpersonality traits), measurement of these characteristics,and the analytical perspective used to approach teamcomposition (Levine & Moreland, 2006; Moreland &Levine, 1992). The most common analytical perspectiveconsiders team composition as a predictor of teamworkprocesses and outcomes and, therefore, team compositionbecomes of interest for both researchers and appliedpsychologists. The present study deals with the measurementof characteristics in work groups. Specifically, it is focusedon the indices that have been used and, considering theirdrawbacks, two dyadic indices are proposed: a dyadic indexfor quantifying personality dissimilarity in groups and anapplication of the skew-symmetry index (Solanas,Salafranca, Riba, Sierra, & Leiva, 2006) to interpersonalperceptions in work groups.
Team-level composition variables show a particularproblem since individual attributes are by definition at theindividual level. On the contrary, the interest in teamcomposition is in the unique combination of individualswho compose a team or how the individual-level variablesare combined to reflect team-level properties (Mohammed,Mathieu, & Bartlett, 2002; Peeters, Van Tuijl, Rutte, &Reymen, 2006). It is likely that the relationship betweenteam members’ composition attributes and team performancewill be moderated by how the construct is operationalizedat the team level, with more appropriate team-leveloperationalizations of the constructs revealing strongerrelationships between the team composition attributes andteam performance (Arthur, Bell, & Edwards, 2007). Althoughresearch has specifically explored how differentoperationalizations of team composition variables affectteam performance, results have been inconsistent acrossstudies even when multiple operationalizations were used,that is, there is a lack of agreement about which is the bestindex to quantify group characteristics to predict teamperformance (Barrick, Stewart, Neubert, & Mount, 1998;Bolin & Neuman, 2006; Neuman, Wagner, & Christiansen,1999). In fact, although a large amount of studies have foundassociations between personality traits and certain featuresof performance such as speed, quality, or quantity, correlationvalues between personality traits and group performanceare not large enough for predictive purposes. For instance,results described in Hough’s meta-analysis (1992) showpercentages of explained variance of overall performanceand effectiveness between 3% and 8%. For instance,achievement correlates .19 (3.6% of explained variance)with overall performance, − .19 (3.6% of explained variance)with irresponsible behavior, .27 (7.3% of explained variance)
with sales effectiveness, and .21 (4.4% of explained variance)with effort. As for dependability, this correlates − .24 (5.8%of explained variance) with irresponsible behavior and .17(2.9% of explained variance) with team work. Results in arecent meta-analysis showed similar mean correlationsregarding personality variables predicting group performancein laboratory studies (Bell, 2007). The highest percentageof explained variance found among the studies reviewedis 18% and corresponds to agreeableness as a predictor ofjob performance (Neuman et al., 1999). As mentioned above,these empirical results seem to be insufficient to predictgroup performance using personality traits. Although thereis empirical evidence about personality traits’ effect on teamperformance, laboratory studies that follow the traditionalmeasurement of group characteristics, that is, theindividualistic approach, seemed to result in low predictionsof team performance in terms of explained variance. Studiesbased on Social Network Analysis paradigm shownpercentages of explained variance between 10% and 30%being more frequent the former results than the latter(Cummings & Cross, 2003; Hollingshead, McGrath, &O’Connor, 1993; Sparrowe, Liden, Wayne, & Kraimer,2001).
Team Composition Variables Operationalization
The most common approach to specify the appropriateoperationalization of team composition variables has beenSteiner’s typology (Steiner, 1972, cited in Bell, 2007). Thisstrategy combines task type with several indices such asmean, variance, maximum, and minimum. In personalitystudies, mean and variance have traditionally been computedfor operationalizing team composition constructs (Barricket al., 1998). Specifically, Team Personality Elevation (TPE)and Team Personality Diversity (TPD) are the most commonindices to measure team personality composition in relationto team performance (Neuman et al., 1999). TPE is a team’smean level on a particular trait of personality or set ofpersonality traits and TPD corresponds to the variance amongteam members for a particular personality construct or setof constructs. Teams that are high in terms of TPD arereferred to as heterogeneous, whereas teams with low TPDvalues are described as homogeneous. Peeters et al., (2006)showed how Big Five’s TPE and TPD (in professional andstudent samples) affect team performance. For instance,based on their results, neither elevation nor variability inExtraversion influences team performance whereas the moresimilar team members were in Agreeableness, the bettertheir teams perform. Furthermore, circumplex models ofpersonality have worked with the terms complementary andsupplementary among individuals. The former concept refersto individuals that are dissimilar in an attribute so theycomplement each other (e.g., dominance-submissiveness)and the latter denotes similarity in a specific trait. Similarityand dissimilarity along personality traits could result in
ANDRÉS, SALAFRANCA, AND SOLANAS774
different performance increasing individuals’ satisfactionor cohesiveness among co-workers (Anderson & Tett, 2006).
However, according to Barrick et al. (1998), the meanscore of individual measures is potentially problematic sinceaggregation can mask important information. Furthermore,computing mean values of a specific trait implies workingunder the assumption that the amount of the characteristicpossessed by each individual increases the collective poolof this characteristic, regardless of how it is distributedwithin the group (Halfhill, Sundstrom, Lahner, Calderone,& Nielsen, 2005). A possible solution for overcoming centraltendency drawbacks is computing indices based ondiscrepancy as variance. However, this index has severallimitations since the upper bound depends on the valueson the response scale which limits the comparison betweendifferent empirical studies. Furthermore, by squaring thedifference between a value and the mean, this index providesa distorted view of the amount of dispersion (Roberson,Sturman, & Simons, 2007). A different approach focuseson the highest or lowest score of a personality trait that agroup member obtains in a questionnaire and this valuerepresents the whole group. This approach assumes that asingle individual may significantly affect a group.
The abovementioned indices have been applied ingroup diversity research. Although there have been uncleardescriptions about what diversity was along the scientificliterature, Harrison and Klein (2007) classified the differentways to understand group differences and proposed adiversity typology: separation, variety, and disparity.Diversity as separation represents the differences amongunit members along a single continuous attribute (e.g.,perceptions, personality traits, attitudes, beliefs). Minimumseparation occurs when all the members of a unit are atthe same point along the attribute. Maximum separationcorresponds to a situation where members are equallysplit at opposite points of the continuum. Indicesrecommended to measure separation are standard deviationand mean Euclidean distance. O’Reilly, Cadwell, andBarnett (1989) proposed the mean Euclidean distance ofattribute dissimilarity of an individual team member. Thisindex has traditionally been computed in demographicstudies (Elfenbein & O’Reilly, 2007; Tsui, Egan, &O’Reilly, 1992; Tsui & O’Reilly, 1989). It should be notedthat the maximum value depends on n (the number ofgroup members) and the range of attributes measuredand thus suitable comparisons and interpretations are notpossible. Additionally, the mean Euclidean distancerequires computing the squared difference for each pairof group members’ scale values. Following O’Reilly etal. (1989), the squaring and the square-root operationsmake the mean Euclidean distance insensitive to thedirection of a group member’s distance from others inthe group, without giving disproportionate weight togreater distances. However, the square-root of the sumof differences squared does not adequately capture the
mean Euclidean distance among team members (Biemann& Kearney, 2009). It should be highlighted thatinsensitivity to the direction of the differences can beachieved by another mathematical function (i.e., absolutevalue function), not necessarily squaring differences.Particularly challenging is to properly define whatdisproportionate weights mean, although it isunderstandable that distance weightings will depend onscale ranges. In addition to the reasons mentioned above,it has been pointed out that the mean Euclidean distanceshares a weakness with standard deviation since it cannotbe compared across scales with different metrics.
The term variety is applied to member differences on acategorical attribute. Minimum variety occurs when allmembers belong to the same category and maximum whenall members are uniformly distributed along the differentcategories. Indices recommended to quantify variety areBlau and Teachman (entropy) indices. Blau (1977, cited inJackson et al., 1991) proposed an index of heterogeneityfor categorical variables that varies from 0 (if all groupmembers possess a characteristic) to 1 (if all group membersdo not possess it). However, the maximum value of thisindex depends on the number of categories and manyresearchers deal with quantitative instead of nominal scalemeasures. Teachman’s entropy index (Shannon, 1948) hasalso been proposed for categorical variables. However, itshows the same problems as Blau’s index and is furtherlimited when the number of group members is less thanthe number of categories.
The disparity concept has been commonly employedin sociological studies (e.g., pay, power, income) to representthe differences in the distribution of a valued resource.Disparity is high when a low percentage of people (e.g.,5%) possess a great amount of a resource and a highpercentage (e.g., 95%) owns a little. Indices recommendedto quantify disparity are the coefficient of variation andGini index.
Social psychology research on team performance hasalso mainly followed an individualistic approach. Socialresearchers have focused their attention on identifyingthose attributes or processes that influence team efficiency.This approach does not take into account environmentalfactors that may mediate social interactions. Conceptually,Tett and Murphy (2002) illustrated this phenomenon,regarding personality studies in work teams, explainingthat personality can influence three levels of person-jobfit: task level, group level, and organizational level.However, task-level fit (fitting people to a specific jobtask) has been the most studied level and group-level fit(matching people to their co-workers) has been largelyignored. Furthermore, Tett and Burnett (2003) proposedthat certain tasks or situations facilitate specific traitexpression highlighting that interaction between contextualfactors and trait expression results in different performance.Interpersonal perceptions would be among these contextual
PREDICTING TEAM OUTPUT 775
factors (Kenny, 1994) since people’s beliefs about others(i.e., family, friends, and teammates) guide them to explainand predict other people’s behavior and determine socialinteractions. In fact, Interdependence Theory states thissocial phenomenon considering that in the context of asocial relationship, the interaction that occurs betweenpersons A and B is a function of both persons’ respectivetendencies in relation to each other in the particularsituation of interdependence (Holmes, 2002). Therefore,the study of interpersonal perceptions in work groupsmay give significant information regarding groupperformance (Erber & Fiske, 1984; Neuberg & Fiske,1987, Smeesters, Wheeler, & Kay, 2009). In the contextof social psychology, the study of interpersonal perceptionshas been carried out following the Social Relations Modelmethodology (SRM; Kenny, & La Voie, 1984). This modelprovides statistical techniques for making decisionsregarding dependent data. Among the indices providedby the SRM (Kenny, 1994) two correlational measuresof reciprocity can be obtained: generalized and dyadic.Generalized reciprocity is a correlation between anindividual’s tendency of acting, thinking, or feeling towardthe group and group’s tendency of acting, thinking, orfeeling toward the individual. Dyadic reciprocity is acorrelation between the individual relationship effects,which represent the individual’s specific tendency to directan action, thought, or feeling toward another individual(Lashley & Bond, 1997). The main drawback of thismethod is that it only detects levels of association butnot differences in magnitude. Nevertheless, Holmes (2002)and Reis (2007) have pointed out that relationship researchshould be focussed on the dyadic forces that generateinterpersonal behaviour. A possible solution is to applythe skew-symmetry index, Φ, (Solanas et al., 2006) tointerpersonal perceptions among group members. Thisindex considers discrepancies between group membersand it can be generalized to scores obtained in anassessment questionnaire where group members’ perceptionabout the contribution of their partners on a group task isassessed.
Apart from the mean Euclidean distance, all theabovementioned indices follow an individualistic approachsince the primary measures used for computing them areindividual scores which are aggregated to obtain the indicesthemselves. Considering the most frequently used indicesabovementioned, their limitations, and the results regardingteam performance prediction, the aim of the present studyis to propose dyadic indices to measure group characteristics.That is, to measure group’ characteristics from aninterdependent approach instead of a cumulative amountof characteristics. In the present study, traditional (TPEand TPD) and dyadic indices are applied to explore thepercentage of group outcome prediction. Specifically, skew-symmetry index is applied to quantify interpersonalperceptions and a new index is proposed to quantify group
personality dissimilarity. In the next section these indicesare briefly introduced, since these measures are not yetconventional.
Group personality dissimilarity and Skew-symmetryindices
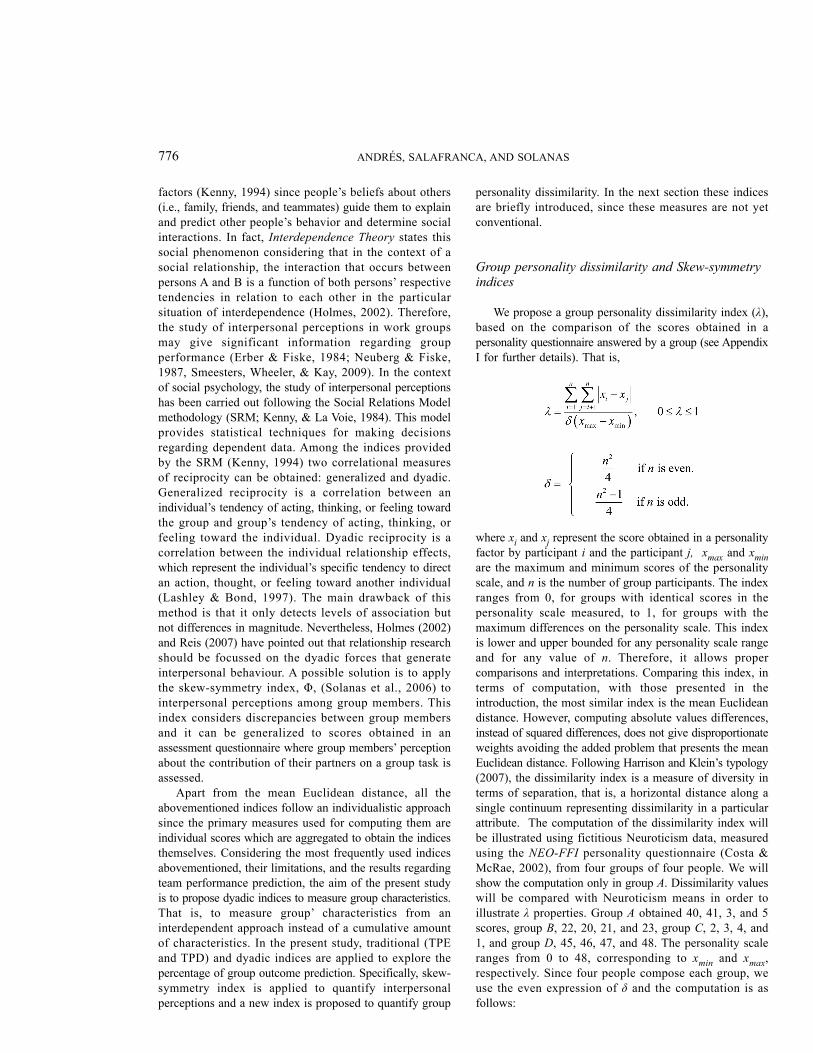
We propose a group personality dissimilarity index (λ),based on the comparison of the scores obtained in apersonality questionnaire answered by a group (see AppendixI for further details). That is,
where xi and xj represent the score obtained in a personalityfactor by participant i and the participant j, xmax and xmin
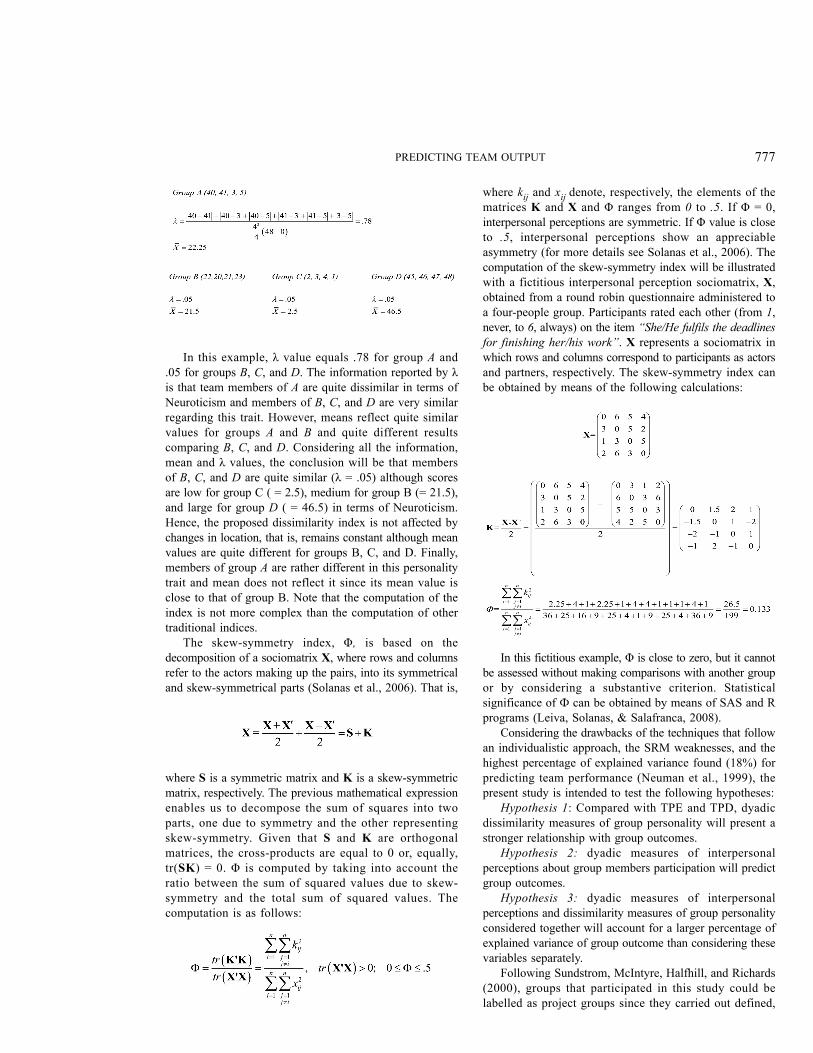
are the maximum and minimum scores of the personalityscale, and n is the number of group participants. The indexranges from 0, for groups with identical scores in thepersonality scale measured, to 1, for groups with themaximum differences on the personality scale. This indexis lower and upper bounded for any personality scale rangeand for any value of n. Therefore, it allows propercomparisons and interpretations. Comparing this index, interms of computation, with those presented in theintroduction, the most similar index is the mean Euclideandistance. However, computing absolute values differences,instead of squared differences, does not give disproportionateweights avoiding the added problem that presents the meanEuclidean distance. Following Harrison and Klein’s typology(2007), the dissimilarity index is a measure of diversity interms of separation, that is, a horizontal distance along asingle continuum representing dissimilarity in a particularattribute. The computation of the dissimilarity index willbe illustrated using fictitious Neuroticism data, measuredusing the NEO-FFI personality questionnaire (Costa &McRae, 2002), from four groups of four people. We willshow the computation only in group A. Dissimilarity valueswill be compared with Neuroticism means in order toillustrate λ properties. Group A obtained 40, 41, 3, and 5scores, group B, 22, 20, 21, and 23, group C, 2, 3, 4, and1, and group D, 45, 46, 47, and 48. The personality scaleranges from 0 to 48, corresponding to xmin and xmax,respectively. Since four people compose each group, weuse the even expression of δ and the computation is asfollows:
ANDRÉS, SALAFRANCA, AND SOLANAS776
In this example, λ value equals .78 for group A and.05 for groups B, C, and D. The information reported by λis that team members of A are quite dissimilar in terms ofNeuroticism and members of B, C, and D are very similarregarding this trait. However, means reflect quite similarvalues for groups A and B and quite different resultscomparing B, C, and D. Considering all the information,mean and λ values, the conclusion will be that membersof B, C, and D are quite similar (λ = .05) although scoresare low for group C ( = 2.5), medium for group B (= 21.5),and large for group D ( = 46.5) in terms of Neuroticism.Hence, the proposed dissimilarity index is not affected bychanges in location, that is, remains constant although meanvalues are quite different for groups B, C, and D. Finally,members of group A are rather different in this personalitytrait and mean does not reflect it since its mean value isclose to that of group B. Note that the computation of theindex is not more complex than the computation of othertraditional indices.
The skew-symmetry index, Φ, is based on thedecomposition of a sociomatrix X, where rows and columnsrefer to the actors making up the pairs, into its symmetricaland skew-symmetrical parts (Solanas et al., 2006). That is,
where S is a symmetric matrix and K is a skew-symmetricmatrix, respectively. The previous mathematical expressionenables us to decompose the sum of squares into twoparts, one due to symmetry and the other representingskew-symmetry. Given that S and K are orthogonalmatrices, the cross-products are equal to 0 or, equally,tr(SK) = 0. Φ is computed by taking into account theratio between the sum of squared values due to skew-symmetry and the total sum of squared values. Thecomputation is as follows:
where kij and xij denote, respectively, the elements of thematrices K and X and Φ ranges from 0 to .5. If Φ = 0,interpersonal perceptions are symmetric. If Φ value is closeto .5, interpersonal perceptions show an appreciableasymmetry (for more details see Solanas et al., 2006). Thecomputation of the skew-symmetry index will be illustratedwith a fictitious interpersonal perception sociomatrix, X,obtained from a round robin questionnaire administered toa four-people group. Participants rated each other (from 1,never, to 6, always) on the item “She/He fulfils the deadlines
for finishing her/his work”. X represents a sociomatrix inwhich rows and columns correspond to participants as actorsand partners, respectively. The skew-symmetry index canbe obtained by means of the following calculations:
In this fictitious example, Φ is close to zero, but it cannotbe assessed without making comparisons with another groupor by considering a substantive criterion. Statisticalsignificance of Ф can be obtained by means of SAS and Rprograms (Leiva, Solanas, & Salafranca, 2008).
Considering the drawbacks of the techniques that followan individualistic approach, the SRM weaknesses, and thehighest percentage of explained variance found (18%) forpredicting team performance (Neuman et al., 1999), thepresent study is intended to test the following hypotheses:
Hypothesis 1: Compared with TPE and TPD, dyadicdissimilarity measures of group personality will present astronger relationship with group outcomes.
Hypothesis 2: dyadic measures of interpersonalperceptions about group members participation will predictgroup outcomes.
Hypothesis 3: dyadic measures of interpersonalperceptions and dissimilarity measures of group personalityconsidered together will account for a larger percentage ofexplained variance of group outcome than considering thesevariables separately.
Following Sundstrom, McIntyre, Halfhill, and Richards(2000), groups that participated in this study could belabelled as project groups since they carried out defined,
PREDICTING TEAM OUTPUT 777
specialized, time limited projects, and disbanded afterfinishing, that is, they carried out a specific agreement task,during limited time, and disbanded after finishing.
Method
Participants
64 under-graduate Psychology students, 25% men and75% women, formed 16 groups of 4 people. The medianand semi-interquartile range of age were 20 and 2,respectively. All the participants were members of the sameuniversity and received 30 USD for their collaboration.
Instruments
Foundation Task
The Foundation Task (Watson, 1987) is a problem solvingtask where participants have to integrate information to reacha solution to a problem taking the role of a person who hasinherited an amount of money and allocating part or thewhole amount of this money to some proposals accordingto personal values. This task was chosen due to Deutsch’sresearch in 1951 (cited in Morris, 1966) where he foundthat groups were more active when discussing humanproblems, for which there is no single correct answer, thanwhen solving a mathematical problem, for which there areunique answers. Considering that groups have not met before,the resolution of the Foundation Task provided participantswith a pre-task situation that allowed them to start interactingwith each other. Furthermore, interaction was enhancedrequiring a report from each group summarizing theconclusions reached. Although this task has been traditionallyused to study group decision strategies, in the present researchthe Foundation Task’s final aim was to help participants toget accustomed to the methodology of the task: taking groupdecisions and allowing them to show each other theircontribution as a group member. Since the present study isrelated to groups, only section III of the Foundation Taskwas applied. The main characteristic of this part is that it isa group activity where participants have to behave as a groupto allocate an amount of money to some fictitious projects.
Dilemmas dossier
The dilemmas dossier consisted of 20 discussion textsconcerning social issues in which participants had to reachagreements to decide how to solve a problem. For eachone, three solutions were proposed. Two of them wereopposite (e.g., solution 1 proposes “A” and solution 2proposes “no A”). The third one was “we do not agree”and it was the same in all dilemmas. The third option wasincluded in order to prevent groups collapse in a dilemma
and provide them a solution to step to the next dilemma.In this task, the objective was to reach as many agreementsas they could. An example of the dilemmas task is presentedbellow and the dossier is available on request,
“Ramón Sampedro’s case caused an enormous uproar in our
country. After spending years completely motionless on the bed
and fight legally to apply active euthanasia, he got someone to
provide the means to help him die. He decided that his death was
videotaped as an example of his fight for euthanasia.
Under Spanish law was not clear whether this fact should be
considered as active euthanasia or assisted suicide, but there
was the fact that both acts are punished in our country. For this
reason, there was a legal investigation to find the person who
had helped him. After a while, they stopped the investigation since
there was no evidence to implicate anyone. Spanish public opinion
followed the case through the media, which were settled controversy
among supporters of the action of Sampedro and among its critics,
who claimed that it was a homicide, although the victim consented.
If you had been a relative or a close friend of Ramón
Sampedro, and he had asked you repeatedly to help him die, what
would you have done?
• We would have helped him …
• We would not have helped him ...
• No agreement…”
NEO-FFI
NEO-FFI is a reduced form of NEO PI-R questionnaire.It has 60 items and is based on the S form of the originalNEO PI-R questionnaire. It consists of 5 scales of 12 itemseach that measure The Big Five factors of personalityOpenness, Conscientiousness, Extraversion, Agreeableness,
and Neuroticism (Costa & McRae, 2002).
Task Evaluation Questionnaire
Following the methodology of other authors of this researchtradition (Cook, 2005; Kenny, Mannetti, Pierro, Levi, & Kashy,2002), a task evaluation questionnaire was created (AppendixII). The main objective of the questionnaire was to obtaininformation about how participants perceived each other inrelation to how they contributed to solve the task, in otherwords, how their teammates performed in the task. It consistedof 7 items scored on a six-point Likert scale related todistribution of time, work method, decision making, informationfitting, and communication style. These aspects are commonlymeasured in employee behaviour research (Williams &Anderson, 1991). Participants had to rate each other excludingthemselves (round robin), that is, each participant had onequestionnaire with all group member names except their ownand he/she had to give a score on each one of the items of
ANDRÉS, SALAFRANCA, AND SOLANAS778
the test. Pooling the four questionnaires, an interpersonalperceptions sociomatrix could be constructed for each item.
Procedure
During the first month of the course, students wereinvited to participate in the study using a specific researchboard in where they are used to register to participate inthe experiments and studies offered in the faculty. Theyregistered and enrolled in groups of four people to carryout several activities in a laboratory. Once the groups werein the laboratory, participants were informed about the mainpurposes of the research and they signed the consent form.The session lasted two hours and it was divided into twoparts. During the first part, they had to solve the Foundation
Task and fill in the NEO-FFI personality questionnaire.They had 45 minutes for reasoning how to solve theFoundation Task, interacting with each other, and writingone page reporting their conclusions. After this activity,they were given the NEO-FFI; they had 15 minutes toanswer this questionnaire. They had a break of ten minutesbefore the second part started. In this second part, theywere given the dilemmas dossier and they had 45 minutesto reach as many agreements as they could. When timewas up, they had 15 minutes for filling in the task evaluationquestionnaire where they could score their teammates’performance on the second part of the task.
Data analysis
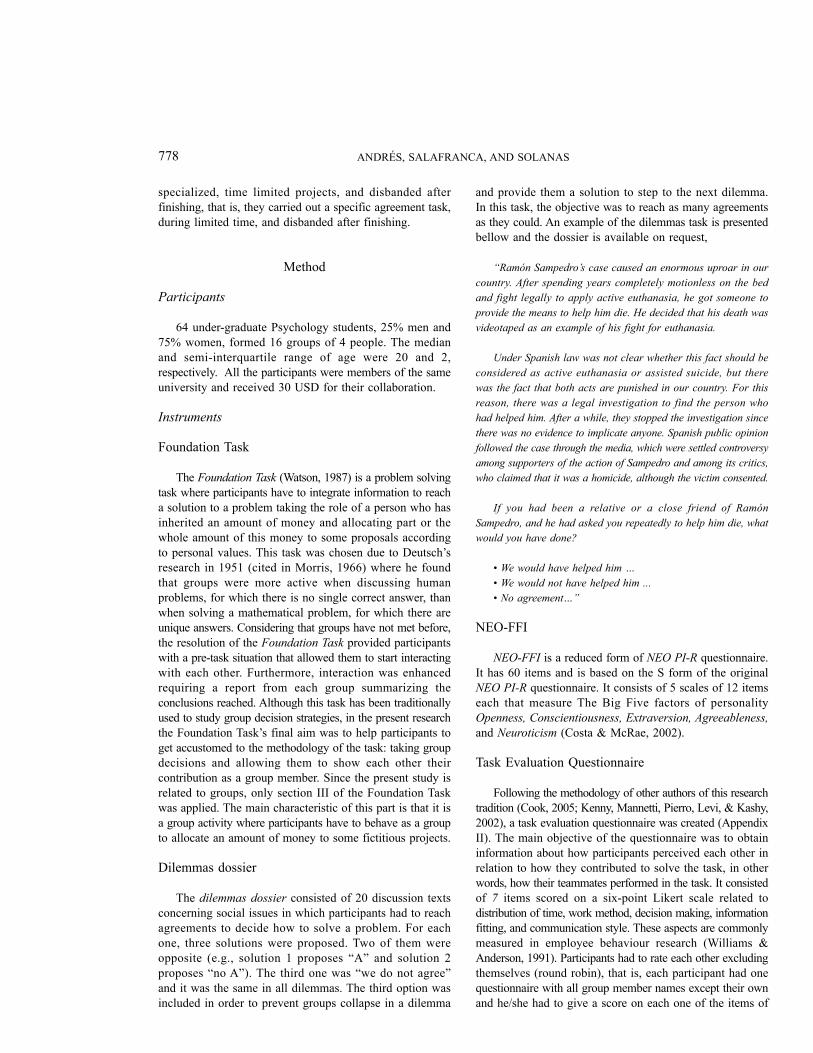
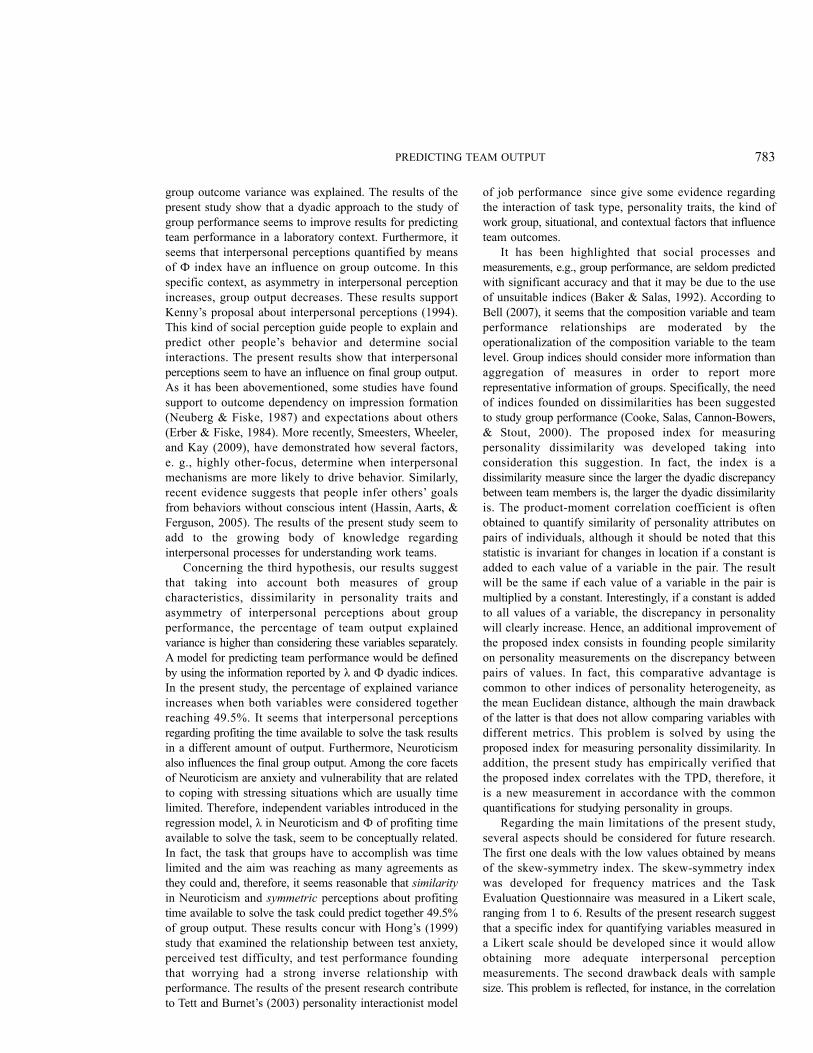
TPE, TPD, and dissimilarity indices of each personalityfactor were computed for all the groups using the scores ofthe NEO-FFI questionnaire. The skew-symmetry index wascalculated for each item using the rates on the task evaluationquestionnaire. The number of agreements obtained in thedilemmas dossier was taken as a measure of group outcome.A correlational analysis was performed to obtain the degreeof association between the TPE, TPD, dissimilarity, skew-symmetry values, and the number of agreements in orderto explore whether measures of interpersonal perceptionsand personality were related to group outcome. As a resultof this analysis, several linear regression analyses were carriedout in order to test the three hypotheses of the present study:to test the first hypothesis, two regression analyses werecarried out to show the contribution of personality indicesto predict group outcome; the second hypothesis was testedconducting a regression analysis using Ф values to showthe contribution of these values to the explanation of groupperformance variability; the third hypothesis was testedconsidering personality measures and Ф values that appearedas significant for testing hypotheses 1 and 2. The numberof agreements obtained in the second part of the session(dilemmas task) was used as dependent variable in allanalyses. A summary of the procedure and data analyses isshown in Figure 1.
PREDICTING TEAM OUTPUT 779
Foundation Task
45 minutes
NEO-FFI
15 minutes
BREAK
10 minutes
DILEMMAS
DOSSIER
45 minutes
TASK
EVALUATION
QUESTIONNAIRE
15 minutes
START
END
Indices computed: -Aim: warm-up task.
Indices computed: TPD, TPE, and dissimilarityindex (λ) for each personality trait.Aim: obtain personality measurements by meansof individual indices and the new dyadic indexproposed.
Aim: avoid tiredness.
Measures: number of agreements obtained as agroup.Aim: obtain a quantification of team outcome.
Indices computed: Skew-symmetry indices foreach item (Фi)Aim: quantify interpersonal perceptions of teammembers by means of a dyadic index.
Measurements for testing hypotheses 1 and 3.TPD and λ were introduced in the regressionanalyses as independent variables.
The number of agreements was taken as anindicator of group performance and wasintroduced as dependent variable in the regressionanalyses for testing hypotheses 1, 2, and 3.
Measurements for testing hypotheses 2 and 3. Фivalues were introduced as independent variablesin the regression analyses.
Figure 1. Procedure and data analyses summary.
PROCEDURE DATA ANALYSIS
Explanation of the study and consent form signature
Results
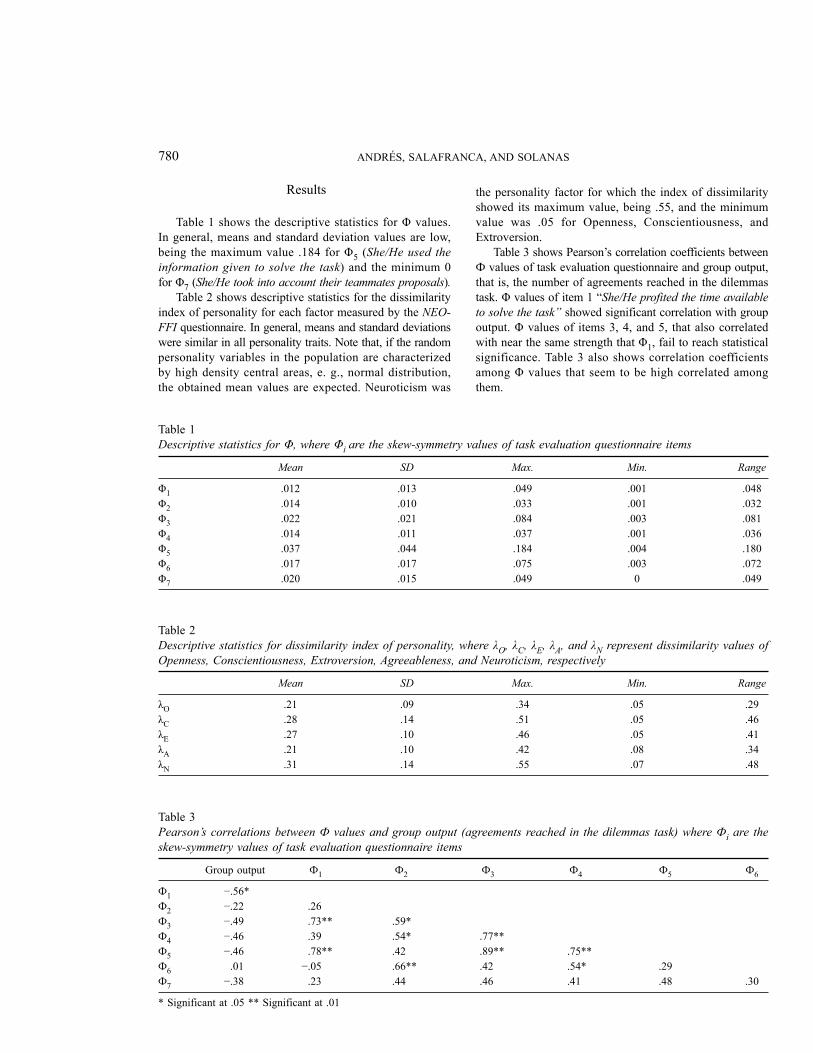
Table 1 shows the descriptive statistics for Φ values.In general, means and standard deviation values are low,being the maximum value .184 for Φ5 (She/He used the
information given to solve the task) and the minimum 0for Φ7 (She/He took into account their teammates proposals).
Table 2 shows descriptive statistics for the dissimilarityindex of personality for each factor measured by the NEO-
FFI questionnaire. In general, means and standard deviationswere similar in all personality traits. Note that, if the randompersonality variables in the population are characterizedby high density central areas, e. g., normal distribution,the obtained mean values are expected. Neuroticism was
the personality factor for which the index of dissimilarityshowed its maximum value, being .55, and the minimumvalue was .05 for Openness, Conscientiousness, andExtroversion.
Table 3 shows Pearson’s correlation coefficients betweenФ values of task evaluation questionnaire and group output,that is, the number of agreements reached in the dilemmastask. Φ values of item 1 “She/He profited the time available
to solve the task” showed significant correlation with groupoutput. Φ values of items 3, 4, and 5, that also correlatedwith near the same strength that Φ1, fail to reach statisticalsignificance. Table 3 also shows correlation coefficientsamong Φ values that seem to be high correlated amongthem.
ANDRÉS, SALAFRANCA, AND SOLANAS780
Table 1Descriptive statistics for Φ, where Φi are the skew-symmetry values of task evaluation questionnaire items
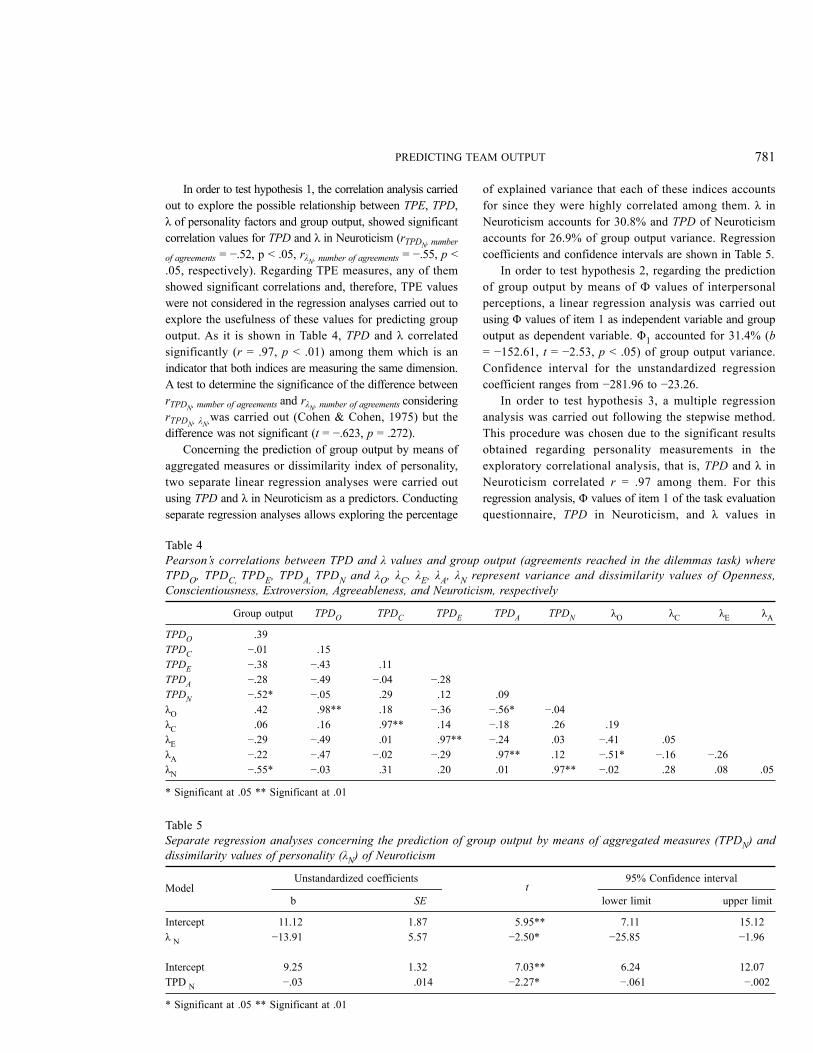
In order to test hypothesis 1, the correlation analysis carriedout to explore the possible relationship between TPE, TPD,λ of personality factors and group output, showed significantcorrelation values for TPD and λ in Neuroticism (rTPDN, number
of agreements = −.52, p < .05, rλN, number of agreements = −.55, p <.05, respectively). Regarding TPE measures, any of themshowed significant correlations and, therefore, TPE valueswere not considered in the regression analyses carried out toexplore the usefulness of these values for predicting groupoutput. As it is shown in Table 4, TPD and λ correlatedsignificantly (r = .97, p < .01) among them which is anindicator that both indices are measuring the same dimension.A test to determine the significance of the difference betweenrTPDN, number of agreements and rλN, number of agreements consideringrTPDN, λN,was carried out (Cohen & Cohen, 1975) but thedifference was not significant (t = −.623, p = .272).
Concerning the prediction of group output by means ofaggregated measures or dissimilarity index of personality,two separate linear regression analyses were carried outusing TPD and λ in Neuroticism as a predictors. Conductingseparate regression analyses allows exploring the percentage
of explained variance that each of these indices accountsfor since they were highly correlated among them. λ inNeuroticism accounts for 30.8% and TPD of Neuroticismaccounts for 26.9% of group output variance. Regressioncoefficients and confidence intervals are shown in Table 5.
In order to test hypothesis 2, regarding the predictionof group output by means of Ф values of interpersonalperceptions, a linear regression analysis was carried outusing Φ values of item 1 as independent variable and groupoutput as dependent variable. Φ1 accounted for 31.4% (b= −152.61, t = −2.53, p < .05) of group output variance.Confidence interval for the unstandardized regressioncoefficient ranges from −281.96 to −23.26.
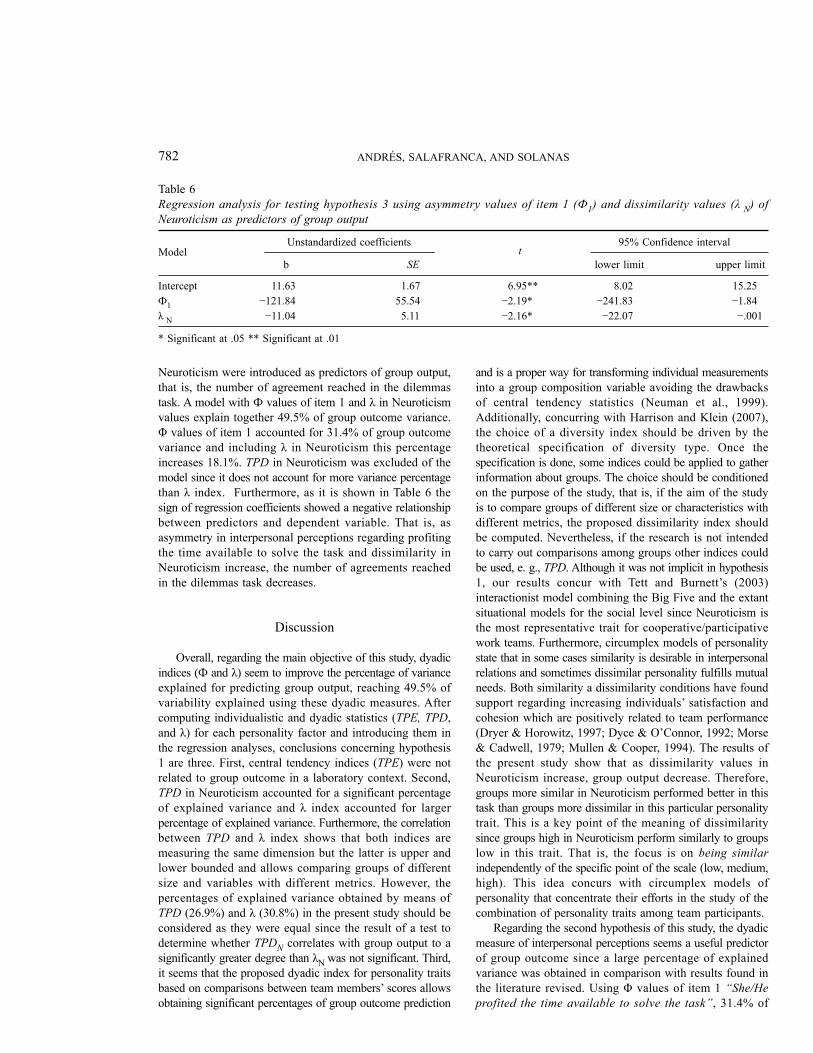
In order to test hypothesis 3, a multiple regressionanalysis was carried out following the stepwise method.This procedure was chosen due to the significant resultsobtained regarding personality measurements in theexploratory correlational analysis, that is, TPD and λ inNeuroticism correlated r = .97 among them. For thisregression analysis, Φ values of item 1 of the task evaluationquestionnaire, TPD in Neuroticism, and λ values in
PREDICTING TEAM OUTPUT 781
Table 4Pearson’s correlations between TPD and λ values and group output (agreements reached in the dilemmas task) where
TPDO, TPDC, TPDE, TPDA, TPDN and λO, λC, λE, λA, λN represent variance and dissimilarity values of Openness,
Conscientiousness, Extroversion, Agreeableness, and Neuroticism, respectively
Neuroticism were introduced as predictors of group output,that is, the number of agreement reached in the dilemmastask. A model with Ф values of item 1 and λ in Neuroticismvalues explain together 49.5% of group outcome variance.Φ values of item 1 accounted for 31.4% of group outcomevariance and including λ in Neuroticism this percentageincreases 18.1%. TPD in Neuroticism was excluded of themodel since it does not account for more variance percentagethan λ index. Furthermore, as it is shown in Table 6 thesign of regression coefficients showed a negative relationshipbetween predictors and dependent variable. That is, asasymmetry in interpersonal perceptions regarding profitingthe time available to solve the task and dissimilarity inNeuroticism increase, the number of agreements reachedin the dilemmas task decreases.
Discussion
Overall, regarding the main objective of this study, dyadicindices (Ф and λ) seem to improve the percentage of varianceexplained for predicting group output, reaching 49.5% ofvariability explained using these dyadic measures. Aftercomputing individualistic and dyadic statistics (TPE, TPD,and λ) for each personality factor and introducing them inthe regression analyses, conclusions concerning hypothesis1 are three. First, central tendency indices (TPE) were notrelated to group outcome in a laboratory context. Second,TPD in Neuroticism accounted for a significant percentageof explained variance and λ index accounted for largerpercentage of explained variance. Furthermore, the correlationbetween TPD and λ index shows that both indices aremeasuring the same dimension but the latter is upper andlower bounded and allows comparing groups of differentsize and variables with different metrics. However, thepercentages of explained variance obtained by means ofTPD (26.9%) and λ (30.8%) in the present study should beconsidered as they were equal since the result of a test todetermine whether TPDN correlates with group output to asignificantly greater degree than λN was not significant. Third,it seems that the proposed dyadic index for personality traitsbased on comparisons between team members’ scores allowsobtaining significant percentages of group outcome prediction
and is a proper way for transforming individual measurementsinto a group composition variable avoiding the drawbacksof central tendency statistics (Neuman et al., 1999).Additionally, concurring with Harrison and Klein (2007),the choice of a diversity index should be driven by thetheoretical specification of diversity type. Once thespecification is done, some indices could be applied to gatherinformation about groups. The choice should be conditionedon the purpose of the study, that is, if the aim of the studyis to compare groups of different size or characteristics withdifferent metrics, the proposed dissimilarity index shouldbe computed. Nevertheless, if the research is not intendedto carry out comparisons among groups other indices couldbe used, e. g., TPD. Although it was not implicit in hypothesis1, our results concur with Tett and Burnett’s (2003)interactionist model combining the Big Five and the extantsituational models for the social level since Neuroticism isthe most representative trait for cooperative/participativework teams. Furthermore, circumplex models of personalitystate that in some cases similarity is desirable in interpersonalrelations and sometimes dissimilar personality fulfills mutualneeds. Both similarity a dissimilarity conditions have foundsupport regarding increasing individuals’ satisfaction andcohesion which are positively related to team performance(Dryer & Horowitz, 1997; Dyce & O’Connor, 1992; Morse& Cadwell, 1979; Mullen & Cooper, 1994). The results ofthe present study show that as dissimilarity values inNeuroticism increase, group output decrease. Therefore,groups more similar in Neuroticism performed better in thistask than groups more dissimilar in this particular personalitytrait. This is a key point of the meaning of dissimilaritysince groups high in Neuroticism perform similarly to groupslow in this trait. That is, the focus is on being similar
independently of the specific point of the scale (low, medium,high). This idea concurs with circumplex models ofpersonality that concentrate their efforts in the study of thecombination of personality traits among team participants.
Regarding the second hypothesis of this study, the dyadicmeasure of interpersonal perceptions seems a useful predictorof group outcome since a large percentage of explainedvariance was obtained in comparison with results found inthe literature revised. Using Φ values of item 1 “She/He
profited the time available to solve the task”, 31.4% of
ANDRÉS, SALAFRANCA, AND SOLANAS782
Table 6Regression analysis for testing hypothesis 3 using asymmetry values of item 1 (Ф1) and dissimilarity values (λ N) of
group outcome variance was explained. The results of thepresent study show that a dyadic approach to the study ofgroup performance seems to improve results for predictingteam performance in a laboratory context. Furthermore, itseems that interpersonal perceptions quantified by meansof Ф index have an influence on group outcome. In thisspecific context, as asymmetry in interpersonal perceptionincreases, group output decreases. These results supportKenny’s proposal about interpersonal perceptions (1994).This kind of social perception guide people to explain andpredict other people’s behavior and determine socialinteractions. The present results show that interpersonalperceptions seem to have an influence on final group output.As it has been abovementioned, some studies have foundsupport to outcome dependency on impression formation(Neuberg & Fiske, 1987) and expectations about others(Erber & Fiske, 1984). More recently, Smeesters, Wheeler,and Kay (2009), have demonstrated how several factors,e. g., highly other-focus, determine when interpersonalmechanisms are more likely to drive behavior. Similarly,recent evidence suggests that people infer others’ goalsfrom behaviors without conscious intent (Hassin, Aarts, &Ferguson, 2005). The results of the present study seem toadd to the growing body of knowledge regardinginterpersonal processes for understanding work teams.
Concerning the third hypothesis, our results suggestthat taking into account both measures of groupcharacteristics, dissimilarity in personality traits andasymmetry of interpersonal perceptions about groupperformance, the percentage of team output explainedvariance is higher than considering these variables separately.A model for predicting team performance would be definedby using the information reported by λ and Ф dyadic indices.In the present study, the percentage of explained varianceincreases when both variables were considered togetherreaching 49.5%. It seems that interpersonal perceptionsregarding profiting the time available to solve the task resultsin a different amount of output. Furthermore, Neuroticismalso influences the final group output. Among the core facetsof Neuroticism are anxiety and vulnerability that are relatedto coping with stressing situations which are usually timelimited. Therefore, independent variables introduced in theregression model, λ in Neuroticism and Ф of profiting timeavailable to solve the task, seem to be conceptually related.In fact, the task that groups have to accomplish was timelimited and the aim was reaching as many agreements asthey could and, therefore, it seems reasonable that similarity
in Neuroticism and symmetric perceptions about profitingtime available to solve the task could predict together 49.5%of group output. These results concur with Hong’s (1999)study that examined the relationship between test anxiety,perceived test difficulty, and test performance foundingthat worrying had a strong inverse relationship withperformance. The results of the present research contributeto Tett and Burnet’s (2003) personality interactionist model
of job performance since give some evidence regardingthe interaction of task type, personality traits, the kind ofwork group, situational, and contextual factors that influenceteam outcomes.
It has been highlighted that social processes andmeasurements, e.g., group performance, are seldom predictedwith significant accuracy and that it may be due to the useof unsuitable indices (Baker & Salas, 1992). According toBell (2007), it seems that the composition variable and teamperformance relationships are moderated by theoperationalization of the composition variable to the teamlevel. Group indices should consider more information thanaggregation of measures in order to report morerepresentative information of groups. Specifically, the needof indices founded on dissimilarities has been suggestedto study group performance (Cooke, Salas, Cannon-Bowers,& Stout, 2000). The proposed index for measuringpersonality dissimilarity was developed taking intoconsideration this suggestion. In fact, the index is adissimilarity measure since the larger the dyadic discrepancybetween team members is, the larger the dyadic dissimilarityis. The product-moment correlation coefficient is oftenobtained to quantify similarity of personality attributes onpairs of individuals, although it should be noted that thisstatistic is invariant for changes in location if a constant isadded to each value of a variable in the pair. The resultwill be the same if each value of a variable in the pair ismultiplied by a constant. Interestingly, if a constant is addedto all values of a variable, the discrepancy in personalitywill clearly increase. Hence, an additional improvement ofthe proposed index consists in founding people similarityon personality measurements on the discrepancy betweenpairs of values. In fact, this comparative advantage iscommon to other indices of personality heterogeneity, asthe mean Euclidean distance, although the main drawbackof the latter is that does not allow comparing variables withdifferent metrics. This problem is solved by using theproposed index for measuring personality dissimilarity. Inaddition, the present study has empirically verified thatthe proposed index correlates with the TPD, therefore, itis a new measurement in accordance with the commonquantifications for studying personality in groups.
Regarding the main limitations of the present study,several aspects should be considered for future research.The first one deals with the low values obtained by meansof the skew-symmetry index. The skew-symmetry indexwas developed for frequency matrices and the TaskEvaluation Questionnaire was measured in a Likert scale,ranging from 1 to 6. Results of the present research suggestthat a specific index for quantifying variables measured ina Likert scale should be developed since it would allowobtaining more adequate interpersonal perceptionmeasurements. The second drawback deals with samplesize. This problem is reflected, for instance, in the correlation
PREDICTING TEAM OUTPUT 783
between Φ5 and the number of agreements reached in thedilemmas task, which correlate nearly with the same strengthas Φ1 with agreements reached in the dilemmas task, butfail to reach statistical significance. These results suggestthat more Φ values would appear as significant if samplesize is increased. Sample size problem is also shown bythe range of regression coefficients’ confidence intervals;increasing sample size, parameter estimation would be moreaccurate. Sample size also limits the strength of theconclusions regarding the techniques applied to test thehypotheses of the present study. However, following Cohen(1988), post hoc power tests were carried out for productmoment r of hypotheses 1 and 2 and for the multipleregression analysis for testing hypothesis 3. Results forthe product moment r (hypotheses 1 and 2) for rλN, number of
agreements = −.55, rTPDN, number of agreements = −.52, and rΦ1,
number of agreements = −.56 showed power values between .53and .73 (for a = .05 and n = 16). Results for multipleregression showed that with an R2 = .49, n = 16, and, twoindependent variables, for a = .05, the power of the F testranges between .88 and .92. Another limitation of the presentresearch is related to ecological validity since the studyhas been carried out under a quite controlled situation in alaboratory context with undergraduate students. This contextlimits the scope of the results which should be interpretedin a preliminary way. In this sense, although social dilemmagames have been widely applied in social psychologyresearch (e. g., Hertel & Fiedler, 1994; Kay & Ross, 2003;Utz, Ouwerkerk, & Van Lange, 2004) to study cooperativedecision-making behavior, choosing an unique criterion ofgroup output (the number of agreements reached in thedilemmas task) limits the scope of the present results. Infuture studies, both qualitative and quantitative criteria shouldbe taken to represent group output.
The proposed index for measuring dissimilarity inpersonality should be developed in future research in severalfeatures. Firstly, the index must be defined in a generalform, that is, it should be conjointly applied for an arbitrarynumber of personality scales and thus enabling researchersto estimate specific personality scales contributions. Secondly,dyadic and individual effects should be extracted to suitablyanalyse data at all levels. Moreover, the analytical procedurefor extracting dyadic and individual contributions todissimilarity is not feasible for the mean Euclidean distance.Thirdly, statistical decision methods are necessary at allanalysis levels to make proper conclusions, that is, statisticalprocedures should be developed in order to test hypothesisregarding dissimilarity in personality.
Finally, the present study shows that the quantificationof group characteristics by means of dyadic methods resultsin a larger percentage of group performance prediction.Furthermore, a dissimilarity index for quantifying personalityin groups is proposed. Future research should focus onapplied contexts and larger samples to confirm that thedyadic approach is useful outside the laboratory. Moreover,
other kind of groups (e. g., action teams, service teams)should be considered in future research in order to explorethe usefulness of these dyadic indices with not decisionmaking teams. The improvement in group performancedegree of prediction should be replicated in natural settingssince the obtained results cannot be directly generalized touncontrolled environments. In fact, although the study wasdesigned to resemble a natural interaction framework asmuch as possible, the participants were volunteers and theassessment procedure departed from realistic situations inwork teams. Hence, further research is needed to test thehypotheses of the present study in natural settings.
References
Anderson, M. G., & Tett, R. P. (2006, May). Who prefers to work
with whom? Trait activation in classroom teams. Paperpresented at the 21st Annual Conference of the Society forIndustrial and Organizational Psychology, Dallas, TX.
Arthur, W., Jr., Bell, S. T., & Edwards, B. D. (2007). A longitudinalexamination of the comparative criterion-related validity ofadditive and referent-shift consensus operationalizations ofteam efficacy. Organizational Research Methods, 10, 35-58.doi:10.1177/1094428106287574
Baker, D. P., & Salas, E. (1992). Principles for measuring teamworkskills. Human Factors, 34, 469-475.
Barrick, M. R., Stewart, G. L., Neubert, M. J., & Mount M. K.(1998). Relating member ability and personality to work-teamprocesses and team effectiveness. Journal of Applied
Psychology, 83, 377-391. doi:10.1037/0021-9010.83.3.377Bell, S. T. (2007). Deep-level composition variables as predictors
of team performance: A meta-analysis. Journal of Applied
Psychology, 92, 595-615. doi:10.1037/0021-9010.92.3.595Biemann, T., & Kearney, E. (2009). Size does matter: How varying
group sizes in a sample affect the most common measures ofgroup diversity. Academy of Management Proceedings, 1-6.doi:10.1177/1094428109338875
Bolin, A. U., & Neuman, G. A. (2006). Personality, process, andperformance in interactive brainstorming groups. Journal of
Business & Psychology, 20, 565-585. doi:10.1007/s10869-005-9000-7
Cohen, J. (1988). Statistical power analysis for the behavioral
sciences. Hillsdale N.J.: Lawrence Erlbaum Associates. Cohen, J., & Cohen, P. (1975). Applied multiple regression/correlation
analysis for the behavioural sciences. Hillsdale, NJ: LawrenceErlbaum Associates.
Cook, W. L. (2005). The SRM approach to family assessment:An introduction and case example. European Journal of
Cooke, N. J., Salas, E., Cannon-Bowers, J. A., & Stout, R. J. (2000).Measuring team knowledge. Human Factors, 42, 151-173.
Costa, P. T., Jr., & McRae, R. R. (2002). Manual NEO PI-R.
Madrid, Spain: Tea Ediciones.
ANDRÉS, SALAFRANCA, AND SOLANAS784
Cummings, J. N., & Cross, R. (2003). Structural properties ofwork groups and their consequences for performance. Social
Networks, 25, 197-210. doi:10.1016/S0378-8733(02)00049-7Dryer, D. C., & Horowitz, L. M. (1997). When do opposites attract?
Interpersonal complementarity versus similarity. Journal of
Personality and Social Psychology, 72, 592-603. doi:10.1037/0022-3514.72.3.592
Dyce, J., & O’Connor, B. P. (1992). Personality complementarityas a determinant of cohesion in bar bands. Small Group
Research, 23, 185-198. doi:10.1177/1046496492232003Elfenbein, H. A., & O’Reilly, C. A., III. (2007). Fitting in: The
effects of relational demography and person-culture fit ongroup process and performance. Group & Organization
Management, 32, 109-142. doi:10.1177/1059601106286882Erber, R., & Fiske, S. T. (1984). Outcome dependency and attention
to inconsistent information. Journal of Personality and Social
Psychology, 47, 709-726. doi:10.1037/0022-3514.47.4.709Halfhill, T., Sundstrom, E., Lahner, J., Calderone, W., & Nielsen,
T. M. (2005). Group personality composition and groupeffectiveness: An integrative review of empirical research. Small
Group Research, 36, 83-105. doi:10.1177/1046496404268538Harrison, D. A., & Klein, K. J. (2007). What’s the difference?
Diversity constructs as separation, variety, or disparity inorganizations. Academy of Management Review, 32, 1199-1228.
Hassin, R. R., Aarts, H., & Ferguson, M. J. (2005). Automaticgoal inferences. Journal of Experimental Social Psychology,
41, 129-140. doi:10.1016/j.jesp.2004.06.008Hertel, G., & Fiedler, K. (1994). Affective and cognitive influences
in a social dilemma game. European Journal of Social
Psychology, 13, 131-145. doi:10.1002/ejsp.2420240110Hollingshead, A. B., McGrath, J. E., & O’Connor, K. M. (1993).
Group task performance and communication technology: Alongitudinal study of computer-mediated versus face-to-facework groups. Small Group Research, 24, 307-333. doi:10.1177/1046496493243003
Holmes, J. G. (2002). Interpersonal expectations as the buildingblocks of social cognition: An interdependence theoryperspective. Personal Relationships, 9, 1-26. doi:10.1111/1475-6811.00001
Hong, E. (1999). Test anxiety, perceived test difficulty, and testperformance: Temporal patterns of their effects. Learning and
Hough, L. M. (1992). The ‘big five’ personality variables-constructconfusion: Description versus prediction. Human Performance,
5, 139-154. doi:10.1207/s15327043hup0501&2_8Jackson, S. E., Brett, J. F., Sessa, V. I., Cooper, D. M. Julin, J.A.,
& Peyronnin, K. (1991). Some differences make a difference:Individual dissimilarity and group heterogeneity as correlatesof recruitment, promotions, and turnover. Journal of Applied
Psychology, 76, 675-689. doi:10.1037/0021-9010.76.5.675Kay, A. C., & Ross, L. (2003). The perceptual push: The interplay
of implicit cues and explicit situational construals on behavioralintentions in the prisoner’s dilemma. Journal of Experimental
Social Psychology,39, 634-643. doi:10.1016/S0022-1031(03)00057-X
Kenny, D. A. (1994). Interpersonal perception. A social relations
analysis. New York, NY: The Guilford Press. Kenny, D. A., & La Voie, L. J. (1984). The social relations model.
In L. Berkovitz (Ed.), Advances in experimental psychology
(Vol. 18, pp. 142-182). San Diego, CA: Academic Press. Kenny, D. A., Mannetti, L., Pierro, A., Levi, S., & Kashy, D. A.
(2002). The statistical analysis of data from small groups.Journal of Personality and Social Psychology, 83, 126-137.doi:10.1037/0022-3514.83.1.126
Kozlowski, S. W. J., & Bell, B. S. (2003). Work groups and teamsin organizations. In W. C. Borman & D. R. Ilgen (Eds.),Handbook of psychology: Industrial and organizational
psychology (Vol. 12, pp. 333-375). New York, NY: Wiley. Lashley, B. R., & Bond, C. F., Jr. (1997). Significance testing for
round robin data. Psychological Methods, 2, 278-291.doi:10.1037/1082-989X.2.3.278
Levine, J. M., & Moreland, R. L. (1990). Progress in small groupresearch. Annual Review of Psychology, 41, 585-634.doi:10.1146/annurev.ps.41.020190.003101
Levine, J. M., & Moreland, R. L. (2006). Small groups. New York,NY: Psychology Press.
Leiva, D., Solanas, A., & Salafranca, Ll. (2008). Testing reciprocityin social interactions: A comparison between the directionalconsistency and skew-symmetry statistics. Behavior Research
Methods, 40, 626-634. doi:10.3758/BRM.40.2.626Mohammed, S., Mathieu, J. E., & Bartlett, A. L. (2002). Technical-
administrative task performance, leadership task performance,and contextual performance: Considering the influence of team-and task-related composition variables. Journal of
Organizational Behavior, 23, 795-814. doi:10.1002/job.169Moreland, R. L., & Levine, J. M. (1992). The composition of
small groups. In E. Lawler, B. Markovsky, C. Ridgeway, &H. Walker (Eds.), Advances in group processes (Vol. 9, pp.237-280). Greenwich, CT: JAI Press.
Morris, C. G. (1966). Task effects on group interaction. Journal
of Personality and Social Psychology, 4, 545-554. doi:10.1037/h0023897
Morse, J. J., & Caldwell, D. F. (1979). Effects of personality andperception of the environment on satisfaction with task group.The Journal of Psychology, 103, 183-192. doi:1140-1979-103-02-000005
Mullen, B., & Cooper, C. (1994). The relation between groupcohesiveness and performance: An integration. Psychological
Bulletin, 115, 210-227. doi:10.1037/0033-2909.115.2.210Neuberg, S. L., & Fiske, S. T. (1987). Motivational influences on
impression formation: Outcome dependency, accuracy-drivenattention, and individuating processes. Journal of Personality
and Social Psychology, 53, 431-444. doi:10.1037/0022-3514.53.3.431
Neuman, G. A., Wagner, S. H., & Christiansen, N. D. (1999). Therelationship between work-team personality composition andthe job performance of teams. Group Organization
Management, 24, 28-45.
PREDICTING TEAM OUTPUT 785
O’Reilly, C. A., III, Cadwell, D. F., & Barnett, W. P. (1989). Workgroup demography, social integration, and turnover.Administrative Science Quarterly, 34, 21-37. doi:10.2307/2392984
Peeters, M. A. G., Van Tuijl, H. F. J. M., Rutte, C. G., & Reymen,I. M. M. J. (2006). Personality and team performance: A meta-analysis. European Journal of Personality, 20, 377-396.doi:10.1002/per.588
Reis, H. T. (2007). Steps toward the ripening of relationship science.Personal Relationships, 14, 1-23. doi:10.1111/j.1475-6811.2006.00139.x
Roberson, Q. M., Sturman, M. C., & Simons, T. L. (2007). Doesthe measure of dispersion matter in multilevel research? Acomparison of the relative performance of dispersion indexes.Organizational Research Methods, 10, 564-588.doi:10.1177/1094428106294746
Shannon, C. E. (1948). A mathematical theory of communication.Bell System Technical Journal, 27, 379-423, 623-656.
Smeesters, D., Wheeler, S. C., & Kay, A. C. (2009). The role ofinterpersonal perceptions in the prime-to-behavior pathway.Journal of Personality and Social Psychology, 96, 395-414.doi:10.1037/a0012959
Solanas, A., Salafranca, Ll., Riba, C., Sierra, V., & Leiva, D. (2006).Quantifying social asymmetric structures. Behavior Research
Methods, 38, 390-399. doi:10.3758/BF03192792Sparrowe, R. T., Liden, R. C., Wayne, S. J., & Kraimer, M. L.
(2001). Social networks and the performance of individualsand groups. Academy of Management Journal, 44, 316-325.doi:10.2307/3069458
Sundstrom, E., McIntyre, M., Halfhill, T., & Richards, H. (2000).Work groups: From the Hawthorne studies to work teams ofthe 1990s and beyond. Group Dynamics: Theory, Research,
and Practice, 4, 44-67. doi:10.1037/1089-2699.4.1.44
Tett, R. P., & Burnett, D. D. (2003). A personality trait-basedinteractionist model of job performance. Journal of
Tett, R. P., & Murphy, P. J. (2002). Personality and situations incoworker preference: Similarity and complementary in workercompatibility. Journal of Business and Psychology, 17, 223-241. doi:10.1023/A:1019685515745
Tsui, A. S., Egan, T. D., & O’Reilly, C. A., III. (1992). BeingDifferent: Relational demography and organizational attachment.Administrative Science Quarterly, 37, 549-579. doi:10.2307/2393472
Tsui, A. S., & O’Reilly, C. A., III. (1989). Beyond simpledemographic effects: The importance of relational demographyin superior-subordinate dyads. Academy of Management
Journal, 32, 402-423. doi:10.2307/256368Utz, S., Ouwerkerk, J. W., & Van Lange, P. A. M. (2004). What
is smart in a social dilemma? Differential effects of primingcompetition on cooperation. European Journal of Social
Psychology, 34, 317-332. doi:10.1002/ejsp.200Watson, R. T. (1987). A study of group decision support system
use in three and four-person groups for a preference allocation
decision. (Unpublished Ph.D. dissertation), University ofMinnesota, MN.
Williams, L. J., & Anderson, S. E. (1991). Job satisfaction andorganizational commitment as predictors of organizationalcitizenship and in-role behaviors. Journal of Management,
17, 601-617. doi:10.1177/014920639101700305
Received March 1, 2010Revision received November 14, 2010
Accepted January 17, 2011
ANDRÉS, SALAFRANCA, AND SOLANAS786
APPENDIX I
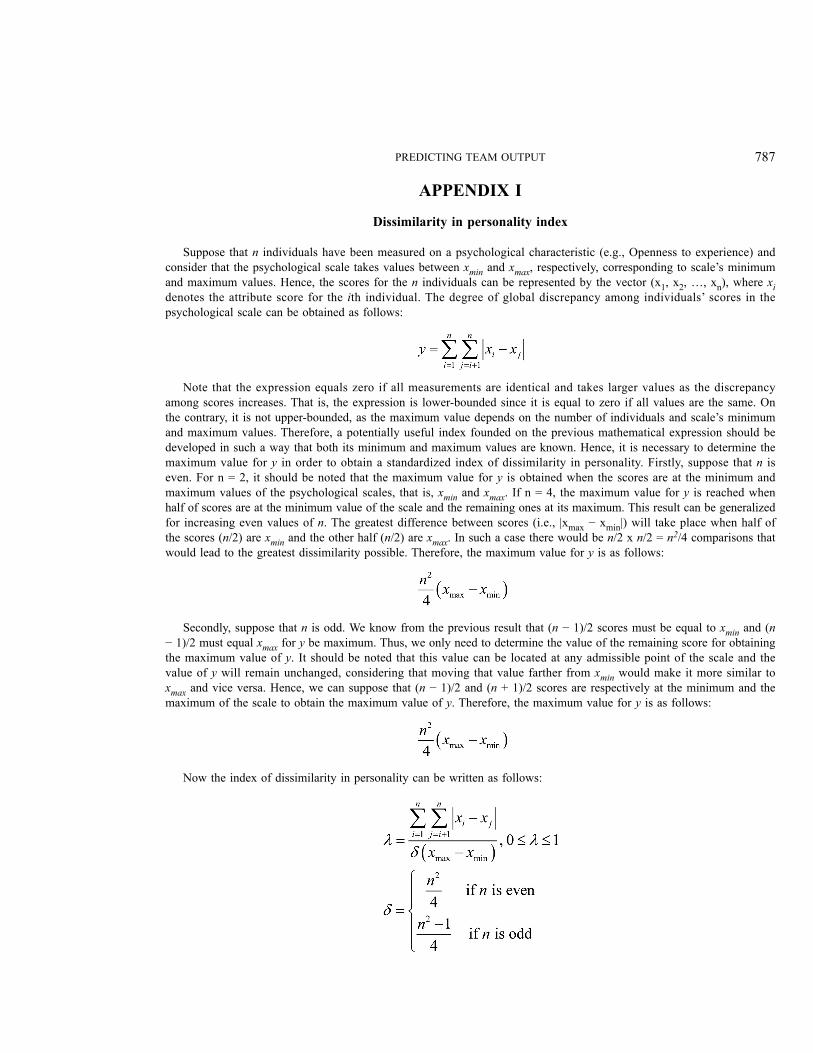
Dissimilarity in personality index
Suppose that n individuals have been measured on a psychological characteristic (e.g., Openness to experience) andconsider that the psychological scale takes values between xmin and xmax, respectively, corresponding to scale’s minimumand maximum values. Hence, the scores for the n individuals can be represented by the vector (x1, x2, …, xn), where xi
denotes the attribute score for the ith individual. The degree of global discrepancy among individuals’ scores in thepsychological scale can be obtained as follows:
Note that the expression equals zero if all measurements are identical and takes larger values as the discrepancyamong scores increases. That is, the expression is lower-bounded since it is equal to zero if all values are the same. Onthe contrary, it is not upper-bounded, as the maximum value depends on the number of individuals and scale’s minimumand maximum values. Therefore, a potentially useful index founded on the previous mathematical expression should bedeveloped in such a way that both its minimum and maximum values are known. Hence, it is necessary to determine themaximum value for y in order to obtain a standardized index of dissimilarity in personality. Firstly, suppose that n iseven. For n = 2, it should be noted that the maximum value for y is obtained when the scores are at the minimum andmaximum values of the psychological scales, that is, xmin and xmax. If n = 4, the maximum value for y is reached whenhalf of scores are at the minimum value of the scale and the remaining ones at its maximum. This result can be generalizedfor increasing even values of n. The greatest difference between scores (i.e., |xmax − xmin|) will take place when half ofthe scores (n/2) are xmin and the other half (n/2) are xmax. In such a case there would be n/2 x n/2 = n2/4 comparisons thatwould lead to the greatest dissimilarity possible. Therefore, the maximum value for y is as follows:
Secondly, suppose that n is odd. We know from the previous result that (n − 1)/2 scores must be equal to xmin and (n− 1)/2 must equal xmax for y be maximum. Thus, we only need to determine the value of the remaining score for obtainingthe maximum value of y. It should be noted that this value can be located at any admissible point of the scale and thevalue of y will remain unchanged, considering that moving that value farther from xmin would make it more similar toxmax and vice versa. Hence, we can suppose that (n − 1)/2 and (n + 1)/2 scores are respectively at the minimum and themaximum of the scale to obtain the maximum value of y. Therefore, the maximum value for y is as follows:
Now the index of dissimilarity in personality can be written as follows: