+ All Categories
Home > Documents > Redefining America: Findings from the 2006 Latino National Survey Luis R. Fraga Stanford University...

Redefining America: Findings from the 2006 Latino National Survey Luis R. Fraga Stanford University...

Date post: 17-Dec-2015
Category:
Upload: catherine-gibson
View: 213 times
Download: 0 times
Share this document with a friend
Popular Tags:
49
Redefining America: Findings from the 2006 Latino National Survey Luis R. Fraga Stanford University University of Washington John A. Garcia University of Arizona Rodney E. Hero University of Notre Dame Michael Jones-Correa Cornell University Valerie Martinez-Ebers Texas Christian University Gary M. Segura University of Washington
Transcript

Redefining America: Findings from the 2006 Latino National Survey

Luis R. FragaStanford University

University of Washington

John A. GarciaUniversity of Arizona

Rodney E. HeroUniversity of Notre Dame

Michael Jones-CorreaCornell University

Valerie Martinez-EbersTexas Christian University

Gary M. SeguraUniversity of Washington

Sources of FundingSources of Funding

• Annie E. Casey FoundationAnnie E. Casey Foundation• Carnegie CorporationCarnegie Corporation• Ford FoundationFord Foundation• Hewlett FoundationHewlett Foundation• Irvine FoundationIrvine Foundation• Joyce FoundationJoyce Foundation• Kellogg FoundationKellogg Foundation• National Science FoundationNational Science Foundation• Russell Sage FoundationRussell Sage Foundation• Texas A&M University: MALRC, PERGTexas A&M University: MALRC, PERG

Latino National SurveyLatino National Survey• A “national” telephone survey of 8600 Latino A “national” telephone survey of 8600 Latino

residents of the United States, seeking a broad residents of the United States, seeking a broad understanding of the qualitative nature of Latino understanding of the qualitative nature of Latino political and social life in Americapolitical and social life in America

• State-stratified samples that reach approximately State-stratified samples that reach approximately 90% coverage of the national Latino population90% coverage of the national Latino population

• Approximately 40 minutes (length and number of Approximately 40 minutes (length and number of questions depends on split-samples, etc)questions depends on split-samples, etc)

• English and SpanishEnglish and Spanish

• Universe is all Latino adults, not citizens or votersUniverse is all Latino adults, not citizens or voters

Themes within the SurveyThemes within the Survey

• Survey includes…many of the questions or topics you Survey includes…many of the questions or topics you have grown to love from existing surveys, whenever have grown to love from existing surveys, whenever possible to ensure comparability;possible to ensure comparability;

Questions submitted by various political scientists specifically Questions submitted by various political scientists specifically targeted at states;targeted at states;

Questions suggested by the advisory boardQuestions suggested by the advisory board

• Beyond the standard, we focused on transnationalism, Beyond the standard, we focused on transnationalism, identity, inter-group and intra-group relations, gender, identity, inter-group and intra-group relations, gender, education, policy preferences, discrimination, education, policy preferences, discrimination, mobilization and overall political orientationsmobilization and overall political orientations

• Some questions specific to foreign born, non-citizens, Some questions specific to foreign born, non-citizens, registered voters, and residents of specific statesregistered voters, and residents of specific states

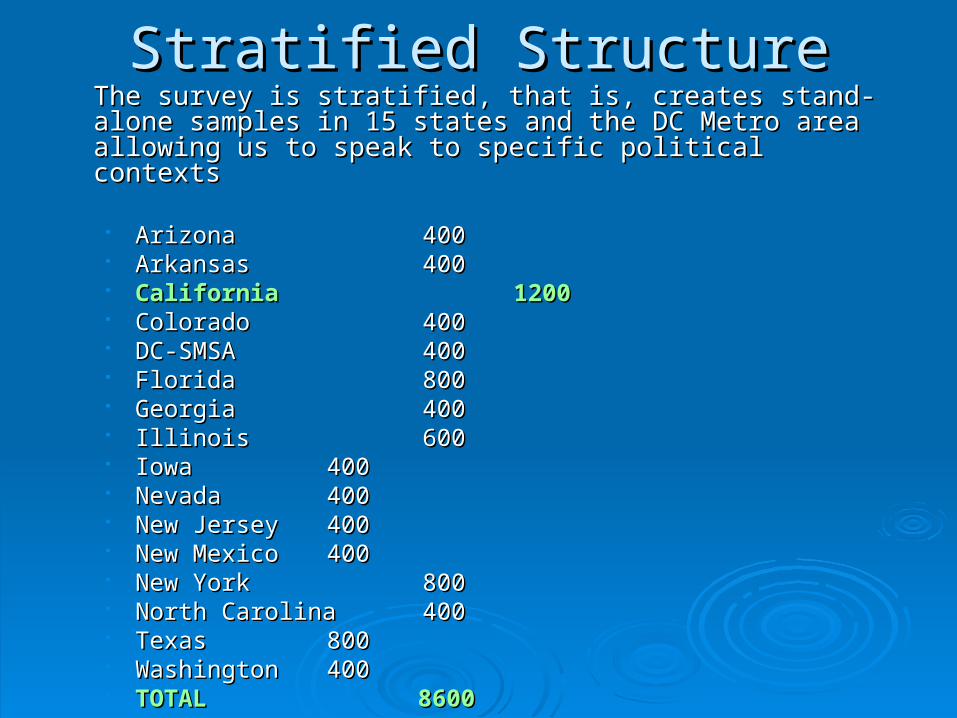
Stratified StructureStratified StructureThe survey is stratified, that is, creates stand-alone samples in 15 The survey is stratified, that is, creates stand-alone samples in 15 states and the DC Metro area allowing us to speak to specific states and the DC Metro area allowing us to speak to specific political contextspolitical contexts

ArizonaArizona 400400 ArkansasArkansas 400400 CaliforniaCalifornia 1200 1200 ColoradoColorado 400400 DC-SMSADC-SMSA 400400 FloridaFlorida 800800 GeorgiaGeorgia 400400 IllinoisIllinois 600600 IowaIowa 400400 NevadaNevada 400400 New JerseyNew Jersey 400400 New MexicoNew Mexico 400400 New YorkNew York 800800 North CarolinaNorth Carolina 400400 TexasTexas 800800 WashingtonWashington 400400 TOTALTOTAL 8600 8600

California Sub-samplesCalifornia Sub-samples

• Bay Area: Bay Area: Alameda, Contra Costa, Marin, Napa, San Francisco,Alameda, Contra Costa, Marin, Napa, San Francisco, San Mateo, Santa Clara, Solano, SonomaSan Mateo, Santa Clara, Solano, Sonoma

• Los Angeles Metro: Los Angeles Metro: Los Angeles, Orange, VenturaLos Angeles, Orange, Ventura

• San Diego: San Diego: San Diego San Diego

• Central Valley: Central Valley: Fresno, Kern, Kings, Madera, Merced, San Fresno, Kern, Kings, Madera, Merced, San Joaquin, Stanislaus, TulareJoaquin, Stanislaus, Tulare

• Inland Empire: Inland Empire: Riverside (western), San Bernardino Riverside (western), San Bernardino (southwestern)(southwestern)

• Other California: Other California: Sacramento, rest of stateSacramento, rest of state

Percent Hispanic of U.S. Population, Percent Hispanic of U.S. Population, 1960-20301960-2030

3.64.8

6.9

9.7

13.2

16.4

19.3

22.5

0

5

10

15

20

25

1960 1970 1980 1990 2000 2010 2020 2030

Source: Chapter 2. Multiple Origins, Uncertain Destinies. Adapted from Figure 2-2.

Per

cent

Hispanic Births and Net Immigration Hispanic Births and Net Immigration by Decade: 1960-2030by Decade: 1960-2030

2.61.3

3.2 3

4.45.5

78.1

9.2

7.6

11.2

7.3

13.4

8.1

0

2

4

6

8

10

12

14

1960-70 1970-80 1980-90 1990-2000

2000-10 2010-20 2020-30

Births Immigration

Source: Chapter 2. Multiple Origins, Uncertain Destinies. Adapted from Figure 2-1.

Mill

ions

Population Growth in the U.S., 2000-2100

71.467.3

63.860.1

56.352.8

45.640.3

14.617

19.421.9

24.329.5

33.3

12.2 12.5 12.8 13 13.1 13.2 13.2 13

3.9 4.8 5.7 6.7 7.8 8.9 11 12.6

11.8

0

10

20

30

40

50

60

70

80

2000 2010 2020 2030 2040 2050 2075 2100

Pe

rce

nt

of

To

tal P

op

ula

tio

n

White

Latino

Af-Am

Asian

Source: Population Projections Division, U.S. Bureau of the Census, 2002

California Population Distribution, 1990-2050

57 5654 53 51.5

47

39

2926

2326 27 28 29 30

33

39

4750

54

7 7 7 7 7 6

11 12 13 13 13 12

1.9 2 2 2 2 2

34

43

7 7 7 7 7

111110109

0

10

20

30

40

50

60

1990 1992 1994 1996 1998 2000 2010 2020 2030 2040 2050

Per

cent

of

Tot

al P

opul

atio

n

White

Latino

Af Am

Asian

Multirace

Source: Population Projections, Department of Finance, State of California, 2004

!

Population Growth in U.S., 2000-210071.4

67.363.8

60.156.3

52.8

45.640.3

14.617

19.421.9

24.329.5

33.3

12.2 12.5 12.8 13 13.1 13.2 13.2 13

3.9 4.8 5.7 6.7 7.8 8.9 11 12.6

11.8

0

10

20

30

40

50

60

70

80

2000 2010 2020 2030 2040 2050 2075 2100

Per

cent

of T

otal

Pop

ulat

ion

White

Latino

Af-Am

Asian

California Population Distribution 1990-2050

57 5654 53 51.5

39

2926

2326 27 28 29 30

39

4650

54

7 7 7 7 7 6

13 12

2 2 2 2 2 2

47

34

43

33

7 7 7 7 7

1313111110109

11 12

0

10

20

30

40

50

60

1990 1992 1994 1996 1998 2000 2010 2020 2030 2040 2050

Percen

t of

Tota

l P

op

ula

tion

White

Latino

Af Am

Asian

Multirace

Population Growth Chart ComparisonsPopulation Growth Chart Comparisons

United StatesUnited States

CaliforniaCalifornia

Latino Diversity

Census Bureau (American Community Survey, Released August 2006)

Mexican 63.9%Puerto Rican 9%Cuban 3.5%Salvadoran 2.9%Dominican 2.7%Guatemalan 1.7%Colombian 1.8%ALL OTHERS 14.3%

Native-born (not Island-born): 35.4%Foreign-born 61%Island-born PR 3.6%

No high school diploma 43%College graduate 11.1%

Latino National Survey (unweighted N)Summer 2006

*Mexican 66.1% (5704)*Puerto Rican 9.5% (822)*Cuban 4.9% (420)*Salvadoran 4.7% (407)*Dominican 3.9% (335)*Guatemalan 1.7% (149)*Colombian 1.6% (139)*All Others 7.6%

*Native-born 28.4% (2450)*Foreign-born (adults) 66.2% (5717)*Island-born PR 5.4% (467)

*No high school diploma 37%*College graduate 16.2%

44 million Latinos in the US

Country of OriginCountry of Origin

Nation California Nation California BayBay LA San Central Inland LA San Central Inland OtherOther

AreaArea Diego Valley Empire Diego Valley Empire

Mexico 68.6 84.4 Mexico 68.6 84.4 78.778.7 76.1 95.3 97.4 93.2 95.8 76.1 95.3 97.4 93.2 95.8

El Salvador 4.3 8.2 El Salvador 4.3 8.2 9.69.6 14.5 0.0 0.7 0.9 0.7 14.5 0.0 0.7 0.9 0.7

Guatemala 2.0 2.2 Guatemala 2.0 2.2 2.22.2 3.2 1.2 0.7 1.7 0.7 3.2 1.2 0.7 1.7 0.7

Other 24.2 5.2 Other 24.2 5.2 9.5 9.5 6.2 3.5 1.2 4.2 2.8 6.2 3.5 1.2 4.2 2.8

NativityNativity

Nation California Nation California BayBay LA San Central Inland LA San Central Inland

OtherOther AreaArea Diego Valley Empire Diego Valley Empire

BornBornU.S. 28.6 30.9 U.S. 28.6 30.9 39.739.7 26.4 25.9 34.4 43.2 29.6 26.4 25.9 34.4 43.2 29.6

Born OutsideBorn OutsideU.S. 66.7 68.5 U.S. 66.7 68.5 60.360.3 73.4 72.9 65.6 54.2 69.0 73.4 72.9 65.6 54.2 69.0

Naturalized 30.1 35.0 Naturalized 30.1 35.0 40.2 40.2 36.2 30.6 25.3 46.9 30.636.2 30.6 25.3 46.9 30.6

Generational StatusGenerational Status

California California BayBay LA San Central Inland LA San Central Inland OtherOther

AreaArea Diego Valley Empire Diego Valley Empire

Gen 1 69.2 Gen 1 69.2 60.760.7 73.6 74.1 65.6 57.3 70.4 73.6 74.1 65.6 57.3 70.4

Gen 2 12.8 Gen 2 12.8 14.814.8 12.1 11.8 11.9 18.8 10.6 12.1 11.8 11.9 18.8 10.6

Gen 3 9.3 Gen 3 9.3 15.515.5 8.0 4.7 11.9 10.3 7.8 8.0 4.7 11.9 10.3 7.8

Gen 4+ 8.7 Gen 4+ 8.7 8.9 8.9 6.3 9.4 10.6 13.7 11.3 6.3 9.4 10.6 13.7 11.3

Assimilation, Values, and IdentityAssimilation, Values, and Identity

Language PreferenceLanguage Preference

Nation California Nation California BayBay LA San Central Inland LA San Central Inland

OtherOther AreaArea Diego Valley Empire Diego Valley Empire

English 38.1 39.8 English 38.1 39.8 52.952.9 32.0 32.9 37.8 59.3 43.0 32.0 32.9 37.8 59.3 43.0

Spanish 61.8 60.2 Spanish 61.8 60.2 47.147.1 68.0 67.1 62.3 40.7 57.0 68.0 67.1 62.3 40.7 57.0

Language chosen to complete the surveyLanguage chosen to complete the survey

Importance of Learning EnglishImportance of Learning English

Nation California Nation California BayBay LA San Central Inland Other LA San Central Inland Other AreaArea Diego Valley Empire Diego Valley Empire

VeryVeryImportant 91.9 94.7 Important 91.9 94.7 91.291.2 94.6 92.9 94.0 91.5 95.1 94.6 92.9 94.0 91.5 95.1

SomewhatSomewhatImportant 6.7 5.1 Important 6.7 5.1 7.4 7.4 4.2 4.7 6.0 6.8 4.2 4.2 4.7 6.0 6.8 4.2

Not VeryNot VeryImportant 0.9 1.0 Important 0.9 1.0 0.7 0.7 1.1 2.4 0.0 1.7 0.7 1.1 2.4 0.0 1.7 0.7

Not At AllNot At AllImportant 0.4 0.2 Important 0.4 0.2 0.7 0.7 0.2 0.0 0.0 0.0 0.0 0.2 0.0 0.0 0.0 0.0

Question: Question: How important do you think it is that everyone in the United States Learn How important do you think it is that everyone in the United States Learn English?English?

Importance of Retaining SpanishImportance of Retaining Spanish

Nation California Nation California BayBay LA San Central Inland Other LA San Central Inland Other AreaArea Diego Valley Empire Diego Valley Empire

VeryVeryImportant 84.9 84.1 Important 84.9 84.1 79.479.4 85.5 82.4 86.1 83.1 82.4 85.5 82.4 86.1 83.1 82.4

SomewhatSomewhatImportant 11.9 13.3 Important 11.9 13.3 17.717.7 11.7 16.5 12.6 13.6 14.1 11.7 16.5 12.6 13.6 14.1

Not VeryNot VeryImportant 1.9 1.7 Important 1.9 1.7 0.70.7 1.1 1.2 1.3 3.4 0.7 1.1 1.2 1.3 3.4 0.7

Not At AllNot At AllImportant 1.1 1.0 Important 1.1 1.0 2.2 2.2 0.2 0.0 0.0 0.0 2.8 0.2 0.0 0.0 0.0 2.8

Question: Question: How important do you think it is for you and your family to maintain the ability How important do you think it is for you and your family to maintain the ability to speak Spanish?to speak Spanish?

Language ProficiencyLanguage Proficiencyacross Generationsacross Generations

11stst Gen Gen 22ndnd Gen Gen 33rdrd Gen Gen 44thth Gen Gen

Answered in EnglishAnswered in English 19.219.2 73.773.7 90.490.4 91.391.3

Answered in Spanish, Answered in Spanish, Speak EnglishSpeak English

19.119.1 19.519.5 8.28.2 7.77.7

Total Share with Total Share with English ProficiencyEnglish Proficiency

38.338.3 93.293.2 98.698.6 99.099.0

Retain Spanish Retain Spanish ProficiencyProficiency

99.299.2 91.691.6 68.768.7 60.560.5

Strong English dominance and nearly universal English Strong English dominance and nearly universal English proficiency among the first-generation of US born;proficiency among the first-generation of US born;

Generally strong Spanish retention, aided by refreshed Generally strong Spanish retention, aided by refreshed populations of Spanish-speakers.populations of Spanish-speakers.

Importance of Learning English/ Importance of Learning English/ Retaining Spanish across GenerationsRetaining Spanish across Generations

11stst Gen Gen 22ndnd Gen Gen 33rdrd Gen Gen 44thth Gen Gen

How important do you think it is that everyone in the United States learn How important do you think it is that everyone in the United States learn English?English?

SomewhatSomewhat 5.25.2 8.68.6 11.811.8 11.611.6

VeryVery 94.194.1 89.389.3 86.186.1 84.084.0

How important do you think it is for you or your family to maintain the How important do you think it is for you or your family to maintain the ability to speak Spanish? ability to speak Spanish?

SomewhatSomewhat 9.79.7 13.713.7 17.917.9 22.222.2

VeryVery 88.688.6 84.484.4 73.073.0 66.766.7

Sense of American and Home-Country IdentitySense of American and Home-Country IdentityAcross GenerationsAcross Generations

11stst CACA 22ndnd CACA 33rdrd CACA 44thth CACA

How strongly do you think of yourself as “American”?How strongly do you think of yourself as “American”?

Somewhat StronglySomewhat Strongly 28.7 28.7 27.027.0 25.1 25.1 21.421.4 15.2 15.2 24.324.3 16.3 16.3 8.8 8.8

Very StronglyVery Strongly24.5 24.5 25.925.9 56.9 56.9 62.0 62.0 78.5 78.5 48.748.7 76.4 76.4 87.887.8

How strongly do you think of yourself as (Mexican, Cuban, etc)?How strongly do you think of yourself as (Mexican, Cuban, etc)?

Somewhat StronglySomewhat Strongly 19.6 19.6 21.221.2 22.2 22.2 19.619.6 26.1 26.1 28.728.7 34.3 34.3 34.334.3

Very StronglyVery Strongly 67.6 67.6 67.767.7 64.3 64.3 60.560.5 45.1 45.1 53.953.9 40.5 40.5 49.249.2

A Multiplicity of IdentitiesA Multiplicity of Identities

• Simultaneous strong Simultaneous strong sense of pan-ethnic sense of pan-ethnic identity, national origin identity, national origin identity, and American-identity, and American-nessness

Puerto Ricans illustrate Puerto Ricans illustrate best that identities are best that identities are not mutually exclusivenot mutually exclusive

Cuban pan-ethnicity Cuban pan-ethnicity surprisingly highsurprisingly high

Mexican sense of Mexican sense of American-ness high American-ness high considering the share considering the share foreign bornforeign born

AmericanAmericanNational National OriginOrigin

Pan-Pan-EthnicEthnic

MexicanMexican 61.761.7 84.084.0 87.487.4

CubanCuban 77.877.8 82.182.1 81.681.6

Puerto Puerto RicanRican 83.783.7 90.790.7 89.389.3

AllAll 65.065.0 84.084.0 87.287.2

Cells are percent expressing Cells are percent expressing “somewhat” or “very strongly”“somewhat” or “very strongly”

Levels of Pan Ethnicity and ConnectednessLevels of Pan Ethnicity and Connectedness

Of One’s Subgroup to Other LatinosOf One’s Subgroup to Other Latinos

One-half of LNS Latinos perceive a lot of One-half of LNS Latinos perceive a lot of commonalities with one’s group and other Latinos commonalities with one’s group and other Latinos

Stronger pan-ethnic identifiers are more inclined to Stronger pan-ethnic identifiers are more inclined to see this connection.see this connection.

Over three- fourths of the combined stronger pan-Over three- fourths of the combined stronger pan-ethic identifiers see their own national origin group ethic identifiers see their own national origin group as having a similar fate with other Latinosas having a similar fate with other Latinos

Selected Markers of Societal AssimilationSelected Markers of Societal Assimilation

11stst 22ndnd 33rdrd 44thth

Roman CatholicsRoman Catholics 73.873.8 69.769.7 66.866.8 58.158.1

Social Capital Social Capital

(Group Participation)(Group Participation)14.114.1 25.025.0 29.429.4 33.433.4

Military Service, Self or Military Service, Self or FamilyFamily 16.116.1 48.948.9 68.668.6 72.372.3

Education < High Education < High SchoolSchool 49.749.7 22.922.9 17.617.6 16.216.2

Household income Household income <$35k<$35k 53.453.4 34.934.9 29.229.2 33.433.4

Percent Marrying non-Percent Marrying non-LatinosLatinos

13.313.3 32.232.2 42.642.6 53.353.3

Attention to US and “Home Country” Attention to US and “Home Country” Politics and Public AffairsPolitics and Public Affairs

• Attention to US politics is strong, even among the foreign born, Attention to US politics is strong, even among the foreign born, and approaches (and in some cases surpasses) levels for all and approaches (and in some cases surpasses) levels for all other groups, among Latinos born in the US.other groups, among Latinos born in the US.

• While about 57% of foreign born respondents agree that they While about 57% of foreign born respondents agree that they should be able to vote in home country elections, only about 4% should be able to vote in home country elections, only about 4% have ever done so, and about 58% report paying little or no have ever done so, and about 58% report paying little or no attention to politics back home.attention to politics back home.

11stst 22ndnd 33rdrd 44thth

Attention to/Interest in US politicsAttention to/Interest in US politics

Somewhat or Very InterestedSomewhat or Very Interested 60.060.0 73.973.9 79.279.2 81.381.3

Attention to/Interest in “Home-Country” politicsAttention to/Interest in “Home-Country” politics

Little or No Attention PaidLittle or No Attention Paid 57.557.5 61.061.0 72.872.8 72.872.8

Preferences for Cultural Preferences for Cultural Assimilation and Distinctness Assimilation and Distinctness

11stst CACA 22ndnd CACA 33rdrd CACA 44thth CACA

Importance of Changing to Blend into Larger SocietyImportance of Changing to Blend into Larger Society

SomewhatSomewhat 26.2 26.2 24.324.3 33.3 33.3 21.721.7 34.7 34.7 31.131.1 37.5 37.5 36.036.0

VeryVery 61.4 61.4 63.763.7 44.6 44.6 58.358.3 40.6 40.6 51.551.5 35.7 35.7 36.836.8

Importance of Maintaining Distinct CultureImportance of Maintaining Distinct Culture

SomewhatSomewhat 16.2 16.2 15.015.0 18.3 18.3 14.914.9 20.3 20.3 21.821.8 26.1 26.1 29.329.3

VeryVery 78.6 78.6 79.979.9 75.8 75.8 69.169.1 72.9 72.9 72.972.9 66.7 66.7 60.660.6

• Support for blending into the larger culture and for maintaining a Support for blending into the larger culture and for maintaining a distinct culture are positively related (r=.1415):distinct culture are positively related (r=.1415):

• Not seen as an either/or propositionNot seen as an either/or proposition

Civic and Political Civic and Political ParticipationParticipation

Patterns of Civic EngagementPatterns of Civic Engagement

California California BayBay LA San Central Inland LA San Central Inland OtherOther

AreaArea Diego Valley Empire Diego Valley Empire

GroupGroup Participation 20.4 Participation 20.4 23.523.5 18.9 18.8 17.9 22.9 25.4 18.9 18.8 17.9 22.9 25.4

OrganizationalOrganizational ProblemProblem Solving 28.7 Solving 28.7 28.728.7 28.9 25.9 27.8 33.1 27.5 28.9 25.9 27.8 33.1 27.5

InformalInformal ProblemProblem Solving 32.9 Solving 32.9 29.429.4 33.4 32.9 34.4 28.8 35.9 33.4 32.9 34.4 28.8 35.9

Interest in PoliticsInterest in Politics Nation California Nation California BayBay LA San Central Inland LA San Central Inland

OtherOther AreaArea Diego Valley Empire Diego Valley Empire

VeryVeryInterested 18.9 19.4 Interested 18.9 19.4 15.415.4 22.2 23.5 16.6 17.8 14.1 22.2 23.5 16.6 17.8 14.1

SomewhatSomewhatInterested 46.1 47.9 Interested 46.1 47.9 50.750.7 45.1 44.7 48.3 51.7 54.9 45.1 44.7 48.3 51.7 54.9

NotNotInterested 30.4 27.6 Interested 30.4 27.6 28.728.7 28.3 29.4 28.5 22.9 25.4 28.3 29.4 28.5 22.9 25.4

Not Sure/Not Sure/Don’t Know 4.1 4.4 Don’t Know 4.1 4.4 5.2 5.2 3.5 2.3 5.3 6.8 5.6 3.5 2.3 5.3 6.8 5.6

Question: Question: How interested are you in politics and public affairs? Would you say you are How interested are you in politics and public affairs? Would you say you are very interested, somewhat interested, or not at all interested?very interested, somewhat interested, or not at all interested?

Voter RegistrationVoter Registration

Nation California Nation California BayBay LA San Central Inland Other LA San Central Inland Other

AreaArea Diego Valley Empire Diego Valley Empire

Registered 77.4 79.5 Registered 77.4 79.5 75.975.9 81.6 73.8 77.9 81.0 78.4 81.6 73.8 77.9 81.0 78.4

NotNotRegistered 21.4 19.5 Registered 21.4 19.5 23.023.0 18.1 21.4 22.1 17.9 18.9 18.1 21.4 22.1 17.9 18.9

This question was only asked of citizens.This question was only asked of citizens.

Electoral Participation, 2004Electoral Participation, 2004

California California BayBay LA San Central Inland LA San Central Inland OtherOther

AreaArea Diego Valley Empire Diego Valley Empire

Contacted 36.7 Contacted 36.7 48.348.3 33.9 33.3 39.0 36.9 33.8 33.9 33.3 39.0 36.9 33.8

Voted 62.3 Voted 62.3 60.960.9 67.4 54.8 61.0 53.6 58.1 67.4 54.8 61.0 53.6 58.1

Latinos and PartisanshipLatinos and Partisanship

Patterns of PartisanshipPatterns of Partisanship

Overall U.S. Born Overall U.S. Born CACA Born Outside Born Outside CACA U.S.U.S.

Democrat Democrat 42.1 55.9 42.1 55.9 50.650.6 33.9 33.9 37.037.0

RepublicanRepublican 21.5 26.0 21.5 26.0 22.822.8 18.8 18.8 10.510.5

IndependentIndependent 8.1 5.6 8.1 5.6 7.17.1 10.0 10.0 9.0 9.0

Don’t CareDon’t Care 12.7 4.8 12.7 4.8 6.86.8 17.4 17.4 20.120.1

Don’t KnowDon’t Know 15.6 8.6 15.6 8.6 12.112.1 20.0 20.0 23.223.2

Partisanship Among CitizensPartisanship Among Citizens

U.S. U.S. CACA Naturalized Naturalized CACA Reg Reg CACA Not Reg Not Reg CACA

Democrat Democrat 55.9 55.9 50.650.6 43.9 43.9 47.347.3 55.9 55.9 56.956.9 33.6 33.6 28.628.6

RepublicanRepublican 26.0 26.0 22.822.8 24.9 24.9 17.117.1 26.1 26.1 18.318.3 22.3 22.3 27.427.4

IndependentIndependent 5.6 5.6 7.17.1 8.6 8.6 9.39.3 6.1 6.1 8.58.5 8.2 8.2 7.97.9

Don’t CareDon’t Care 4.8 4.8 6.76.7 9.2 9.2 7.87.8 3.9 3.9 4.34.3 15.4 15.4 14.514.5

Don’t KnowDon’t Know 8.6 8.6 12.112.1 13.4 13.4 18.318.3 8.1 8.1 11.811.8 20.6 20.6 21.421.4

Patterns of Partisanship, CaliforniaPatterns of Partisanship, California Nation California Nation California BayBay LA San Central Inland Other LA San Central Inland Other

AreaArea Diego Valley Empire Diego Valley Empire

StrongStrongDemocrat 17.6 33.1 Democrat 17.6 33.1 23.123.1 39.3 27.7 27.3 36.1 23.9 39.3 27.7 27.3 36.1 23.9

Democrat 16.3 25.7 Democrat 16.3 25.7 34.134.1 25.8 21.3 20.5 24.1 26.1 25.8 21.3 20.5 24.1 26.1

LeansLeansDemocrat 10.4 8.5 Democrat 10.4 8.5 8.88.8 8.6 6.4 8.0 2.4 15.2 8.6 6.4 8.0 2.4 15.2

Independent 38.5 12.4 Independent 38.5 12.4 13.2 13.2 11.0 14.9 17.1 10.8 13.0 11.0 14.9 17.1 10.8 13.0

LeansLeansRepublican 6.8 4.4 Republican 6.8 4.4 4.4 4.4 3.0 4.3 9.1 6.0 4.43.0 4.3 9.1 6.0 4.4

Republican 5.9 9.8 Republican 5.9 9.8 8.8 8.8 6.2 12.8 11.4 13.3 14.16.2 12.8 11.4 13.3 14.1

StrongStrongRepublican 4.5 6.6 Republican 4.5 6.6 7.7 7.7 6.2 12.8 6.8 7.2 3.36.2 12.8 6.8 7.2 3.3

Partisanship and GenderPartisanship and Gender

MaleMale FemaleFemale

Democrat Democrat 41.241.2 40.7 40.7

Republican Republican 23.7 18.723.7 18.7

Independent Independent 9.3 7.6 9.3 7.6

Don’t Care Don’t Care 11.7 14.611.7 14.6

Don’t Know Don’t Know 14.1 18.414.1 18.4

Citizenship and Issue Positions:Citizenship and Issue Positions:Problem Facing the CountryProblem Facing the Country

Citizen Citizen CACA Non-citizen Non-citizen CACA Iraq WarIraq War 30.0 30.0 30.330.3 33.2 33.2 28.328.3

Economy Economy 14.7 14.7 15.215.2 12.4 12.4 17.617.6

IllegalIllegal Immigration Immigration 8.4 8.4 8.38.3 14.8 14.8 13.413.4

Education/Education/ Schools Schools 4.2 4.2 5.1 5.1 4.7 4.7 1.21.2

Other Other 12.4 12.4 11.311.3 6.6 6.6 6.86.8

“What do you think is THE one most important problem facing the country today?”

Partisanship and Issue Positions:Partisanship and Issue Positions:Problem Facing the CountryProblem Facing the Country

Democrat Democrat CACA Republican Republican CACA Independent Independent CACA

Iraq WarIraq War 33.8 33.8 33.233.2 25.1 25.1 29.429.4 25.8 25.8 28.428.4

Economy 15.0 Economy 15.0 17.117.1 14.6 14.6 15.015.0 14.5 14.5 17.917.9

IllegalIllegal Immigration Immigration 6.9 6.9 7.5 7.5 9.0 9.0 8.88.8 10.6 10.6 14.114.1

Education/Education/ Schools 5.4 Schools 5.4 4.34.3 4.5 4.5 2.42.4 5.0 5.0 3.73.7

Other 11.7 Other 11.7 10.410.4 17.3 17.3 12.6 12.6 16.1 16.1 4.64.6

“What do you think is THE one most important problem facing the country today?”

Partisanship and Issue Positions:Partisanship and Issue Positions:Preferred Party to Address Problem Facing CountryPreferred Party to Address Problem Facing Country

Dems Dems CACA Reps Reps CACA Neither Neither CACA Don’t Don’t CACA

KnowKnow

Democrat Democrat 39.4 39.4 49.349.3 7.4 7.4 6.86.8 43.1 43.1 32.432.4 10.1 10.1 11.211.2

RepublicanRepublican 14.6 14.6 7.47.4 26.2 26.2 33.133.1 46.3 46.3 50.650.6 13.0 13.0 8.78.7

IndependentIndependent 12.1 12.1 22.722.7 6.8 6.8 8.28.2 63.8 63.8 51.251.2 17.2 17.2 17.817.8

Don’t CareDon’t Care 6.2 6.2 10.110.1 3.9 3.9 5.05.0 54.2 54.2 37.537.5 35.7 35.7 47.247.2

Don’t KnowDon’t Know 6.1 6.1 6.06.0 4.8 4.8 6.6 6.6 48.5 48.5 43.043.0 40.6 40.6 44.244.2

“Which political party do you think has a better approach to address this problem?”

Citizenship and Issue Positions:Citizenship and Issue Positions:Problem Facing LatinosProblem Facing Latinos

Citizen Citizen CACA Non-citizen Non-citizen CACA

IllegalIllegal ImmigrationImmigration 25.0 25.0 25.425.4 35.1 35.1 30.730.7

Education/Education/ Schools Schools 13.9 13.9 16.716.7 3.6 3.6 4.64.6

Unemp/Jobs Unemp/Jobs 11.7 11.7 10.9 10.9 12.6 12.6 11.211.2

Iraq War Iraq War 1.5 1.5 2.02.0 1.6 1.6 2.82.8

Other Other 13.6 13.6 13.513.5 9.2 9.2 8.48.4

“What do you think is THE one most important problem facing the Latino community today?”

Partisanship and Issue Positions:Partisanship and Issue Positions:Problem Facing LatinosProblem Facing Latinos

Democrat Democrat CACA Republican Republican CA CA Independent Independent CACA

IllegalIllegal Immigration Immigration 24.7 24.7 24.824.8 23.7 23.7 26.026.0 27.5 27.5 32.232.2

Education/Education/ Schools 18.2 Schools 18.2 16.116.1 15.3 15.3 15.815.8 11.3 11.3 10.010.0

Unemp/Jobs 12.4 Unemp/Jobs 12.4 12.3 12.3 11.0 11.0 6.86.8 9.7 9.7 11.711.7

Iraq War 1.8 Iraq War 1.8 1.71.7 0.9 0.9 3.0 3.0 1.9 1.9 4.24.2

Other 13.8 Other 13.8 10.510.5 16.4 16.4 23.323.3 14.4 14.4 8.78.7

“What do you think is THE one most important problem facing the Latino community today?”

Partisanship and Issue Positions:Partisanship and Issue Positions:Preferred Party to Address Problem Facing LatinosPreferred Party to Address Problem Facing Latinos

Dems Dems CACA Reps Reps CACA Neither Neither CACA Don’t Don’t CACA KnowKnow

Democrat Democrat 44.8 44.8 51.251.2 6.7 6.7 6.66.6 37.1 37.1 32.032.0 11.4 11.4 10.010.0

RepublicanRepublican 19.3 19.3 13.113.1 21.0 21.0 24.824.8 42.1 42.1 49.349.3 17.6 17.6 12.612.6

IndependentIndependent 14.4 14.4 18.618.6 7.8 7.8 7.07.0 55.7 55.7 56.2 56.2 22.0 22.0 18.018.0

Don’t CareDon’t Care 12.1 12.1 10.210.2 6.2 6.2 4.24.2 48.2 48.2 41.041.0 33.5 33.5 44.444.4

Don’t KnowDon’t Know 7.7 7.7 7.17.1 6.2 6.2 8.88.8 40.5 40.5 34.334.3 45.6 45.6 49.649.6

“Which political party do you think has a better approach to address this problem?”

IMMIGRATION POLICY

Preferred Immigration Policy by Generation

0

10

20

30

40

50

60

ImmediateLegalization

Guest WorkerLegaliz

Guest Worker Seal Border None of These

Preferred Immigration Policy

Perc

en

t w

ith

in G

en

era

tion

Preferred Immigration Policy First

Preferred Immigration PolicySecond

Preferred Immigration Policy Third

Preferred Immigration Policy Fourth

Preferred Immigration Policy All

Preferred Immigration Policy, Preferred Immigration Policy, by Generationby Generation

11st st CACA 2 2nd nd CACA 3 3rdrd CA CA 4 4thth CACA

ImmediateImmediate

LegalizationLegalization 53.6 53.6 58.258.2 23.7 23.7 22.122.1 35.5 35.5 37.237.2 15.5 15.5 16.316.3

Guest Worker:Guest Worker:

Legalization 25.3 Legalization 25.3 22.822.8 43.7 43.7 53.453.4 35.1 35.1 34.3 34.3 47.0 47.0 52.152.1

Guest Worker:Guest Worker:

Temporary Temporary 10.6 10.6 9.69.6 13.9 13.9 16.316.3 12.0 12.0 12.112.1 13.6 13.6 12.612.6

Seal BorderSeal Border 2.1 2.1 0.80.8 7.3 7.3 2.32.3 6.5 6.5 7.5 7.5 11.5 11.5 12.912.9

Latino National SurveyLatino National Survey

• Executive Summary• Executive Summary• Demographic Tables• Demographic Tables• Background Tables• Background Tables• Questionnaire and Toplines• Questionnaire and Toplines

Available at the website of the Washington Available at the website of the Washington Institute for the Study of Ethnicity, Race, and Institute for the Study of Ethnicity, Race, and Sexuality (WISER), University of Washington, Sexuality (WISER), University of Washington, Seattle:Seattle:

http://http://depts.washington.edu/uwiser/LNS.shtmldepts.washington.edu/uwiser/LNS.shtml


Recommended