42
1 Urbanise.com urbanise Redefining the future of service delivery US roadshow, September 2015
| Date post: | 25-May-2018 |
| Category: |
Documents |
| Upload: | nguyenkhanh |
| View: | 214 times |
| Download: | 0 times |
1Urbanise.com urbanise
Redefining the future of service delivery
US roadshow, September 2015

2Urbanise.com urbanise
6.4BN people will live in cities by 2050 *Frost & Sullivan 2014
$1.5TN Global Smart City Market By 2019*
3.9BN people live in cities today

3Urbanise.com urbanise
It’s about doing things smarter in our existing cities
95% of all the buildings we will occupy
by 2050 are already built…
This challenge isn’t about building smart cities

4Urbanise.com urbanise
“…there were 5.6 million commercial buildings in the United States in 2012, comprising 87.4 billion square feet of floorspace. This represents a 14% increase in the number of buildings and a 22% increase in floorspace since 2003” - CBECS
“In the US as of 2005:
72.1M Detached Homes 16.7M Condominium Units”
eia.gov
“In 2008, the HVAC industry accounted for 249,000 jobs, while the plumbing sector accounted for about 550,000. The industries combined accounted for $122 billion in revenue in 2007. There are 65 million air conditioners in American homes, and 110 million furnaces.”
franchisehelp.com
This is just the US market

5Urbanise.com urbanise
We power the people who service cities

6Urbanise.com urbanise
URBANISE INDUSTRY CLOUD
Owning the eco-system for smart services
Smart Services Platform
§ Smart Sensors for critical assets
§ Service eCommerce offers online services anywhere anytime
§ Automated traditional processes simplify communication and streamline operations
§ Single point of access offers
transparency, visibility and control
§ Energy monitoring enables energy optimisation

7Urbanise.com urbanise
Tier 1
Integrated Service Providers
Tier 2 Single Service Companies
Tier 3 ‘Man in Van’ Service Providers
Our route to market is to target tier 1
Around 20 operators in each region manage a large percentage of the high value / high density buildings in a city
Premium Office Buildings Premium Apartment Towers Gated Communities Corporate Office Portfolios Distributed Branch Offices Government Contracts Service Aggregators
Office Buildings Apartment Blocks Factories
Offices Homes
10-20 Companies
‘000’s Companies
’00’s Companies
Urbanise primary route to
market

8Urbanise.com urbanise
HOW WE REDEFINE SERVICES

9Urbanise.com urbanise
Meeting our clients new customer demands
How we help: We simplify the building & city services experience allowing people to purchase more lifestyle services online
Browse
Configure Pay (mobile too!)

10Urbanise.com urbanise
Automating their traditional businesses
We optimise the building & city service delivery with a cloud-based service operations and mobile engine
Receive
Schedule
Optimise & Track

11Urbanise.com urbanise
Giving our customers greater visibility and control
We track everything our industry cloud real-time allowing instantaneous decision making, by any manager, located anywhere
Sales Performance
Satisfaction

12Urbanise.com urbanise
Helping our customers increase efficiency
Applying service models in our industry cloud using the internet-of-things
Monitor Respond
Analyse

13Urbanise.com urbanise
DRIVING GLOBAL SCALE

14Urbanise.com urbanise
Our growth strategy
1. Global Focus
2. Expand Existing Customer Base
3. Enhance Existing Offerings
4. Expand Presence
We have four strategic growth areas

15Urbanise.com urbanise
Growing globallyOur global rollout with an expanded footprint and growing opportunity pipeline continues to grow significantly
15
Middle EastOffice: Dubai
South AfricaOffice: Cape Town
UK / EuropeOffice:London, Bulgaria
SE AsiaOffice: Singapore
AustraliaOffice: Melbourne, Sydney, Brisbane
Countries with contracted customers in rollout

16Urbanise.com urbanise
Multiple new customers addedKey customers added in significant locations, as Urbanise expands internationally

17Urbanise.com urbanise
Growth trajectoryAdoption rate accelerating
170,050
1,150 Forecast
Buildings Connected
Forecast Registered Occupants
47,307 1,125
104
Current Rollout
214,495 Current Rollout
1 July 2014 30 June 2015
18Urbanise.com urbanise
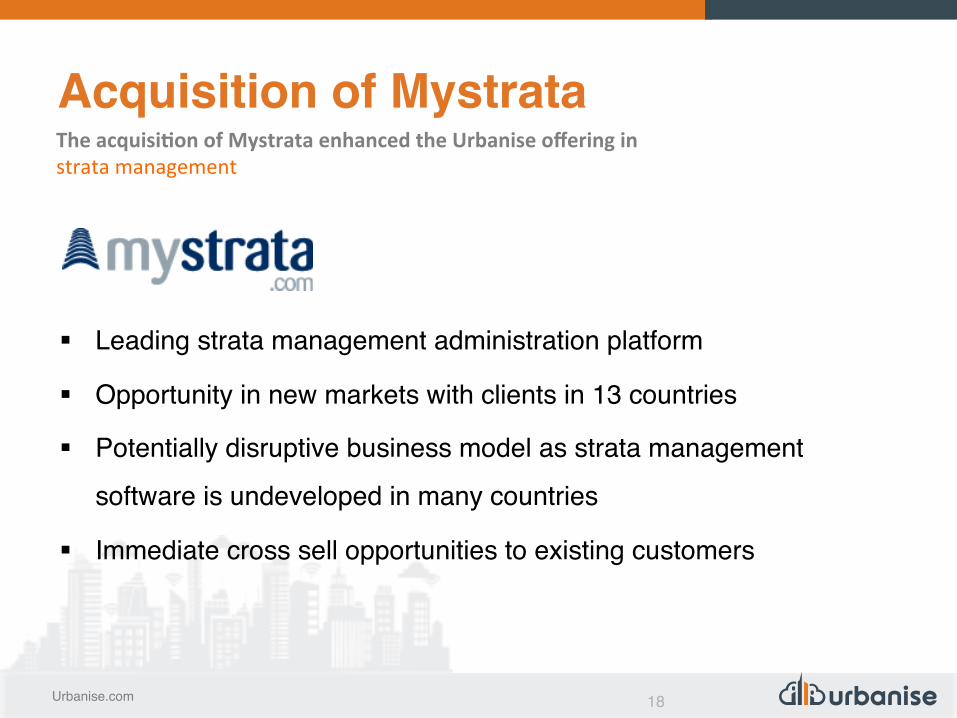
Acquisition of Mystrata
§ Leading strata management administration platform
§ Opportunity in new markets with clients in 13 countries
§ Potentially disruptive business model as strata management
software is undeveloped in many countries
§ Immediate cross sell opportunities to existing customers
The acquisi5on of Mystrata enhanced the Urbanise offering in strata management

19Urbanise.com urbanise
Integration yields multiple synergies
§ Enables our ‘strata spear’ strategy
§ Mystrata software used to open up channel for internal dwelling and
office services
§ Opportunities to cross-sell Urbanise technology – bringing asset
management and remote monitoring to Mystrata customers
§ Service providers charged on a transactional pricing model for every
job carried out… removes the cap on UBN monetisation being a
subscription creating almost unlimited upside
§ Brings financial management capability to new markets including the UK
§ Provides a platform for entry into US market

20Urbanise.com urbanise
DELIVERING RESULTS

21Urbanise.com urbanise
Strong growth in revenue
§ Revenue above Prospectus forecast, up 96% to $10.2m‒ higher than anticipated new client
wins‒ 15 new clients agreements secured in
FY15; expected to positively impact FY16 result
§ Pro-forma EBITDA up 25% to $3.53m‒ includes ramp up of global resources
(includes additional team members employed since IPO) and product development to support converting high levels of interest in Urbanise.com platform into client wins
§ Pro-forma NPAT up 13.5% to $1.7m‒ reflects growth in underlying
business
Pro-‐forma, A$000 FY15 FY14 Change
Revenue 10,169 5,180 96.3%
Expenses 238 100 138.0%
EBITDA 2,089 2,821 -‐25.9%
Pro-‐forma EBITDA 3,530 2,821 25.1%
Pro-‐forma NPAT 1,736 1,529 13.5%

22Urbanise.com urbanise
Strong balance sheet
§ No debt
§ Cash balance of $12.2m at 30 June 2015
§ Total Assets up due to acquisition of Mystrata and trade receivables
A$000 Statutory 30 June 2015
Pro-‐forma 31 December 2014
Cash and cash equivalents 12,243 16,429
Other assets 851 260
Total assets 50,579 33,445
Borrowings -‐ -‐
Total current liabili[es 4,339 835
Total liabili5es 4,378 1,644
Total equity 46,200 31,801
23Urbanise.com urbanise
MULTIPLE REVENUE STREAMS DRIVING LONG TERM GROWTH
24Urbanise.com urbanise
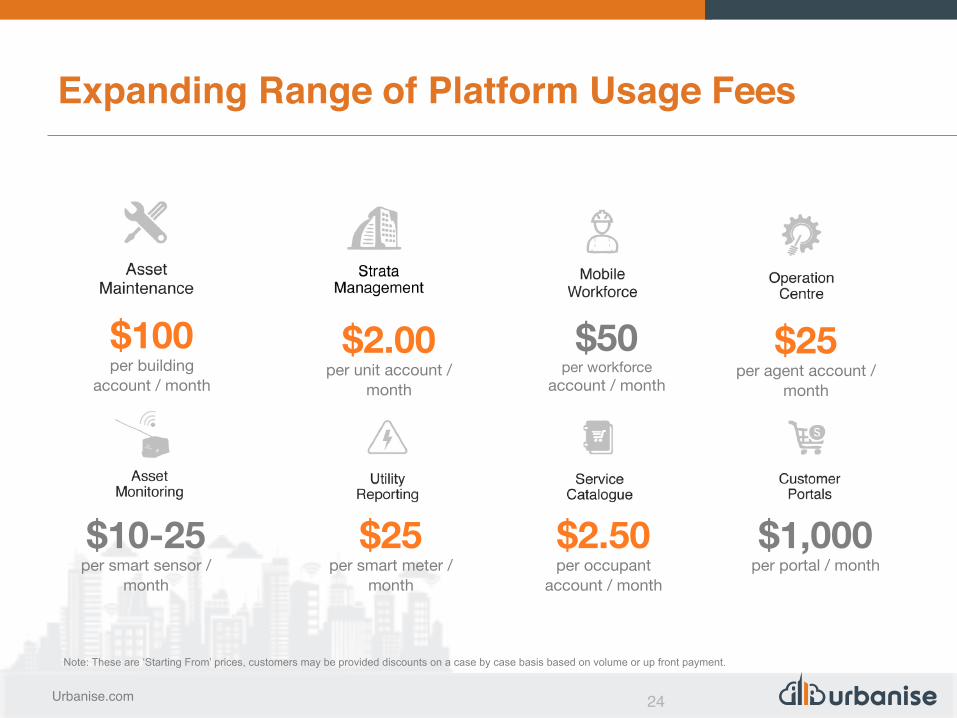
Expanding Range of Platform Usage Fees
$50 per workforce
account / month
$10-25 per smart sensor /
month
$100 per building
account / month
$2.00 per unit account /
month
$25 per agent account /
month
$25 per smart meter /
month
$2.50 per occupant
account / month
$1,000 per portal / month
Note: These are ‘Starting From’ prices, customers may be provided discounts on a case by case basis based on volume or up front payment.

25Urbanise.com urbanise
New Urbanise Fee Models
Fee Per Job Processed
Almost all Urbanise customers process hundreds/thousands of jobs per week.
% $
Enterprise Platform Activation Pre-configuration of platform aligned to Client Business Model and organizational size. Existing business data is cleansed and imported along with tailored training programs for operational staff.
Percentage of Revenue Well understood, good for new customers who don’t have an established existing revenue model.
*new market information

26Urbanise.com urbanise
Old World: Large Enterprise Customers
Traditionally budgeted for large fixed upfront fees with flat ongoing fees, procurement processes are not designed to
accommodate unbounded variable usage
Y1 Y2 Y3
Maintenance Fees
Software Fee Fe
es
Q1 Q2 Q3 Q4 Q1 Q2 Q3 Q4 Q1 Q2 Q3 Q4
Q1 Q2 Q3 Q4 Q1 Q2 Q3 Q4 Q1 Q2 Q3 Q4
Invoice
Cashflow
*new market information

27Urbanise.com urbanise
Urbanise PAYG Customers
Y1 Y2 Y3
Fees
Q1 Q2 Q3 Q4 Q1 Q2 Q3 Q4 Q1 Q2 Q3 Q4
Q1 Q2 Q3 Q4 Q1 Q2 Q3 Q4 Q1 Q2 Q3 Q4
Invoice
Cashflow
All start off small and build up over time, ongoing internal focus is key to achieve their full potential
VARIABLE RECURRING FEES BASED ON USAGE
INVOICED AS REVENUE AS CONSUMED
CASHFLOW EACH
QUARTER
Example of a typical client rollout profile
*new market information
28Urbanise.com urbanise
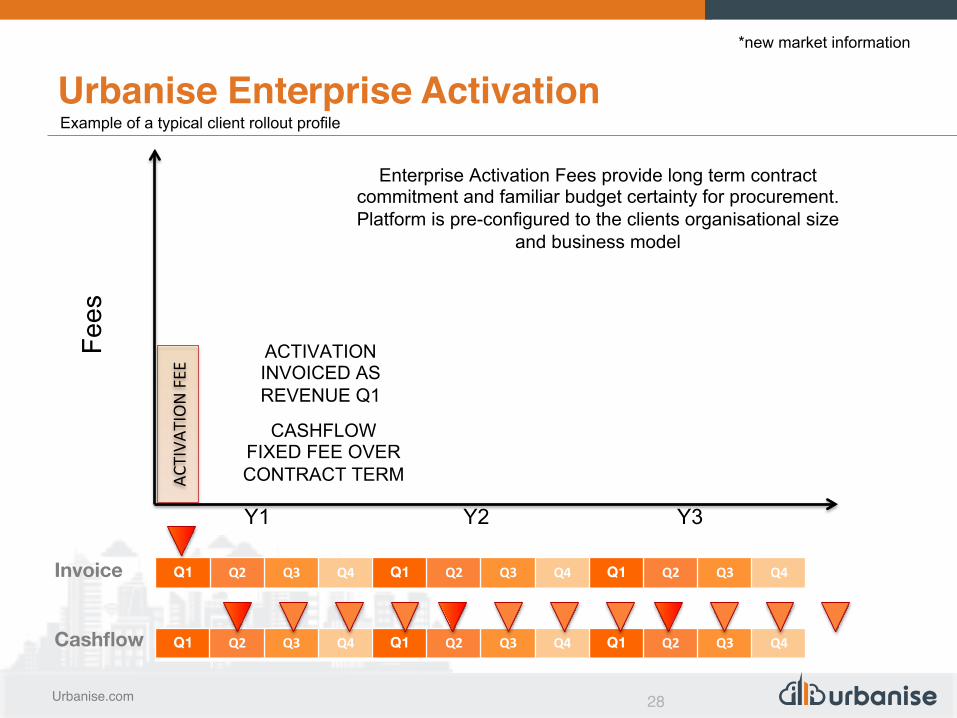
Urbanise Enterprise Activation
Y1 Y2 Y3
Fees
Q1 Q2 Q3 Q4 Q1 Q2 Q3 Q4 Q1 Q2 Q3 Q4
Q1 Q2 Q3 Q4 Q1 Q2 Q3 Q4 Q1 Q2 Q3 Q4
Invoice
Cashflow
ACTIVATION INVOICED AS REVENUE Q1
ACTIVA
TION FEE
Enterprise Activation Fees provide long term contract commitment and familiar budget certainty for procurement. Platform is pre-configured to the clients organisational size
and business model
CASHFLOW FIXED FEE OVER CONTRACT TERM
Example of a typical client rollout profile
*new market information
29Urbanise.com urbanise
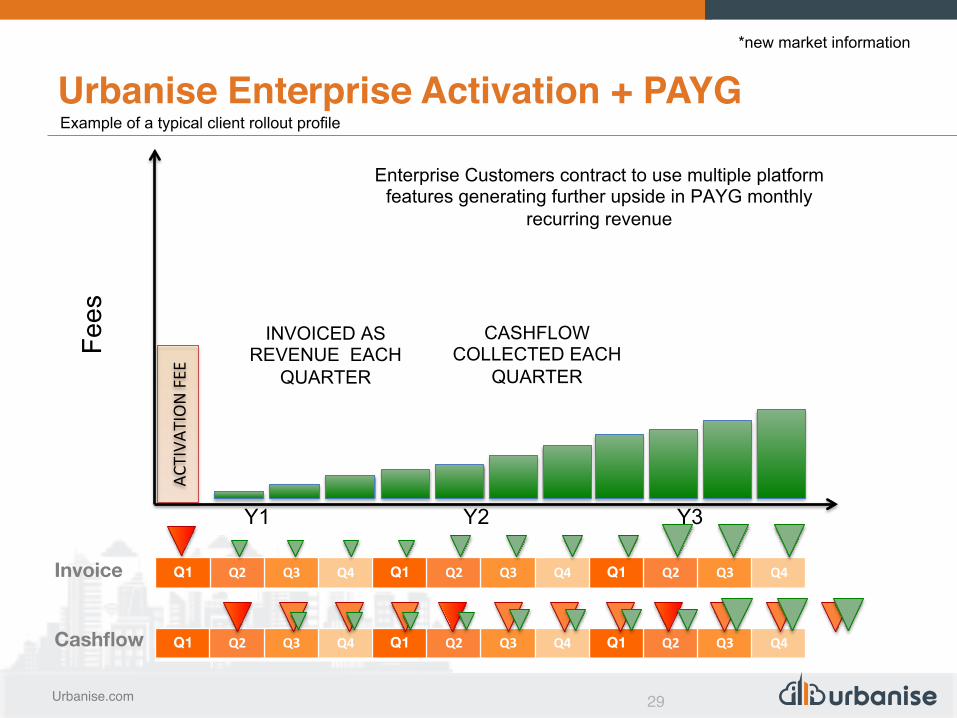
Urbanise Enterprise Activation + PAYG
Y1 Y2 Y3
Fees
Q1 Q2 Q3 Q4 Q1 Q2 Q3 Q4 Q1 Q2 Q3 Q4
Q1 Q2 Q3 Q4 Q1 Q2 Q3 Q4 Q1 Q2 Q3 Q4
Invoice
Cashflow
INVOICED AS REVENUE EACH
QUARTER
ACTIVA
TION FEE
Enterprise Customers contract to use multiple platform features generating further upside in PAYG monthly
recurring revenue
CASHFLOW COLLECTED EACH
QUARTER
Example of a typical client rollout profile
*new market information

30Urbanise.com urbanise
Urbanise Transactional (Per Job) Licensing
Y1 Y2 Y3
Fees
Q1 Q2 Q3 Q4 Q1 Q2 Q3 Q4 Q1 Q2 Q3 Q4
Q1 Q2 Q3 Q4 Q1 Q2 Q3 Q4 Q1 Q2 Q3 Q4
Invoice
Cashflow
FEES IN LINE WITH WORK
DONE
Per job licensing is appealing to large clients with existing well established businesses, they only pay Urbanise when
they do something that generates revenue
INVOICED AS REVENUE EACH
QUARTER
CASHFLOW COLLECTED EACH
QUARTER
Example of a typical client rollout profile
*new market information

31Urbanise.com urbanise
Charging / Payments to suit customers needs
We are constantly evolving our models to suit different customer needs and to ensure we get access to established businesses with large portfolios of buildings and occupants that we can monetise
1. Enterprise Activation fees are earned and invoiced in the first three months and then collected quarterly (all in arrears) spread over the contract period of 3 to 5 years.
2. PAYG is generally invoiced in the quarter that usage occurs and then paid quarterly in arrears. 3. Other revenue represents rebates and grants such as EMDG and R&D Tax Incentive
PAYG License
Fees 70%
Enterprise Activation
Fees 20%
Professional Services
8%
Other 2%
Forecast
FY16 Revenue Mix
*new market information

32Urbanise.com urbanise
Receivables Payment Profile
0
0.5
1
1.5
2
2.5
3
3.5
FY 2016 FY 2017 FY 2018 FY 2019 FY 2020
AU
D M
illio
ns
Expected Cashflows from current invoiced contracts
*new market information

33Urbanise.com urbanise
Contracted Addressable Market
South Africa
UK / Europe
SE Asia
Australia
Contracted Clients Total Estimated Addressable Market
*Represent Contracted Clients in Organic Rollout
Middle East
Top 3
Top 3
Top 3
Top 3
Top 3
Other Clients
Other Clients
Other Clients
Other Clients
Other Clients
8.1K 175
7.3K 89
7.7K 250
1M** 7K
N/A 200
N/A 2K
25K* N/A
7.5K* N/A
12K N/A
50K* 150
17K 120
10K* 60
150K* 150
N/A 5K
N/A 1K
250K*
450
5
158K
307
40
25K
127
6
98K
6.4K
115
32.7K
570
19
24,000
850,000*
Addressable within contracted client portfolios
*new market information

34Urbanise.com urbanise
PLATFORM IN PLACE TO DRIVE GROWTH
35Urbanise.com urbanise
Key growth priorities
§ Substantial interest in Urbanise platform from new potential customers
‒ multiple use capabilities from platform across sectors
§ Mystrata
‒ complete integration of Mystrata
‒ further leverage Mystrata technology and increase cross-sell
‒ expand in UK
§ Expand transactional pricing model outside of Australia
§ Develop customer opportunities in 3 further European countries
§ Enter US market

36Urbanise.com urbanise
§ Global team is in place: 66 people across 6 offices globally
§ Strong interest in Urbanise.com platform
§ Cross-sell with Mystrata providing new growth and market entry
opportunities
§ Full year benefit from new clients expected to positively impact
FY16
Leveraging our platform to drive growth

37Urbanise.com urbanise
APPENDICES

38Urbanise.com urbanise
FY15 above Prospectus revenue forecast
§ Revenue above Prospectus forecast, up 96% to $10.2m‒ higher than anticipated new client wins‒ 15 new clients agreements secured in FY15; expected to positively impact FY16 result
§ Pro-forma EBITDA up 25% to $3.53m‒ includes ramp up of global resources (12 additional team members employed since IPO) and product
development to support converting high levels of interest in Urbanise.com platform into client wins
§ Pro-forma NPAT up 13.5% to $1.7m‒ reflects growth in underlying business
A$000 Statutory FY15 Pro-‐forma FY15 Pro-‐forma FY15
Prospectus forecast Proforma Variance
Revenue 10,169 10,169 9,754 3.1%
Gross Profit 9,933 9,933 9,389 4.5%
EBITDA 2,089 3,530 4,411 -‐20.0%
EBIT 1,076 2,517 3,448 -‐27.0%
Profit / (loss) before tax 1,577 3,018 3,448 -‐12.5%
Profit / (loss) aber tax (165) 1,736 2,414 -‐28.1%

39Urbanise.com urbanise
Cash flows
§ $5.5m million cash used for operating activities‒ payments to suppliers and
employees to fund growth
§ $1.9m cash used for investing activities‒ R&D, devices, office fit-out
§ $19.1m cash from financing activities‒ funds raised in IPO
§ Per Prospectus, no dividend to be paid in respect of FY15, with cash being used to fund growth initiatives
A$’000 FY15 FY14 Change
Net cash provided by / (used in) opera[ng ac[vi[es -‐5,461 693 <<
Net cash provided by / (used in) inves[ng ac[vi[es -‐1,916 -‐2,077 n/m
Net cash provided by financing ac[vi[es 19,129 1,966 >>
Net increase / (decrease) in cash and cash equivalents 11,753 581 >>

40Urbanise.com urbanise
Statutory to pro forma EBITDA
A$’000
Statutory result 2,089
IPO costs 105
Mystrata acquisition and integration 323
Previous year costs 146
One-off costs of establishing new territories 347
June Mystrata loss 19
ESOP upside share performance 201
Lower R&D recoveries 300
Pro-forma EBITDA 3,530

41Urbanise.com urbanise
42Urbanise.com urbanise
Forward looking statements
This presentation is given on behalf of Urbanise.com Limited.
Information in this presentation is for general information purposes only, and is not an offer or invitation for subscription, purchase, or recommendation of securities in Urbanise.com Limited.
Certain statements throughout this document regarding the Company’s financial position, business strategy and objectives of Company management for future operations, are forward-looking statements rather than historical or current facts.
Such forward-looking statements are based on the beliefs of the Company’s management as well as assumptions made by and information currently available to the Company’s management. Such statements are inherently uncertain, and there can be no assurance that the underlying assumptions will prove to be valid.
All data presented in this document reflect the current views of the Company with respect to future events and are subject to these and other risks, uncertainties and assumptions relating to the operations, results of operations, growth strategy and liquidity of the Company.


