30
Redesigning the Medicare Advantage quality bonus program CHAPTER 8

Redesigning the Medicare Advantage
quality bonus program
C H A P T E R8

243 Repo r t t o t h e Cong r e s s : Med i ca r e and t h e Hea l t h Ca r e De l i v e r y S y s t em | J u ne 2019
Redesigning the Medicare Advantage quality bonus program
C H A P T E R 8Chapter summary
The Commission has formalized a set of principles for quality measurement
in the Medicare program (Medicare Payment Advisory Commission 2018a).
The Commission recently applied these principles to design a hospital value
incentive program that includes a small set of population-based outcome,
patient experience, and value measures; scores all hospitals based on the
same absolute and prospectively set performance targets; and accounts for
differences in patients’ social risk factors by distributing payment adjustments
through peer grouping.
The Medicare Advantage (MA) quality bonus program (QBP), which rewards
MA plans on a quality star rating scale, is flawed and inconsistent with the
Commission’s principles for quality measurement. First, the QBP includes
almost 50 quality measures, including process and administrative measures,
instead of focusing on a small set of population-based outcome and patient
experience measures. Second, organizations are rated at the MA contract
level. Contracts cover very wide areas—including noncontiguous states—and
therefore a contract-level rating may not be a useful indicator of the quality of
care provided in a beneficiary’s local area. Third, the QBP uses a “tournament
model,” scoring plans’ performance relative to one another rather than in
relation to predetermined performance targets. Under this model, performance
targets depend on the relative performance of plans and are not known in
In this chapter
• Introduction
• Current MA quality bonus program
• Concerns with the quality bonus program
• Design of an MA value incentive program
• Financing: Applying budget neutrality to MA’s quality payment program
• Summary and next steps
244 Rede s i gn i ng t h e Med i ca r e Advan t age qua l i t y bonu s p r og ram
advance, which makes it difficult for plans to manage their quality improvement
efforts. Fourth, the QBP uses a version of peer grouping to adjust for differences in
plans’ enrolled populations but does not appear to sufficiently capture variation in
quality among Medicare population subgroups (such as low-income beneficiaries
and beneficiaries with disabilities).
An additional issue is that, unlike nearly all of Medicare’s fee-for-service (FFS)
quality incentive programs, the MA–QBP is not budget neutral but is instead
financed by added program dollars. The Commission’s original conception of
a quality incentive program for MA plans was a system that would be budget
neutral and financed with a small percentage of plan payments (Medicare Payment
Advisory Commission 2012). A budget-neutral system is consistent with the
Commission’s principle of providing a financially neutral choice between private
MA plans and traditional FFS Medicare and of ensuring a level playing field
between the two sectors.
In this chapter, we propose a Medicare Advantage value incentive program
(MA–VIP) for assessing quality of care consistent with the Commission’s quality
principles. It is intended to be patient oriented, to encourage coordination across
providers and time, and to promote relevant improvement in the nature of the
delivery system. An MA–VIP would use a small set of population-based outcome
and patient experience measures to evaluate MA quality. The program would use
clear, prospectively set performance standards to translate MA performance on
these quality measures to a reward or a penalty. The MA–VIP would consider
differences in plans’ enrollees by incorporating an improved peer-grouping method
in which quality-based payments are distributed to plans based on their performance
for population groups, such as a plan’s population of beneficiaries who are fully
dual eligible for Medicare and Medicaid.
Unlike the current QBP, which is a bonus-only program financed with additional
dollars, we envision that the MA–VIP would be budget neutral, financed through
a small share of payments from plans. As we have noted, this approach would be
consistent with existing budget-neutral FFS quality programs, and plans would
receive rewards or be subject to penalties based on their performance. Because the
QBP adds about $6 billion a year to Medicare program expenditures, the MA–VIP
would result in program savings and a reduced Part B premium for all Medicare
beneficiaries. One concern with moving to a budget-neutral approach for an MA–
VIP is that it may result in fewer extra benefits for MA enrollees; however, the
available evidence suggests that would not necessarily be the outcome. Such an
outcome was expected when the Patient Protection and Affordable Care Act of 2010
reduced MA payments, but instead, plan bids have declined, and the value of extra
245 Repo r t t o t h e Cong r e s s : Med i ca r e and t h e Hea l t h Ca r e De l i v e r y S y s t em | J u ne 2019
benefits has increased despite the payment reductions (Medicare Payment Advisory
Commission 2019). Although some stakeholders maintain that all QBP payments
have to be used to finance extra benefits, there is no such requirement. Our analysis
of 2019 bid data shows that, for plans newly in bonus status, only a small share of
payment increases from the QBP is passed on to beneficiaries in the form of extra
benefits. Our analysis also found that plans that lost bonus status lowered their bids
in response to the reduced benchmarks, suggesting that plans could become more
efficient if faced with greater financial pressure.
Ideally, an evaluation of quality in MA would be based in part on a comparison
with the quality of care in traditional FFS Medicare, including accountable care
organizations, in local market areas (Medicare Payment Advisory Commission
2010). However, data sources for comparing MA with traditional FFS at the local
market level are limited. Therefore, our proposed MA–VIP design does not yet
include a component for FFS comparison. In the future, better encounter data from
MA and expanded patient experience surveys will help enable comparisons of the
two programs. ■


247 Repo r t t o t h e Cong r e s s : Med i ca r e and t h e Hea l t h Ca r e De l i v e r y S y s t em | J u ne 2019
Representatives 1997). However, comparable data sources across FFS and MA at the local geographic unit are limited, primarily because encounter data from MA plans are not complete enough to be compared with FFS claims data. Once encounter data are more robust, they can form the basis for comparison with FFS claims data using various units of analysis—such as a geographic area—to compare MA and FFS. In the case of patient experience and patient-reported outcome survey results, sample sizes from each program (MA and FFS) would have to be increased to make market-area comparisons. As proposed, the design of the MA–VIP does not initially include a component for FFS comparison, but as the ability to compare the populations improves, the MA–VIP would evolve to serve that purpose.
Current MA quality bonus program
The Patient Protection and Affordable Care Act of 2010 (PPACA) called for CMS to institute a QBP for MA beginning in 2012. The law specifies that a 5-star rating system should be used to determine eligibility for bonus payments. (The statute did not provide additional guidance on the structure or operation of the star system, but CMS had been using a preexisting 5-star rating system to inform beneficiaries of MA quality.) Plans rated 4 stars or higher (“in bonus status”) would receive an increase in their MA benchmarks of 5 percent or, in some counties, 10 percent.1 A higher benchmark can result in an increased level of extra benefits for plan enrollees, but when a benchmark increases because of bonus payments, there is no requirement that all the bonus dollars be used to finance extra benefits. There is a misconception that such a requirement exists, but a higher benchmark can also result in a plan increasing its bid—that is, increasing its payments to providers for the Medicare benefit package and retaining more dollars for profit and administration rather than applying the benchmark increase toward the computation of rebate dollars that finance extra benefits. (When a plan’s bid to provide the Medicare Part A and Part B benefit package is below the benchmark, the plan’s payment rate is equal to its bid plus a rebate amount based on the difference between the bid and the benchmark. The rebate amount must be used to provide additional benefits to enrollees. The rebate amount for plans at 4.5 and 5 stars is 70 percent of the bid–benchmark difference; at 3.5 and 4
Introduction
The Commission maintains that Medicare payments should not be made without considering the quality of care delivered to beneficiaries and has formalized a set of principles for quality measurement in the Medicare program (Medicare Payment Advisory Commission 2018a). The Commission recently applied these principles to design a fee-for-service (FFS) hospital quality payment program. In the March 2019 report to the Congress, the Commission recommended that the Congress replace Medicare’s current hospital quality payment programs with a new, single hospital value incentive program (HVIP). Consistent with the Commission’s principles, the HVIP includes a small set of population-based outcome, patient experience, and value measures; scores all hospitals based on the same absolute and prospectively set performance targets; and accounts for differences in patients’ social risk factors by distributing payment adjustments through peer grouping.
For the past several years, the Commission has pointed out the flaws of the Medicare Advantage (MA) quality bonus program (QBP) in terms of its complexity, inequities in distributing financial rewards, and opportunities for organizations to obtain unwarranted bonuses by consolidating contracts. This chapter reviews our concerns with the current system—in particular, that the QBP lacks key quality measurement components: use of a small set of population-based measures, absolute and prospectively set targets for scoring plans’ performance, and payment adjustments that effectively account for differences in beneficiary social risk factors. To improve the QBP, we introduce an alternative MA value incentive program (MA–VIP) designed to be patient oriented, encourage coordination across providers and time, and promote improvements in the delivery system.
Ideally, Medicare should be able to compare MA and FFS quality in local market areas (Medicare Payment Advisory Commission 2010). Provisions in the Balanced Budget Act of 1997, which are the origins of the current 5-star MA quality rating system, specify that CMS should provide information on the quality of care in private plans: “To the extent available, [beneficiaries should receive information on] plan quality and performance indicators for the benefits under the plan (and how they compare with such indicators under . . . [FFS] . . . in the area involved)” (U.S. House of

248 Rede s i gn i ng t h e Med i ca r e Advan t age qua l i t y bonu s p r og ram
strains state finances because the states pay the Part B premium for the 12 million Medicare beneficiaries who are dually eligible for Medicare and Medicaid.4
The QBP has undergone several changes over the years. Some have been in response to, or consistent with, recommendations or observations the Commission has made with a view toward improving the QBP. At the same time, policy decisions allowing companies to use the consolidation strategy to raise star ratings—by merging lower rated contracts with higher rated contracts and allowing plans to choose the higher rating as applicable to the entire consolidated contract—have been detrimental to the program (Medicare Payment Advisory Commission 2019).
Concerns with the quality bonus program
The MA star system has two purposes: to provide information to beneficiaries about their available options and to serve as the basis for the QBP, which offers financial incentives to promote higher quality. The current system is flawed in that:
• too many measures are scored, diluting results aimed at assessing quality;
• reporting units do not represent market area performance;
• plans are scored against moving, rather than preset, targets; and
• the QBP’s method of accounting for differences in enrollees’ social risk factors does not appear to be effective at capturing these differences.
Proliferation of quality measures scored The Commission’s principles for quality measurement call for using a small set of population-based outcome, patient experience, and value measures. Over the past several years, the Commission has expressed concern that Medicare’s quality measurement programs are “overbuilt,” relying on too many clinical process measures that are, at best, weakly correlated with health outcomes of importance to beneficiaries and the program. Relying on a large number of process measures can reinforce payment
stars, 65 percent of the difference; and below 3.5 stars, 50 percent of the difference).
Star ratings are based on 46 measures of clinical quality, patient experience, and administrative performance. For each measure, a contract receives a score from 1 to 5 stars (with minor exceptions).2 Different categories of measures, as defined by CMS, have different weights. Process measures have a weight of 1, access and patient experience measures have a weight of 1.5, outcome measures have a weight of 3, and the two improvement measures that CMS computes have a weight of 5. The overall star rating is the weighted average of all the measures a plan can report (and the plan must report at least half of the measures).3 For most of the star measures, the threshold, or cut point, for assigning performance results for each of the five star rating levels is determined through a “tournament model.” Under this model, plans are measured against each other’s performance, not against a set performance target. Each year, plans fall into five groups according to their performance results, with the highest group at 5 stars and the lowest at 1 star. Under this system, the cut points that determine the groupings can be higher or lower from year to year, thus producing shifting performance targets.
In addition to being the basis of “bonus payments,” the star rating system is intended to be a source of information about MA quality for beneficiaries. Star ratings—both the overall ratings and star levels for individual measures—are posted at the Medicare Plan Finder site of Medicare.gov. The ratings are updated each October for the October–December annual election period (when beneficiaries can move among plans and between MA plans and FFS).
As of February 2019, among MA contracts with any star rating, about 77 percent of MA beneficiaries were enrolled in MA plans in bonus status. An additional 3 percent of beneficiaries were in bonus status plans because they enrolled in a new contract whose parent organization (i.e., the company sponsoring the contract) had an average star rating at or above 4 stars (reflecting the CMS policy of how bonus dollars are determined in such a case). We estimate that the QBP constitutes about 2.5 percent to 3.0 percent of aggregate payments to MA plans, or about $6 billion a year in additional program costs. This level of additional program expenditures means that all of the nearly 60 million Medicare beneficiaries who have Medicare Part B are obligated to pay an additional $1 per month in their Part B premium—an obligation that also
249 Repo r t t o t h e Cong r e s s : Med i ca r e and t h e Hea l t h Ca r e De l i v e r y S y s t em | J u ne 2019
be merged with a lower rated contract, and the higher star rating immediately applies to the combined entity (through the mechanism discussed in detail in the March 2018 and 2019 reports to the Congress and earlier reports (Medicare Payment Advisory Commission 2019, Medicare Payment Advisory Commission 2018b)). Indeed, through consolidations, the original Hawaii–Iowa contract mentioned above now consists of a service area that includes counties in Arizona, Colorado, Hawaii, Illinois, Iowa, Kansas, Missouri, Nebraska, New Mexico, South Dakota, and Texas. Quality results continue to be reported and evaluated on a contract-wide basis for this multistate contract. Across all MA contracts in 2019, about 45 percent of HMO and local preferred provider organization (PPO) enrollees are in contracts that have a substantial share of enrollment coming from noncontiguous states. Recent legislation changed the policy with respect to consolidations, effective January 1, 2020, so that consolidated contracts receive the weighted average star rating of the combined contracts. However, the new policy still permits organizations to obtain unwarranted bonuses by combining lower rated contracts with higher rated contracts when the averaging method yields an overall bonus-level star rating.
In addition to the concern over organizations receiving unwarranted bonus payments through consolidations, because quality measures are reported to beneficiaries in the Medicare Plan Finder at the contract level, beneficiaries see inaccurate information. In the case of a consolidation to achieve bonus status, for example, a new bonus-level star rating is immediately assigned to a contract that is being merged into another contract rated 4 stars or higher. For contracts covering wide geographic areas, the reported data on quality can be inaccurate because the data represent average quality results across, for example, 11 different states.6
The Commission has a long-standing recommendation that Medicare should collect, calculate, and report quality measurement results in MA at a local geographic level because of differences in quality across geographic areas and because beneficiaries should have information that is specific to their geographic area (Medicare Payment Advisory Commission 2010).7 While it is a matter of concern that nearly half of MA beneficiaries are in coordinated care plans with contracts spanning noncontiguous states, there is also intrastate variation in the quality of care. For example, in California, among
incentives to overuse measured services. Process measures are also burdensome for providers to report while yielding limited information to support clinical improvement.
The proliferation of measures (up to 46 in the MA–QBP) that determine star ratings gives plans several avenues to achieve a bonus-level overall rating, even if their performance is uneven and results for outcome measures are below bonus-level performance. Of the 376 MA contracts with star ratings (excluding results from Part D outcome measures) in 2019:
• Seventy-one contracts (covering 7 million enrollees) had administrative measures (which we also refer to in the chapter as insurance function measures) averaging 4.5 stars or higher but outcome results averaging less than 3.5 stars. Thirty-four of those contracts (covering a little over 5 million enrollees) had an overall star rating of 4 or 4.5 (bonus level).
• Fourteen contracts, covering about 600,000 enrollees, had Consumer Assessment of Healthcare Providers and Systems® (CAHPS®) results averaging 4.5 stars or higher but had outcome results averaging less than 3.5 stars.5 Ten of the 14 (with enrollment of about 500,000) had an overall star rating of 4 or 4.5 (bonus level), which might not be a desirable result if outcome measures and patient experience are each considered equally important measure domains.
• One contract (with over 90,000 enrollees) had clinical process of care measures averaging 4.5 stars or higher but outcome measures averaging less than 3.5 stars.
Effect of inappropriate reporting units: The contract as the reporting unit and contract consolidationsA major reason for the flaws in the current system is that the unit of measurement for reporting on and evaluating quality is the MA contract. One of the problems with this unit is that MA contracts can include disparate geographic areas. For example, in 2013, one contract’s service area consisted of counties in two noncontiguous states, Hawaii and Iowa. The star rating for this contract would reflect performance in two completely different service areas and may not provide a full reflection of plan quality in either area.
Further, MA organizations can consolidate contracts to artificially raise star ratings. A higher rated contract can
250 Rede s i gn i ng t h e Med i ca r e Advan t age qua l i t y bonu s p r og ram
the potential availability of an absolute and prospectively set system of targets. For a given HEDIS measure, for example, plans are grouped into five star categories through a statistical algorithm that determines clusters of levels of performance. The algorithm identifies cut points for each star level based on these clusters. CMS recently modified the approach to put in place, as of 2020, “guardrails” whereby, from one year to the next, the increase or decrease in cut points is limited to a 5 percent change (42 CFR §423.186(i)). However, a plan’s reward depends only on its contract’s performance relative to the performance of other contracts. Further, the cut points for each star level are determined after the performance year is completed, so plans cannot know in advance what outcomes they need to achieve, making it difficult for providers and plans to manage their quality improvement efforts. Another concern with the tournament model is that for each year, it is a point-in-time determination of the best and worst performers, and each year will have a (potentially different) set of best and worst performers.
CMS changed to a primarily tournament model after a comparison of results over time between measures that had fixed targets for 4-star performance versus the measures that had star levels based on the tournament model. CMS found that the measures in the tournament model showed greater improvement over time than the measures with a fixed, predetermined cutoff for 4-star performance (bonus-level performance) (Centers for Medicare & Medicaid
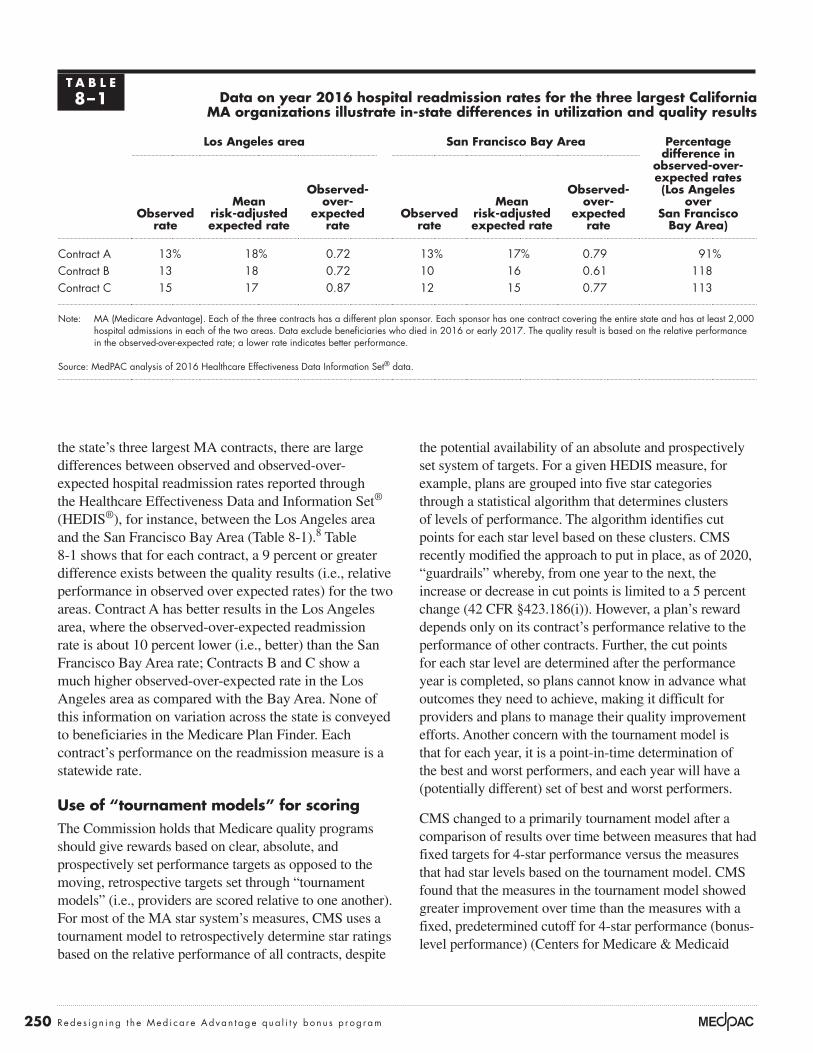
the state’s three largest MA contracts, there are large differences between observed and observed-over-expected hospital readmission rates reported through the Healthcare Effectiveness Data and Information Set® (HEDIS®), for instance, between the Los Angeles area and the San Francisco Bay Area (Table 8-1).8 Table 8-1 shows that for each contract, a 9 percent or greater difference exists between the quality results (i.e., relative performance in observed over expected rates) for the two areas. Contract A has better results in the Los Angeles area, where the observed-over-expected readmission rate is about 10 percent lower (i.e., better) than the San Francisco Bay Area rate; Contracts B and C show a much higher observed-over-expected rate in the Los Angeles area as compared with the Bay Area. None of this information on variation across the state is conveyed to beneficiaries in the Medicare Plan Finder. Each contract’s performance on the readmission measure is a statewide rate.
Use of “tournament models” for scoringThe Commission holds that Medicare quality programs should give rewards based on clear, absolute, and prospectively set performance targets as opposed to the moving, retrospective targets set through “tournament models” (i.e., providers are scored relative to one another). For most of the MA star system’s measures, CMS uses a tournament model to retrospectively determine star ratings based on the relative performance of all contracts, despite
T A B L E8–1 Data on year 2016 hospital readmission rates for the three largest California
MA organizations illustrate in-state differences in utilization and quality results
Los Angeles area San Francisco Bay Area Percentage difference in
observed-over- expected rates (Los Angeles
over San Francisco
Bay Area)Observed
rate
Mean risk-adjusted expected rate
Observed- over-
expected rate
Observed rate
Mean risk-adjusted expected rate
Observed- over-
expected rate
Contract A 13% 18% 0.72 13% 17% 0.79 91%Contract B 13 18 0.72 10 16 0.61 118Contract C 15 17 0.87 12 15 0.77 113
Note: MA (Medicare Advantage). Each of the three contracts has a different plan sponsor. Each sponsor has one contract covering the entire state and has at least 2,000 hospital admissions in each of the two areas. Data exclude beneficiaries who died in 2016 or early 2017. The quality result is based on the relative performance in the observed-over-expected rate; a lower rate indicates better performance.
Source: MedPAC analysis of 2016 Healthcare Effectiveness Data Information Set® data.

251 Repo r t t o t h e Cong r e s s : Med i ca r e and t h e Hea l t h Ca r e De l i v e r y S y s t em | J u ne 2019
only three distinct clusters, with the lowest group receiving a 3-star rating. Note that 13 contracts with a 2019 rate below 92 percent would have received a 1-star rating in 2018 rather than the 3-star rating they received for 2019. Table 8-2 also shows that the way the tournament model is implemented yields other inconsistent results. While a 97 percent rate was a 4-star level of performance in 2018, the rate is assigned 5 stars in 2019; and a 95 percent rate that received 3 stars in 2018 received 4 stars for 2019. The kidney disease monitoring measure illustrates the effect of setting too low a threshold under the fixed-target model and the problem of the large variations in star assignments produced by the clustering method, even when there have been improvements in measure results.
Possibly ineffective accounting for differences in enrollees’ social risk factorsCMS takes into account differences in a plan’s enrolled population, including social risk factors, not through adjusting raw measure results, but by adjusting overall star ratings. CMS instituted a type of peer-grouping mechanism that adjusts a contract’s overall star rating
Services 2014). However, for some measures, CMS had set too low a threshold under the fixed-target model, and the new clustering algorithm produced large variations in star assignments even when there had been improvement in measure results.
An example is the kidney disease monitoring measure. The measure had a preset 4-star threshold of an 85 percent monitoring rate in 2014 and 2015—a threshold that had been established in 2012. The method of determining stars for this measure was changed to the tournament model beginning in 2016, after which there was improvement in the rates. The preset target of 85 percent was the 7th percentile of performance in 2014, making possible a 4.53 average star rating for 2014 and 4.17 for 2015. In 2016, with the tournament model, the average star rating dropped to 3.34 and improved to 3.73 by 2018 (data not shown). In the 2018 star ratings (measurement year 2016), there were no plans below a 90 percent level for this measure (Table 8-2). In the most recent star data, though, there are contracts reporting a monitoring rate below 90 percent, yet there are not plans at all five levels of star ratings. It appears that the clustering algorithm resulted in
T A B L E8–2 Kidney disease monitoring rates are generally high, but the clustering algorithm
results in different star levels associated with each rate from year to year
2018 stars (released October 2017) 2019 stars (released October 2018)
Rate
Number of plans at rate
Star rating
Share of plans Rate
Number of plans at rate
Star rating
Share of plans
100% 5 5At 5 stars: 27%
100% 5 5
At 5 stars: 44%99 27 5 99 31 598 70 5 98 54 597 65 4
At 4 stars: 34%97 77 5
96 63 4 96 77 4At 4 stars: 35%
95 54 3At 3 stars: 27%
95 56 494 46 3 94 26 3
At 3 stars: 21%
93 25 2At 2 stars: 10%
93 24 392 12 2 92 16 391 5 1
At 1 star: 3%91 10 3
90 5 1 90 1 389 1 387 1 3
Note: The number of stars awarded in 2018 ranged from 1 star to 5 stars. For 2019, the range was from 3 stars to 5 stars.
Source: MedPAC analysis of CMS star rating data.
252 Rede s i gn i ng t h e Med i ca r e Advan t age qua l i t y bonu s p r og ram
plans with large shares of LIS enrollees are generally more poorly performing plans. Plans can tailor offerings to attract LIS enrollees through special needs plans for Medicare–Medicaid dually eligible beneficiaries or by offering benefit packages with a premium set specifically at or below the regional low-income benchmark level and a benefit structure attractive to the LIS population. We have found that such options are lower quality options relative to options in the same geographic areas available to non-LIS beneficiaries. Three million MA enrollees are in counties in which the minimum plan rating for non-LIS options is 4 stars, but available LIS options include only plans below 4 stars. Part of the reason for this difference could be that not all companies offer options that are attractive to, or meet the needs of, LIS individuals. Of the seven companies (plan sponsors) with 5-star contracts, three do not offer options tailored to low-income beneficiaries. The average proportion of LIS enrollment in those companies is about 9 percent (compared with 29 percent for the overall MA average,
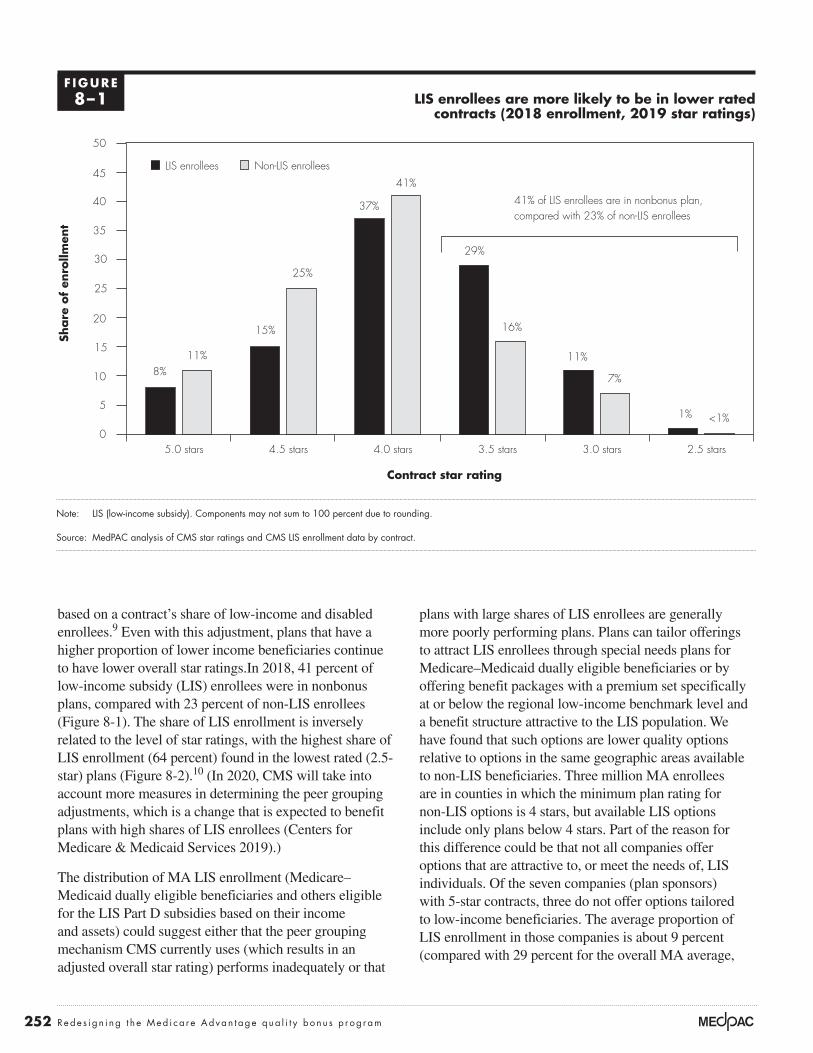
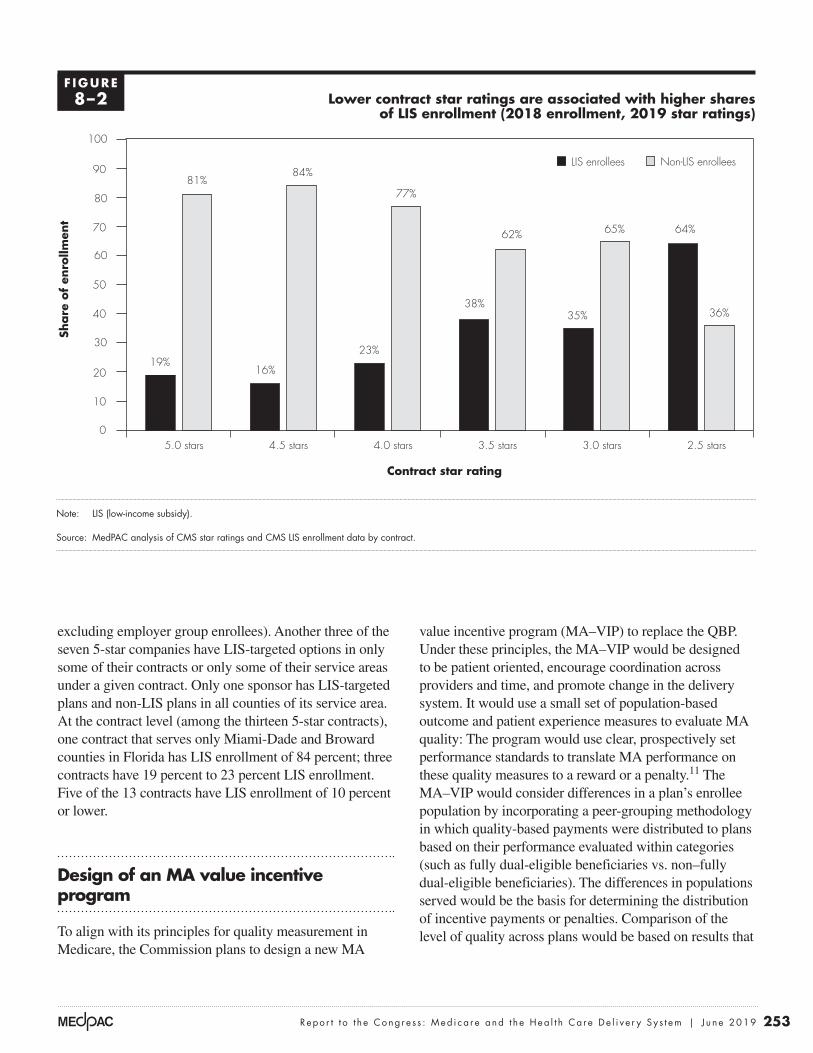
based on a contract’s share of low-income and disabled enrollees.9 Even with this adjustment, plans that have a higher proportion of lower income beneficiaries continue to have lower overall star ratings.In 2018, 41 percent of low-income subsidy (LIS) enrollees were in nonbonus plans, compared with 23 percent of non-LIS enrollees (Figure 8-1). The share of LIS enrollment is inversely related to the level of star ratings, with the highest share of LIS enrollment (64 percent) found in the lowest rated (2.5-star) plans (Figure 8-2).10 (In 2020, CMS will take into account more measures in determining the peer grouping adjustments, which is a change that is expected to benefit plans with high shares of LIS enrollees (Centers for Medicare & Medicaid Services 2019).)
The distribution of MA LIS enrollment (Medicare–Medicaid dually eligible beneficiaries and others eligible for the LIS Part D subsidies based on their income and assets) could suggest either that the peer grouping mechanism CMS currently uses (which results in an adjusted overall star rating) performs inadequately or that
LIS enrollees are more likely to be in lower rated contracts (2018 enrollment, 2019 star ratings)
Note: LIS (low-income subsidy). Components may not sum to 100 percent due to rounding.
Source: MedPAC analysis of CMS star ratings and CMS LIS enrollment data by contract.
Freestanding Medicare margins....Sh
are
of
enro
llmen
tFIGURE4-X
Note: Note and Source are in InDesign.
Source:
Notes about this graph:• Data is in the datasheet. Make updates in the datasheet.• WATCH FOR GLITCHY RESETS WHEN YOU UPDATE DATA!!!!• The column totals were added manually.• I had to manually draw tick marks and axis lines because they kept resetting when I changed any data.• I can’t delete the legend, so I’ll just have to crop it out in InDesign.• Use direct selection tool to select items for modification. Otherwise if you use the black selection tool, they will reset to graph default when you change the data.• Use paragraph styles (and object styles) to format. • Data was from: R:\Groups\MGA\data book 2007\data book 2007 chp1
0
5
10
15
20
25
30
35
40
45
50
2.5 stars3.0 stars3.5 stars4.0 stars4.5 stars5.0 stars
Non-LIS enrolleesLIS enrollees
Contract star rating
8%11%
15%
25%
37%
41%
29%
16%
11%
7%
<1%1%
41% of LIS enrollees are in nonbonus plan,compared with 23% of non-LIS enrollees
F IGURE8–1
253 Repo r t t o t h e Cong r e s s : Med i ca r e and t h e Hea l t h Ca r e De l i v e r y S y s t em | J u ne 2019
value incentive program (MA–VIP) to replace the QBP. Under these principles, the MA–VIP would be designed to be patient oriented, encourage coordination across providers and time, and promote change in the delivery system. It would use a small set of population-based outcome and patient experience measures to evaluate MA quality: The program would use clear, prospectively set performance standards to translate MA performance on these quality measures to a reward or a penalty.11 The MA–VIP would consider differences in a plan’s enrollee population by incorporating a peer-grouping methodology in which quality-based payments were distributed to plans based on their performance evaluated within categories (such as fully dual-eligible beneficiaries vs. non–fully dual-eligible beneficiaries). The differences in populations served would be the basis for determining the distribution of incentive payments or penalties. Comparison of the level of quality across plans would be based on results that
excluding employer group enrollees). Another three of the seven 5-star companies have LIS-targeted options in only some of their contracts or only some of their service areas under a given contract. Only one sponsor has LIS-targeted plans and non-LIS plans in all counties of its service area. At the contract level (among the thirteen 5-star contracts), one contract that serves only Miami-Dade and Broward counties in Florida has LIS enrollment of 84 percent; three contracts have 19 percent to 23 percent LIS enrollment. Five of the 13 contracts have LIS enrollment of 10 percent or lower.
Design of an MA value incentive program
To align with its principles for quality measurement in Medicare, the Commission plans to design a new MA
Lower contract star ratings are associated with higher shares of LIS enrollment (2018 enrollment, 2019 star ratings)
Note: LIS (low-income subsidy).
Source: MedPAC analysis of CMS star ratings and CMS LIS enrollment data by contract.
Freestanding Medicare margins....Sh
are
of
enro
llmen
tFIGURE4-X
Note: Note and Source are in InDesign.
Source:
Notes about this graph:• Data is in the datasheet. Make updates in the datasheet.• WATCH FOR GLITCHY RESETS WHEN YOU UPDATE DATA!!!!• The column totals were added manually.• I had to manually draw tick marks and axis lines because they kept resetting when I changed any data.• I can’t delete the legend, so I’ll just have to crop it out in InDesign.• Use direct selection tool to select items for modification. Otherwise if you use the black selection tool, they will reset to graph default when you change the data.• Use paragraph styles (and object styles) to format. • Data was from: R:\Groups\MGA\data book 2007\data book 2007 chp1
0
10
20
30
40
50
60
70
80
90
100
2.5 stars3.0 stars3.5 stars4.0 stars4.5 stars5.0 stars
Non-LIS enrolleesLIS enrollees
Contract star rating
19%
81%
16%
84%
23%
77%
38%
62%
35%
65%
36%
64%
F IGURE8–2
254 Rede s i gn i ng t h e Med i ca r e Advan t age qua l i t y bonu s p r og ram
measure set should continue to evolve as the encounter data improve and clinical data from electronic health records and other clinical sources become available for quality measurement.13 In the future, we can model the MA–VIP payment adjustments using measure results calculated from three data sources: (1) encounter data that MA plans submit to CMS supplemented with other administrative data sources (e.g., Medicare Provider Analysis and Review (MedPAR) hospital inpatient data); (2) beneficiary-level patient experience survey data (e.g., CAHPS); and (3) beneficiary-level patient-reported outcome survey data (i.e., the Health Outcomes Survey (HOS) results). Once MA encounter data have improved, relying on these data as the source of quality evaluations will bring greater uniformity to the comparison among MA plans and with FFS. In addition, the use of MA encounter data and FFS claims-based data would have the advantage of not introducing new reporting systems or new reporting requirements to either program.14,15
Avoidable hospitalizations
In addition to disruptions to patients and caregivers and costs to the health care system, hospital admissions put patients at risk of hospital-acquired infections and complications. Hospitalizations due to conditions such as diabetes and pneumonia are potentially preventable if ambulatory care is provided in a timely and effective manner. Patients may have required acute-level services at the time they sought care, but the need for the admission might have been avoided with appropriate ambulatory care and coordination activities. Rates of avoidable hospitalizations can reflect an MA plan’s quality of care, because high-quality MA plans should be able to manage beneficiary, hospital, and physician relations to coordinate care and provide appropriate access (Wholey et al. 2003).
A measure of avoidable hospitalizations is based on the premise that, while not every admission for a chronic or acute ambulatory care–sensitive condition can be averted, comparatively high risk-adjusted rates of these events can identify opportunities for improvement in ambulatory care systems. The Commission has previously analyzed unadjusted FFS rates of avoidable hospitalizations in local market areas and found variation across population groups (e.g., by age, sex, Medicaid eligibility) and across two definitions of market areas (Medicare Payment Advisory Commission 2018a).16 This variation signals opportunities to improve the quality of care within areas and the potential to use the measure to compare quality across local health care markets. Recently, we have worked with a contractor to further develop a risk-adjusted
are not adjusted by differences in the social risk factors of the population.
The Commission has recommended that the Secretary take several steps to foster Medicare’s ability to compare the quality of care between the MA and traditional FFS programs (Medicare Payment Advisory Commission 2010). We are limited in this effort, however, mainly because of the lack of FFS patient experience and patient-reported outcome survey data as well as robust MA encounter data. Absent these necessary data, our MA–VIP design focuses on comparing quality of care among MA plans, with the continued goal of being able to compare MA and FFS in future years.
Small set of population-based measuresUnder one of the Commission’s principles, Medicare quality programs should include a small set of population-based outcome and patient experience measures that, where practical, should align across all Medicare-accountable entities and providers, including MA plans and accountable care organizations (ACOs) (Medicare Payment Advisory Commission 2019, Medicare Payment Advisory Commission 2018a). So that these measures are not unduly burdensome for providers, they should largely be calculated or administered by CMS, preferably with data already being reported, such as claims and encounter data.
Most of the outcome and patient experience measure domains we propose for an MA–VIP are existing quality measure domains and include measures the Commission has discussed in the past as a basis for comparing MA and FFS and has discussed including in a voluntary value program for groups of clinicians (Medicare Payment Advisory Commission 2018a, Medicare Payment Advisory Commission 2015).12 The measure domains include avoidable hospitalizations, avoidable emergency department (ED) visits, readmissions, patient experience, and patient-reported outcomes. Currently, the lack of complete MA encounter data limits the population-based measures we can include in the MA–VIP. For example, our analysis has found the post-acute care encounter data to be incomplete, so we cannot use the data to directly measure post-acute care for beneficiaries. Also, encounter data, like FFS claims data, do not include detailed clinical information such as tests performed during medical visits, discharge plans, and lab results (e.g., cholesterol levels) that could allow us to measure preventive care, coordination across providers, and clinical outcomes without a need for medical record review. The MA–VIP

255 Repo r t t o t h e Cong r e s s : Med i ca r e and t h e Hea l t h Ca r e De l i v e r y S y s t em | J u ne 2019
builds on existing literature and measure development work to identify ED visits that could have been treated in a physician office (e.g., chronic care management) or urgent care center (e.g., urinary tract infection). As with the avoidable hospitalizations measure, the avoidable ED visits measure includes a risk adjustment model that could be applied to FFS, ACO, and MA populations.
The avoidable ED visits measure represents the risk-adjusted ratio of observed-to-expected potentially avoidable ED visits. The total avoidable ED visits ratio includes both chronic ambulatory care–sensitive conditions (e.g., diabetes) and acute ambulatory care–sensitive conditions (e.g., urinary tract infection). Ideally, our proposed MA–VIP would develop avoidable ED visit rates based on encounter data, but the robustness of these data remains an issue. We plan to test the use of encounter data to calculate avoidable ED visit rates in MA plans, but we may find the data are not complete enough for our modeling.
Readmissions
Hospital readmissions are disruptive to patients and caregivers and costly to the health care system; they also put patients at additional risk of hospital-acquired infections and complications. Readmissions are a major source of patient and family stress and can contribute substantially to loss of functional ability, particularly in older patients. Measuring and adjusting payments based on a plan’s readmission rates holds the plan accountable for ensuring that beneficiaries have the discharge information they need and encourages the plan to facilitate coordination with other providers. The HEDIS Plan All-Cause Readmissions measure has the maximum weight in the current MA–QBP program, and plan-reported performance on the measure has improved over time.
In the MA–VIP, plans would be scored on their risk-adjusted rates of unplanned readmissions within 30 days of discharge for all conditions, based on encounter and administrative data. In future MA–VIP modeling, we could use the readmissions measure used in the HVIP, which has a more complete and accurate risk adjustment model; it is based on the entire FFS population, whereas the HEDIS readmission risk adjustment model is based on the experience of a subset of MA enrollees.
Patient/enrollee experience
A new MA–VIP should include population-based enrollee experience measures, based on the Commission’s
avoidable hospitalizations measure. The measure builds on existing measure specifications and definitions (HEDIS Hospitalization for Potentially Preventable Complications and the Agency for Healthcare Research and Quality (AHRQ) Prevention Quality Indicators), but with a more complete and accurate risk adjustment model that could be applied to FFS, ACO, and MA populations.17,18
The avoidable hospitalizations measure represents the risk-adjusted ratio of observed-to-expected potentially avoidable admissions. The total avoidable hospitalizations ratio we could use for MA–VIP modeling includes both chronic ambulatory care–sensitive conditions (e.g., diabetes) and acute ambulatory care–sensitive conditions (e.g., pneumonia) based on encounter data and supplemented with administrative data (e.g., MedPAR hospital inpatient data).
Avoidable emergency department visits
ED visits are costly and can lead to adverse consequences such as hospitalization, confusion, and complications from testing and treatment. Some ED visits are preventable, which can indicate poor management of chronic conditions (e.g., hypertension), inadequate access to care for acute conditions (e.g., low back pain), or poor choices on the part of patients (Dowd et al. 2014). ED visits for conditions that are preventable and treatable with appropriate primary care decrease health system efficiency and raise costs (Enard and Ganelin 2013). Our recent analysis found, conservatively, that about 7 percent of FFS ED visits were nonurgent and thus could likely have been appropriately treated in a physician’s office or urgent care center (see Chapter 11 of this report).
Existing population-based measures of avoidable ED visits include AHRQ preventable ED visits, New York University ED visits algorithm, and 3M™ potentially preventable ED visits. But none of these measures is currently included in the MA–QBP or other Medicare quality incentive programs. We have previously calculated FFS avoidable ED visit results for local market areas using the 3M methodology and found variation in avoidable ED visit rates across areas (Medicare Payment Advisory Commission 2017). However, the Commission expressed concern that the 3M measure was not available in the public domain and that providers could find the measure definitions overly complicated (Medicare Payment Advisory Commission 2017). Therefore, we have been working with a contractor to develop a less complicated, risk-adjusted avoidable ED visit measure. The measure
256 Rede s i gn i ng t h e Med i ca r e Advan t age qua l i t y bonu s p r og ram
health, which are star measures in the MA–QBP. As previously described, the Commission has expressed concerns about the HOS, including that the HOS has often produced results showing no significant outcome differences among MA plans (i.e., floor and ceiling effect) (Medicare Payment Advisory Commission 2010). We encourage CMS to continue to improve the HOS survey to meaningfully capture patient-reported outcomes, such as revising the number of surveys required to calculate reliable results (Rose et al. 2019). In the MA–VIP, we propose to score a composite of the case-mix-adjusted maintenance and improvement measures. We anticipate using beneficiary-level HOS survey data to calculate an enrollee-reported outcomes composite for plans in an MA–VIP modeling exercise.
Role of process and insurance function measures
Outside of the outcome and enrollee experience measures scored in the MA–VIP, Medicare can use other quality measures and compliance standards to monitor MA plan performance and publicly report this information to beneficiaries (e.g., star rating and display measures). For example, Medicare can continue to collect, track, and publicly report some HEDIS process measures that are tied to outcomes. Some research has shown that removing measures from the star rating public reporting and financial incentives program did not result in performance declines, nor did performance trends differ from measures remaining in the star ratings (Reid et al. 2019).
Health plans should be held accountable for their insurance functions through compliance standards, not through the MA–VIP. A Medicare beneficiary should be able to rely on CMS’s decision to enter into an MA contract with a given organization as an assurance that the organization is able to provide good quality care and can administer the Medicare contract effectively and efficiently. Even if a plan has good clinical quality and outcomes, if it is unable to administer a contract it should be placed under a corrective action plan, have sanctions imposed (such as suspending enrollment and marketing for the plan), or, in extreme cases, have its contract terminated if it is unable to adequately perform the insurance and contract administration functions required of an MA plan.
Reporting unit
Under the proposed MA–VIP, we will calculate the quality of each parent organization (e.g., UnitedHealthcare) within a local market area (e.g., Washington, DC). This approach would be different from the current system,
principles. When patients have a better experience, they are more likely to adhere to treatments, return for follow-up appointments, and engage with the health care system by seeking appropriate care. The MA–CAHPS is a national standardized survey instrument and data collection method for measuring enrollees’ perspectives on the quality of health services provided by MA plans. The survey allows Medicare, plans, beneficiaries, and others to make objective and meaningful comparisons of MA plans. Since 2011, CMS and MA plans have worked with third-party survey vendors to collect survey results annually from a random sample of each plan’s members. The survey results are used to calculate seven core measures of enrollee experience: (1) getting needed care, (2) getting appointments and care quickly, (3) customer service, (4) rating of health care quality, (5) rating of health plan, (6) getting needed prescription drugs, and (7) care coordination. These MA–CAHPS measures are star measures in the QBP and are publicly reported on the Medicare Plan Finder website. The Commission has discussed opportunities for CMS to improve the CAHPS survey such as including an overall “net promoter” measure (i.e., a measure of whether a beneficiary would be willing to recommend his or her plan to others). CMS should also consider changes to the survey administration protocol that allow plans to receive quicker survey results to implement in their quality improvement activities (e.g., web-based vs. mail and phone survey modes).
In the MA–VIP, we propose to score an enrollee experience composite of all seven MA–CAHPS case-mix-adjusted measures. This approach captures a more comprehensive picture of enrollees’ experience with a plan’s services compared with using only the overall rating or a subset of MA–CAHPS measures. We expect to use beneficiary-level MA–CAHPS survey data to calculate an enrollee experience composite for each of the plans in an MA–VIP modeling exercise.
Patient-reported outcomes: Improving or maintaining physical and mental health status
Beneficiaries are a valuable and, arguably, authoritative source of information on outcomes, so the MA–VIP should include enrollee-reported outcomes to assess the quality of care MA beneficiaries receive. MA plans are currently required to collect HOS responses from a random sample of their Medicare beneficiaries and, two years later, survey the same beneficiaries again. HOS results are used to calculate plan-level measures of improved or maintained physical health and mental

257 Repo r t t o t h e Cong r e s s : Med i ca r e and t h e Hea l t h Ca r e De l i v e r y S y s t em | J u ne 2019
A plan’s total MA–VIP score is the average of all of its points earned across the five measure domains. Our MA–VIP model treats each measure as an equally weighted, separate domain (each domain is worth 20 percent of the total score), as we proposed for the HVIP. Policymakers could give the measure domains different weights based on a ranking that takes into account interests shared by the Medicare program and its beneficiaries.
Using peer groups to convert performance to rewards and penaltiesMedicare should also take into account, as necessary, differences in enrollee populations, including social risk factors. Because adjusting measure results for social risk factors can mask disparities in clinical performance, Medicare should account for social risk factors by directly adjusting payment through peer grouping. In our March 2019 report to the Congress, we described how our HVIP model that incorporated these principles produced payment adjustments more equitably compared with the existing hospital quality payment programs. Similarly, the proposed MA–VIP can link payment to quality of care to reward MA plans for providing quality care efficiently. (Although this discussion uses the term MA plan, the unit of measurement would be the MA parent organization in a local market area.)
In a departure from the recommended HVIP for hospitals, we recommend peer grouping by local area rather than at the national level. In the HVIP, we classified hospitals at the national level into 10 peer groups based on their share of fully dual-eligible beneficiaries treated. For each peer group, we created a separate pool of dollars that was distributed within the peer group’s hospitals as a reward or penalty based on their quality performance. The peer groups with a higher share of fully dual-eligible beneficiaries received a higher reward (more of a payment adjustment) for higher quality, compared with the peer groups with a smaller share of fully dual-eligible beneficiaries.
We created HVIP peer groups at the national level because we did not believe geography itself should be a factor in the quality of care hospitals provide. In contrast, the Commission favors local market areas for assessing quality in MA, for several reasons. MA plans often leave or enter new markets or do not operate in certain markets, which means, in a sense, they choose their enrollee populations. Plans can affect their enrollment mix by designing benefit packages that are attractive (or unattractive) to particular populations—which is not the
under which the star ratings are determined at the contract level, allowing a single star rating to apply to the contract’s entire service area. Modeling under the proposed MA–VIP will also distribute penalties or rewards to each parent organization in a local market area. Comparing the quality of care within market areas can lead to the ability to compare quality in MA with quality in FFS and can provide more meaningful information to beneficiaries. We recognize that some market areas may have a small number of parent organizations offering plans (and in some areas there may be only one organization in the MA market). So, the MA–VIP may have to include an alternative approach for determining how such areas would be participating in the redesigned system—such as by using combinations of market areas (which would also be a way of dealing with markets with small numbers of enrollees). How to address small sample sizes is an implementation issue for CMS to consider.
Scoring methodology using prospective performance targetsUnlike the current MA–QBP, which scores plans’ performance on quality relative to other plans’ performance scores, the MA–VIP is designed to reward or penalize a plan based on the plan’s performance relative to prospectively set targets for each measure domain. Medicare can define the performance targets (i.e., set the performance scale) for each measure domain using different methods. For example, the continuous scale of targets can be set along a broad distribution of historical data so that most entities have the opportunity to earn credit for their performance. Medicare could also start the continuous scale of targets around a desired value to drive quality improvement above that value. Medicare can assess targets annually and, if needed, revise them depending on whether expectations for quality achievement are met. (Multiyear targets for quality improvement might simplify administration of the MA–VIP, but there is a tension between multiyear targets and the budget-neutral approach to financing, which is discussed later in the chapter. Revising targets each year would allow yearly calibration between (1) dollars expended as bonuses or reduced payments through penalties and (2) the dollar amount that would most closely approximate budget neutrality in each year.)
For the proposed MA–VIP modeling, we plan to set the scale of targets along a broad distribution of national historical data. MA plans earn points for their performance on each of the five quality domains based on a continuous scale, starting at 0 and gradually increasing to 10 points.
258 Rede s i gn i ng t h e Med i ca r e Advan t age qua l i t y bonu s p r og ram
MA–VIP will link payment to the quality of care in order to reward plans for efficiently providing high-quality care to beneficiaries.
We use eligibility for full Medicaid benefits, like we do in the HVIP, as a proxy for whether a plan’s members are more difficult to treat because individuals with full Medicaid benefits are much more likely than other Medicare beneficiaries to be disabled, have multiple chronic conditions, and have functional impairments. Policymakers could consider using other social risk factors to define peer groups, such as LIS and disability status (which is a current adjustment factor in the MA–QBP) and refine the definitions as more data become available. The text box illustrates how the MA–VIP would use peer grouping within a local market area.
case for hospitals. Also, beneficiaries can and often do switch plans within their local market areas because of changes in cost. Therefore, we propose to calculate the MA–VIP within a local market area with stratified scoring and pools of dollars for fully dual-eligible beneficiaries (Peer Group 1) and non–fully dual-eligible beneficiaries (Peer Group 2). (The MA–VIP peer groups are groups of beneficiaries, not groups of providers like in the HVIP; however, the same principle of accounting for differences in social risk factors through payment adjustment applies.)
We anticipate that peer groups in the MA–VIP with more social risk factors will receive a higher reward for higher quality, like in the HVIP. Under the MA–VIP, we also anticipate that grouping different populations served by a plan within a local area would make payment adjustments more equitable compared with the existing QBP. The
Illustration of the Medicare Advantage value incentive program’s use of peer grouping to convert quality performance to rewards or penalties in a local market area
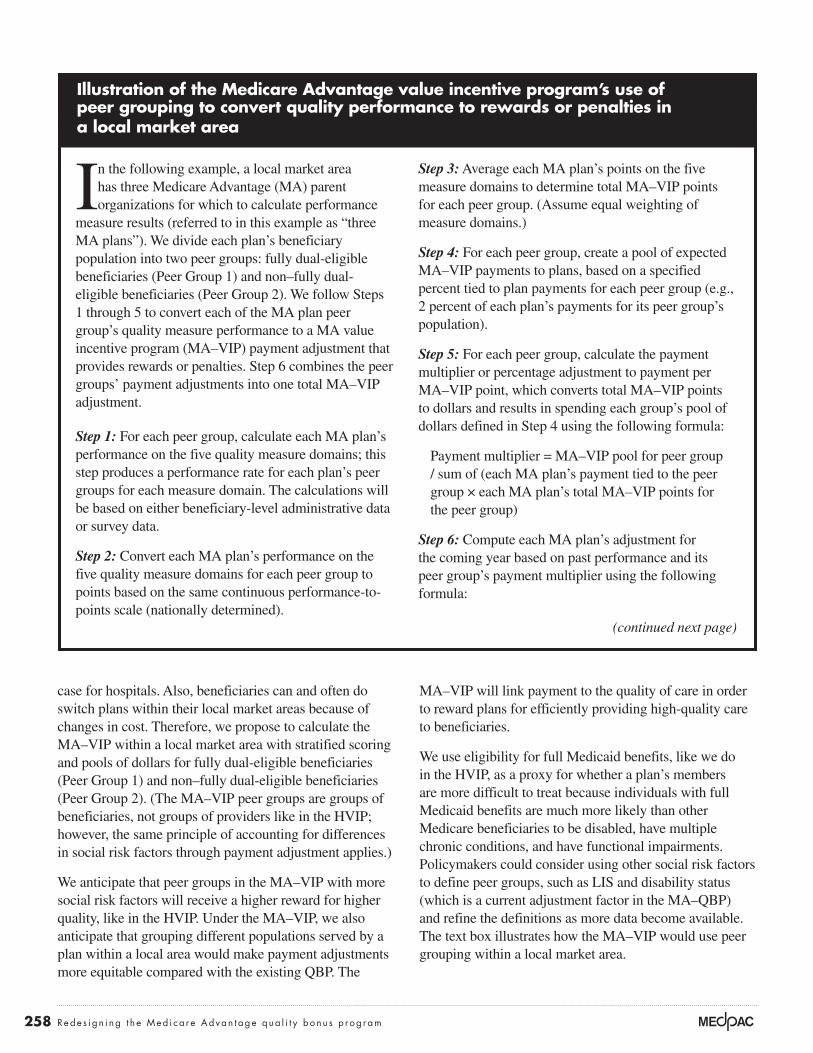
In the following example, a local market area has three Medicare Advantage (MA) parent organizations for which to calculate performance
measure results (referred to in this example as “three MA plans”). We divide each plan’s beneficiary population into two peer groups: fully dual-eligible beneficiaries (Peer Group 1) and non–fully dual-eligible beneficiaries (Peer Group 2). We follow Steps 1 through 5 to convert each of the MA plan peer group’s quality measure performance to a MA value incentive program (MA–VIP) payment adjustment that provides rewards or penalties. Step 6 combines the peer groups’ payment adjustments into one total MA–VIP adjustment.
Step 1: For each peer group, calculate each MA plan’s performance on the five quality measure domains; this step produces a performance rate for each plan’s peer groups for each measure domain. The calculations will be based on either beneficiary-level administrative data or survey data.
Step 2: Convert each MA plan’s performance on the five quality measure domains for each peer group to points based on the same continuous performance-to-points scale (nationally determined).
Step 3: Average each MA plan’s points on the five measure domains to determine total MA–VIP points for each peer group. (Assume equal weighting of measure domains.)
Step 4: For each peer group, create a pool of expected MA–VIP payments to plans, based on a specified percent tied to plan payments for each peer group (e.g., 2 percent of each plan’s payments for its peer group’s population).
Step 5: For each peer group, calculate the payment multiplier or percentage adjustment to payment per MA–VIP point, which converts total MA–VIP points to dollars and results in spending each group’s pool of dollars defined in Step 4 using the following formula:
Payment multiplier = MA–VIP pool for peer group / sum of (each MA plan’s payment tied to the peer group × each MA plan’s total MA–VIP points for the peer group)
Step 6: Compute each MA plan’s adjustment for the coming year based on past performance and its peer group’s payment multiplier using the following formula:
(continued next page)
259 Repo r t t o t h e Cong r e s s : Med i ca r e and t h e Hea l t h Ca r e De l i v e r y S y s t em | J u ne 2019
Illustration of the Medicare Advantage value incentive program’s use of peer grouping to convert quality performance to rewards or penalties in a local market area (cont.)
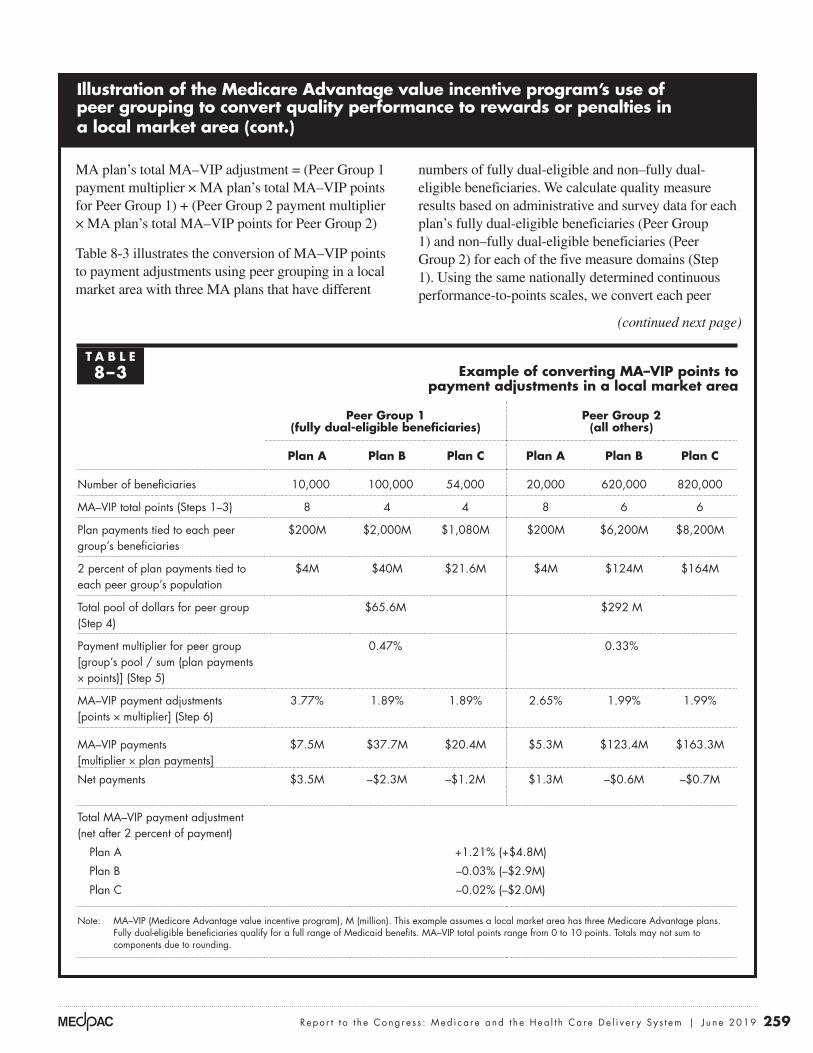
MA plan’s total MA–VIP adjustment = (Peer Group 1 payment multiplier × MA plan’s total MA–VIP points for Peer Group 1) + (Peer Group 2 payment multiplier × MA plan’s total MA–VIP points for Peer Group 2)
Table 8-3 illustrates the conversion of MA–VIP points to payment adjustments using peer grouping in a local market area with three MA plans that have different
numbers of fully dual-eligible and non–fully dual-eligible beneficiaries. We calculate quality measure results based on administrative and survey data for each plan’s fully dual-eligible beneficiaries (Peer Group 1) and non–fully dual-eligible beneficiaries (Peer Group 2) for each of the five measure domains (Step 1). Using the same nationally determined continuous performance-to-points scales, we convert each peer
(continued next page)
T A B L E8–3 Example of converting MA–VIP points to
payment adjustments in a local market area
Peer Group 1 (fully dual-eligible beneficiaries)
Peer Group 2 (all others)
Plan A Plan B Plan C Plan A Plan B Plan C
Number of beneficiaries 10,000 100,000 54,000 20,000 620,000 820,000
MA–VIP total points (Steps 1–3) 8 4 4 8 6 6
Plan payments tied to each peer group’s beneficiaries
$200M $2,000M $1,080M $200M $6,200M $8,200M
2 percent of plan payments tied to each peer group’s population
$4M $40M $21.6M $4M $124M $164M
Total pool of dollars for peer group (Step 4)
$65.6M $292 M
Payment multiplier for peer group [group’s pool / sum (plan payments × points)] (Step 5)
0.47% 0.33%
MA–VIP payment adjustments [points × multiplier] (Step 6)
3.77% 1.89% 1.89% 2.65% 1.99% 1.99%
MA–VIP payments [multiplier × plan payments]
$7.5M $37.7M $20.4M $5.3M $123.4M $163.3M
Net payments $3.5M –$2.3M –$1.2M $1.3M –$0.6M –$0.7M
Total MA–VIP payment adjustment (net after 2 percent of payment)
Plan A +1.21% (+$4.8M)
Plan B –0.03% (–$2.9M)
Plan C –0.02% (–$2.0M)
Note: MA–VIP (Medicare Advantage value incentive program), M (million). This example assumes a local market area has three Medicare Advantage plans. Fully dual-eligible beneficiaries qualify for a full range of Medicaid benefits. MA–VIP total points range from 0 to 10 points. Totals may not sum to components due to rounding.
260 Rede s i gn i ng t h e Med i ca r e Advan t age qua l i t y bonu s p r og ram
dollars is relatively small during an initial phase can lessen the financial impact of any unintended or unanticipated effects that might disadvantage some plans in a new system. Such a system would create a level playing field with the fee-for-service quality incentive programs. The redesigned system would also be a means of imposing financial pressure on health plans to increase their efficiency (see text box on financial pressure, pp. 262–263). The Congressional Budget Office, which included the elimination of the MA–QBP as a budget option in a December 2018 report, projected that eliminating benchmark increases on the basis of quality bonuses would reduce mandatory spending by $94 billion between 2021 and 2028 (Congressional Budget Office 2018); as we have noted, it also would reduce Part B premiums for all beneficiaries and states.
Financing: Applying budget neutrality to MA’s quality payment program
Nearly all of Medicare’s FFS quality payment programs either are budget neutral (financed by reducing payments per unit of service) or produce program savings because they involve penalties. In contrast, the MA–QBP is financed with added program dollars and no financial penalties are applied.
Similar to the HVIP, we propose that the MA–VIP be a budget-neutral system with a small share of benefit payments used to create a pool of dollars that is redistributed among plans based on their performance on a small set of quality measures. Instituting a system in which the share of payments determining the pool of
Illustration of the Medicare Advantage value incentive program’s use of peer grouping to convert quality performance to rewards or penalties in a local market area (cont.)
group’s quality performance to points for each domain (Step 2). We average each plan’s performance by peer group to determine MA–VIP total points for each plan’s peer groups (Step 3). (Steps 1 through 3 are the same as the steps for the hospital VIP (HVIP) scoring methodology (see Chapter 15 in the Commission’s March 2019 report).) The table shows that MA Plan A earns the highest performance across both peer groups (8 points). MA Plans B and C both earn lower points for their fully dual-eligible population (4 points) compared with their non–fully dual eligible population (6 points).
We create a pool of dollars based on 2 percent of each of the MA plan’s payments tied to each of the peer groups (Step 4). Since MA Plan C has the largest number of beneficiaries, its contribution to the pool of dollars is largest. The pool to be redistributed for Peer Group 2 (non–fully dual-eligible beneficiaries) is larger than Peer Group 1’s pool because there are more beneficiaries and payments in Peer Group 2. For each Peer Group, we calculate a payment multiplier or
percentage adjustment to payment per MA–VIP point (Step 5). The payment multiplier for each peer group is the group’s pool of dollars from Step 4 divided by the sum of each plan’s total payments times their MA–VIP total points. Because Peer Group 1 has a larger point multiplier than Peer Group 2, the plan with higher performance for their duals population can earn a higher reward.
We calculate payment adjustments (Step 6) based on each plan peer group’s MA–VIP points and payment multiplier. In total, MA Plan A has the highest performance for both peer groups and so earns a reward of 1.21 percent, net of their 2 percent of payment that went into the pool. On net, MA Plan A earns a reward of $3.5 million for Peer Group 1 and a reward of $1.3 million for Peer Group 2, for a total reward of $4.8 million. MA Plans B and C both receive small penalties because they receive fewer points for both their dual and nondual populations. The entire pool of dollars is distributed to the MA plans. ■

261 Repo r t t o t h e Cong r e s s : Med i ca r e and t h e Hea l t h Ca r e De l i v e r y S y s t em | J u ne 2019
neutral or penalty-based approaches used in most FFS quality incentive programs. In FFS, the quality incentive programs can act as a source of financial pressure on plans to improve efficiency while maintaining good quality (because of the risk of reduced payments). By contrast, the MA–QBP, which is financed through added program dollars without penalties, has the opposite effect, potentially relieving financial pressure that plans might otherwise face. For example, as shown in Figure 8-3, plans that lost bonus dollars increased their efficiency (lowered their bids), while plans newly receiving bonus dollars substantially increased their bids.
Would a budget-neutral MA–VIP reduce MA plans’ offerings or extra benefits?Plans are required to provide the Medicare Part A and Part B benefit package. When a plan’s bid for the Medicare package (its statement of the revenue the plan needs to cover Medicare benefits) is less than the MA benchmark (the maximum Medicare payment to the plan, based on
Leveling the playing field between MA and FFSThe Commission supports the concept of a level playing field between MA and FFS. Each year the Commission’s March report contains such statements as the following:
Because private plans and traditional FFS Medicare have structural aspects that appeal to different segments of the Medicare population, we favor providing a financially neutral choice between private MA plans and traditional FFS Medicare. Medicare’s payment systems, as well as monitoring and enforcement efforts, should not unduly favor one component of the program over the other (Medicare Payment Advisory Commission 2019). (Emphasis added.)
We have noted that there is not a level playing field between MA and FFS in that the financing mechanism for the MA–QBP is not consistent with the budget-
Additional quality bonus payments resulted in higher bids, while plans losing bonus status reduced their bids for the Medicare benefit package between 2018 and 2019
Note: Special needs plans are excluded, as are plans with changes in segments (subplan classifications) that materially differ between the two years. All bid data pertain to the Medicare Part A and Part B benefit package. The “bonus-to-nonbonus” category includes projected enrollment of about 275,000 enrollees in plans for which we could compare year-over-year bids; the “nonbonus-to-bonus” category includes projected enrollment of about 850,000.
Source: MedPAC analysis of 2019 Medicare Advantage bid data.
Cumulative change....FIGURE1-X
Note: Note and Source are in InDesign.
Source:
Per
cent
change
-4
-2
0
2
4
6
8
10
12
Plans moving from nonbonus status in 2018 to
bonus status in 2019
Plans moving from bonus status in 2018 to nonbonus status in 2019
Plans in bonus status in both 2018 and 2019
Plans in nonbonus status in both 2018 and 2019
Standardized bid change Standardized benchmark change
4%
6% 6%
4%
10%
–2%
1%
11%
F IGURE8–3
262 Rede s i gn i ng t h e Med i ca r e Advan t age qua l i t y bonu s p r og ram
payments exclusively to provide extra benefits to MA enrollees. However, there is no such requirement. Because Medicare beneficiaries are more likely to choose a plan based on its premium levels and other costs (and factors such as the provider network and plan reputation)—rather than the CMS star rating—plans have an interest in offering extra benefits to attract enrollment. If benchmarks rise, either because a plan is newly in bonus status or for other reasons, plans can choose to enrich their benefit packages—or allot a greater share of the Medicare revenue to the Medicare benefit package (paying providers more, or allotting more to profit or administrative costs). If benchmarks fall, plans can choose to reduce their costs or profit level if they feel that the competition in a particular market requires that they maintain a certain level of extra benefits (or they see a need to improve the benefit
a share of local FFS spending), the plan is required to provide extra benefits—reduced cost sharing for Medicare services or extra services such as dental care.19 Higher benchmarks can give plans the opportunity to offer more generous extra benefits. Under the QBP, there is no “bonus payment” per se, but, rather, plan bids are compared with higher benchmark levels to determine where the bid is in relation to the benchmark and whether a plan will be providing extra benefits because its bid is below the benchmark (which is either a bonus-supplemented benchmark or a nonbonus benchmark). Having a bonus program that raises benchmarks for higher quality plans is a way of encouraging Medicare beneficiaries to enroll in higher rated plans—if the plans use those bonus dollars to provide extra benefits. With regard to the uses of MA bonus payments, there is a misconception among some stakeholders that plans are required to use MA bonus
Imposing financial pressure in Medicare Advantage
In proposing a redesigned system that would be budget neutral, we should consider the possible impacts of this approach on the Medicare
Advantage (MA) program.
For fee-for-service (FFS) Medicare, the Commission supports the concept of imposing financial pressure on providers through yearly update recommendations that provide adequate payment to providers while maintaining good access to care for beneficiaries. There is not a similar year-by-year evaluation of the adequacy of payment for MA plans. Given that MA expenditures represent about one-third of all Medicare program expenditures, it is appropriate to contemplate (1) whether the same expectations of improved efficiency through financial pressure should be a factor in the MA program and (2) whether the quality bonus program (QBP) in its current form—which is inconsistent with the usual incentive structures of FFS quality programs—is having an opposite effect and an unintended negative effect in some cases. That is, bonus payments reduce financial pressure on MA plans, and, in a system that is not a level playing field for MA plans, the system potentially imposes financial
pressure on the wrong entities—plans not in bonus status because they are serving high-needs populations and have no opportunities to raise their star ratings through the consolidation strategy.
While there is not an annual evaluation of payment adequacy in MA that might reduce MA rates, there are other sources of financial pressure in MA. The statutory payment structure is a source of financial pressure. Some county benchmarks are set at 95 percent of FFS, and, because all benchmarks are tied to FFS rates, any reductions in FFS expenditures translate to benchmark reductions reflecting improved efficiency in FFS. Another source of financial pressure is competition among plans as well as competition with FFS based on cost (the cost of FFS plus a Medigap premium vs. the cost of an MA plan in a given area).
Statutory provisions affecting payment
When the Patient Protection and Affordable Care Act of 2010 (PPACA) was enacted and reduced MA payments in a number of counties, some stakeholders warned that MA enrollment and plan participation in the program would decline. That prediction did not
(continued next page)

263 Repo r t t o t h e Cong r e s s : Med i ca r e and t h e Hea l t h Ca r e De l i v e r y S y s t em | J u ne 2019
2019 (nonbonus in each year or bonus status each year), the cost of providing the Medicare benefit—including administrative costs and profit—rose by a standardized 4 percent. For such plans, benchmarks increased 6 percent (for a population of average risk). For plans that had an increase in their Medicare payments because they moved from nonbonus status to bonus status, the reported cost of providing the Medicare benefit rose by 10 percent—over twice the increase for the other categories of plans. The rise in medical inflation for these plans (10 percent) nearly matched the rise in quality-adjusted benchmark levels (11 percent). In contrast, plans moving from bonus status to nonbonus status reduced their cost of providing the Medicare benefit in the face of only a small increase in the benchmark.
package). Our analysis of the bids for 2019 shows that most of the extra dollars from bonus payments were not used to provide extra benefits to MA enrollees, and only those plans that saw a decline in their benchmarks due to the loss of bonus status reduced their costs of providing the basic Medicare benefit package (Figure 8-3, p. 261).
Figure 8-3 shows the change in bids and benchmarks between 2018 and 2019 based on plans’ bonus status or change in bonus status. The bids and benchmarks are standardized amounts, representing amounts for a population of average risk. The “standardized bid change” amounts show the level of plans’ medical inflation for the Medicare Part A and Part B benefit package (the cost of the benefit, administration, and profit). For plans that maintained the same bonus status between 2018 and
Imposing financial pressure in Medicare Advantage (cont.)
come about. Instead, we have seen that plans are able to operate successfully within the financial constraints PPACA imposed; that enrollment in MA has increased dramatically (doubling between 2010 and 2019, from 11 million to 23 million enrollees); and that extra benefits are at historically high levels.
The PPACA payment changes have now been fully implemented after a phase-in period of up to six years in some counties.20 The Commission’s most recent analysis of bidding data indicates that plans are becoming more efficient: Bids for the Medicare Part A and Part B benefit package now average 89 percent of FFS expenditures, and average rebates for nonemployer, non–special needs plans are at $107 per member per month, compared with $85 in 2013 (Medicare Payment Advisory Commission 2019). In some counties, rebates per beneficiary exceed $300 per month. Notably, the most recent data show that even in the counties where it is thought that plans are least likely to be able to have bids below FFS—because the areas are low-FFS-expenditure areas—the median bid in such areas is now below FFS (at 0.99 percent of FFS in the 115 percent of FFS spending quartile).
The analysis of bids in the March 2019 report found that, overall, “Ninety-seven percent of all beneficiaries live in a county served by at least one plan that bid below its service area’s average FFS spending for 2019. However, that does not mean that plans could bid lower than FFS in each county of their service areas [because a bid can be a combined bid for a multicounty service area]” (Medicare Payment Advisory Commission 2019). (This discussion, though, raises the question of whether a comparison with FFS is an appropriate measure of the efficiency of MA. Given the evidence that bids have steadily declined in each of the quartile areas, it appears that plans have been able to harness their capacity for innovation and efficiency to the benefit of their enrollees, who have generous extra benefits at record levels. However, the Medicare program as a whole has not fully benefited from this increased efficiency because benchmarks continue to be tied to FFS expenditure levels and there is no direct payment policy, such as an MA payment update mechanism, that evaluates payment levels in relation to what constitutes an efficient plan (analogous to the Commission’s examination of efficient providers in the FFS sector).) ■

264 Rede s i gn i ng t h e Med i ca r e Advan t age qua l i t y bonu s p r og ram
a risk-adjusted benchmark increase of $46, of which $32 (or 70 percent) was allotted to the rebate computation, producing a monthly beneficiary rebate amount of $21. These plans’ bids increased very little (by $14); they reduced their margins by an average of $10 per member per month; they reduced their administrative costs; and their Medicare Part A and Part B medical expenses increased less than they did for other plans (by $30, nearly all of which is attributable to the increase in risk scores for these plans). For the two other plan categories, a third ($24 of $72) or less ($26 of $108) of the benchmark increase was applied toward the rebate computation. In the nonbonus-to-bonus category, a substantial share of the increased benchmarks (30 percent) was used to increase plan margins, and payments for Medicare-covered health care services increased. Of the three components of the bid for the Medicare Part A and Part B benefit—medical costs, administrative costs, and margin (profit)—the administrative cost component decreased for all categories shown in the table. (Because of the increase in margins, it may have been necessary to reduce administrative costs to maintain a medical loss ratio—the percentage going toward medical costs—of 85 percent or less, as required of MA plans.)
Table 8-4 breaks down the components of the payment changes for the plan categories shown in Figure 8-3 (p. 261). The table compares (1) actual bids (not standardized for risk—i.e., representing the actual costs plans expect to incur, based on the expected risk of the plan’s enrollees) against (2) benchmarks that have been risk adjusted using the plan’s projection of the risk of its enrollees. Making the comparison in this manner establishes the value of rebates that must be offered when a plan bids below the benchmark. Risk-adjusted amounts are compared because Medicare’s payments to a plan are risk adjusted (i.e., the plan’s risk-adjusted payment is more or less than the Medicare base payment, which is for a person of average risk, unless the plan expects to enroll a population that is of exactly average risk). The difference between the expected actual payment from Medicare and the expected actual cost of providing the benefit is the basis for determining the rebate amount. Table 8-4 shows that, in the case of plans leaving bonus status (bonus to nonbonus), their benchmarks increased (reflecting a base benchmark increase of 1 percent (shown in Figure 8-3, p. 261) and an increase in the projected risk scores for these plans (risk score data not shown in table)). Such plans had
T A B L E8–4 In 2019, plans leaving bonus status had a smaller benchmark increase than other
plans but applied a higher dollar amount of their benchmark increase to extra benefits
Amount per beneficiary per month
Bonus status unchanged from
prior year
Plans moving from
bonus to nonbonus
status
Plans moving from
nonbonus to bonus
status
Risk-adjusted benchmark increase $72 $46 $108Risk-adjusted bid increase $48 $14 $83Marginal addition to rebate computation (benchmark minus the bid) $24 $32 $26
Value of extra benefits to beneficiaries (50 percent to 70 percent of rebate, based on stars) $16 $21 $17
Components of the risk-adjusted bid increaseDollar change in net medical expenses 53 $30 $59Dollar change in administrative costs –$10 –$5 –$10Dollar change in Medicare margin $4 –$10 $33
Note: Special needs plans are excluded. Table excludes plans with changes in segments (subplan classifications) that materially differ between the two years. All bid data pertain to the Medicare Part A and Part B benefit package. Components may not sum to totals due to rounding.
Source: MedPAC analysis of 2019 Medicare Advantage bid data.
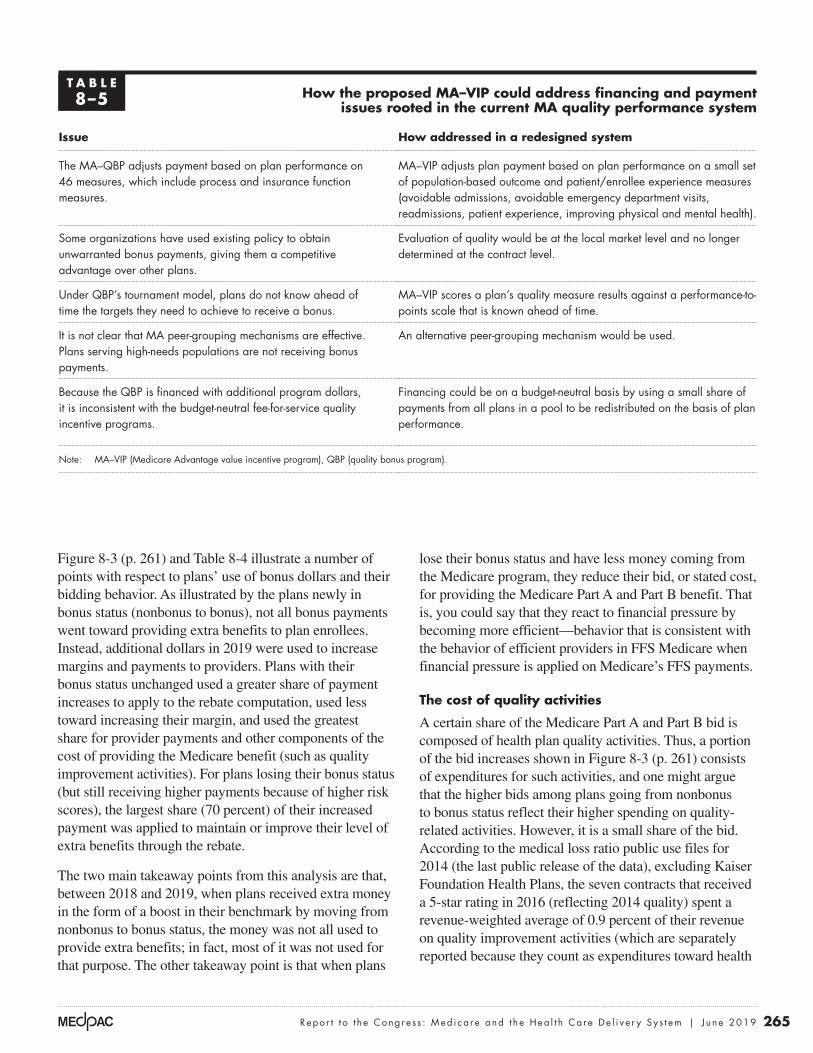
265 Repo r t t o t h e Cong r e s s : Med i ca r e and t h e Hea l t h Ca r e De l i v e r y S y s t em | J u ne 2019
lose their bonus status and have less money coming from the Medicare program, they reduce their bid, or stated cost, for providing the Medicare Part A and Part B benefit. That is, you could say that they react to financial pressure by becoming more efficient—behavior that is consistent with the behavior of efficient providers in FFS Medicare when financial pressure is applied on Medicare’s FFS payments.
The cost of quality activities
A certain share of the Medicare Part A and Part B bid is composed of health plan quality activities. Thus, a portion of the bid increases shown in Figure 8-3 (p. 261) consists of expenditures for such activities, and one might argue that the higher bids among plans going from nonbonus to bonus status reflect their higher spending on quality-related activities. However, it is a small share of the bid. According to the medical loss ratio public use files for 2014 (the last public release of the data), excluding Kaiser Foundation Health Plans, the seven contracts that received a 5-star rating in 2016 (reflecting 2014 quality) spent a revenue-weighted average of 0.9 percent of their revenue on quality improvement activities (which are separately reported because they count as expenditures toward health
Figure 8-3 (p. 261) and Table 8-4 illustrate a number of points with respect to plans’ use of bonus dollars and their bidding behavior. As illustrated by the plans newly in bonus status (nonbonus to bonus), not all bonus payments went toward providing extra benefits to plan enrollees. Instead, additional dollars in 2019 were used to increase margins and payments to providers. Plans with their bonus status unchanged used a greater share of payment increases to apply to the rebate computation, used less toward increasing their margin, and used the greatest share for provider payments and other components of the cost of providing the Medicare benefit (such as quality improvement activities). For plans losing their bonus status (but still receiving higher payments because of higher risk scores), the largest share (70 percent) of their increased payment was applied to maintain or improve their level of extra benefits through the rebate.
The two main takeaway points from this analysis are that, between 2018 and 2019, when plans received extra money in the form of a boost in their benchmark by moving from nonbonus to bonus status, the money was not all used to provide extra benefits; in fact, most of it was not used for that purpose. The other takeaway point is that when plans
T A B L E8–5 How the proposed MA–VIP could address financing and payment
issues rooted in the current MA quality performance system
Issue How addressed in a redesigned system
The MA–QBP adjusts payment based on plan performance on 46 measures, which include process and insurance function measures.
MA–VIP adjusts plan payment based on plan performance on a small set of population-based outcome and patient/enrollee experience measures (avoidable admissions, avoidable emergency department visits, readmissions, patient experience, improving physical and mental health).
Some organizations have used existing policy to obtain unwarranted bonus payments, giving them a competitive advantage over other plans.
Evaluation of quality would be at the local market level and no longer determined at the contract level.
Under QBP’s tournament model, plans do not know ahead of time the targets they need to achieve to receive a bonus.
MA–VIP scores a plan’s quality measure results against a performance-to-points scale that is known ahead of time.
It is not clear that MA peer-grouping mechanisms are effective. Plans serving high-needs populations are not receiving bonus payments.
An alternative peer-grouping mechanism would be used.
Because the QBP is financed with additional program dollars, it is inconsistent with the budget-neutral fee-for-service quality incentive programs.
Financing could be on a budget-neutral basis by using a small share of payments from all plans in a pool to be redistributed on the basis of plan performance.
Note: MA–VIP (Medicare Advantage value incentive program), QBP (quality bonus program).

266 Rede s i gn i ng t h e Med i ca r e Advan t age qua l i t y bonu s p r og ram
Summary and next steps
The current QBP’s measurement approach, scoring, and peer-grouping mechanism do not align with the Commission’s principles for quality measurement. Instead, our principles are embedded in the proposed MA–VIP. Table 8-5 (p. 265) shows how our redesigned system would address design and financing issues of concern. In the future, the Commission plans to model the MA–VIP design using currently available data and compare plan performance on the current QBP with the MA–VIP. ■
care in determining whether at least 85 percent of revenue goes to health care). Expenditure levels ranged from under 0.1 percent to 1.5 percent among the seven contracts. The weighted share of revenue used for quality improvement activities across all plans other than 5-star plans was 1.6 percent. These figures are well below the 5 percent increase in benchmarks available through the QBP. These figures are also the “gross cost” of quality initiatives. The “net cost” of quality initiatives may be a gain rather than a cost to a plan (resulting in a lower bid), to the extent that quality activities have a return on investment that reduces costs and produces savings (for example, reducing avoidable hospital admissions and readmissions would reduce plan costs).
267 Repo r t t o t h e Cong r e s s : Med i ca r e and t h e Hea l t h Ca r e De l i v e r y S y s t em | J u ne 2019
1 Some counties have a statutory cap that limits the benchmark in relation to historical rates and can result in the reduction or elimination of the effect of a bonus-level rating on the county’s benchmark. The Commission has recommended removing the caps as well as eliminating the double bonus (10 percent) payments (Medicare Payment Advisory Commission 2016).
2 Note that in this chapter we often use the terms plan and contract interchangeably. An MA contract, in CMS’s terminology, can have multiple “plans” or benefit packages, including a mix of special needs plans, employer group plans, and plans for non-employer-sponsored beneficiaries. Each plan under a contract has a separate bid. Although the statutory language states that bonus-based benchmark increases would be at the plan or contract level, star ratings are assigned at the CMS contract level for whatever mix of benefit packages or plan variants a sponsor wishes to offer. The contract-level star ratings apply to all of the plans under the contract.
3 Stand-alone Part D prescription drug plans (PDPs) also have star ratings, but do not receive bonuses based on their performance. For MA prescription drug plans (MA–PDs), the Part D quality measures do factor into the star rating for bonus purposes. For the Part D star measures, the thresholds for the five levels of star ratings for MA–PDs are computed separately from the thresholds for stand-alone PDPs.
4 In 2017, 56.2 million beneficiaries had at least one month of Part B enrollment (based on our analysis of the CMS Medicare denominator file). Twenty-five percent of Part B expenditures are financed by beneficiary premiums. In 2017, Part B constituted a little over 50 percent of overall Part A and Part B expenditures (Boards of Trustees 2018). The share of $6 billion in Medicare Part A and Part B expenditures that would have to be financed by beneficiary premiums would thus be about $750 million, or a little over $1 per beneficiary per month. Medicaid expenditures for the Part B premium are a combination of federal and state funds.
5 CAHPS® is a registered trademark of the Agency for Healthcare Research and Quality, a U.S. government agency.
6 There is also a misalignment between the star ratings included in the Medicare Plan Finder during the annual election period, announced in October of each year, and the star ratings used to determine bonus payments for the enrollment year. The latter are star ratings that plans use in their bids, submitted in June for the coming payment/enrollment year. Because the bidding precedes the announcement of new star ratings, plans must use two-year-old ratings that determine whether their benchmarks include bonus payments. Beneficiaries are
essentially faced with two parallel signals of plan quality when deciding whether to enroll in a given plan. One signal is the most recent star rating of the Medicare Plan Finder, and the other signal—which has a strong influence on beneficiary choice—is the generosity of extra benefits financed by bonus dollars. The MA–VIP system would align the signals.
7 The March 2010 report suggests the use of geographic areas consisting of metropolitan statistical areas (MSAs), separated by state for multistate MSAs, and health service areas identified by the National Center for Health Statistics as groupings of nonmetropolitan counties based on the patterns of service use of Medicare beneficiaries.
8 HEDIS® is a registered trademark of the National Committee for Quality Assurance.
9 Under CMS’s classification, the low-income category consists of beneficiaries receiving the Part D low-income subsidy (LIS), which is composed of two groups, Medicare–Medicaid dually eligible beneficiaries and other beneficiaries receiving the LIS. The disabled category includes Medicare beneficiaries entitled to Medicare on the basis of disability who are under 65, as well as beneficiaries who are 65 or older but were originally entitled to Medicare (before age 65) on the basis of disability.
10 These low star-rated contracts with high shares of low-income enrollees also tend to have lower enrollment than high star-rated contracts. For example, the 4-star contracts had an average total enrollment of 88,000 compared with an average total enrollment of 29,000 for the 3.5-star contracts, 22,500 for 3-star contracts, and 3,400 for the 2.5-star contracts. Contracts with low enrollment may have fewer financial resources to invest in activities that can improve star ratings, such as strategies to improve documentation and reporting of the measures included in the star ratings.
11 We would envision that new plans would not participate in the program until they are able to report quality measures. In a plan’s first year of operation, for example, the plan would not be subject to the MA–VIP because CMS would be unable to determine whether the plan’s performance merited a bonus or deserved a penalty.
12 The proposed MA–VIP measure set does not include two of the measures included in the Commission’s past illustrative measure sets: mortality and Medicare spending per beneficiary (or a total cost of care measure). The mortality measure used in the hospital value incentive program holds hospitals accountable for coordination of care during and 30 days after a stay; however, an annual mortality measure
Endnotes
268 Rede s i gn i ng t h e Med i ca r e Advan t age qua l i t y bonu s p r og ram
16 In the Commission’s past work, we used the term potentially preventable admissions, but in this chapter we refer to the measure concept as avoidable hospitalizations. The literature and industry also refer to the measure as ambulatory care–sensitive condition hospitalizations, and hospitalizations for potentially preventable complications.
17 The regression model used in the HEDIS measure to calculate the expected results is based on the risk profiles of a sample of MA beneficiaries. Since this small MA population differs from FFS beneficiaries, we needed to develop new risk weights to calculate expected results. The new risk weights are based on the entire FFS population, which we believe is representative too of the entire Medicare population (MA, ACO, and FFS). The common risk adjustment also furthers the Commission’s goal of comparing quality across payment models.
18 The HEDIS Hospitalization for Potentially Preventable Complications is an MA display measure but is not a star measure in the QBP.
19 When plans provide extra benefits financed either by rebate dollars or member premiums, the cost to the plan of providing the benefit includes an allowance for administration and profit (gain or loss margin). This “load” factor applies to benefits other than the Part B or Part D premium reductions. If, for example, a plan’s bid is $100 below the benchmark and the plan is a 5-star plan, the plan must provide $70 worth of extra benefits. If the plan decides that it will use the entire amount to reduce cost sharing for Medicare Part A and Part B services and the plan’s administration/profit level is 15 percent, the average amount of cost sharing reduction for beneficiaries will be 85 percent of $70, or $59.50.
20 CMS initially limited the full effect of the PPACA payment reductions by providing additional payments to plans through an MA-wide demonstration project that used the QBP to provide extra payments to all plans at or above 3 stars from 2012 through 2014 (see the Commission’s March 2013 report to the Congress).
for MA plans could encourage potential patient selection. Spending measures may not be necessary for MA because FFS resource use is a component of the benchmarks in determining MA payments.
13 Quality measure developers, such as the National Committee for Quality Assurance, are working to translate existing HEDIS health plans measures into electronic formats that can automatically extract data needed for quality measurement from electronic health records, registries, health information exchanges, and other electronic health information (National Committee for Quality Assurance 2019). Health plans will have the option to report HEDIS results, which include electronic data, beginning in June 2019. As health plans and measure developers continue to test and implement these approaches, Medicare can revise the measures scored in quality payment programs.
14 If FFS claims are to be the source of information on quality (until such time as electronic medical records from FFS and MA can provide the necessary information), the MA data that most closely parallel the FFS claims data are MA encounter data. However, at present, the two systems—FFS claims and MA encounter data—are not entirely comparable. In addition to the issue of encounter data completeness, well-established differences in the coding practices of the two programs would affect the comparison of risk-adjusted quality measures. The Commission’s analysis of encounter data has identified a way in which the documentation of diagnoses can be made more consistent between FFS and MA, which is to use only MA diagnoses included on encounter records and not allow supplemental diagnoses that come from chart reviews.
15 As with the HVIP, if there is a “small-numbers” issue, the MA–VIP could use additional years of data to increase the number of observations, which reduces random variation and allows Medicare to measure the quality of care for low-volume plans. However, we are limited to modeling one year of results because of the lower levels of completeness in earlier years of encounter data.
269 Repo r t t o t h e Cong r e s s : Med i ca r e and t h e Hea l t h Ca r e De l i v e r y S y s t em | J u ne 2019
Boards of Trustees, Federal Hospital Insurance and Federal Supplementary Medical Insurance Trust Funds. 2018. 2018 annual report of the Boards of Trustees of the Federal Hospital Insurance and Federal Supplementary Insurance Trust Funds. Washington, DC: Boards of Trustees.
Centers for Medicare & Medicaid Services, Department of Health and Human Services. 2014. Announcement of calendar year (CY) 2015 Medicare Advantage capitation rates and Medicare Advantage and Part D payment policies and final call letter. http://www.cms.gov/Medicare/Health-Plans/MedicareAdvtgSpecRateStats/Downloads/Announcement2015.pdf.
Centers for Medicare & Medicaid Services, Department of Health and Human Services. 2019. Announcement of calendar year (CY) 2020 Medicare Advantage capitation rates and Medicare Advantage and Part D payment policies and final call letter. April 1.
Congressional Budget Office. 2018. Options for reducing the deficit: 2019 to 2028. Washington, DC: CBO.
Dowd, B., M. Karmarker, T. Swenson, et al. 2014. Emergency department utilization as a measure of physician performance. American Journal of Medical Quality 29, no. 2 (March–April): 135–143.
Enard, K. R., and D. M. Ganelin. 2013. Reducing preventable emergency department utilization and costs by using community health workers as patient navigators. Journal of Healthcare Management 58, no. 6 (November–December): 412–427; discussion 428.
Medicare Payment Advisory Commission. 2019. Report to the Congress: Medicare payment policy. Washington, DC: MedPAC.
Medicare Payment Advisory Commission. 2018a. Report to the Congress: Medicare and the health care delivery system. Washington, DC: MedPAC.
Medicare Payment Advisory Commission. 2018b. Report to the Congress: Medicare payment policy. Washington, DC: MedPAC.
Medicare Payment Advisory Commission. 2017. Report to the Congress: Medicare payment policy. Washington, DC: MedPAC.
Medicare Payment Advisory Commission. 2016. Report to the Congress: Medicare payment policy. Washington, DC: MedPAC.
Medicare Payment Advisory Commission. 2015. Report to the Congress: Medicare and the health care delivery system. Washington, DC: MedPAC.
Medicare Payment Advisory Commission. 2012. Report to the Congress: Medicare payment policy. Washington, DC: MedPAC.
Medicare Payment Advisory Commission. 2010. Report to the Congress: Medicare payment policy. Washington, DC: MedPAC.
National Committee for Quality Assurance. 2019. The future of HEDIS. https://www.ncqa.org/hedis/the-future-of-hedis/.
Reid, R., S. Paddock, and C. Damberg. 2019. Does removing financial incentives lead to declines in measured performance? Insights from Medicare Advantage Star Ratings Program. Presentation at Academy Health Annual Research Meeting. June 2. https://academyhealth.confex.com/academyhealth/2019arm/meetingapp.cgi/Paper/33064.
Rose, A. J., E. Bayliss, L. Baseman, et al. 2019. Feasibility of distinguishing performance among provider groups using patient-reported outcome measures in older adults with multiple chronic conditions. Medical Care 57, no. 3 (March): 180–186.
U.S. House of Representatives. 1997. Balanced Budget Act of 1997. 105th Cong., 1st sess., H.R. 2015.
Wholey, D. R., J. B. Christianson, M. Finch, et al. 2003. Evaluating health plan quality 1: A conceptual model. American Journal of Managed Care 9 spec no. 2 (June): SP53–64.
References


