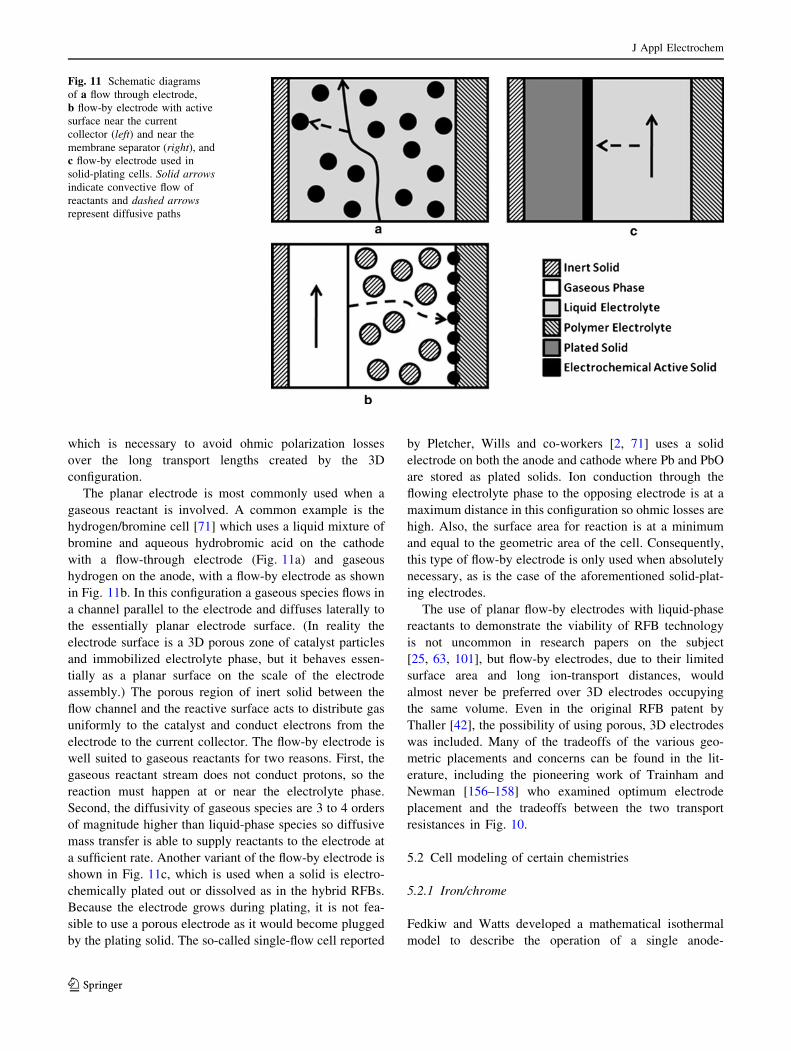
Page 1
ORIGINAL PAPER
Redox flow batteries: a review
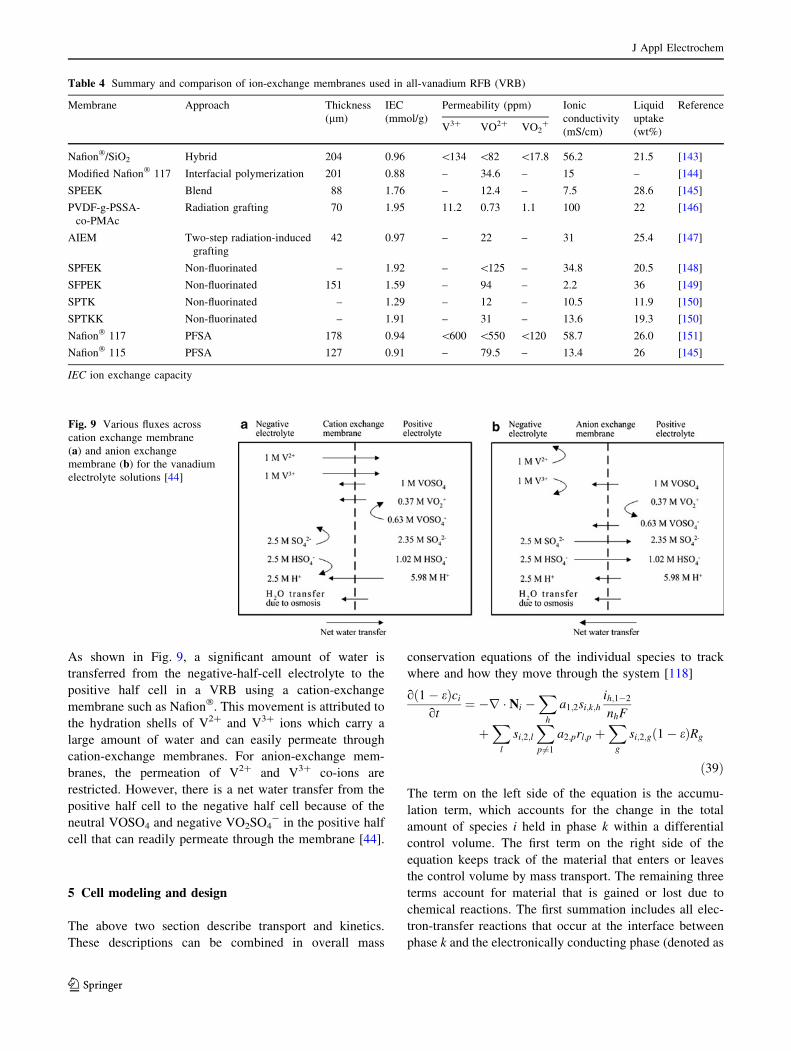
Adam Z. Weber • Matthew M. Mench •
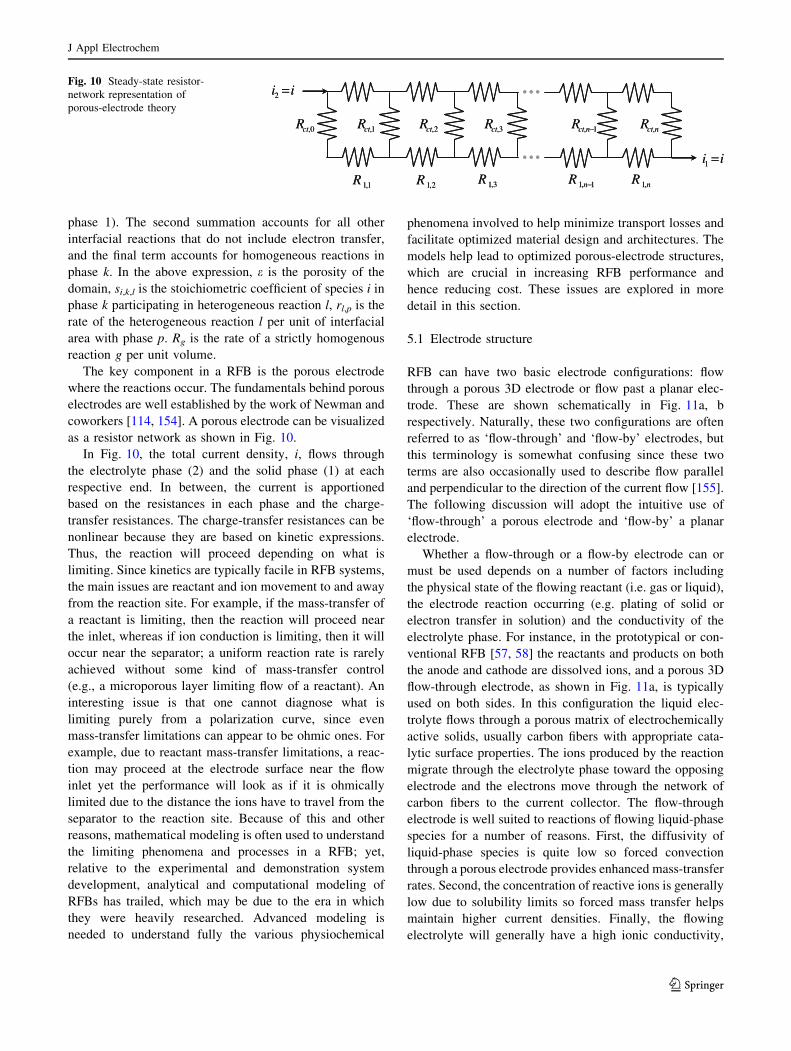
Jeremy P. Meyers • Philip N. Ross •
Jeffrey T. Gostick • Qinghua Liu
Received: 12 July 2011 / Accepted: 16 August 2011
� The Author(s) 2011. This article is published with open access at Springerlink.com
Abstract Redox flow batteries (RFBs) are enjoying a
renaissance due to their ability to store large amounts of
electrical energy relatively cheaply and efficiently. In this
review, we examine the components of RFBs with a
focus on understanding the underlying physical processes.
The various transport and kinetic phenomena are discussed
along with the most common redox couples.
Keywords Flow battery � Redox � Regenerative fuel cell �Flow cell � Vanadium
List of symbols
ak,p Interfacial surface area between phases k and p per
unit volume (cm-1)
ci Concentration of species (mol/cm3)
df Fiber diameter (cm)
Di Fickian diffusion coefficient of species i in a
mixture (cm2/s)
E0 Standard cell potential (V)
Eeq Equilibrium cell potential (V)
F Faraday’s constant, 96487 C/equiv
i Superficial current density (A/cm2)
i0 Exchange current density (A/cm2)
ih,k-p Transfer current density of reaction h per
interfacial area between phases k and p (A/cm2)
k Permeability (m2)
k0 Standard rate constant, varies
m Valence state
n Valence state or number of electrons transferred
in a reaction
Ni Superficial flux density of species i (mol/cm2 s)
p Pressure (Pa)
rl,k-p Rate of reaction l per unit of interfacial area
between phases k and p (mol/cm2 s)
R Ideal-gas constant, 8.3143 J/mol K
Rg,k Rate of homogenous reaction g in phase k (mol/
cm3 s)
Ri,j Resistance of resistor i, j in Fig. 10 where ct stands
for charge-transfer (X cm2)
si,k,l Stoichiometric coefficient of species i in phase
k participating in reaction l
t Time (s)
T Absolute temperature (K)
ui Mobility of species i (cm2 mol/J s)
v Superficial velocity (cm/s)
x Stoichiometric coefficient
y Stoichiometric coefficient
zi Valence or charge number of species i
Greek
a Transfer coefficient
ai Transport coefficient of species i (mol2/J cm s)
e Porosity
A. Z. Weber (&) � P. N. Ross
Environmental Energy Technologies Division, Lawrence
Berkeley National Laboratory, Berkeley, CA 94720, USA
e-mail: [email protected]
M. M. Mench � Q. Liu
Department of Mechanical, Aerospace and Biomedical
Engineering, University of Tennessee, Knoxville, TN, USA
M. M. Mench
Energy and Transportation Science Division, Oak Ridge
National Laboratory, Oak Ridge, TN 37831, USA
J. P. Meyers
Department of Mechanical Engineering,
The University of Texas, Austin, TX, USA
J. T. Gostick
Department of Chemical Engineering, McGill University,
Montreal, QC, Canada
123
J Appl Electrochem
DOI 10.1007/s10800-011-0348-2
Page 2
e0 Permittivity (F/cm)
n Electroosmotic coefficient
q Density (g/cm3)
qc Charge density (C/cm3)
r Conductivity of the electronically conducting phase
(S/cm)
g Overpotential (V)
j Conductivity of the ionically conducting phase
(S/cm)
l Viscosity (Pa s)
li (Electro)chemical potential of species i (J/mol)
Uk Potential in phase k (V)
wi Permeation coefficient of species i (mol/s cm bar)
Super/subscripts
* Reference state
0 Solvent
1 Electronically conducting phase
2 Ionically conducting phase
O Oxidant
R Reductant
1 Introduction
Renewable-energy sources, such as solar and wind, are
being deployed in larger numbers than ever before, but
these sources are intermittent and often unpredictable.
These characteristics limit the degree to which utilities can
rely upon them, and, as such, renewables currently comprise
a small percentage of the primary power sources on the US
electrical grid. Analysis suggests that an electric grid could
become destabilized if non-dispatchable renewable energy
exceeds 20% of the energy-generation capacity without
energy storage [1]. However, many utilities are mandating
renewable portfolios approaching this level of deployment,
thus there is a pressing need for storage technologies to
complement and enable renewable standards. Other than
capacitors, however, there is no way to store electrical
energy as such. Instead, if electricity is to be stored, it must
first be converted to some other form of energy. There are
some technologies that enable practical storage of energy at
their current levels of deployment, but only a very small
fraction of North American power plants employ such
technology [2]. To ensure that renewable energy succeeds
in delivering reliable power to US consumers, the nation
needs cost effective and reliable storage at the grid scale.
Conventional rechargeable batteries offer a simple and
efficient way to store electricity, but development to date
has largely focused on transportation systems and smaller
systems for portable power or intermittent backup power;
metrics relating to size and volume are far less critical for
grid storage than in portable or transportation applications.
It therefore stands to reason that optimizing battery per-
formance over a different set of variables might result in an
implementation that delivers superior performance for
reduced cost. Batteries for large-scale grid storage require
durability for large numbers of charge/discharge cycles as
well as calendar life, high round-trip efficiency, an ability
to respond rapidly to changes in load or input, and rea-
sonable capital costs [3]. Redox flow batteries (RFBs) or
redox flow cells (RFCs), shown schematically in Fig. 1,
promise to meet many of these requirements [4].
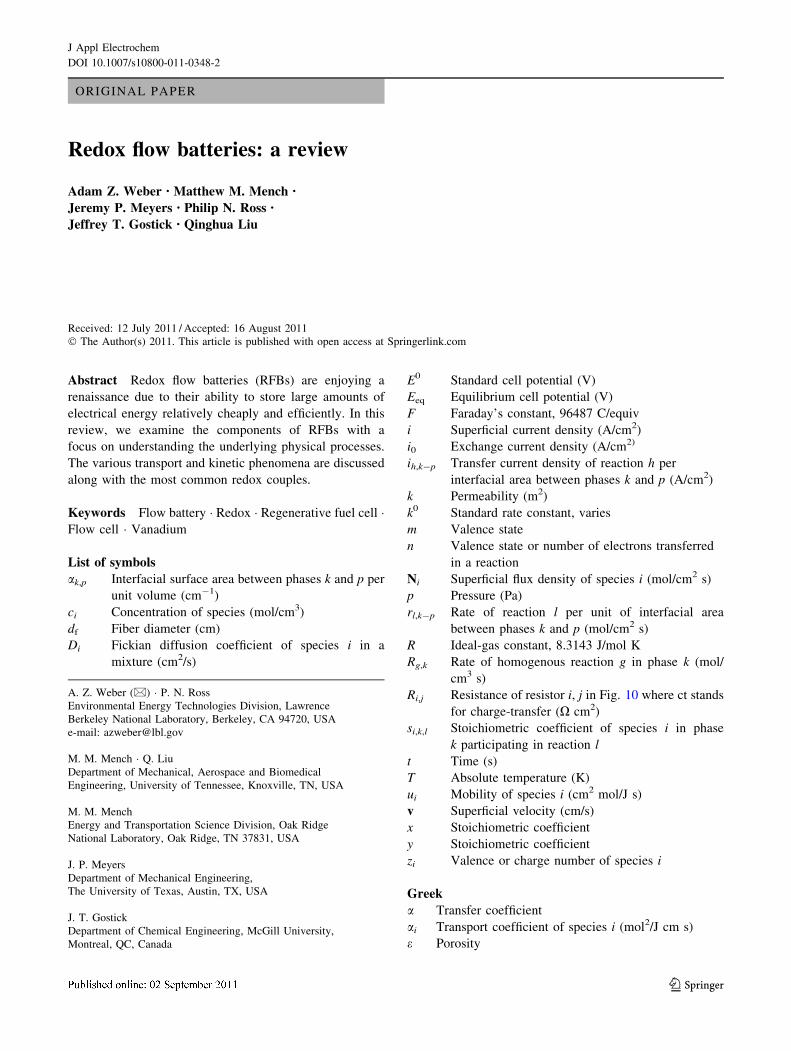
As shown in Fig. 1, a key component of RFBs is the
ability to separate power and energy. The power is con-
trolled by the stack while the energy is stored within the
separated reactants. Thus, one can optimize over a greater
range of variables and storage can be increased with
relatively ease and minimal cost compared to the stack,
which is typically the most expensive system component.
To examine the technologies that are under development
to meet the cost requirements of the marketplace and
enable wide-scale storage, we consider the existing port-
folio of RFB storage technologies and the possibilities of
each. To that end, we introduce the various technologies
and discuss in more depth the general attributes and con-
cerns facing RFBs. The overall purpose of this review is to
examine systemic issues for the field of RFBs, and not just
examine a specific chemistry or the various proposed
RFBs. Excellent reviews of these latter issues and energy
storage for the grid in general can be found in the literature
[5–8]. The structure of this paper is as follows.
After an introduction and short overview of the various
major RFBs, the kinetic and transport issues are examined
in turn. Next, some overall electrode/cell modeling and
designs are reviewed. Finally, some comments about future
research needs are made. It should be noted that this review
is focused on cell-level issues and RFB chemistries,
therefore issues of system integration and components are
not examined in depth, although they can be critically
important for system commercialization. Before discussing
the various RFB chemistries, it is worthwhile to examine
their current major applications.
1.1 Grid-storage needs
The present electric grid constitutes an enormous physical
infrastructure, with a near-instantaneous transmission of
value from primary power sources and generation assets to
end users and with almost no storage capability. Because
of this dearth of storage, the existing grid must conform to
fluctuations in customer demand, resulting in the con-
struction of power plants that may only operate for 100 h
a year or less and can account for up to 30 MWh in
capacity [9]. These generators are dispatched to respond to
small oscillations in demand over very short time scales of
J Appl Electrochem
123
Page 3
less than 1 h. They are also turned on and sped up to meet
increasing load during the peak time of the day, and, at the
other extreme of wastefulness, brought on by the lack of
storage. For example, wind energy is wasted because of the
inability to dispatch wind power at night when wind gen-
eration is at a maximum but customer demand is at a
minimum; thus, there is a significant value added by the
incorporation of storage [10]. Similarly, photovoltaics and
solar-energy implementation will also require arbitrage
since although the solar irradiation received terrestrially in
about 1 h is sufficient to meet worldwide energy require-
ments for a year, the sun does set daily. Storage is a vital
tool that would uncouple customer demand from the gen-
eration side of the grid, thereby allowing vital flexibility in
control and maintenance of the electric grid. To date,
however, energy storage comprises only about 2% of the
installed generation capacity in the U.S. Because of dif-
ferences in government policy and more favorable eco-
nomics, storage plays a larger role in Europe and Japan, at
10 and 15%, respectively [11].
The current worldwide electric generation capacity was
estimated to be about 20 trillion kilowatt hours in 2007 [12].
More than two-thirds of the current mix is from some form
of fossil fuel, with most of the balance coming from nuclear
and hydroelectric power generation; at present, only about
3% comes from renewable-energy technologies. Further-
more, developing economies and electrification of the
transportation sector both point to strong year-over-year
growth in terms of electrical demand. While coal is already
the primary source of power in the US electricity sector,
there are concerns that it will become a larger portion of
electricity production as increased global demand competes
for cleaner resources like natural gas. Coal is, of course, the
most carbon-intensive resource used in this sector; how-
ever, while debate continues about how to address
anthropogenic global warming gas emissions from a policy
standpoint, coal plants are less capable of handling transient
loads than the ‘‘peaker’’ plants that largely sit idle and
which are deployed only to handle the peak loads. Growing
demand implies not only an increase in the base load, which
might be handled by coal if government and the energy
sector choose not to prioritize carbon-emissions reductions,
but also to larger peak loads, which will either require more
intermittent generation assets or storage.
In addition to improvements in resiliency that can
enable increased renewable-energy generation, integration
of storage into the smart grid also promises to enable
greater system efficiency, even with existing generation
assets. The Electric Power Research Institute has com-
pleted a study that suggests that the widespread adoption of
smart grid technologies could yield a 4% reduction in
energy use by 2030 [13], roughly equivalent to eliminating
the emissions of 50 million cars. Beyond the emissions
impact, that savings translates to more than $20 billion
annually for utility customers nationwide. With a more
robust and efficient system, and more data about demand
patterns, it will be easier for utilities to manage the inte-
gration of intermittent renewable-energy sources. Energy
storage can also support requirements for reserve genera-
tion in place of fossil-fuel-based facilities, yielding zero
emissions and lowered operating costs.
It seems apparent that being able to harvest energy from
more diverse sources, and being able to deploy this energy
to the end user when it is demanded, should lower oper-
ating costs and promote the robustness and quality of
power on the grid. Why then, is the penetration of storage
onto the grid so small? The answer is primarily cost. There
are multiple costs associated with the installation and
operation of a RFB system: one must consider the opera-
tion and maintenance costs, as well as up-front capital costs
Fig. 1 A schematic diagram of
a redox flow battery with
electron transport in the circuit,
ion transport in the electrolyte
and across the membrane, active
species crossover, and mass
transport in the electrolyte
J Appl Electrochem
123
Page 4
and life-cycle costs. Because of the decoupling of energy
and power in RFB configurations, we can consider both
cost per unit of power generation/storage capability ($/kW)
and the cost per unit of energy-storage capacity ($/kWh).
We note that the cost per unit energy storage is not the
incremental cost of producing or storing that energy as
would be expected in a utility bill, but the cost per unit of
energy-storage capacity. In addition to costs, robust system
lifetimes of *10 years, high efficiency, and cyclic dura-
bility are necessary for grid-level storage.
Different applications have different acceptable costs,
and the total power and total duration of storage provided
will differ from application to application. As such, it is
difficult to target a single metric that can concisely address
the ultimate cost target for grid-based storage. Table 1
below, from a report prepared by the Nexight Group based
upon a workshop convened by Sandia, PNNL, and the
Minerals, Metals, and Materials Society (TMS) for the US
Department of Energy, suggests the following cost per-
formance targets for key utility applications, and identify
cost targets for flow batteries of $250/kWh in capital costs
in 2015, decreasing to $100/kWh by 2030 [14]. Current
estimates of costs for conventional batteries and flow bat-
teries are significantly higher than the required targets:
a 2008 estimate of RFB costs suggested nearly $2500/kW,
albeit without specification of duration or sizing [15].
Regardless of detail, however, significant cost reduction
must be achieved: technological improvements, material
development, and economies of scale must be achieved to
ensure success in the marketplace.
2 Redox-flow-battery overview
Redox flow batteries can be classified by active species or
solvent (aqueous and non-aqueous, respectively). Figure 1
shows a generic RFB system. In the discharge mode, an
anolyte solution flows through a porous electrode and
reacts to generate electrons, which flow through the
external circuit. The charge-carrying species are then
transported to a separator (typically an ion-exchange
membrane (IEM)), which serves to separate the anolyte and
catholyte solutions. The general reactions can be written as
Anþ þ xe� �!chargeAðn�xÞþ and Aðn�xÞþ �!discharge
Anþ þ xe�
n [ xð Þ ð1Þ
and
Table 1 Key performance targets for grid-storage applications, from Ref. [14]
Application Purpose Key performance targets
Area and frequency regulation
(short duration)
Reconciles momentary differences between
supply and demand within a given area
Service cost: $20/MW
Roundtrip efficiency: 85–90%
System lifetime: 10 years
Discharge duration: 15 min–2 h
Response time: milliseconds
Renewables grid integration
(short duration)
Offsets fluctuations of short-duration
variation of renewables generation output
Accommodates renewables generation at
times of high grid congestion
Roundtrip efficiency: 90%
Cycle life: 10 years
Capacity: 1–20 MW
Response time: 1–2 s
Transmission and distribution
upgrade deferral (long
duration)
Delays or avoids the need to upgrade
transmission and/or distribution
infrastructure
Reduces loading on existing equipment to
extend equipment life
Cost: $500/kWh
Discharge duration: 2–4 h
Capacity: 1–100 MW
Reliability: 99.9%
System life: 10 years
Load following (long duration) Changes power output in response to the
changing balance between energy supply
and demand
Operates at partial load (i.e., increased
output) without compromising performance
or increasing emissions
Capital cost: $1,500/kW or $500/kWh
Operations and maintenance cost: $500/kWh
Discharge duration: 2–6 h
Electric energy time shift (long
duration)
Stores inexpensive energy during low
demand periods and discharges the energy
during times of high demand (often referred
to as arbitrage)
Capital cost: $1,500/kW or $500/kWh
Operations and maintenance cost: $250–$500/kWh
Discharge duration: 2–6 h
Efficiency: 70–80%
Response time: 5–30 min
J Appl Electrochem
123
Page 5
Bmþ � ye� �!chargeBðmþyÞþ and BðmþyÞþ �!discharge
Bmþ � ye�
ð2Þ
for the anode (negative electrode) and cathode (positive
electrode), respectively.
The key transport mechanisms are shown in Fig. 1 for
this generic system. The dominant losses in these systems,
other than charge-transfer reaction kinetics, are related to
the charge and mass transport in the electrolyte and sepa-
rator, which are each discussed in turn in later sections of
this review. Additionally, a key factor in many of these
systems is crossover of species through the separator,
which is dependent on current and membrane permeability.
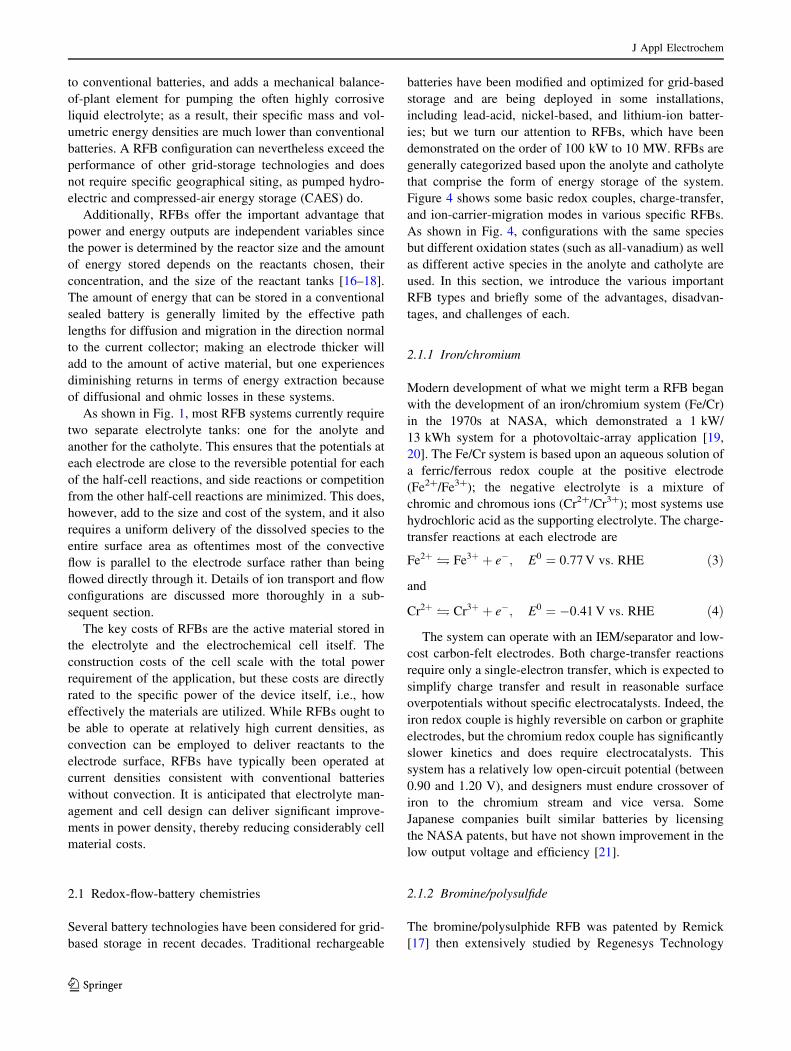
A sample RFB cell performance is shown in Fig. 2, where
the charge and discharge are at different rates or current
densities. One can see that similar to a fuel-cell polari-
zation curve, there can be ohmic, mass-transport, and/or
kinetic losses. The first part of the curves is dominated by
kinetic overpotential, especially on charge. The middle part
of the curves is dominated by ohmic or ionic-conduction
losses, and the last part of the curves is typically a signature
of reactant mass-transport limitations.
The reactor in Fig. 1 consists of a stack of individual
cells, where each cell contains the sites where electro-
chemical charge-transfer reactions occur as electrolyte
flows through them, as well as a separator (either an
electrolyte-filled gap or a selective membrane) to force the
electrons through the external circuit. The arrangement of
a typical cell is shown in Fig. 3, and individual cells can be
arranged in series to increase the overall stack voltage.
Generally, stacks are arranged in a bipolar fashion so that
current flows in series from one cell to the next.
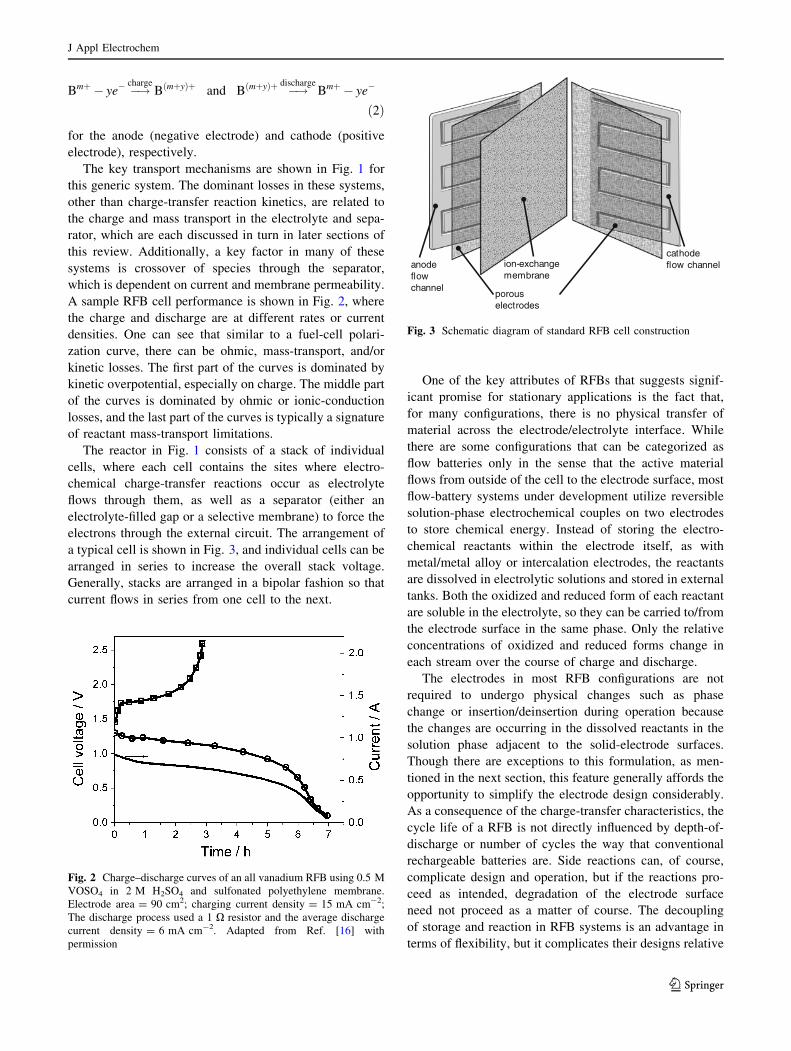
One of the key attributes of RFBs that suggests signif-
icant promise for stationary applications is the fact that,
for many configurations, there is no physical transfer of
material across the electrode/electrolyte interface. While
there are some configurations that can be categorized as
flow batteries only in the sense that the active material
flows from outside of the cell to the electrode surface, most
flow-battery systems under development utilize reversible
solution-phase electrochemical couples on two electrodes
to store chemical energy. Instead of storing the electro-
chemical reactants within the electrode itself, as with
metal/metal alloy or intercalation electrodes, the reactants
are dissolved in electrolytic solutions and stored in external
tanks. Both the oxidized and reduced form of each reactant
are soluble in the electrolyte, so they can be carried to/from
the electrode surface in the same phase. Only the relative
concentrations of oxidized and reduced forms change in
each stream over the course of charge and discharge.
The electrodes in most RFB configurations are not
required to undergo physical changes such as phase
change or insertion/deinsertion during operation because
the changes are occurring in the dissolved reactants in the
solution phase adjacent to the solid-electrode surfaces.
Though there are exceptions to this formulation, as men-
tioned in the next section, this feature generally affords the
opportunity to simplify the electrode design considerably.
As a consequence of the charge-transfer characteristics, the
cycle life of a RFB is not directly influenced by depth-of-
discharge or number of cycles the way that conventional
rechargeable batteries are. Side reactions can, of course,
complicate design and operation, but if the reactions pro-
ceed as intended, degradation of the electrode surface
need not proceed as a matter of course. The decoupling
of storage and reaction in RFB systems is an advantage in
terms of flexibility, but it complicates their designs relative
anodeflowchannel
ion-exchangemembrane
cathodeflow channel
porouselectrodes
Fig. 3 Schematic diagram of standard RFB cell construction
Fig. 2 Charge–discharge curves of an all vanadium RFB using 0.5 M
VOSO4 in 2 M H2SO4 and sulfonated polyethylene membrane.
Electrode area = 90 cm2; charging current density = 15 mA cm-2;
The discharge process used a 1 X resistor and the average discharge
current density = 6 mA cm-2. Adapted from Ref. [16] with
permission
J Appl Electrochem
123
Page 6
to conventional batteries, and adds a mechanical balance-
of-plant element for pumping the often highly corrosive
liquid electrolyte; as a result, their specific mass and vol-
umetric energy densities are much lower than conventional
batteries. A RFB configuration can nevertheless exceed the
performance of other grid-storage technologies and does
not require specific geographical siting, as pumped hydro-
electric and compressed-air energy storage (CAES) do.
Additionally, RFBs offer the important advantage that
power and energy outputs are independent variables since
the power is determined by the reactor size and the amount
of energy stored depends on the reactants chosen, their
concentration, and the size of the reactant tanks [16–18].
The amount of energy that can be stored in a conventional
sealed battery is generally limited by the effective path
lengths for diffusion and migration in the direction normal
to the current collector; making an electrode thicker will
add to the amount of active material, but one experiences
diminishing returns in terms of energy extraction because
of diffusional and ohmic losses in these systems.
As shown in Fig. 1, most RFB systems currently require
two separate electrolyte tanks: one for the anolyte and
another for the catholyte. This ensures that the potentials at
each electrode are close to the reversible potential for each
of the half-cell reactions, and side reactions or competition
from the other half-cell reactions are minimized. This does,
however, add to the size and cost of the system, and it also
requires a uniform delivery of the dissolved species to the
entire surface area as oftentimes most of the convective
flow is parallel to the electrode surface rather than being
flowed directly through it. Details of ion transport and flow
configurations are discussed more thoroughly in a sub-
sequent section.
The key costs of RFBs are the active material stored in
the electrolyte and the electrochemical cell itself. The
construction costs of the cell scale with the total power
requirement of the application, but these costs are directly
rated to the specific power of the device itself, i.e., how
effectively the materials are utilized. While RFBs ought to
be able to operate at relatively high current densities, as
convection can be employed to deliver reactants to the
electrode surface, RFBs have typically been operated at
current densities consistent with conventional batteries
without convection. It is anticipated that electrolyte man-
agement and cell design can deliver significant improve-
ments in power density, thereby reducing considerably cell
material costs.
2.1 Redox-flow-battery chemistries
Several battery technologies have been considered for grid-
based storage in recent decades. Traditional rechargeable
batteries have been modified and optimized for grid-based
storage and are being deployed in some installations,
including lead-acid, nickel-based, and lithium-ion batter-
ies; but we turn our attention to RFBs, which have been
demonstrated on the order of 100 kW to 10 MW. RFBs are
generally categorized based upon the anolyte and catholyte
that comprise the form of energy storage of the system.
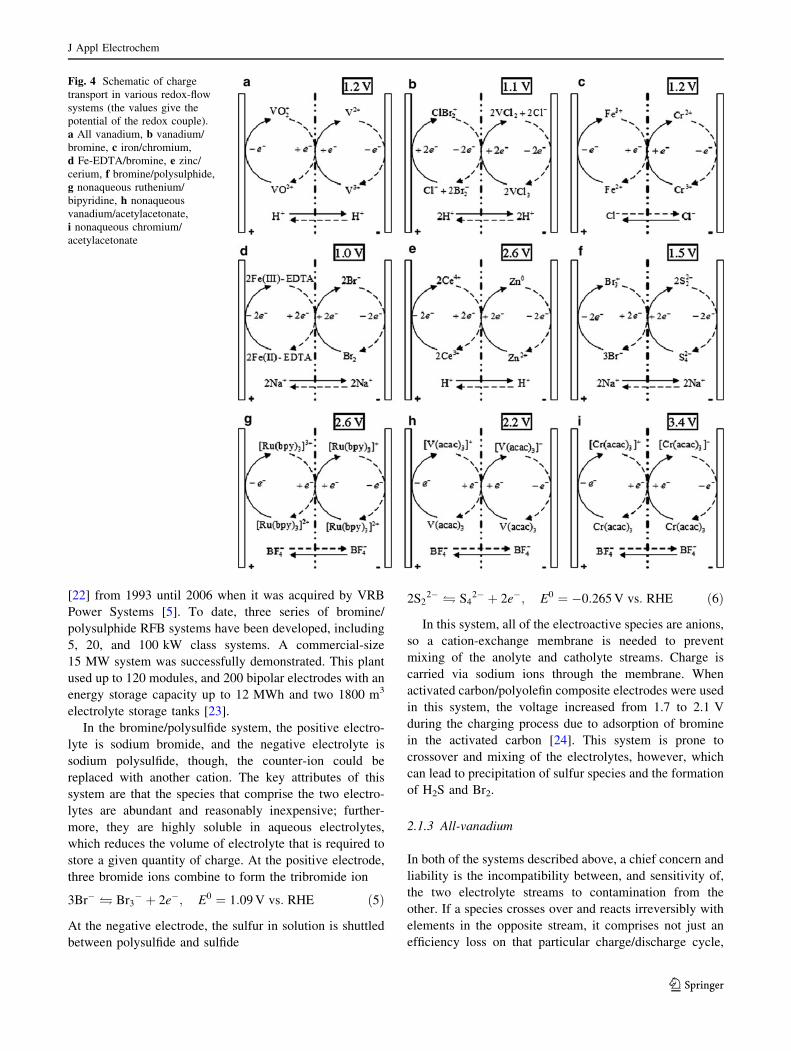
Figure 4 shows some basic redox couples, charge-transfer,
and ion-carrier-migration modes in various specific RFBs.
As shown in Fig. 4, configurations with the same species
but different oxidation states (such as all-vanadium) as well
as different active species in the anolyte and catholyte are
used. In this section, we introduce the various important
RFB types and briefly some of the advantages, disadvan-
tages, and challenges of each.
2.1.1 Iron/chromium
Modern development of what we might term a RFB began
with the development of an iron/chromium system (Fe/Cr)
in the 1970s at NASA, which demonstrated a 1 kW/
13 kWh system for a photovoltaic-array application [19,
20]. The Fe/Cr system is based upon an aqueous solution of
a ferric/ferrous redox couple at the positive electrode
(Fe2?/Fe3?); the negative electrolyte is a mixture of
chromic and chromous ions (Cr2?/Cr3?); most systems use
hydrochloric acid as the supporting electrolyte. The charge-
transfer reactions at each electrode are
Fe2þ� Fe3þ þ e�; E0 ¼ 0:77 V vs: RHE ð3Þ
and
Cr2þ� Cr3þ þ e�; E0 ¼ �0:41 V vs: RHE ð4Þ
The system can operate with an IEM/separator and low-
cost carbon-felt electrodes. Both charge-transfer reactions
require only a single-electron transfer, which is expected to
simplify charge transfer and result in reasonable surface
overpotentials without specific electrocatalysts. Indeed, the
iron redox couple is highly reversible on carbon or graphite
electrodes, but the chromium redox couple has significantly
slower kinetics and does require electrocatalysts. This
system has a relatively low open-circuit potential (between
0.90 and 1.20 V), and designers must endure crossover of
iron to the chromium stream and vice versa. Some
Japanese companies built similar batteries by licensing
the NASA patents, but have not shown improvement in the
low output voltage and efficiency [21].
2.1.2 Bromine/polysulfide
The bromine/polysulphide RFB was patented by Remick
[17] then extensively studied by Regenesys Technology
J Appl Electrochem
123
Page 7
[22] from 1993 until 2006 when it was acquired by VRB
Power Systems [5]. To date, three series of bromine/
polysulphide RFB systems have been developed, including
5, 20, and 100 kW class systems. A commercial-size
15 MW system was successfully demonstrated. This plant
used up to 120 modules, and 200 bipolar electrodes with an
energy storage capacity up to 12 MWh and two 1800 m3
electrolyte storage tanks [23].
In the bromine/polysulfide system, the positive electro-
lyte is sodium bromide, and the negative electrolyte is
sodium polysulfide, though, the counter-ion could be
replaced with another cation. The key attributes of this
system are that the species that comprise the two electro-
lytes are abundant and reasonably inexpensive; further-
more, they are highly soluble in aqueous electrolytes,
which reduces the volume of electrolyte that is required to
store a given quantity of charge. At the positive electrode,
three bromide ions combine to form the tribromide ion
3Br� � Br3� þ 2e�; E0 ¼ 1:09 V vs: RHE ð5Þ
At the negative electrode, the sulfur in solution is shuttled
between polysulfide and sulfide
2S22�� S4
2� þ 2e�; E0 ¼ �0:265 V vs: RHE ð6Þ
In this system, all of the electroactive species are anions,
so a cation-exchange membrane is needed to prevent
mixing of the anolyte and catholyte streams. Charge is
carried via sodium ions through the membrane. When
activated carbon/polyolefin composite electrodes were used
in this system, the voltage increased from 1.7 to 2.1 V
during the charging process due to adsorption of bromine
in the activated carbon [24]. This system is prone to
crossover and mixing of the electrolytes, however, which
can lead to precipitation of sulfur species and the formation
of H2S and Br2.
2.1.3 All-vanadium
In both of the systems described above, a chief concern and
liability is the incompatibility between, and sensitivity of,
the two electrolyte streams to contamination from the
other. If a species crosses over and reacts irreversibly with
elements in the opposite stream, it comprises not just an
efficiency loss on that particular charge/discharge cycle,
Fig. 4 Schematic of charge
transport in various redox-flow
systems (the values give the
potential of the redox couple).
a All vanadium, b vanadium/
bromine, c iron/chromium,
d Fe-EDTA/bromine, e zinc/
cerium, f bromine/polysulphide,
g nonaqueous ruthenium/
bipyridine, h nonaqueous
vanadium/acetylacetonate,
i nonaqueous chromium/
acetylacetonate
J Appl Electrochem
123
Page 8
but a loss of capacity and degradation in the overall
performance of the system, which may result in expensive
electrolyte separation and reactant recovery. To this end,
it is helpful to develop a system with more than two oxi-
dation states of the same element, wherein crossover only
represents an efficiency loss as no species are irreversibly
consumed or removed from their reactive electrolytic
solution. The all-vanadium system employs the V(II)/
V(III) redox couple at the negative electrode and the
V(IV)/V(V) redox couple at the positive electrode, gener-
ally identified to exist in the form of VO2? and VO2?
V2þ� V3þ þ e�; E0 ¼ �0:26 V vs: RHE ð7Þ
VO2þ þ H2O� VO2þ þ 2Hþ þ e�;
E0 ¼ 1:00 V vs: RHEð8Þ
In this case, the current is maintained by the migration of
protons across the membrane separator. While it is nomi-
nally the change in the oxidation state of vanadium on either
side of the membrane that stores and releases charge, there
is a change in the pH of the solution over the course of a
charge and discharge cycle. While crossover of the different
oxidation states of vanadium comprises an efficiency loss,
the proper forms can be regenerated electrochemically,
which eases the stringency of maintenance requirements.
While exploratory research on vanadium as a redox
couple began at NASA [8], the all-vanadium redox battery
(VRB) was invented and developed by Maria Skyllas-
Kazacos and her co-workers at the University of New
South Wales [16, 25, 26]. Research has continued on this
technology since that time. As a promising technology for
storing intermittent renewable energy, VRB systems have
received perhaps the most attention of all RFBs [16, 27–
39]. In fact, prototypes up to the range of MW in power and
MWh in energy-storage capacity have been demonstrated
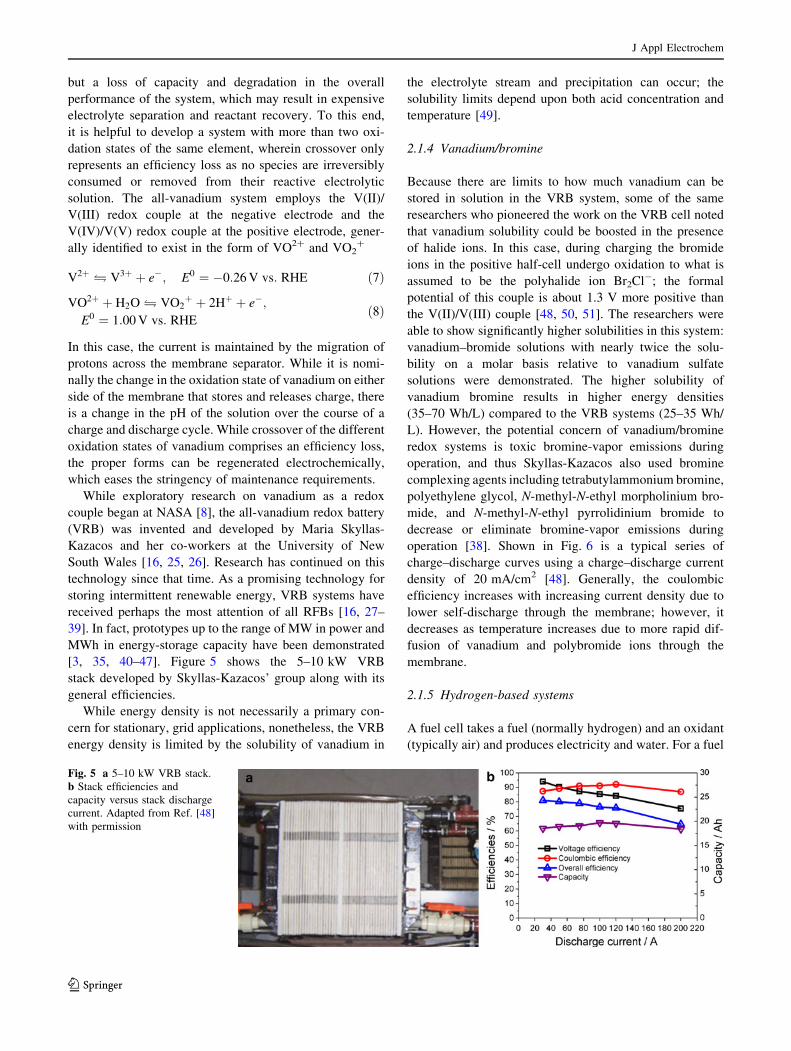
[3, 35, 40–47]. Figure 5 shows the 5–10 kW VRB
stack developed by Skyllas-Kazacos’ group along with its
general efficiencies.
While energy density is not necessarily a primary con-
cern for stationary, grid applications, nonetheless, the VRB
energy density is limited by the solubility of vanadium in
the electrolyte stream and precipitation can occur; the
solubility limits depend upon both acid concentration and
temperature [49].
2.1.4 Vanadium/bromine
Because there are limits to how much vanadium can be
stored in solution in the VRB system, some of the same
researchers who pioneered the work on the VRB cell noted
that vanadium solubility could be boosted in the presence
of halide ions. In this case, during charging the bromide
ions in the positive half-cell undergo oxidation to what is
assumed to be the polyhalide ion Br2Cl-; the formal
potential of this couple is about 1.3 V more positive than
the V(II)/V(III) couple [48, 50, 51]. The researchers were
able to show significantly higher solubilities in this system:
vanadium–bromide solutions with nearly twice the solu-
bility on a molar basis relative to vanadium sulfate
solutions were demonstrated. The higher solubility of
vanadium bromine results in higher energy densities
(35–70 Wh/L) compared to the VRB systems (25–35 Wh/
L). However, the potential concern of vanadium/bromine
redox systems is toxic bromine-vapor emissions during
operation, and thus Skyllas-Kazacos also used bromine
complexing agents including tetrabutylammonium bromine,
polyethylene glycol, N-methyl-N-ethyl morpholinium bro-
mide, and N-methyl-N-ethyl pyrrolidinium bromide to
decrease or eliminate bromine-vapor emissions during
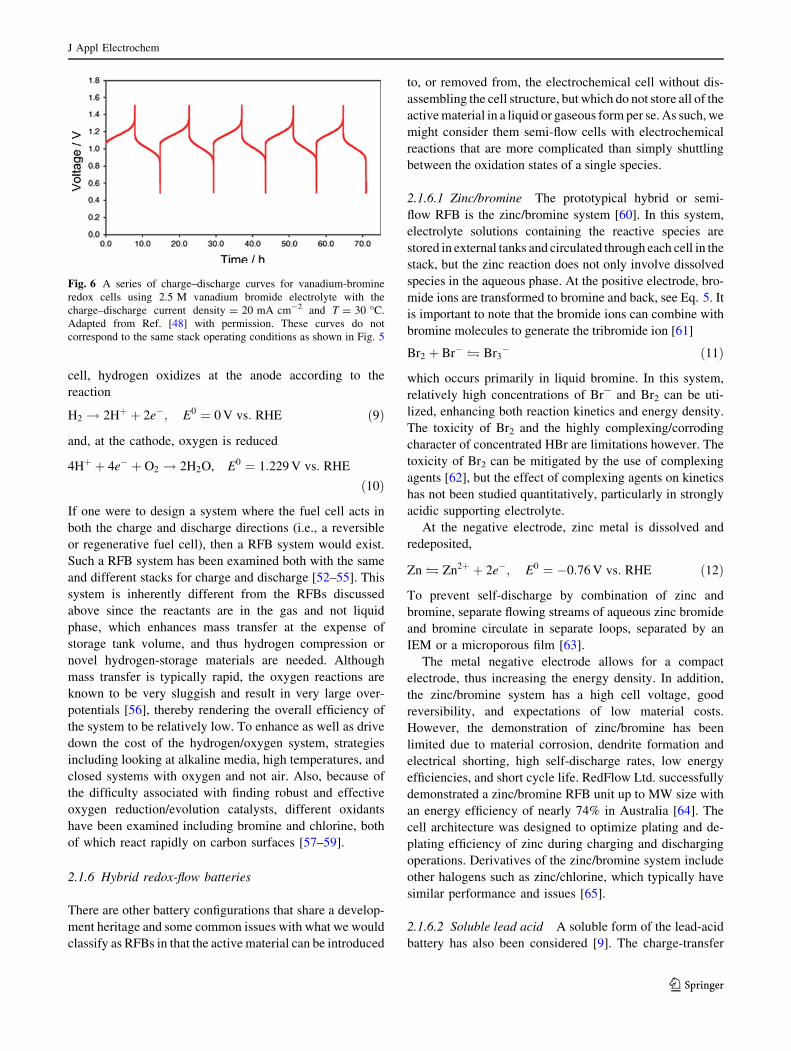
operation [38]. Shown in Fig. 6 is a typical series of
charge–discharge curves using a charge–discharge current
density of 20 mA/cm2 [48]. Generally, the coulombic
efficiency increases with increasing current density due to
lower self-discharge through the membrane; however, it
decreases as temperature increases due to more rapid dif-
fusion of vanadium and polybromide ions through the
membrane.
2.1.5 Hydrogen-based systems
A fuel cell takes a fuel (normally hydrogen) and an oxidant
(typically air) and produces electricity and water. For a fuel
Fig. 5 a 5–10 kW VRB stack.
b Stack efficiencies and
capacity versus stack discharge
current. Adapted from Ref. [48]
with permission
J Appl Electrochem
123
Page 9
cell, hydrogen oxidizes at the anode according to the
reaction
H2 ! 2Hþ þ 2e�; E0 ¼ 0 V vs: RHE ð9Þ
and, at the cathode, oxygen is reduced
4Hþ þ 4e� þ O2 ! 2H2O, E0 ¼ 1:229 V vs: RHE
ð10Þ
If one were to design a system where the fuel cell acts in
both the charge and discharge directions (i.e., a reversible
or regenerative fuel cell), then a RFB system would exist.
Such a RFB system has been examined both with the same
and different stacks for charge and discharge [52–55]. This
system is inherently different from the RFBs discussed
above since the reactants are in the gas and not liquid
phase, which enhances mass transfer at the expense of
storage tank volume, and thus hydrogen compression or
novel hydrogen-storage materials are needed. Although
mass transfer is typically rapid, the oxygen reactions are
known to be very sluggish and result in very large over-
potentials [56], thereby rendering the overall efficiency of
the system to be relatively low. To enhance as well as drive
down the cost of the hydrogen/oxygen system, strategies
including looking at alkaline media, high temperatures, and
closed systems with oxygen and not air. Also, because of
the difficulty associated with finding robust and effective
oxygen reduction/evolution catalysts, different oxidants
have been examined including bromine and chlorine, both
of which react rapidly on carbon surfaces [57–59].
2.1.6 Hybrid redox-flow batteries
There are other battery configurations that share a develop-
ment heritage and some common issues with what we would
classify as RFBs in that the active material can be introduced
to, or removed from, the electrochemical cell without dis-
assembling the cell structure, but which do not store all of the
active material in a liquid or gaseous form per se. As such, we
might consider them semi-flow cells with electrochemical
reactions that are more complicated than simply shuttling
between the oxidation states of a single species.
2.1.6.1 Zinc/bromine The prototypical hybrid or semi-
flow RFB is the zinc/bromine system [60]. In this system,
electrolyte solutions containing the reactive species are
stored in external tanks and circulated through each cell in the
stack, but the zinc reaction does not only involve dissolved
species in the aqueous phase. At the positive electrode, bro-
mide ions are transformed to bromine and back, see Eq. 5. It
is important to note that the bromide ions can combine with
bromine molecules to generate the tribromide ion [61]
Br2 þ Br� � Br3� ð11Þ
which occurs primarily in liquid bromine. In this system,
relatively high concentrations of Br- and Br2 can be uti-
lized, enhancing both reaction kinetics and energy density.
The toxicity of Br2 and the highly complexing/corroding
character of concentrated HBr are limitations however. The
toxicity of Br2 can be mitigated by the use of complexing
agents [62], but the effect of complexing agents on kinetics
has not been studied quantitatively, particularly in strongly
acidic supporting electrolyte.
At the negative electrode, zinc metal is dissolved and
redeposited,
Zn� Zn2þ þ 2e�; E0 ¼ �0:76 V vs: RHE ð12Þ
To prevent self-discharge by combination of zinc and
bromine, separate flowing streams of aqueous zinc bromide
and bromine circulate in separate loops, separated by an
IEM or a microporous film [63].
The metal negative electrode allows for a compact
electrode, thus increasing the energy density. In addition,
the zinc/bromine system has a high cell voltage, good
reversibility, and expectations of low material costs.
However, the demonstration of zinc/bromine has been
limited due to material corrosion, dendrite formation and
electrical shorting, high self-discharge rates, low energy
efficiencies, and short cycle life. RedFlow Ltd. successfully
demonstrated a zinc/bromine RFB unit up to MW size with
an energy efficiency of nearly 74% in Australia [64]. The
cell architecture was designed to optimize plating and de-
plating efficiency of zinc during charging and discharging
operations. Derivatives of the zinc/bromine system include
other halogens such as zinc/chlorine, which typically have
similar performance and issues [65].
2.1.6.2 Soluble lead acid A soluble form of the lead-acid
battery has also been considered [9]. The charge-transfer
Fig. 6 A series of charge–discharge curves for vanadium-bromine
redox cells using 2.5 M vanadium bromide electrolyte with the
charge–discharge current density = 20 mA cm-2 and T = 30 �C.
Adapted from Ref. [48] with permission. These curves do not
correspond to the same stack operating conditions as shown in Fig. 5
J Appl Electrochem
123
Page 10
reactions as written are the same as in a traditional sealed
lead-acid battery configuration. Lead-acid batteries do not
shuttle the same ion between the negative and positive
electrode; that is, Pb2? is introduced and removed from
solution at the negative electrode as lead is dissolved and
plated,
Pb� Pb2þ þ 2e�; E0 ¼ �0:13 V vs: RHE ð13Þ
but at the positive electrode, lead ions combine with water
to produce lead dioxide and protons,
Pb2þ þ 2H2O� PbO2 þ 4Hþ þ 2e�;
E0 ¼ 1:49 V vs: RHEð14Þ
As lead ions are produced in the oxidation step at the
negative electrode and produced in the reduction step at the
positive electrode on discharge, there is not a risk of
crossover lowering the overall efficiency of the system.
As long as the solid forms of lead and lead dioxide are
maintained at the negative and positive electrodes, circu-
lation of electrolyte can maintain the open-circuit potential
of the battery and allow greater specific cell performance
than with sealed or flooded lead-acid cells, assuming
minimal weight and volume of the external storage tank.
As with other semi-solid flow configurations, there are
risks associated with maintaining the morphology of the
solid phase as material can detach or grow across the
separator gap to cause short-circuit problems.
2.1.6.3 All iron Similar to the all-vanadium RFB, the
all-iron system [66, 67] involves only a single element,
where on one electrode iron(II) goes to iron(III), Eq. 3, and
on the other plating of iron occurs
Fe� Fe2þ þ 2e�; E0 ¼ �0:3 V vs: RHE ð15Þ
Due to the single species, crossover is not as much a
concern although it is still a current inefficiency. This
system has some of the same issues as the other hybrid
batteries including getting uniform plating of the metal,
thereby necessitating precise pH control and supporting
electrolyte; however, iron does not have the extensive
dendrite problems of zinc. The benefits of the cell are also
that the materials are nonhazardous and inexpensive. These
are balanced by the fact that the overall cell voltage is
relatively low and hydrogen generation can occur, although
iron is a poor hydrogen-evolution catalyst.
2.1.7 Non-aqueous redox-flow batteries
The use of non-aqueous electrolytes in RFB configurations
has been considered because of the higher cell potentials
that are possible when one is not concerned by the break-
down of the aqueous electrolyte. In addition, many couples
and reactants are much more soluble in non-aqueous
solvents. However, the challenges of low electrolyte con-
ductivities, stability, and cost limit the development of non-
aqueous RFB systems.
As an example, the zinc/cerium cell has been worked
on by Plurion Limited. As with the zinc/bromine cell, the
negative electrode dissolves and plates zinc, Eq. 12, and at
the positive electrode, cerium is shuttled between Ce(III)
and Ce(IV)
Ce3þ� Ce4þ þ e�; E0 ¼ 1:75 V vs: RHE ð16Þ
The developers claim a cell potential of approximately
2.5 V on charging, but it drops below 2 V during discharge
with an energy density of 37.5 to 120 Wh/L [68, 69].
The high operating potential window is achieved by using
methane sulfonic acid rather than pure water as the solvent,
thus minimizing decomposition of water into hydrogen and
oxygen, as well as aiding in zinc plating. The redox reaction
of Ce(III)/Ce(IV) is kinetically slow and Ce(III) has a
somewhat low diffusivity [70, 71]. High acid strength
facilitates the solubility of Ce(IV); however, the solubility
of Ce(III) decreases at higher acid concentrations. Other
electrochemical couples including zinc/chlorine [72], zinc/
ferricyanide [69], and vanadium/cerium [73] have been
considered. While non-aqueous electrolytes generally imply
higher costs than aqueous electrolytes and must be vetted for
environmental and chemical compatibility, the expansion
of the operating potential window is attractive, as the cell
potential difference has a direct impact on the amount of
power that can be delivered for a specified current density.
Other examples of nonaqueous RFBs include that of
Matsuda et al. [74] who demonstrated a redox system based
on [Ru(bpy)3]2?/[Ru(bpy)3]3? (bpy is bipyridine) as the
anolyte and [Ru(bpy)3]?/[Ru(bpy)3]2? as the catholyte in
acetonitrile (CH3CN) with tetraethylammonium tetrafluo-
roborate (TEABF4) as the supporting electrolyte. This
system yielded an open-circuit potential of 2.6 V, with
an energy efficiency of 40%. Chakrabarti et al. evaluated a
redox system based on a ruthernium acetylacetonate,
obtaining a cell potential of 1.77 V [75]. Yamamura et al.
[76] studied a non-aqueous system which used various ura-
nium beta-diketonates with the cell potentials of about 1 V.
Recently, Thompson and co-workers demonstrated a
redox-flow system using M(acac)3 (M = V, Cr or Mn, and
acac is acetylacetonate) with at least three different oxidation
states [77–79]. The vanadium and chromium acetylacetonate
systems showed higher open-circuit potentials, 2.2 and
3.4 V, respectively, compared to around 1.26 V for the
aqueous VRB system. However, crossover and ohmic losses
due to the large distances between positive and negative
electrodes limited the coulombic efficiency. Although the
Mn(acac)3 system shows a lower open-circuit potential
(1.1 V) than that of V(acac)3, Cr(acac)3, and VRB, it
exhibits better reversibility both for Mn(II)/Mn(III) and
J Appl Electrochem
123
Page 11
Mn(III)/Mn(IV) redox couples, with a columbic efficiency
approaching 97% in a static H-type cell. Shinkle et al. studied
the degradation mechanisms in the non-aqueous V(acac)3
redox systems [80], and showed that environmental oxygen
and water are associated with side reactions that affect the
long-term charge–discharge response of the battery.
2.1.8 Other configurations
There is recent interest in the development of the lithium-
air battery, which operates with a static lithium negative
electrode, as might be found in a lithium-ion or lithium-
polymer battery. Lithium ions combine with oxygen from
air to form lithium oxide at the positive electrode on dis-
charge; oxygen is regenerated during charging. Kraytsberg
and Ein-Eli provide an overview of the technology [81].
There are many challenges with such a battery system,
such as ensuring proper isolation of the negative electrode
from oxygen and water crossover and ensuring an electrode
structure that provides for facile oxygen transport and
reversible oxide formation and stripping. However, the
promise for high energy density and low material costs
suggest tremendous research opportunities.
Another recent flow-cell concept was invented by
Yet-Ming Chiang’s group at MIT and described by Duduta
et al. [82, 83]. They proposed using typical intercalation
electrode materials as active materials for a lithium
rechargeable battery, but providing the active material in a
slurry that can be mechanically pumped into and out of a
reaction chamber. In the paper describing the concept, they
note that they will be able to store much higher concen-
trations of active material in the solid component of the
slurry than can be stored as ions dissolved in electrolyte
(up to 24 M), thereby increasing the energy density well
beyond what could be achieved in traditional RFBs.
3 Kinetics of redox reactions
The study of the kinetics of redox reactions occupies
a central place in fundamental electrochemistry. Most
important concepts in the theory of electrode reactions
were developed from the consideration of redox reactions.
The simplest form of a redox reaction is a one-electron
transfer of an electron to or from an electrode to an ion in
solution, written generally as
Oþ ne� � R ð17Þ
where O is the oxidized state and R the reduced state of the
ion. In the simplest type of redox reaction, there are no
changes in the ion other than the valence state and relax-
ation of the solvent around the ion. The prototypical
example of such a reaction is the ferrous/ferric reaction in
solutions of sulfuric acid (meticulously free of chloride ion,
as discussed in more detail below). The reactions become
more complex, and the theory more involved, when the
ions are complexed with neutral or other anions that do not
participate in the electron transfer directly (i.e., it does not
change valence or state of charge), but are part of the
relaxation of solvating ligands or assist the transfer of
the electron from the electrode surface, termed mediated
electron transfer. Ferri-/ferrocyanide and ferric/ferrous
chloride would be examples, respectively, of such redox
couples. There are also reactions involving multi-atom ions
and reactions where one state is a neutral molecule that are
termed redox reactions. There are no hard criteria for what
is or is not a ‘‘redox’’ reaction, but a common feature is that
it involves electron transfer that is at least measurably
reversible. For the purposes here, we will discuss only the
more well-studied reactions that have some promise as
RFB couples as mentioned above.
Most of the fundamental principles for the kinetics
of electron transfer can be found in two classic texts in
electrochemistry, and those form the basis of the principles
reviewed here. The first is the text by Vetter [84], which
contains an interesting and unique description of the his-
tory of the development of the fundamental theory of
electrode kinetics, including the familiar names of Butler
and Volmer, but less recognized (in this context) names
such as Gurney, Erdey-Gruz and Vetter himself [84]. This
text also reviews experimental results for more than 25
redox couples, all from original papers published before ca.
1960, but these references remain in some cases as the
best source of quantitative kinetic parameters versus more
recent but qualitative (or less rigorous) measurements.
Another important resource is the text by Bard and
Faulkner [85], more accessible than the Vetter text,
with notation and terminology that is more contemporary.
Following the notation in Bard and Faulkner, the Butler–
Volmer model of the kinetics of reaction produces the
essential current (i)–overpotential (g) relationship as
i ¼ i0
"cO 0; tð Þ
c�O
� �exp
aF
RTg
� �
� cR 0; tð Þc�R
� �exp � 1� að ÞF
RTg
� �# ð18Þ
where g is the overpotential, defined as the difference
between the electrode potential under current flow and the
rest (zero current) potential
g ¼ Uk � Up � Eeq ð19Þ
where Uk is the potential in phase k, and Eeq is the Nernst
potential, which is related to the concentrations of the
oxidized c�O� �
and reduced c�R� �
species by
J Appl Electrochem
123
Page 12
Eeq ¼ E0 þ RT
Fln
c�Oc�R
� �ð20Þ
where i0 is the exchange current density, a is the transfer
coefficient (or the symmetry factor in transition state the-
ory), and R, T and F have their usual meaning. This form of
the Butler–Volmer equation is important for both funda-
mental (experimental) kinetic studies and for modeling
practical devices, since in both cases one needs to consider
the contribution of mass transport of the ions from the bulk
solution to the electrode surface.
The essential kinetic parameters determined experi-
mentally are the exchange current density and the transfer
coefficient. The exchange current is the magnitude of the
partial anodic and cathodic currents which are equal at
equilibrium, and are in turn related to the bulk concentra-
tions by the standard rate constant, k0,
i0 ¼ Fk0c� 1�að ÞO c�aR ð21Þ
Since the exchange current density varies with the
concentration of the redox species, the more fundamental
measure of kinetics for redox reactions is k0. The grouped
kinetic parameter i0 is an important quantity to confirm
experimentally. The transfer coefficient is usually
measured from the slope of log i vs. g in the so-called
Tafel region, where the back-reaction is negligible and the
relationship between overpotential and current density
reduces to
i ¼ i0cR 0; tð Þ
c�R
� �exp
1� að ÞFRT
g
� �ð22Þ
and the experimental current is either obtained under
conditions where cRð0; tÞ ¼ c�R or accurate mathematical
correction can be made to the experimental value, for
example, the solution of the convective-diffusion equation
for the rotating-disk electrode [85]. Likewise, the value of
i0 can be obtained by extrapolation of the Tafel plot to
g = 0. However, for fast kinetics, or where a second
electrochemical reaction (e.g. hydrogen or oxygen evolu-
tion), occurs near the equilibrium potential, a linear Tafel
plot may not be obtained and neither i0 nor a may be
obtained by this method. There are a number of other
methods that may be used to obtain i0 directly. In those
cases, the concentration dependence of the exchange cur-
rent density may be used to obtain a.
Following the pioneering theoretical framework intro-
duced by Gerischer [86], modern quantum chemical theory
of redox kinetics at electrode surfaces has focused on the
distance of the redox ion from the electrode surface [87].
Modern theory typically distinguishes redox reactions as
either ‘‘inner-sphere’’ or ‘‘outer-sphere’’, the latter referring
to reactions where the redox ion is ‘‘inside’’ the plane of the
inner Helmholtz ionic layer and the former ‘‘outside’’ [88].
Practically, this distinction is important in that inner-sphere
reactions typically have a very large dependence of the
reaction kinetics on the electrode material, in many cases
by orders of magnitude; the hydrogen electrode is perhaps
the most dramatic in this respect. For outer-sphere reac-
tions, the kinetic effect of different electrode materials is
much less, but not insignificant. However, this distinction
in electrode-material dependence is not essential, and there
are examples where inner-sphere reactions have a rela-
tively small dependence on the electrode material, e.g. the
Br2/Br- reaction. The detailed discussion of the effect of
electrode materials on the kinetics is beyond the scope of
this review.
One can estimate the rough order of magnitude that the
kinetic rate must be for a practical RFB. For example,
using some of the metrics in Table 1 (i.e., a RFB must have
high electrical efficiency, e.g. at least 80% round-trip, or
90% in each direction) and assuming a typical cell voltage
of 1.5 V, then the kinetic overpotential must be less than
150 mV throughout the charge/discharge cycle. Assuming
a minimum practical current density of at least 50 mA/cm2,
a roughness factor of 10, i.e. 10 cm2 surface per unit
electrode geometric area, and a transfer coefficient of 0.5,
the exchange current density must be greater than 0.3 mA/
cm2 (real) throughout the charge/discharge cycle. Assum-
ing 1 M solutions at 50% state of charge, and assuming
90% utilization of the redox ions in the cycle, the minimum
value of the standard rate constant k0 is ca. 10-5 cm/s. If
the rate constant is significantly less than this value, some
compromises must be made to achieve a practical device
which may increase cost and/or utility. For example, higher
surface area/porosity electrodes will compromise a simple
flow-by/through design. Reduced current density will
reduce power density and result in larger electrodes and
more material per unit volume in the RFB. The estimated
value above can be compared to those in literature as
shown in Table 2.
The results in Table 2 show that of all the redox couples
recently or currently in use in practical RFBs, only the
VO2?/VO2? couple has a clear kinetic limitation and, in
fact, is clearly problematic. This is not surprising since this
redox is not a simple one-electron transfer reaction, but is
in modern terminology an oxygen transfer reaction as
shown in Eq. 8. As discussed in detail recently by Gattrell
et al. [91], this reaction is a multi-step reaction in which
oxygen transfer (a chemical step) may precede or follow an
electron-transfer step, denoted in modern terminology as a
CE or EC mechanism. Such reactions usually have current–
potential relations which differ significantly from the ideal
Butler–Volmer form, and that is the case here. The kinetic
data by Gattrell et al. were obtained using a graphite RDE,
which should be directly applicable to practical cells which
use carbon-felt electrodes. Although the quantitative data
J Appl Electrochem
123
Page 13
in Table 2 was obtained using a Hg electrode, the polari-
zation curves shown for the V2?/V3? electrode with a
graphite RDE in Gattrell et al. indicate a rate constant
�10-5 cm/s.
The dependence of the VO2?/VO2? couple on electrode
material has not been very well-studied. Skyllas-Kazacos
and co-workers [92] reported somewhat larger exchange-
current densities for less well-characterized ‘‘carbon’’
electrodes than Gattrell et al. and suggested it is possible to
enhance kinetics by surface treatment of carbon-based
electrodes. Zhong et al. fabricated conducting polyethylene
(PE) composite electrodes with low resistivities by mixing
PE with conducting fillers (carbon black, graphite power
and fiber) [92]. The chemical treatment of graphite fiber-
based composite polymer electrodes with chromate-sul-
phuric acid was shown to enhance the surface and improve
reactivity for the electrode reactions. Carbon-polypropyl-
ene (PP) composite electrodes modified with rubber show
better mechanical properties, better impermeability and
better overall conductivity compared to the PE composite
electrodes [95]. A voltage efficiency as high as 91% was
obtained for the VRB with the carbon-PP composite elec-
trodes. Graphene oxide nanoplatelets (GONPs) demon-
strated a more favorable electrocatalytic activity for V(V)/
V(IV) and V(III)/V(II) redox couples than pristine graphite
for the VRBs. It is found that the V(III)/V(II) redox reac-
tion strongly depends on the formation of surface active
functional groups of C–OH and COOH [96]. However,
it is not clear that using an electrode material other than
graphite/carbon would be cost effective.
In contemporary studies of heterogeneous electron
transfer reactions, the Fe3?/Fe2? reaction is still considered
to be the prototypical outer-sphere reaction amenable to
quantitative quantum chemical treatment using modern
ab initio methods. The data shown in Table 2 are relatively
recent measurements using sulfuric-acid solutions rigor-
ously purified specifically of chloride ion (to ppb levels).
Following the pioneering work by Nagy et al. [97], it is
now widely recognized that with Pt and Au electrodes,
the presence of even trace amounts of chloride ion enhances
the experimental rate of electron transfer by at least two-
orders of magnitude, probably by a mediated or bridging
transfer of the electron via adsorbed chloride anions. While
it has not been proven conclusively that the ‘‘chloride
effect’’ is exclusive to Pt and Au, theoretical considerations
are consistent with such an expectation, and qualitative data
with carbon-felt electrodes suggest this is the case, and that
the kinetic parameters given in Table 2 should be applicable
to carbon electrodes in a practical battery.
The Ce4?/Ce3? was studied in detail by Vetter [84]
including rigorous correction for the partial current from
oxygen evolution. The reaction has not been the subject of
many studies since then. The corrosion of the electrode
material and the parasitic effect of oxygen evolution are
serious issues for a practical device. Use of stable electrode
materials such as IrO2 evolve significant oxygen, thereby
reducing efficiency and requiring active cell rebalancing
and maintenance. Carbon electrodes will undergo signifi-
cant corrosion and not have practical lifetimes at these
operating potentials [98]. Practical use of this redox couple
in a RFB will require a scientific breakthrough in electrode
material.
Like the VO2?/VO2? couple, the Br2/Br- is a multi-step
reaction with at least one chemical step, that of breaking/
making the Br–Br bond, either preceding or following
electron transfer. The chemical step is, however, much
simpler than the oxygen transfer step in the VO2?/VO2?
reaction. The kinetics of this reaction are not nearly as
dependent on electrode material as, for example, the
hydrogen electrode, to which it is mechanistically similar
[84]. The data for Pt and vitreous carbon shown in Table 2
illustrate this fact well, with the difference in rate constant
being only a factor 30, whereas for the hydrogen electrode
the difference would be several orders of magnitude. The
reason for this difference can be explained rather easily
qualitatively by considering the bond energies involved
in the possible/probable chemical steps, for example, that
of dissociating the Br2 molecule to form an adsorbed state
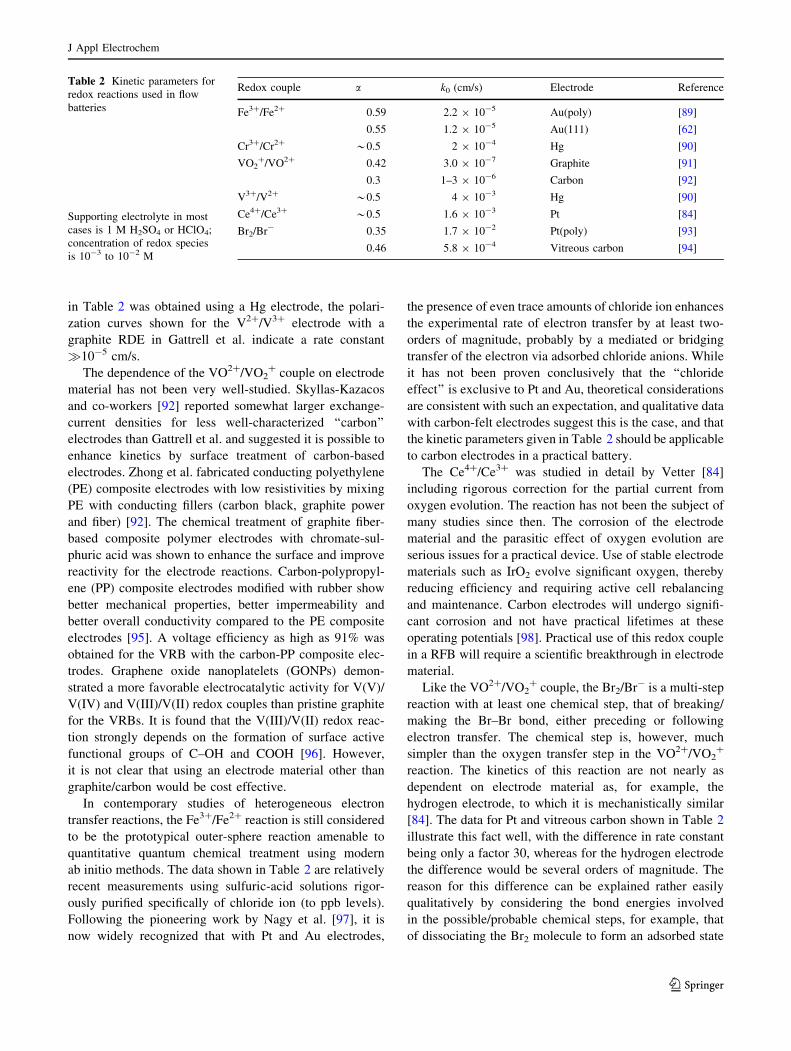
Table 2 Kinetic parameters for
redox reactions used in flow
batteries
Supporting electrolyte in most
cases is 1 M H2SO4 or HClO4;
concentration of redox species
is 10-3 to 10-2 M
Redox couple a k0 (cm/s) Electrode Reference
Fe3?/Fe2? 0.59 2.2 9 10-5 Au(poly) [89]
0.55 1.2 9 10-5 Au(111) [62]
Cr3?/Cr2? *0.5 2 9 10-4 Hg [90]
VO2?/VO2? 0.42 3.0 9 10-7 Graphite [91]
0.3 1–3 9 10-6 Carbon [92]
V3?/V2? *0.5 4 9 10-3 Hg [90]
Ce4?/Ce3? *0.5 1.6 9 10-3 Pt [84]
Br2/Br- 0.35 1.7 9 10-2 Pt(poly) [93]
0.46 5.8 9 10-4 Vitreous carbon [94]
J Appl Electrochem
123
Page 14
of Br, analogous to the Tafel step in the hydrogen elec-
trode. The bond energy of Br2 is 192 vs. 457 kJ/mol for H2.
To be energetically favorable, the adsorption energy of the
Br needs to be greater than 86 vs. 228.5 kJ/mol for H. If
one-electron transfer precedes dissociation, i.e. the disso-
ciation is of a Br2- species, then the adsorption energy
required is even less. Similar considerations apply in the
anodic direction, where the proton is much more strongly
solvated than the bromide ion (by about a factor of 3 [99]),
meaning much weaker chemical interaction with the elec-
trode is required for forming an adsorbed Br intermediate
than an H intermediate. The shapes of the polarization
curves on both Pt and vitreous carbon are very similar,
differing primarily in the magnitude of the current scale,
and on neither electrode material does one observe a classic
Butler–Volmer relation. For the purposes of Table 2, only
the reduction data was used to extract a rate constant using
the Tafel region. The authors of both papers propose the
same reaction mechanism for both electrode materials,
Br2 þ e� � Brad þ Br� ð23Þ
and
Brad þ e� � Br� ð24Þ
The first step above is not an elementary step, and electron
transfer must either precede or follow dissociation. From
the energetic considerations above, it seems reasonable to
suggest that on carbon electrodes the electron transfer
precedes dissociation, consistent with relatively weak
adsorption of Brad on this surface. In many ways, the
Br2/Br- couple is the ideal redox electrode for RFBs. The
reaction is relatively facile, and the kinetics are not
strongly dependent on electrode material, such that carbon/
graphite electrodes provide reasonable performance, as
demonstrated in zinc/bromine RFBs [60]. This material
flexibility is a significant advantage in practical electrode
design.
Before examining surface-area effects, a mention should
be made about typical RFB electrode materials. As noted
above, graphitic or vitreous carbon materials are widely
used in RFBs [27, 28, 30, 100], such as graphite, carbon
felt, carbon fiber, thermal and acid treated graphite, carbon-
polymer composite materials, carbon nanotubes, Ir-modi-
fied carbon felt and graphene-oxide nanoplatelets. In gen-
eral, RFB couples are chosen for the facile kinetics so
highly active catalytic materials are not necessary. None-
theless, it has been found that various surface treatments
can lead to improved reaction kinetics on carbon elec-
trodes. Chemical etching [101], thermal treatment [102],
chemical doping [11], carbon nanotube addition [103], and
addition of metallic catalyst sites to the carbon fibers [104]
have all been attempted. Aside from catalytic activity,
the main criteria for electrode materials are electrical
conductivity, chemical stability and durability in the reac-
tion environment. Carbon and graphite materials meet both
these requirements, though metal foams and meshes are
also candidates [105, 106]. The search for improved elec-
troactive materials for RFBs will no doubt continue to be
actively pursued.
3.1 Active surface area
The above kinetic constants and equations (e.g., Eq. 18)
are for rates per unit catalyst area. As mentioned, one way
to compensate for a slower reaction is to increase the
roughness factor or catalyst surface area per unit geometric
area. For example, ignoring double-layer charging and
assuming electroneutrality, one can write a current balance
between ionic and electronic current,
r � i2 ¼ �r � i1 ¼ a1;2ih;1�2 ð25Þ
where it is evident that the current generation source term
is directly proportional to the specific interfacial area, a1,2,
which can be related to the roughness factor discussed
above Table 2 by accounting for the thickness of the
electrode. In the above equation, -r � i1 represents the
total anodic rate of electrochemical reactions per unit
volume of electrode and ih,1–2 is the transfer current for
reaction h between the ionic and electronic materials;
for RFBs, the electronic current (1) is the electrons and the
ionic current (2) are the reactive ion species. Thus, the
surface area in the porous electrode is critical to RFB
performance.
An optimum surface area in a porous medium is directly
linked to the physical and transport properties of the med-
ium, namely, porosity and permeability, respectively. From
an electrochemical standpoint it is desirable to have the
highest possible surface area, but this tends to conflict with
the need to minimize pressure drop and pumping costs,
which favor high permeability. A brief analysis of the
interplay between these two key parameters follows. Typical
RFB carbon-fiber-paper or carbon-felt electrode materials
have a porosity around 0.8, a fiber diameter of approxi-
mately 10 lm and a permeability of 20 9 10-8 cm2. A
qualitative estimate of the surface area variation with fiber
diameter can be obtained using a filament analogue model
which simply involves finding the number of cylinders N of a
given diameter df that give a specified porosity e (cm3/cm3),
then determining the specific surface area a1,2 (cm2/cm3) of
N cylinders. A simple formula for this relationship is given
by Carta et al. [107]
a1;2 ¼4 1� eð Þ
df
ð26Þ
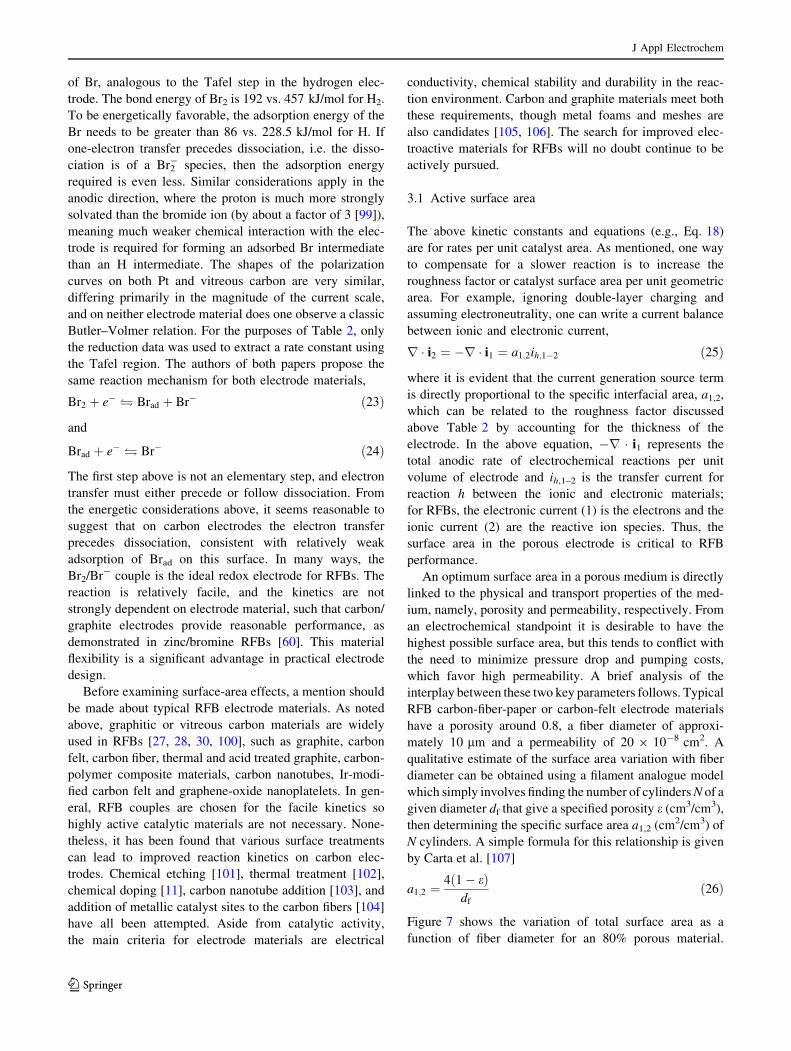
Figure 7 shows the variation of total surface area as a
function of fiber diameter for an 80% porous material.
J Appl Electrochem
123
Page 15
The actual surface area in a real fiber bed may be less than
this value since fibers contact and overlap each other, or
more if the fibers are not truly cylindrical but rough or
ridged. In terms of a roughness factor, using a typical felt
properties and a thickness of a few millimeters, a value of
around 50 is obtained. Also shown in Fig. 7 is the absolute-
permeability change expected as calculated from the Car-
man-Kozeny equation [108], which has been shown to
adequately describe the variation of permeability with
porosity due to compression in fibrous materials [109] and
is assumed to apply here.
Clearly, the fiber diameter dramatically impacts both
aspects and unfortunately in opposing directions. Increas-
ing the fiber diameter from 10 to 100 lm improves the
permeability by a factor of 100, but reduces the surface
area by a factor of 10. The same general trend would be
true for other random electrodes such as particulate beds.
Efforts to increase active surface area in a flowing elec-
trolyte by using particles with microporosity have been
reported [18], but, not surprisingly, this additional surface
area does not contribute significantly to the electrochemi-
cally active area since such internal surfaces are highly
diffusion limited. Attempts to increase the roughness of the
electrode surface could be beneficial, but typically it is
more profitable to modify the surface for increased kinetic
or catalytic behavior rather than just surface area.
Another aspect of the active solid surface area that must
be considered is the intimacy of the solid/electrolyte con-
tact [18, 36]. Carbon and graphite materials have a neutral
wettability to water [110] which prevents the spreading of
electrolyte over the electrode surface. The trapped air
pockets resulting from incomplete wetting reduce the
electroactive surface area owing to the Cassie–Baxter
effect. Such incomplete wetting would be exacerbated
on roughened surfaces. Sun and Skyllas-Kazacos found
that certain electrode pretreatments intended to improve
catalytic activity also lead to somewhat improved wetta-
bility behavior [36]. Litster et al. [111] report that briefly
heating carbon fiber materials at 300 �C in an air envi-
ronment rendered them fully hydrophilic, and Yan et al.
[112] review various treatment procedures for altering
carbon wettability. The presence of a gas phase at the solid/
electrolyte interface could be due to residual air trapped
during initial flooding of the electrode, or could appear due
to evolution of gases such as the parasitic evolution of
hydrogen and/or oxygen [13, 113].
4 Transport phenomena
There are various mechanisms of transport that occur
within a RFB. Typically, electron flow is not limiting due
to the use of conductive additives or just carbon materials.
This transport is adequately described by Ohm’s law,
i1 ¼ �rrU1 ð27Þ
where r is the electronic conductivity. The other major
transport issue is that of the reactants and products. Typi-
cally, this can be separated into two different regions,
namely, that of the electrode and that of the membrane or
separator. These two regions often have different proper-
ties; their transport species and mechanisms are discussed
in turn below. For the electrolyte in the electrodes, diffu-
sion is often the most important process while conduction
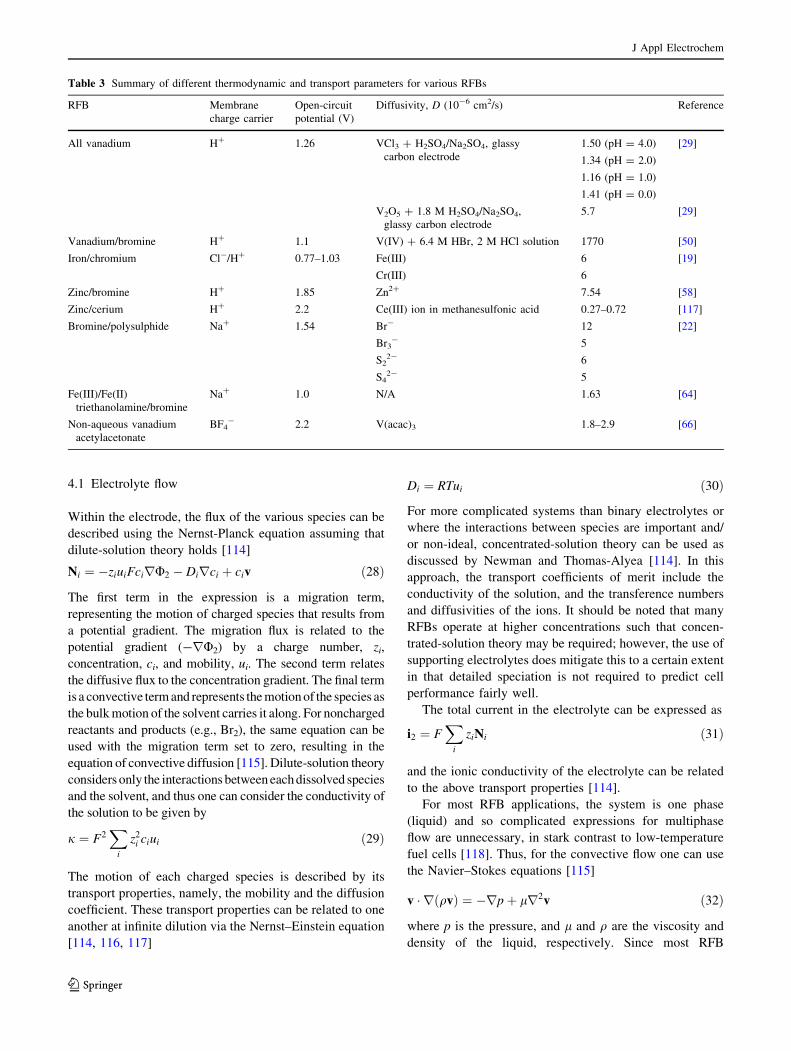
is for the membrane. Table 3 shows a summary of the
charge-carrying species across the membrane, open circuit
potential, and diffusivities of active ions. While dilute-
solution theory does not necessarily strictly apply in the
electrolyte systems of interest, diffusivities of the ions give
a good indication of the relative motions of the relevant
ions. Cation-exchange membranes (mainly H? and Na?)
are widely used in the aqueous RFBs due to their high
ionic conductivity. Anion exchange membranes are used
in many non-aqueous systems to be compatible with the
supporting electrolytes used and suppress unwanted
crossover. Generally, the open-circuit potential of an
aqueous system is constrained to be lower due to the low
electrochemical stability window of H2O compared to that
of non-aqueous RFB’s, in which organic solvents (such as
acetone) with a higher electrochemical stability voltage
window are used. The diffusivities of active species in
all systems listed in Table 3 are in the range of 1.6 to
12 9 10-6 cm2/s except for V(IV) (1770 9 10-6 cm2/s in
6.4 M HBr and 2 M HCl). Finally, while there are some
other, less critical issues such as thermal management and
heat transport within the cell, such a discussion is beyond
the scope of this review.
Fig. 7 Permeability and surface area of a fibrous material with a
porosity of 0.8 as a function of fiber diameter. Permeability was
calculated using the Carman-Kozeny model and surface area was
estimated using the filament analogue model
J Appl Electrochem
123
Page 16
4.1 Electrolyte flow
Within the electrode, the flux of the various species can be
described using the Nernst-Planck equation assuming that
dilute-solution theory holds [114]
Ni ¼ �ziuiFcirU2 � Dirci þ civ ð28Þ
The first term in the expression is a migration term,
representing the motion of charged species that results from
a potential gradient. The migration flux is related to the
potential gradient (-rU2) by a charge number, zi,
concentration, ci, and mobility, ui. The second term relates
the diffusive flux to the concentration gradient. The final term
is a convective term and represents the motion of the species as
the bulk motion of the solvent carries it along. For noncharged
reactants and products (e.g., Br2), the same equation can be
used with the migration term set to zero, resulting in the
equation of convective diffusion [115]. Dilute-solution theory
considers only the interactions between each dissolved species
and the solvent, and thus one can consider the conductivity of
the solution to be given by
j ¼ F2X
i
z2i ciui ð29Þ
The motion of each charged species is described by its
transport properties, namely, the mobility and the diffusion
coefficient. These transport properties can be related to one
another at infinite dilution via the Nernst–Einstein equation
[114, 116, 117]
Di ¼ RTui ð30Þ
For more complicated systems than binary electrolytes or
where the interactions between species are important and/
or non-ideal, concentrated-solution theory can be used as
discussed by Newman and Thomas-Alyea [114]. In this
approach, the transport coefficients of merit include the
conductivity of the solution, and the transference numbers
and diffusivities of the ions. It should be noted that many
RFBs operate at higher concentrations such that concen-
trated-solution theory may be required; however, the use of
supporting electrolytes does mitigate this to a certain extent
in that detailed speciation is not required to predict cell
performance fairly well.
The total current in the electrolyte can be expressed as
i2 ¼ FX
i
ziNi ð31Þ
and the ionic conductivity of the electrolyte can be related
to the above transport properties [114].
For most RFB applications, the system is one phase
(liquid) and so complicated expressions for multiphase
flow are unnecessary, in stark contrast to low-temperature
fuel cells [118]. Thus, for the convective flow one can use
the Navier–Stokes equations [115]
v � r qvð Þ ¼ �rpþ lr2v ð32Þ
where p is the pressure, and l and q are the viscosity and
density of the liquid, respectively. Since most RFB
Table 3 Summary of different thermodynamic and transport parameters for various RFBs
RFB Membrane
charge carrier
Open-circuit
potential (V)
Diffusivity, D (10-6 cm2/s) Reference
All vanadium H? 1.26 VCl3 ? H2SO4/Na2SO4, glassy
carbon electrode
1.50 (pH = 4.0)
1.34 (pH = 2.0)
1.16 (pH = 1.0)
1.41 (pH = 0.0)
[29]
V2O5 ? 1.8 M H2SO4/Na2SO4,
glassy carbon electrode
5.7 [29]
Vanadium/bromine H? 1.1 V(IV) ? 6.4 M HBr, 2 M HCl solution 1770 [50]
Iron/chromium Cl-/H? 0.77–1.03 Fe(III) 6 [19]
Cr(III) 6
Zinc/bromine H? 1.85 Zn2? 7.54 [58]
Zinc/cerium H? 2.2 Ce(III) ion in methanesulfonic acid 0.27–0.72 [117]
Bromine/polysulphide Na? 1.54 Br- 12 [22]
Br3- 5
S22- 6
S42- 5
Fe(III)/Fe(II)
triethanolamine/bromine
Na? 1.0 N/A 1.63 [64]
Non-aqueous vanadium
acetylacetonate
BF4- 2.2 V(acac)3 1.8–2.9 [66]
J Appl Electrochem
123
Page 17
electrodes are porous, the above equation can be extended
using various methodologies such as Brinkman [108, 115,
119], or even replaced by Darcy’s law [108]
v ¼ � k
lrp ð33Þ
Flowing electrolyte through porous electrodes presents a
number of challenges, both at the single-cell and full-stack
level. At the pore scale within each electrode there will be
significant differences in the interstitial flowrate in each pore
owing to size differences, with flow largely confined to the
largest pores in the medium. Such pore-scale-channeling
behavior provides convective mass transport at a limited
number of surfaces, while dead zones of relatively stagnant
flow and localized limiting currents would exist elsewhere
throughout the electrode. Fibrous materials are the favored
porous-electrode substrate for several reasons because high
porosity can be achieved while still maintaining electrical
conductivity and percolation in the solid phase due the
bridging between long fibers. As discussed above, high
porosity is advantageous since (a) there is a strong positive
correlation between porosity and permeability [113],
thereby resulting in reduced pressure drop and associated
pumping costs; and (b) the effective ionic conductivity of the
electrolyte is directly proportional to porosity [120] and
inversely proportional to tortuosity which tends to increase
with decreasing porosity [113].
Due to the wide spread use of fibrous electrodes for
various applications, a number of studies have looked at
mass transfer in carbon-fiber electrodes [66, 121–124].
Schmal et al. [66] compared mass transfer at single fibers
to fiber assemblies (bundles and felts) and found that per
unit length of fiber the mass transfer to a single fiber was
significantly higher. This was attributed to channeling
within the fiber assemblies causing dead-zones or stagnant
regions, effectively reducing the active area for reaction.
A porous material with very uniform pore-size distribution
would help alleviate this problem, but such materials may
be impractical. Saleh [125] studied the effectiveness factor
in packed bed electrodes and found that ohmic resistance,
which is a combination of fluid properties and bed geom-
etry, also played a key role in determining the extent to
which the porous electrode was utilized.
Another cell-scale issue arising from the convective flow
in porous electrodes is large scale heterogeneities due to
assembly tolerances or uneven thermal expansion, which
could lead to bypassing of large sections of a cell. Moreover,
flow through porous electrodes presents major manifolding
issues at the stack-scale since each cell must have nearly
identical permeability. This would be difficult to achieve
since stacks may be compressed significantly when assem-
bled. This situation is analogous to interdigitated flow fields
proposed for low-temperature fuel cells, which showed very
promising performance results in single-cell tests, but the
inevitable differences in permeability from cell to cell in a
stack created uneven flow distribution among cells [126].
To enhance flow and electrolyte utilization during deep
discharge where high flow rates are required, physical
barriers or roughened electrode materials can be used
inside the cell to promote turbulence and mass transport.
Lessner et al. designed a flow-through porous electrode for
bromine/polysulphide RFBs [24]. To ensure uniform flow
distribution and prevent channeling, quartz particles (with
diameter of 0.5 to 1.0 mm) were placed 0.5 cm above the
inlet. Based on the results, the relationship between
dimensionless mass transfer rate (Sherwood number, Sh)
and Reynolds number Re for their geometry was obtained
Sh ¼ 14:29Re0:348 ð34Þ
This functional dependence on Re is in excellent agreement
with Sioda’s [127] and Cano and Bohm’s [128] findings.
Leung et al. also investigated the effect of the mean linear
flow velocity of the electrolyte on the cell performance both
under constant current charge and discharge [70]. Figure 8
presents the effect of the mean linear flow velocity on the
discharge voltage with different constant discharge current
densities. It is shown that there is a maximum cell voltage at
the mean linear flow velocity of 3.9 cm/s.
4.1.1 Reactant concentration effects
The issue of reactant solubility in the flowing electrolyte
solution can be important. The energy density of a RFB
system is set by the concentration of dissolved species, but
the maximum concentration in any stream is limited by the
Fig. 8 Effect of the mean linear flow velocity of the electrolyte on
the cell voltage of the Zn/Ce RFB. Adapted from Ref. [70] with
permission
J Appl Electrochem
123
Page 18
solubility of the least soluble species. Precipitation of
reactants or products in the porous electrode is calamitous.
Concentration limits on the electroactive species not only
reduces the energy density of a system, but also negatively
impacts the power density and cell efficiency as well.
Lower concentrations mean reduced mass-transfer rates
and current density, thus increasing concentration polari-
zation and/or pumping power. Solubility is a function of
temperature as well, which must be factored into cell
design. For instance, it is observed that V2O5 precipitation
occurs at elevated temperature, limiting the operating
temperature to the range of 10 to 40 �C [37, 129]. Li et al.
improved this situation with the development of a vana-
dium sulfate and chloride mixed electrolyte, enabling a
vanadium concentration up to 2.5 M over a temperature
range of -5 to 50 �C [46]. However, temperature excur-
sions in an operating cell could cause a precipitation event
and lead to cell failure [18].
Other issues regarding concentrations include the fact
that for many systems increasing the concentration of the
reactants can lead to more complexing and lower diffu-
sivities and perhaps even more viscous solutions. For
example, recent data measured at LBNL show that Br2
diffusivity decreases by a factor of two as the concentration
of HBr is increased from 1 to 7 M [130]. Such tradeoffs
require optimization for the specific system. Another
ubiquitous issue present in flowing reactors of all types
concerns the extent of reactant conversion, sometimes
referred to as utilization or stoichiometry. The difficulty is
determining the optimum reactant concentration at the
outlet of the electrode. It is desirable or necessary that the
electrode near the outlet is not starved of reactant to pre-
vent parasitic reactions such as gas evolution or electrode
corrosion. On the other hand, fully consuming or utilizing
the reactants means recovery of the maximum amount of
energy stored in the solution. For many systems, the stoi-
chiometry is high for single-cell studies (typically over 10)
[59], and it is not clear as to how this can be translated into
actual systems where such performance would necessitate
multiple passes through the electrodes. One such approach
would be to have a cascade of reactors that are tailored to
specific operating points and concentrations [131].
4.1.2 Shunt currents
One of the challenges of stack design that must be given
particular attention in RFB configurations is protection
against shunt currents. Generally speaking, a shunt current
refers to a condition in which current deviates from the
intended path, via a parallel path with a sufficiently low
resistance to divert a portion of the current. In general, the
path of least resistance in a cell or stack is designed to
follow the direction of intended current flow. In a flow
battery configuration in which cells are configured in ser-
ies, it is intended for all of the current to flow in the
electrolytic phase via ionic conduction from one negative
electrode to the adjacent positive electrode, and in the
current collector from one adjacent bipolar plate to another.
In a well-designed stack, there should be no current flow
except directly from one cell to another in the preferred
series configuration.
In practice, however, there is no perfectly insulator, and
current can flow from one cell to another in such a way that
significant power is lost and stack output voltage is low-
ered. It is possible for stray electronic paths to allow
redistribution of current from one cell of a multicell stack
to another, and strict requirements on the resistance of
stack externals such as manifolds and packaging help to
minimize shunt currents via electrical conduction [132].
The same general rules and restrictions that guide con-
ventional battery and stack design and isolation can prevent
shunt currents via electrically conducting pathways.
Of particular concern in flow batteries is the develop-
ment of shunt currents via the liquid electrolyte. While
shunt currents can develop in the liquid phase in conven-
tional fuel-cell and battery designs [133, 134], the restric-
tion of the primary electrolyte to the region between each
pair of current collectors minimizes most obvious paths for
current flow, at least in the electrolytic phase. While fuel
cells do distribute fluids from one cell to another via the
fuel manifolds, the effective conductivities of liquid-feed
fuels and of most coolants are much lower than the con-
ductivities of RFB electrolytes [18].
Because RFBs involve the circulation of electrolyte to
each of the individual cells, there is an obvious ionic cur-
rent path from one cell to another. The currents that flow in
the circulating electrolyte from one cell to another via the
electrolyte flow manifolds are best managed by increas-
ing the effective resistance of the flow path, either by
increasing the effective path length between cell flow
inputs and outputs in the manifold, or by reducing the
cross-sectional area of the ports. Unfortunately, increasing
the resistance in such a way to minimize shunt currents also
works to increase the resistance to flow. This has the result
of increasing the requirements for parasitic power to cir-
culate the electrolyte through the system; this complicates
system design and increases both capital and operating
costs. Several researchers have investigated the design
implications for flow batteries for particular systems,
though optimization will be required for specific electrolyte
and cell configurations [135–137].
4.2 Separators
There are two main types of RFB separators. The first is
a microporous separator that can allow for exchange of
J Appl Electrochem
123
Page 19
liquids between the anolyte and catholyte compartments.
Such an approach is akin to the discussion above con-
cerning a porous region. Because of this ability to mix,
microporous separators often lead to higher rates of reac-
tant and product crossover, and thus lower coulombic
efficiencies. For this and other reasons, most RFBs use an
ionically conducting membrane as a separator.
The IEM is one of the most critical components in
RFBs. In terms of transport, the dual and opposing needs to
enhance the desired charge transport while limiting unde-
sired crossover of reactant, product, and other species is an
unresolved engineering issue. There are a number of IEMs
which have been used in RFBs, with the most common one
being Nafion�, a perfluorosulfonic acid membrane that
binds cations to its sulfonic acid sites [138]. Nafion� is the
membrane of choice in many RFBs due to its high proton
and sodium conductivities and its proven stability in the
chlor-alkali industry. It has a conduction mechanism that
includes both hopping and vehicular modalities.
Since most IEMs are single ion conductors (see
Table 3), transport within them can often be described
using Ohm’s law (Eq. 27). If there are other interactions
such as electroosmotic flow, this description can be mod-
ified; for example, for proton conduction in Nafion� the
following expression can be used [139, 140]
i2 ¼ �jrU2 �jnFrl0 ð35Þ
N0 ¼ �jnFrU2 � aþ jn2
F2
� �rl0 ð36Þ
where n is the electroosmotic coefficient, j is the ionic
conductivity, l0 is the chemical potential of the solvent,
and a is the transport coefficient of the solvent through the
membrane. If there are other ions in the solution that
penetrate the membrane, it is easiest to describe this motion
using a Poisson–Nernst–Planck (PNP) framework where
the Nernst–Planck equations are used (Eq. 28) along with
Poisson’s equation,
r2U2 ¼ �qe0
ð37Þ
where e0 is the permittivity and q is the charge density.
This methodology accounts for non electroneutrality
conditions that exist due to the small charged pathways
inside the membrane for conduction. In the above PNP
treatment, dilute-solution theory is used and if interactions
between species and non-dilute behavior is expected, one
can use concentrated-solution theory, which complicates
the expressions, requires more knowledge of the transport
properties, and is beyond the scope of this paper (for an
example, see Delacourt and coworkers [141, 142]). In terms
of reactant and product crossover, the easiest way is to
use a permeation coefficient, w, which is a combination
of Henry’s law and a transport coefficient such as a
permeability,
Ni ¼ wirci ð38Þ
Membrane design should consider the following
properties: ion conductivity, ion selectivity, permeability,
chemical stability, and mechanical properties. A detailed
summary of the recent progress of IEM for VRBs can be
found in the review by Li et al. [6] and we use the VRB as
the example for discussing IEMs and transport; Table 4
shows some IEMs used for the VRB example case.
Skyllas-Kazacos et al. used the Amberlite CG 400
composite membrane in the VRBs. The membranes
showed a good stability of more than 4000 h [43, 44].
Zhang et al. found that the current efficiency of 94 and 91%
are achieved for Nafion� 115 and 112 membranes used in
VRBs, respectively [5]. However, the Nafion� membranes
suffer from heavy active ion crossover and low ion selec-
tivity. By incorporation of inorganic species (such as SiO2,
TiO2, and ZrP) into Nafion�, the crossover of vanadium
ions can be effectively reduced [143, 144, 152]. The ion
selectivity can be enhanced using the organic/Nafion�
hybrid membranes fabricated with interfacial polymeriza-
tion and directly blending methods. Xi et al. prepared
Nafion�/SiO2 hybrid membranes using in situ sol–gel
method, and showed that the vanadium crossover was
effectively reduced due to the polar clusters of the original
Nafion� [144]. The maximum energy efficiency of the
VRB using this membrane was nearly 80% at 20 mA/cm2.
Luo et al. modified Nafion� 117 membrane using interfa-
cial polymerization method for VRB application [153].
Sulfonated poly(tetramethydiphenyl ether ether ketone)
(SPEEK) membrane showed one order of magnitude of
vanadium ion permeability lower than that of Nafion� 115
[145]. In the multiple-cycle tests, the SPEEK40 membrane
shows high stability and high columbic efficiency above
98%. Generally, IEMs prepared with interfacial grafting,
blend, radiation, non-fluorinated and hybrid membranes
show lower ion permeability than that of Nafion� mem-
brane. However, when Vn? crossover is blocked, the
protonic conductivity is also decreased which results in
relatively low conductivity. So it is still a critical challenge
for IEM development that ion selectivity is enhanced
with high ionic conductivity. Vafiadis and Skyllas-Kazacos
assessed a range of IEMs in vanadium/bromine RFBs
considering ion-exchange capacity, conductivity, vanadium
ion diffusion, water content, and chemical stability [51].
In addition to ion transfer, electroosmotic flow can cause
transfer of water from one half cell to the other one during
the charge–discharge cycles. The direction and magnitude
of the transport is affected by the membrane used.
Mohammadi et al. studied the water transfer behavior of
anion- and cation-exchange membranes in the VRB [43].
J Appl Electrochem
123
Page 20
As shown in Fig. 9, a significant amount of water is
transferred from the negative-half-cell electrolyte to the
positive half cell in a VRB using a cation-exchange
membrane such as Nafion�. This movement is attributed to
the hydration shells of V2? and V3? ions which carry a
large amount of water and can easily permeate through
cation-exchange membranes. For anion-exchange mem-
branes, the permeation of V2? and V3? co-ions are
restricted. However, there is a net water transfer from the
positive half cell to the negative half cell because of the
neutral VOSO4 and negative VO2SO4- in the positive half
cell that can readily permeate through the membrane [44].
5 Cell modeling and design
The above two section describe transport and kinetics.
These descriptions can be combined in overall mass
conservation equations of the individual species to track
where and how they move through the system [118]
oð1� eÞci
ot¼ �r � Ni �
Xh
a1;2si;k;hih;1�2
nhF
þX
l
si;2;l
Xp 6¼1
a2;prl;p þX
g
si;2;gð1� eÞRg
ð39Þ
The term on the left side of the equation is the accumu-
lation term, which accounts for the change in the total
amount of species i held in phase k within a differential
control volume. The first term on the right side of the
equation keeps track of the material that enters or leaves
the control volume by mass transport. The remaining three
terms account for material that is gained or lost due to
chemical reactions. The first summation includes all elec-
tron-transfer reactions that occur at the interface between
phase k and the electronically conducting phase (denoted as
Table 4 Summary and comparison of ion-exchange membranes used in all-vanadium RFB (VRB)
Membrane Approach Thickness
(lm)
IEC
(mmol/g)
Permeability (ppm) Ionic
conductivity
(mS/cm)
Liquid
uptake
(wt%)
Reference
V3? VO2? VO2?
Nafion�/SiO2 Hybrid 204 0.96 \134 \82 \17.8 56.2 21.5 [143]
Modified Nafion� 117 Interfacial polymerization 201 0.88 – 34.6 – 15 – [144]
SPEEK Blend 88 1.76 – 12.4 – 7.5 28.6 [145]
PVDF-g-PSSA-
co-PMAc
Radiation grafting 70 1.95 11.2 0.73 1.1 100 22 [146]
AIEM Two-step radiation-induced
grafting
42 0.97 – 22 – 31 25.4 [147]
SPFEK Non-fluorinated – 1.92 – \125 – 34.8 20.5 [148]
SFPEK Non-fluorinated 151 1.59 – 94 – 2.2 36 [149]
SPTK Non-fluorinated – 1.29 – 12 – 10.5 11.9 [150]
SPTKK Non-fluorinated – 1.91 – 31 – 13.6 19.3 [150]
Nafion� 117 PFSA 178 0.94 \600 \550 \120 58.7 26.0 [151]
Nafion� 115 PFSA 127 0.91 – 79.5 – 13.4 26 [145]
IEC ion exchange capacity
Fig. 9 Various fluxes across
cation exchange membrane
(a) and anion exchange
membrane (b) for the vanadium
electrolyte solutions [44]
J Appl Electrochem
123
Page 21
phase 1). The second summation accounts for all other
interfacial reactions that do not include electron transfer,
and the final term accounts for homogeneous reactions in
phase k. In the above expression, e is the porosity of the
domain, si,k,l is the stoichiometric coefficient of species i in
phase k participating in heterogeneous reaction l, rl,p is the
rate of the heterogeneous reaction l per unit of interfacial
area with phase p. Rg is the rate of a strictly homogenous
reaction g per unit volume.
The key component in a RFB is the porous electrode
where the reactions occur. The fundamentals behind porous
electrodes are well established by the work of Newman and
coworkers [114, 154]. A porous electrode can be visualized
as a resistor network as shown in Fig. 10.
In Fig. 10, the total current density, i, flows through
the electrolyte phase (2) and the solid phase (1) at each
respective end. In between, the current is apportioned
based on the resistances in each phase and the charge-
transfer resistances. The charge-transfer resistances can be
nonlinear because they are based on kinetic expressions.
Thus, the reaction will proceed depending on what is
limiting. Since kinetics are typically facile in RFB systems,
the main issues are reactant and ion movement to and away
from the reaction site. For example, if the mass-transfer of
a reactant is limiting, then the reaction will proceed near
the inlet, whereas if ion conduction is limiting, then it will
occur near the separator; a uniform reaction rate is rarely
achieved without some kind of mass-transfer control
(e.g., a microporous layer limiting flow of a reactant). An
interesting issue is that one cannot diagnose what is
limiting purely from a polarization curve, since even
mass-transfer limitations can appear to be ohmic ones. For
example, due to reactant mass-transfer limitations, a reac-
tion may proceed at the electrode surface near the flow
inlet yet the performance will look as if it is ohmically
limited due to the distance the ions have to travel from the
separator to the reaction site. Because of this and other
reasons, mathematical modeling is often used to understand
the limiting phenomena and processes in a RFB; yet,
relative to the experimental and demonstration system
development, analytical and computational modeling of
RFBs has trailed, which may be due to the era in which
they were heavily researched. Advanced modeling is
needed to understand fully the various physiochemical
phenomena involved to help minimize transport losses and
facilitate optimized material design and architectures. The
models help lead to optimized porous-electrode structures,
which are crucial in increasing RFB performance and
hence reducing cost. These issues are explored in more
detail in this section.
5.1 Electrode structure
RFB can have two basic electrode configurations: flow
through a porous 3D electrode or flow past a planar elec-
trode. These are shown schematically in Fig. 11a, b
respectively. Naturally, these two configurations are often
referred to as ‘flow-through’ and ‘flow-by’ electrodes, but
this terminology is somewhat confusing since these two
terms are also occasionally used to describe flow parallel
and perpendicular to the direction of the current flow [155].
The following discussion will adopt the intuitive use of
‘flow-through’ a porous electrode and ‘flow-by’ a planar
electrode.
Whether a flow-through or a flow-by electrode can or
must be used depends on a number of factors including
the physical state of the flowing reactant (i.e. gas or liquid),
the electrode reaction occurring (e.g. plating of solid or
electron transfer in solution) and the conductivity of the
electrolyte phase. For instance, in the prototypical or con-
ventional RFB [57, 58] the reactants and products on both
the anode and cathode are dissolved ions, and a porous 3D
flow-through electrode, as shown in Fig. 11a, is typically
used on both sides. In this configuration the liquid elec-
trolyte flows through a porous matrix of electrochemically
active solids, usually carbon fibers with appropriate cata-
lytic surface properties. The ions produced by the reaction
migrate through the electrolyte phase toward the opposing
electrode and the electrons move through the network of
carbon fibers to the current collector. The flow-through
electrode is well suited to reactions of flowing liquid-phase
species for a number of reasons. First, the diffusivity of
liquid-phase species is quite low so forced convection
through a porous electrode provides enhanced mass-transfer
rates. Second, the concentration of reactive ions is generally
low due to solubility limits so forced mass transfer helps
maintain higher current densities. Finally, the flowing
electrolyte will generally have a high ionic conductivity,
…ii =2
ii =1…
1,1R 3,1R 1,1 −nR nR ,12,1R
0,ctR 1,ctR 2,ctR 3,ctR 1, −nctR nctR ,
…ii =2
ii =1…
1,1R 3,1R 1,1 −nR nR ,12,1R
0,ctR 1,ctR 2,ctR 3,ctR 1, −nctR nctR ,
Fig. 10 Steady-state resistor-
network representation of
porous-electrode theory
J Appl Electrochem
123
Page 22
which is necessary to avoid ohmic polarization losses
over the long transport lengths created by the 3D
configuration.
The planar electrode is most commonly used when a
gaseous reactant is involved. A common example is the
hydrogen/bromine cell [71] which uses a liquid mixture of
bromine and aqueous hydrobromic acid on the cathode
with a flow-through electrode (Fig. 11a) and gaseous
hydrogen on the anode, with a flow-by electrode as shown
in Fig. 11b. In this configuration a gaseous species flows in
a channel parallel to the electrode and diffuses laterally to
the essentially planar electrode surface. (In reality the
electrode surface is a 3D porous zone of catalyst particles
and immobilized electrolyte phase, but it behaves essen-
tially as a planar surface on the scale of the electrode
assembly.) The porous region of inert solid between the
flow channel and the reactive surface acts to distribute gas
uniformly to the catalyst and conduct electrons from the
electrode to the current collector. The flow-by electrode is
well suited to gaseous reactants for two reasons. First, the
gaseous reactant stream does not conduct protons, so the
reaction must happen at or near the electrolyte phase.
Second, the diffusivity of gaseous species are 3 to 4 orders
of magnitude higher than liquid-phase species so diffusive
mass transfer is able to supply reactants to the electrode at
a sufficient rate. Another variant of the flow-by electrode is
shown in Fig. 11c, which is used when a solid is electro-
chemically plated out or dissolved as in the hybrid RFBs.
Because the electrode grows during plating, it is not fea-
sible to use a porous electrode as it would become plugged
by the plating solid. The so-called single-flow cell reported
by Pletcher, Wills and co-workers [2, 71] uses a solid
electrode on both the anode and cathode where Pb and PbO
are stored as plated solids. Ion conduction through the
flowing electrolyte phase to the opposing electrode is at a
maximum distance in this configuration so ohmic losses are
high. Also, the surface area for reaction is at a minimum
and equal to the geometric area of the cell. Consequently,
this type of flow-by electrode is only used when absolutely
necessary, as is the case of the aforementioned solid-plat-
ing electrodes.
The use of planar flow-by electrodes with liquid-phase
reactants to demonstrate the viability of RFB technology
is not uncommon in research papers on the subject
[25, 63, 101], but flow-by electrodes, due to their limited
surface area and long ion-transport distances, would
almost never be preferred over 3D electrodes occupying
the same volume. Even in the original RFB patent by
Thaller [42], the possibility of using porous, 3D electrodes
was included. Many of the tradeoffs of the various geo-
metric placements and concerns can be found in the lit-
erature, including the pioneering work of Trainham and
Newman [156–158] who examined optimum electrode
placement and the tradeoffs between the two transport
resistances in Fig. 10.
5.2 Cell modeling of certain chemistries
5.2.1 Iron/chrome
Fedkiw and Watts developed a mathematical isothermal
model to describe the operation of a single anode-
Fig. 11 Schematic diagrams
of a flow through electrode,
b flow-by electrode with active
surface near the current
collector (left) and near the
membrane separator (right), and
c flow-by electrode used in
solid-plating cells. Solid arrowsindicate convective flow of
reactants and dashed arrowsrepresent diffusive paths
J Appl Electrochem
123
Page 23
separator-cathode Fe/Cr cell based on electrode theory,
redox kinetics, mass transfer, and ohmic effects. The par-
asitic hydrogen reaction was also considered [159]. It is
found that the separator ohmic resistance is the dominant
cell resistance followed by the electrolyte ohmic resistance.
The kinetic resistance was determined to be negligible at
reasonable flow rates. It was predicted that countercurrent
electrolyte flow improves global cell performance due to a
more uniform current distribution. Decreasing the electrode
area tended to decrease the cell current but resulted in high
velocity and enhanced mass transfer within the penetration
thickness and increased current. This model also provided a
method of determined a charge–discharge protocol that
obtained the maximum chromium conversion and mini-
mum hydrogen evolution at the same time [159, 160].
Finally, Codina et al. [135] examined the issue of shunt
currents when a cell is scaled up to larger sizes and stacks.
5.2.2 All vanadium (VRB)
Not surprisingly, the VRB is the most often modeled RFB,
especially recently [161–167]. Shah et al. developed a two-
dimensional transient model validated against the experi-
mental diurnal data to study the effects of variation on
concentration, electrolyte flowrate, and electrode porosity
[168]. They also studied the effects of H2 and O2 evolution
on the performance of VRBs by dynamic modeling [162,
164, 165]. As shown in Fig. 12, numerical simulation
demonstrates good agreement with the experimental data
[162].
Evolved H2 and O2 in the form of bubbles on the neg-
ative and positive electrodes, respectively, impact perfor-
mance through partial occlusion of the electrolyte flow,
reduction in the active surface area for reaction, and
reduced mass- and charge-transport coefficients. You et al.
built a two-dimensional stationary model to describe a
single VRB flow cell [167]. They found the decrease in the
mass transfer coefficient almost has no effect on the dis-
tribution of V3? concentration and overpotential, as shown
in Fig. 13. Li and Hikihara developed a model considering
the transient behavior in a VRB and the model was also
examined based on the tests of a micro-RFB [169]. They
found that the chemical reaction rate is restricted by the
attached external electric circuit and the concentration
change of vanadium ions depends on the chemical reac-
tions and electrolyte flow.
5.2.3 Bromine/polysuphide
Scamman et al. developed a numerical model that can be
used for the design and optimization of large-scale bro-
mine/polysulphide RFBs [170, 171]. They used the Butler–
Volmer equation to estimate overpotential losses. The
crossover of active species and self-discharge was also
considered. This model is able to predict the concentration
Fig. 12 A comparison between simulated and experimentally
obtained cell potential difference. Adapted from Ref. [162] with
permission
Fig. 13 Profiles of V3?
concentration (a), and over-
potential (b) inside in the
negative electrode at 50% SOC
with the applied current density
of 40 mA/cm2. Adapted from
Ref. [167] with permission
J Appl Electrochem
123
Page 24
and current variation along the electrode and determine
various efficiencies, energy density, and power density in
the charge–discharge processes. It is found that the elec-
trochemical rate constants of the bromide and sulphide are
4 9 10-5 and 3 9 10-6 cm/s, respectively.
5.2.4 Zinc/bromine
Several models of Zn/Br2 have been developed to under-
stand the physical phenomena and to determine how cell
performance can be improved. These models have been
used to investigate the species transport, secondary elec-
trode reactions, and chemical reactions in the bulk elec-
trolyte, including issues during the plating of zinc [172].
Putt [173] and Lee and Selman [174] developed thin dif-
fusion-layer models. These models include electrolyte
convection with Butler–Volmer kinetics. Mader and White
[61] developed a mathematical model for the cell mainly to
predict performance of the cell as a function of architecture
and operating conditions. They also used their model to
determine the effects of the mass transfer and electroki-
netics in the porous bromine electrode on the roundtrip
performance of the cell. It was found that the cell efficiency
increases with the porous electrode thickness. Jorne and
coworkers [175, 176] also developed models for the chlo-
rine electrode in a Zn/Cl2 cell. This electrode is very
similar to the bromine one and they showed that the flow
from the gap to the zinc electrode can impact the current
density and reaction-rate distribution significantly, as well
as the placement of the electrode as shown in Fig. 14.
5.2.5 Zinc/cerium
Trinidad et al. developed an oxidation–reduction-redox-
potential model to monitor the Ce(III)/Ce(IV) couple [177]
Ee ¼ E0e �
RT
zFkt þ ln
CRedð Þ0COxdð Þ0
þ ð1� expð�ktÞÞ� ��
ð40Þ
The redox potential versus time experimental and model
predictions were compared as shown in Fig. 15. The model
fit well with the experimental results, showing the model is
useful to predict concentration versus time in a simple
redox system.
6 Summary and future research needs
In this review, we have examined some of the more
common RFBs and their individual components and
underlying governing physical phenomena. At the present
time, there is no ‘‘best’’ RFB chemistry; development
continues through industrial and academic research sup-
ported by government and industry. It is clear that indus-
trial development of prototypes and working systems has
outpaced the fundamental research at this point. Inevitably,
for the science to progress and the underlying fundamental
problems to be resolved, much more fundamental under-
standing is required. In terms of transport from a generic,
chemistry-agnostic perspective, much more in-depth and
fundamental study and characterization of the following
Fig. 14 Reaction-rate profiles
for a Cl2 discharging elect rode
in a Zn/Cl2 RFB at a different
flow velocities and b electrode
placement. Adapted from Ref.
[176] with permission
J Appl Electrochem
123
Page 25
are needed through combined experimental and analytical
or computational modeling:
• Charge transport and electrochemical reaction at and
near the electrode surface.
• The complex charge transport and nonidealities in the
various RFB couples and electrolytes used.
• Species charge transport and crossover in ionic-
exchange membranes. For many systems, the mem-
branes represent a key limiting component in system
feasibility. Low-cost, low-permeability membranes
with good ion selectivity, stability, high conductivity,
and suitable mechanical properties are required.
• The fluid mechanics and transport of electrolyte
through the various electrode and cell architectures
including coupled reaction rates and flow distribution to
determine optimal electrode structures and properties.
To enable more complete studies in these areas, a new
class of RFB diagnostics will also be needed. Another topic
requiring future study as the systems with the greatest
potential become defined is performance degradation. As in
other, more studied, electrochemical-power-conversion
systems, many modes of material degradation will likely be
associated with transport processes that can be better
optimized to promote longevity.
Finally, throughout this review not much mention has
been made concerning other components within the RFB
system. In particular, the typical solvents and chemistries
are inherently highly corrosive due to their high ionic and
perhaps protonic concentrations. Their nature makes seal-
ing and material selection for pumps, flowfields, pipes, etc.
very difficult and expensive; finding solutions to these
issues is necessary for RFB systems to gain entrance to the
market.
Acknowledgments This work was partially funded by the Assistant
Secretary for Energy Efficiency and Renewable Energy, Office of
Fuel Cell Technologies, of the U.S. Department of Energy under
contract number DE-AC02-05CH11231; work at UTK was carried
out under NSF Early Career Development Award #0644811.
Open Access This article is distributed under the terms of the
Creative Commons Attribution Noncommercial License which per-
mits any noncommercial use, distribution, and reproduction in any
medium, provided the original author(s) and source are credited.
References
1. N. R. C. Committee for the National Academies Summit on
America’s Energy Future (2008) The national academies sum-
mit on America’s energy future: summary of a meeting.
National Academies Press, Washington, DC
2. EPRI (2004) Energy storage technology valuation primer:
techniques for financial modeling. EPRI report 1008810, Palo
Alto, CA, December 2004
3. Price A (2005) Proc Inst Civil Eng Civil Eng 158:52
4. EPRI (2002) Handbook of energy storage for transmission or
distribution applications. EPRI report 1007189, Palo Alto, CA
5. Ponce De Leon C, Frias-Ferrer A, Gonzalez-Garcia J, Szanto D,
Walsh FC (2006) J Power Sources 160:716
6. Li X, Zhang H, Mai Z, Vankelecom I (2011) Energy Environ Sci
4:1147
7. Skyllas-Kazacos M, Chakrabarti MH, Hajimolana SA, Mjalli
FS, Saleem M (2011) J Electrochem Soc 158:R55
8. Yang ZG, Zhang JL, Kintner-Meyer MCW, Lu XC, Choi DW,
Lemmon JP, Liu J (2011) Chem Rev 111:3577
9. Symons PC, Butler PC (2002) In: Linden D, Reddy TB (eds)
Handbook of batteries, 3rd edn. McGraw-Hill, New York
10. Kaldellis JK, Zafirakis D (2007) Energy 32:2295
11. Makarov YV, Loutan C, Ma J, De Mello P (2009) IEEE Trans
Power Syst 24:1039
12. Department of Energy Office of Electricity Delivery and Energy
Reliability (2011, May) http://www.oe.energy.gov/
13. Department of Energy (2009, May) President Obama Announces
$3.4 billion investment to spur transition to smart grid. http://
www.energy.gov/news2009/8216.html
14. N. Group (2010) Advanced materials and devices for stationary
electrical energy storage applications, Nexight Group. http://
energy.tms.org/docs/pdfs/Advanced_Materials_for_SEES_2010.pdf
15. E. A. Committee (2008) Bottling electricity: storage as a stra-
tegic tool for managing variability and capacity concerns in the
modern grid, Nexight Group. http://www.doe.gov/sites/prod/
files/oeprod/DocumentsandMedia/DRAFT_EAC_Energy_Storage_
Technologies_Report_11-21-08_CLEAN_COPY.pdf
16. Skyllas-Kazacos M, Grossmith F (1987) J Electrochem Soc
134:2950
Fig. 15 a Redox potential
versus time for the reduction of
0.043 M of Ce(IV) in 1 M
H2SO4 for both experimental
(A) and calculated (B) values.
b Redox potential versus time
for the reduction of 0.127 M
Ce(III) in 1 M H2SO4 and
0.046 M of Ce(IV). Adapted
from Ref. [177] with permission
J Appl Electrochem
123
Page 26
17. Remick RJ, Ang PGP (1984) Electrically rechargeable anioni-
cally active reduction-oxidation electrical storage-supply sys-
tem. USA Patent 4485154, November 27, 1984
18. Zhou HT, Zhang HM, Zhao P, Yi BL (2006) Electrochim Acta
51:6304
19. Thaller LH (1974) NASA TM-X-71540
20. Thaller LH (1979) NASA TM-79143, DOE/NASA/1002-79/3
21. Bartolozzi M (1989) J Power Sources 27:219
22. Walsh F (2001) Pure Appl Chem 73:1819
23. Price A, Bartley S, Male S, Cooley G (1999) Power Eng J
13:122
24. Lessner P, Mclarnon F, Winnick J, Cairns E (1992) J Appl
Electrochem 22:927
25. Skyllas-Kazacos M, Rychcik M, Robins RG, Fane AG, Green
MA (1986) J Electrochem Soc 133:1057
26. Skyllas Kazacos M, Rychick M, Robins RG (1988) All-vana-
dium redox battery. United States of America Patent
27. Sum E, Rychcik M, Skyllas-Kazacos M (1985) J Power Sources
16:85
28. Sum E, Skyllas-Kazacos M (1985) J Power Sources 15:179
29. Kazacos M, Cheng M, Skyllas-Kazacos M (1990) J Appl
Electrochem 20:463
30. Skyllas-Kazacos M, Kasherman D, Hong D, Kazacos M (1991)
J Power Sources 35:399
31. Rahman F, Skyllas-Kazacos M (1998) J Power Sources 72:105
32. Skyllas-Kazacos M, Peng C, Cheng M (1999) Electrochem
Solid-State Lett 2:121
33. Kausar N, Howe R, Skyllas-Kazacos M (2001) J Appl Elect-
rochem 31:1327
34. Hagg CM, Skyllas-Kazacos M (2002) J Appl Electrochem
32:1063
35. Sukkar T, Skyllas-Kazacos M (2003) J Membr Sci 222:235
36. Sukkar T, Skyllas-Kazacos M (2004) J Appl Electrochem 34:
137
37. Rahman F, Skyllas-Kazacos M (2009) J Power Sources 189:
1212
38. Skyllas Kazacos M, Kazacos G, Poon G, Verseema H (2010) Int
J Energy Res 34:182
39. Vijayakumar M, Burton SD, Huang C, Li L, Yang Z, Graff GL,
Liu J, Hu J, Skyllas-Kazacos M (2010) J Power Sources
195:7709
40. Chen J, Wang Q, Wang B (2006) Modern Chem Ind 9:26
41. Shibata A, Sato K (1999) Power Eng J 13:130
42. Shigematsu T, Kumamoto T, Deguchi H, Hara T (2002)
Applications of a vanadium redox-flow battery to maintain
power quality. Presented at the transmission and distribution
conference and exhibition 2002: Asia Pacific. IEEE/PES
43. Mohammadi T, Chieng S, Skyllas Kazacos M (1997) J Membr
Sci 133:151
44. Mohammadi T, Skyllas-Kazacos M (1997) J Appl Electrochem
27:153
45. Miyake S, Tokuda N (2002) Battery diaphragm. Google Patents
46. Hennessy TDJ (2007) Telecommunication system incorporating
a vanadium redox battery energy storage system. Google Patents
47. Zhao P, Zhang H, Zhou H, Chen J, Gao S, Yi B (2006) J Power
Sources 162:1416
48. Skyllas-Kazacos M (2003) J Power Sources 124:299
49. Skyllas-Kazacos M, Menictas C, Kazacos M (1996) J Electro-
chem Soc 143:L86
50. Skyllas-Kazacos M, Limantari Y (2004) J Appl Electrochem
34:681
51. Vafiadis H, Skyllas-Kazacos M (2006) J Membr Sci 279:394
52. Chang BJ, Garcia CP, Johnson DW, Bents DJ, Scullin VJ,
Jakupca IJ (2007) J Fuel Cell Sci Technol 4:497
53. Grigoriev SA, Millet P, Porembsky VI, Fateev VN (2011) Int J
Hydrogen Energy 36:4164
54. Li XJ, Xiao Y, Shao ZG, Yi BL (2010) J Power Sources 195:
4811
55. Mitlitsky F, Myers B, Weisberg AH (1998) Energy Fuels 12:56
56. Neyerlin KC, Gu WB, Jorne J, Gasteiger HA (2006) J Electro-
chem Soc 153:A1955
57. Kim JT, Jorne J (1977) J Electrochem Soc 124:1473
58. Kosek JA, Laconti AB (1988) J Power Sources 22:293
59. Livshits V, Ulus A, Peled E (2006) Electrochem Commun
8:1358
60. Cathro KJ, Cedzynska K, Constable DC (1987) J Power Sources
19:337
61. Mader MJ, White R (1986) J Electrochem Soc 133:1297
62. Hromadova M, Ronald Fawcett W (2001) J Phys Chem A
105:104
63. Lim HS, Lackner AM, Knechtli RC (1977) J Electrochem Soc
124:1154
64. R. Ltd. (2011) URL: http://www.redflow.com.au/. Accessed
May 2011
65. Jorne J, Kim JT, Kralik D (1979) J Appl Electrochem 9:573
66. Zito R (1973) US Patent 3719526
67. Hruska LW, Savinell RF (1981) J Electrochem Soc 128:18
68. Dougherty, B, Clarke RL, Harrion S, Millington PJ, Mohanta S
(2009) Cerium batteries. U.S. Patent
69. P. Ltd. (2011) http://plurionsystems.com/tech_flow_advantages.html
70. Leung P, De Leon CP, Walsh F (2011) Electrochem Commun
13:770
71. Raju T, Basha CA (2008) Ind Eng Chem Res 47:8947
72. Crompton TR (ed) (2000) Elsevier science and technology
books, vol 14, 3rd edn. Newnes, Boston
73. Fang B, Iwasa S, Wei Y, Arai T, Kumagai M (2002) Electro-
chim Acta 47:3971
74. Matsuda Y, Tanaka K, Okada M, Takasu Y, Morita M,
Matsumura-Inoue T (1988) J Appl Electrochem 18:909
75. Chakrabarti M, Dryfe R, Roberts E (2007) Electrochim Acta
52:2189
76. Yamamura T, Shiokawa Y, Yamana H, Moriyama H (2002)
Electrochim Acta 48:43
77. Liu Q, Sleightholme AES, Shinkle AA, Li Y, Thompson LT
(2009) Electrochem Commun 11:2312
78. Liu Q, Shinkle AA, Li Y, Monroe CW, Thompson LT,
Sleightholme AES (2010) Electrochem Commun 12:1634
79. Sleightholme AES, Shinkle AA, Liu Q, Li Y, Monroe CW,
Thompson LT (2011) J Power Sources 196:5742
80. Shinkle AA, Sleightholme AES, Griffith LD, Thompson LT,
Monroe CW (2011) J Power Sources (in press)
81. Kraytsberg A, Ein-Eli Y (2011) J Power Sources 196:886
82. Chiang Y, Carter WC, Ho B, Duduta M (2009) High energy
density redox flow device. WO Patent WO/2009/151639
83. Duduta M, Ho B, Wood VC, Limthongkul P, Brunini VE, Craig
Carter W, Chiang Y-M (2011) Adv Energy Mater 1
84. Vetter KJ (1967) Electrochemical kinetics: theoretical and
experimental aspects. Academic Press, New York
85. Bard AJ, Faulkner LR (2000) Electrochemical methods: fun-
damentals and applications. Wiley, Hoboken
86. Gerischer H (1960) Z Physik Chem. Neue Forschung 26:223
87. Newton MD, Smalley JF (2007) Phys Chem Chem Phys 9:325
88. Bard AJ (2010) J Am Chem Soc 132:7559
89. Nagy Z, Hung NC, Yonco RM (1991) J Electrochem Soc
138:2032
90. Randles JEB, Somerton KW (1952) Trans Faraday Soc 48:937
91. Gattrell M, Qian J, Stewart C, Graham P, Macdougall B (2005)
Electrochim Acta 51:395
92. Zhong S, Kazacos M, Burford R, Skyllas-Kazacos M (1991)
J Power Sources 36:29
93. Faita G, Fiori G, Mussini T (1978) Electrochim Acta 13:1765
94. Mastragostino M, Gramellini C (1985) Electrochim Acta 30:373
J Appl Electrochem
123
Page 27
95. Haddadi-Asl V, Kazacos M, Skyllas-Kazacos M (1995) J Appl
Electrochem 25:29
96. Han P, Wang H, Liu Z, Chen X, Ma W, Yao J, Zhu Y, Cui G
(2011) Carbon 49:693
97. Hung NC, Nagy Z (1987) J Electrochem Soc 134:2215
98. Kinoshita K (1988) Carbon. Electrochemical and physiochemi-
cal properties. Wiley, New York
99. Rosseinsky DR (1965) Chem Rev 65:467
100. Inoue M, Tsuzuki Y, Iizuka Y, Shimada M (1987) J Electro-
chem Soc 134:756
101. De Leon CP, Reade GW, Whyte I, Male SE, Walsh FC (2007)
Electrochim Acta 52:5815
102. Thaller LH (1976) Electrically rechargeable redox flow cell. US
patent 3996064
103. EISA (2007) Energy independence and security act of 2007, in
PL 110-140, United States of America
104. Shao YY, Wang XQ, Engelhard M, Wang CM, Dai S, Liu J,
Yang ZG, Lin YH (2010) J Power Sources 195:4375
105. Chiang YM, Bazzarella R (2010) Fuel system using redox flow
battery. WO Patent WO/2010/118060
106. Van Brakel J, Heertjes PM (1974) Int J Heat Mass Transf
17:1093
107. Carta R, Palmas S, Polcaro AM, Tola G (1991) J Appl Elect-
rochem 21:793
108. Dullien FaL (1992) Porous media: fluid transport and pore
structure, 2nd edn. Academic Press, Inc., New York
109. Gostick JT, Fowler MW, Pritzker MD, Ioannidis MA, Behra LM
(2006) J Power Sources 162:228
110. Newman J (1995) J Electrochem Soc 142:97
111. Roy A, Hickner MA, Einsla BR, Harrison WL, Mcgrath JE
(2009) J Polym Sci A 47:384
112. Sankir M, Kim YS, Pivovar BS, Mcgrath JE (2007) J Membr Sci
299:8
113. Gostick JT, Ioannidis MA, Fowler MW, Pritzker MD (2010)
In: Wang CY, Pasaogullari U (eds) Modern aspects of electro-
chemistry, vol 49. Springer, Berlin
114. Newman J, Thomas-Alyea KE (2004) Electrochemical systems,
3rd edn. Wiley, New York
115. Bird RB, Stewart WE, Lightfoot EN (2002) Transport phe-
nomena, 2nd edn. Wiley, New York
116. Einstein A (1905) Ann Physik 17:549
117. Nernst W (1888) Zeitschrift fuer Physikalische Chemie 2:613
118. Weber AZ, Newman J (2004) Chem Rev 104:4679
119. Bear J (1988) Dynamics of fluids in porous media. Dover
Publications Inc, New York
120. Chen YWD, Bard AJ (1984) Inorg Chem 23:2175
121. Sun B, Sykllaskazacos M (1992) Electrochim Acta 37:1253
122. Zhao P, Zhang HM, Zhou HT, Yi BL (2005) Electrochim Acta
51:1091
123. Sun B, Skyllaskazacos M (1992) Electrochim Acta 37:2459
124. Joerissen L, Garche J, Fabjan C, Tomazic G (2004) J Power
Sources 127:98
125. Duarte MME, Pilla AS, Sieben JM, Mayer CE (2006) Electro-
chem Commun 8:159
126. Yan A, Xiao X, Kulaots I, Sheldon BW, Hurt RH (2006) Carbon
44:3116
127. Sioda R (1977) Electrochim Acta 22:439
128. Cano J, Bohm U (1977) Chem Eng Sci 32:213
129. Li L, Kim S, Wang W, Vijayakumar M, Nie Z, Chen B, Zhang J,
Xia G, Hu J, Graff G (2011) Adv Energy Mater 1:394
130. Ridgway P, Cho K, Battaglia VS, Weber AZ, Srinivasan V
(2011) Redox kinetics of the bromine-bromide reaction for flow
batteries. Presented at the 220th meeting of the Electrochemical
Society, Boston, MA
131. Horne C, Kinoshita K, Hickey DB (2010) Redox flow battery
system for distributed energy storage. United States Patent
12/498103
132. Schroll CR (1984) Manifold dielectric barrier for a fuel cell
electrical power generation system. United States of America
Patent
133. Katz M (1978) J Electrochem Soc 125:515
134. Zhou G, Chen L, Seaba J (2006) Proceedings of the 4th inter-
national ASME conference on fuel cell science, engineering,
and technology, Pts A and B, p 863
135. Codina G, Aldaz A (1992) J Appl Electrochem 22:668
136. Codina G, Perez JR, Lopezatalaya M, Vazquez JL, Aldaz A
(1994) J Power Sources 48:293
137. Kanari K, Nozaki K, Kaneko H, Hashimoto T, Fujii T (1991)
Denki Kagaku 59:237
138. Mauritz KA, Moore RB (2004) Chem Rev 104:4535
139. Weber AZ, Newman J (2004) J Electrochem Soc 151:A311
140. Pintauro PN, Bennion DN (1984) Ind Eng Chem Fundam 23:230
141. Weber AZ, Delacourt C (2008) Fuel Cells 8:459
142. Delacourt C, Newman J (2008) J Electrochem Soc 155:B1210
143. Xi J, Wu Z, Qiu X, Chen L (2007) J Power Sources 166:531
144. Teng X, Zhao Y, Xi J, Wu Z, Qiu X, Chen L (2009) J Power
Sources 189:1240
145. Jia C, Liu J, Yan C (2010) J Power Sources 195:4380
146. Qiu J, Zhai M, Chen J, Wang Y, Peng J, Xu L, Li J, Wei G
(2009) J Membr Sci 342:215
147. Qiu J, Zhao L, Zhai M, Ni J, Zhou H, Peng J, Li J, Wei G (2008)
J Power Sources 177:617
148. Chen D, Wang S, Xiao M, Meng Y (2010) J Power Sources
195:2089
149. Chen D, Wang S, Xiao M, Meng Y (2010) Energy Convers
Manag 51:2816
150. Chen D, Wang S, Xiao M, Meng Y (2009) Energy Environ Sci
3:622
151. Teng X, Zhao Y, Xi J, Wu Z, Qiu X, Chen L (2009) J Membr
Sci 341:149
152. Sang S, Wu Q, Huang K (2007) J Membr Sci 305:118
153. Luo Q, Zhang H, Chen J, Qian P, Zhai Y (2008) J Membr Sci
311:98
154. Newman J, Tiedemann W (1975) AIChE J 21:25
155. Yue L, Li WS, Sun FQ, Zhao LZ, Xing LD (2010) Carbon
48:3079
156. Trainham JA, Newman J (1977) J Electrochem Soc 124:1528
157. Trainham JA, Newman J (1977) J Appl Electrochem 7:287
158. Trainham JA, Newman J (1978) J Electrochem Soc 125:58
159. Fedkiw PS, Watts RW (1984) J Electrochem Soc 131:701
160. Lopez-Atalaya M, Codina G, Perez J, Vazquez J, Aldaz A
(1992) J Power Sources 39:147
161. Al-Fetlawi H, Shah AA, Walsh FC (2009) Electrochim Acta
55:78
162. Al-Fetlawi H, Shah AA, Walsh FC (2010) Electrochim Acta
55:3192
163. Knehr K, Kumbur E (2011) Electrochem Commun 13:342
164. Shah A, Al-Fetlawi H, Walsh F (2010) Electrochim Acta 55:1125
165. Shah A, Tangirala R, Singh R, Wills RGA, Walsh FC (2011)
J Electrochem Soc 158:A671
166. Vynnycky M (2011) Energy 36:2242
167. You D, Zhang H, Chen J (2009) Electrochim Acta 54:6827
168. Shah A, Watt-Smith M, Walsh F (2008) Electrochim Acta
53:8087
169. Li M, Hikihara T (2008) IEICE Trans Fundam Electron Com-
mun Comput Sci E91A:1741
170. Scamman DP, Reade GW, Roberts EPL (2009) J Power Sources
189:1220
J Appl Electrochem
123
Page 28
171. Scamman DP, Reade GW, Roberts EPL (2009) J Power Sources
189:1231
172. Evans TI, White RE (1987) J Electrochem Soc 134:2725
173. Putt R (1979) Assessment of technical and economic feasibility
of zinc/bromine batteries for utility load-levelling. EPRI report
Em-1059, Project 635-1, Palo Alto, CA, Appendix M
174. Lee J, Selman J (1982) J Electrochem Soc 129:1670
175. Jorne J (1982) J Electrochem Soc 129:2251
176. Roayaie E, Jorne J (1985) J Electrochem Soc 132:1273
177. Trinidad P, De Leon CP, Walsh F (2008) J Environ Manag
88:1417
J Appl Electrochem
123