+ All Categories
Home > Documents > Redox Regulation Mechanisms in Inflammatory Macrophages

Redox Regulation Mechanisms in Inflammatory Macrophages

Date post: 09-Jan-2022
Category:
Upload: others
View: 3 times
Download: 0 times
Share this document with a friend
291
Redox Regulation Mechanisms in Inflammatory Macrophages Marina Diotallevi October 2017 A thesis submitted in partial fulfilment of the requirements of the University of Brighton and the University of Sussex for a programme of study undertaken at the Brighton and Sussex Medical School for the degree of Doctor of Philosophy
Transcript

Redox Regulation Mechanisms in

Inflammatory Macrophages

Marina Diotallevi

October 2017

A thesis submitted in partial fulfilment of the requirements of the University of

Brighton and the University of Sussex for a programme of study undertaken at

the Brighton and Sussex Medical School for the degree of Doctor of Philosophy

2

Abstract

Long-lasting activation of inflammation leads to chronic conditions and is particularly

common in autoimmune diseases. The causes of this self-activation in those

conditions are still unknown, but these diseases are often also associated with an

increase in oxidative stress. In fact, reactive oxygen species (ROS) are released

during the inflammatory response and can cause oxidative damage, which in turn can

lead to maintenance of inflammation. However, ROS are not only toxic species but

can also act as signalling molecules to regulate immune responses, for instance via

thiol modification. Thiols present in the cysteine residues of protein are among the

most sensitive targets of ROS. They can undergo many redox changes, including

glutathionylation or disulphide-linked dimerisation, all of which alter the protein and

thus its function, localisation and secretion. This “redox regulation” regulates many

cellular processes such as apoptosis, cell development and differentiation,

homoeostasis and the immune response.

In this project, we hypothesise that changes in thiol oxidation affect the inflammatory

response and two different approaches have been set up to track redox changes in

inflammatory conditions.

Firstly, the role of endogenous glutathione (GSH), the main thiol antioxidant, was

investigated. For this purpose, we used RAW cells, a mouse macrophage cell line.

Cells were depleted of endogenous GSH and then stimulated with a standard

inflammatory stimulus, bacterial lipopolysaccharide (LPS). A microarray analysis was

then performed to identify changes in the gene expression profile. Results indicated

that endogenous GSH does not decrease the inflammatory response but, on the

contrary, favours the host antiviral response as its depletion results in an impaired

LPS-induced increase in gene expression of genes in the interferon pathway,

including oas2, mx2 and irf9. The biological significance of these results was later

confirmed in cells infected with influenza A, showing that the antiviral response elicited

by LPS was inhibited by GSH depletion.

The second approach of this work was the use of a pegylated maleimide (MalPEG –

10kDa) to determine the redox state of three “redoxkines”, protein thiol/disulphide

oxidoreductases with inflammatory properties: Trx, Prx1 and Prx2. MalPEG covalently

binds to free thiols causing a mobility shift that can be detected by Western blot,

leading to differences in the migration of oxidised and reduced proteins. After LPS

stimulation, clear changes in the redox state were detected both intracellularly and in

secreted proteins. To identify potential membrane targets of redoxkines, we set up a

3

technique to identify proteins with redox-sensitive exofacial thiols on the cell surface.

The results of this work show that activation of inflammatory pathway in macrophages

brings about a number of redox changes in protein thiols, some of which may be

related to GSH signalling, which are important in the regulation of both inflammation

and host defence.

4

Contents

Abstract .................................................................................................................. 2

Contents ................................................................................................................. 4

List of Figures ........................................................................................................ 7

List of Tables ........................................................................................................11

Abbreviations ........................................................................................................12

Acknowledgments ................................................................................................16

Declaration ............................................................................................................17

Chapter 1 - Introduction .......................................................................................18

1.1 Mechanism of inflammation ......................................................................19

1.1.1 Immune system .................................................................................19

1.1.2 Inflammatory response ......................................................................23

1.1.3 Chronic inflammatory diseases ..........................................................34

1.2 Oxidative stress and inflammation ............................................................36

1.2.1 Source of Reactive Oxygen Species ..................................................36

1.2.2 Oxidative damage ..............................................................................40

1.2.3 Antioxidants .......................................................................................41

1.2.4 ROS in the inflammatory context .......................................................44

1.3 Redox regulation in inflammation ..............................................................47

1.3.1 Redox signalling by ROS ...................................................................47

1.3.2 Thiol oxidation ...................................................................................50

1.3.3 Evidence of thiol oxidation modification in inflammation .....................54

1.3.4 Thiol oxidoreductases ........................................................................55

1.3.5 Oxidoreductases in Inflammation: Redoxkines ..................................61

Aim of this project .................................................................................................63

Chapter 2 - Materials and Methods ......................................................................64

2.1 Instruments ...............................................................................................65

2.2 Chemicals and kits ...................................................................................66

2.3 Reagents and buffers ...............................................................................68

2.4 Antibodies .................................................................................................70

2.5 Software and analytic tools .......................................................................71

2.6 Cell line and cell culture ............................................................................74

2.7 Rat Blood Samples collection ...................................................................76

2.8 Human Blood Samples collection .............................................................77

5

2.9 Spin trapping coupled to EPR ...................................................................78

2.10 Gene expression microarrays ...................................................................81

2.11 Quantitative PCR method .........................................................................84

2.12 Cell viability: MTT assay ...........................................................................88

2.13 Protein alkylation with Maleimide-PEG .....................................................89

2.14 SDS-PAGE and Western blot to detect the redox states of proteins from

cell lysates and blood ...............................................................................92

2.15 DTNB assay to measure total free thiols ...................................................96

2.16 Determination of protein concentration. ....................................................97

2.17 Identification of free thiols at the surface of RAW cell ...............................98

Chapter 3 - Regulatory role of glutathione in LPS-stimulated macrophages . 102

3.1 Introduction ............................................................................................. 103

3.2 Viability and GSH/GSSG determination .................................................. 105

3.3 ROS measured by Electron Paramagnetic Resonance ........................... 107

3.4 Microarray analysis: effect of LPS and BSO alone on gene expression in

RAW cells ............................................................................................... 109

3.4.1 Effect of LPS on gene expression profiles at 2h and 6h ................... 111

3.4.2 Functional analysis of the genes whose expression is changed by LPS

........................................................................................................ 113

3.4.3 Functional analysis of the genes affected by BSO ........................... 116

3.5 Microarray analysis: effect of GSH depletion during LPS stimulation on the

gene expression profile of RAW cells ..................................................... 118

3.5.1 Selection of differentially expressed transcripts ............................... 118

3.5.2 Biological functions associated with the LPS-regulated transcripts

affected by BSO .............................................................................. 128

3.6 Validation of the microarray analysis by qPCR ....................................... 130

3.7 Identification of pathways affected by BSO during LPS stimulation ......... 134

3.8 Antiviral response: BSO increases Influenza A replication in LPS-

stimulated RAW cells .............................................................................. 137

3.9 Effect of NAC and Menadione ................................................................ 141

3.10 Discussion .............................................................................................. 143

Chapter 4 - Redox state of Peroxiredoxins and Thioredoxin in LPS-stimulated

macrophages .................................................................................................... 148

4.1 Introduction ............................................................................................. 149

4.2 The Maleimide-PEG technique ............................................................... 152

4.3 Cell viability upon LPS stimulation .......................................................... 155

4.4 Optimisation of MalPEG concentration in RAW cells .............................. 157

4.5 Determination of the redox states of Prx1, Prx2 and Trx ......................... 160

6

4.5.1 Trx is secreted and undergoes redox changes in response to LPS

stimulation ....................................................................................... 160

4.5.2 LPS stimulation has distinct effects on the redox state of Prx1 and

Prx2 ................................................................................................. 164

4.6 Applicability of the MalPEG methods to other proteins ............................ 171

4.7 Redox state of Prx2 in HEK cells with TNF and Menadione .................... 173

4.9 Discussion .............................................................................................. 177

Chapter 5 - Changes in the redox state of membrane proteins associated with

the inflammatory response ................................................................................ 181

5.1 Introduction ............................................................................................. 182

5.2 Protocol for extracting membrane proteins from cultured cells ................ 186

5.3 Labelling of cell surface thiols with BIAM ................................................ 188

5.4 Optimization of BIAM concentration ........................................................ 190

5.5 Effect of LPS on the level of surface thiols detected ............................... 192

5.6 Analysis of the proteins identified by MS................................................. 197

5.7 Proteins of interest .................................................................................. 202

5.8 Investigation of the expression of membrane Trx .................................... 204

5.9 Discussion .............................................................................................. 207

Chapter 6 - Redox state of Peroxiredoxin 2 and Thioredoxin as biomarkers of

oxidative stress................................................................................................... 209

6.1 Introduction ............................................................................................. 210

6.2 Assessment of the MalPEG technique in Rat blood ................................ 214

6.3 Measurement of the redox state of Prx2 in human plasma ..................... 216

6.4 Measurement of the redox state of Trx in human red blood cells ............ 218

6.5 Assessment of potential redox changes in Trx and Prx2 after stent insertion

in blood samples from CAD patients ....................................................... 220

6.6 Oxidation of Trx and Prx2 with diamide................................................... 224

6.7 Discussion .............................................................................................. 226

Chapter 7 - Discussion and conclusions .......................................................... 229

7.1 Summary of the study ............................................................................. 230

7.2 Advances in the redox and inflammatory field ......................................... 233

7.3 Conclusion .............................................................................................. 234

Bibliography ........................................................................................................ 236

Appendix ............................................................................................................. 266

7

List of Figures

Chapter 1

Figure 1.1: Hematopoietic stem cell lineage and leukocytes origin

Figure 1.2: Chemical structure of LPS

Figure 1.3: TLR4 signalling pathway after LPS induction

Figure 1.4: IFN-signalling pathway

Figure 1.5: Overview of the source of ROS in eukaryotic cells

Figure 1.6: ROS are signalling molecules when produced at moderate levels

Figure 1.7: Thiol oxidation modifications in proteins

Figure 1.8: Catalytic reaction of thiol oxidoreductases

Chapter 2

Figure 2.1: Photo of RAW cells

Figure 2.2: Experimental design of the measurement of ROS in RAW cells by spin

trapping coupled to EPR

Figure 2.3: Experimental design of the gene microarray method and different steps

realised

Figure 2.4: Reverse Transcriptase followed by qPCR

Figure 2.5: Example of amplification plot obtained by qPCR analysis

Figure 2.6: Experimental design of SDS-PAGE followed by Western Blot

Figure 2.7: Reaction of DTNB with free thiols

Figure 2.8: Experimental design of the strategy for the identification of free protein

thiols at the surface of RAW cells before MS analysis

Chapter 3

Figure 3.1: Viability and GSH/GSSG determination

Figure 3.2: ROS are released from RAW cells after 2h LPS stimulation

Figure 3.3: Number of transcripts affected either by BSO or by LPS in RAW cells

after 2h and 6h LPS stimulation

Figure 3.4: Venn diagram of the number of transcripts affected by LPS at 2h (grey)

and 6h (red)

Figure 3.5: Expression View after HCL of transcripts affected at both 2 and 6h after

LPS stimulation

Figure 3.6: 15 most highly represented functional categories of genes affected by

LPS at both 2h and 6h in RAW cells

8

Figure 3.7: Ten most highly represented functional categories depending on their

up-regulation with LPS (right panel) or down-regulation (left panel) at

2h (A) and 6h (B) stimulation

Figure 3.8: Venn diagram of the number of transcripts affected by BSO at 2h (grey)

and 6h (red) LPS stimulation

Figure 3.9: Ten most highly represented functional categories depending on their

up-regulation with BSO (right panel) or down-regulation (left panel).

Figure 3.10: Diagram of the filtering strategy applied to the microarray data to

assess the number of transcripts affected by BSO during LPS

stimulation

Figure 3.11: Hierarchical clustering of 142 GSH-dependent LPS-regulated genes at

2h represented as a Heat Map Tree.

Figure 3.12: Expression images of set of genes obtained for cluster 1, 2, 3 and 4 at

2h

Figure 3.13: Hierarchical clustering of 196 GSH-dependent LPS-regulated genes at

6h represented as a Heat Map Tree.

Figure 3.14: Expression images of set of genes obtained for cluster 1, 2, 3 and 4 at

6h

Figure 3.15: Diagram of the filtering strategy applied to the microarray data to

assess the number of transcripts affected by BSO during LPS

stimulation represented as a heat map

Figure 3.16: Functional categories up-regulated or down-regulated by LPS for each

differentially expressed group affected by BSO (Group 1-4).

Figure 3.17: PCR validation of the microarray data at 2 h

Figure 3.18: PCR validation of the microarray data at 6 h

Figure 3.19: Transcription Factor analysis of Group 1 and Group 2 genes

Figure 3.20: Effect of LPS and BSO on influenza A replication in RAW cells

Figure 3.21: Type of Interferon recognised in Group 2 genes

Figure 3.22: Gene expression of seven selected genes from RAW cells after

treatment with NAC, LPS or Menadione

Figure 3.23: GSH acts as a signalling molecule during LPS stimulation in

macrophages

Chapter 4

Figure 4.1: Chemical structure of NEM and MalPEG.

Figure 4.2: Methodology of the MalPEG technique.

Figure 4.3: RAW cells viability after treatment with different LPS concentration.

9

Figure 4.4: Optimisation of MalPEG concentration in RAW cells.

Figure 4.5: Determination of the effect of MalPEG concentration on free thiols

using the DTNB assay

Figure 4.6: Representation of Mouse Trx structure and potential site of MalPEG

fixation

Figure 4.7: Redox state of Trx in RAW cells lysates and in release after LPS

stimulation

Figure 4.8: Densitometry of each form detected in the cell lysate and in the

released from cells (n=12)

Figure 4.9: Representation of Mouse Prx1 and potential site of MalPEG fixation.

Figure 4.10: Redox state of Prx1 in RAW cells lysates and in release after LPS

stimulation

Figure 4.11: Representation of mouse Prx2 and potential site of MalPEG fixation

Figure 4.12: Redox state of Prx2 in RAW cells lysates and in release after LPS

stimulation

Figure 4.13: Densitometry of each form detected in the cell lysate (n=8) and in the

releasate from cells (n=8)

Figure 4.14: Redox state of Prx4 (A); STAT3 (B) and Hsp70 (C); analysed by

Western blotting in non-reducing conditions

Figure 4.15: Redox state of Prx2 in HEK 293 cells treated with TNF and menadione

Figure 4.16: Gene profile expression of Prx1, Prx2 and Trx in RAW cells following

LPS and BSO stimulation

Figure 4.17: Redox forms detected in RAW cells stimulated or not with LPS for 24h

Chapter 5

Figure 5.1: Hypothesis for a mechanism of redox signalling mediated by Prx2 and

Trx released during inflammation

Figure 5.2: Optimisation of the experimental protocol for extraction membrane

proteins from RAW cells

Figure 5.3: Labelling of free thiols with BIAM at the surface of RAW Cells

Figure 5.4: Determination of BIAM concentration to use to label surface free thiols

Figure 5.5: Surface thiols in RAW cells after LPS treatment for 2h or 24h

Figure 5.6: Protein concentration in NT and LPS (24h) treated samples

Figure 5.7: Purification of BIAM-tagged membrane proteins.

Figure 5.8: Ten most overrepresented cell compartments in free thiol-containing

membrane proteins from RAW cells

10

Figure 5.9: Ten most overrepresented functional categories in free thiol-containing

membrane proteins from RAW cells

Figure 5.10: Venn diagram of membrane proteins shared by LPS-stimulated and

untreated (NT) RAW cells identified by MS

Figure 5.11: Detection of Trx in membrane RAW cells

Figure 5.12: Reduction of the 24kDa form of Trx with β-ME and DTT

Chapter 6

Figure 6.1: Measure of the redox state of Trx (A.) and Prx2 (B.) in plasma from two

rats

Figure 6.2: Redox state of Prx2 in plasma from 4 healthy donors (#1 to #4)

Figure 6.3: Redox state of Trx in plasma (A) or in RBCs lysate (B) (1:10 dilution)

from 3 healthy donors

Figure 6.4: Angiographic images of the stenotic coronary artery before and after

stent procedure

Figure 6.5: Stent deployment and time points of collected samples.

Figure 6.6: Redox state of Prx2 in plasma at different time point before or after

stent insertion

Figure 6.7: Redox state of Prx2 in RBCs at different time point before or after stent

insertion

Figure 6.8: Redox state of Trx in RBCs at different time point before or after stent

insertion

Figure 6.9: Effect of diamide on the redox state of Trx and Prx2 in human RBCs

Figure 6.10: Redox state of Trx and Prx2 in human RBCs left 1h at room

temperature

11

List of Tables

Chapter 1

Table 1.1: Location and ligands of human TLRs

Table 1.2: Examples of clinical trials testing the effect of NAC/GSH.

Chapter 2

Table 2.1: List of instruments used in this study

Table 2.2: List of reagents, chemicals and kits used in this study

Table 2.3: List of reagents used in this study

Table 2.4: List of antibodies used in this study

Chapter 3

Table 3.1: LPS-induced transcripts most affected by BSO in groups 1 and 2

Table 3.2: LPS-downregulated transcripts most affected by BSO in groups 3 and

4

Table 3.3: Number of genes targeted by NF-κB or Nrf2 belonging to groups 2 and

1

Table 3.4: Summary of studies on the effect of thiols or thiols inhibitors on

cytokines production

Table 3.5: Summary of studies on the effect of BSO and GSH on replication of

different viruses

Chapter 4

Table 4.1: Thiol oxidation modifications reported in Trx, Prx1 and Prx2 and

functional roles associated

Chapter 5

Table 5.1: List of the 30 proteins from which most peptides have been identified

by MS in untreated cells

Table 5.2: List of the 30 proteins from which most peptides have been identified

by MS in LPS-treated cells

Chapter 7

Table 7.1: Findings and further work required for each aim of this study

12

Abbreviations

AGC target Automatic gain control target

AGE Advanced glycation end product

AP-1 Activator protein 1

APC Antigen-presenting cell

APS Ammonium persulfate

ATP Adenosine triphosphate

BBP Bromophenol Blue Sodium salt

BCA Bicinchoninic acid

BIAM N-(biotinoyl)-n'-(iodoacetyl) ethylenediamine

BMPO 5-tert‐butoxycarbonyl-5‐methyl-1‐pyrroline N‐oxide

BSA Bovine serum albumin

BSO Buthionine sulfoximine

CAD Coronary artery disease

CGD Granulomatous disease

CREB Camp Response Element Binding Protein

CRP C-reactive protein

Ct Threshold cycle

CVD Cardiovascular disease

Cys Cysteine

CysP Peroxidatic cysteine

CysR Resolving cysteine

DAMP Danger-associated molecular pattern

DAVID Database for Annotation, Visualization and Integrated Discovery

DMEM Dulbecco’s modified eagle’s medium

DMSO Dimethyl sulfoxide

dNTP Deoxynucleoside triphosphate

DTNB 5,5’-dithiobis(2-nitrobenzoic acid)

DTPA Diethylene triamine pentaacetic acid

DTT Dithiothreitol

EASE Expression analysis systematic explorer

ECL Enhanced chemiluminescence

ECM Extracellular matrix

EDTA Ethylenediaminetetraacetic acid disodium

EPO Erythropoietin

EPR Electron paramagnetic resonance

ER Endoplasmic reticulum

ERK Extracellular signal-regulated protein kinase

13

ESR Electron spin resonance

FDR False discovery rate

FGF Fibroblast growth factor

Gclm GSH synthetic enzyme glutamate cysteine ligase modifier

GCS Glutamylcysteine synthetase

G-CSF Granulocyte colony-stimulating factors

GO Glucose oxidase

GO-BP Gene ontology - biological process

GO-CC Gene ontology - cellular component

GO-MF Gene ontology - molecular function

GPx Glutathione peroxidase

Grx Glutaredoxin

GSH Glutathione

GTP Guanosine triphosphate

HCL Hierarchical clustering linkage

HCl Hydrochloric acid

HEK Human embryonic kidney

HIV Human immunodeficiency virus

HMGB1 High mobility group box 1

HNE 4-hydroxy-2-nonenal

HSC Hematopoietic stem cell

Hsp Heat shock protein

IAA Iodoacetamide

IFN Interferon

IFNAR Interferon-α/β receptor

IFNGR Interferon-gamma receptor

IFNLR Interferon-lambda receptor

IgG Immunoglobin G

IKK Iκb kinases

IL-1β Interleukin 1 beta

IL-4i1 Interleukin 4 induced 1

IRAK IL-1R associate kinase

IRF Interferon regulatory factor

IRGs Interferon regulated genes

JAK Janus kinases

JNK C-Jun N-terminal kinase

KCl Potassium chloride

Keap1 Kelch-like ECH-associated protein 1

KEGG Kyoto Encyclopedia of Genes and Genome

KH2PO4 Potassium dihydrogen orthophosphate

14

LPS Lipopolysaccharide

MalPEG; MP Methoxypolyethylene glycol Maleimide (Maleimide-PEG)

MAPK Mitogen-activated protein kinase

MDA Malondialdehyde

MS Mass spectrometry

MTT Thiazolyl blue tetrazalium bromide

Mx Myxovirus

MyD88 Myeloid differentiation primary response 88

Na2HPO4 Disodium hydrogen orthophosphate

NAC N-acetylcysteine

NADPH Nicotinamide adenine dinucleotide phosphate

NCBI National Center for Biotechnology Information

NEM N-ethylmaleimide

NF-κB Nuclear factor kappa B

NGF Nerve growth factor

NH4HCO3 Ammonium bicarbonate

Nos2 Nitric oxide synthase 2

NOX NADPH oxidase

Nrf2 Nuclear factor (erythroid 2-derived)-like 2

Oas Oligoadenylate synthase

ox LDL Oxidised Low-Density Lipoprotein

P/S Penicillin-streptomicin

PAMP Pathogen-associated molecular pattern

PBS Phosphate buffered saline

PDGF Platelet derived growth factor

PDI Protein disulphide isomerase

PolyI:C Polyinosinic:polycytidylic acid

PRR Pattern recognition receptor

Prx Peroxiredoxin

PSM Peptide-spectrum match

Ptgs2 Prostaglandin G/H synthase 2

PX 12 2-[(1-methylpropyl)dithio]-1H-imidazole

qPCR Quantitative Polymerase Chain Reaction

RBC Red blood cell

Rel REL-associated protein

RNS Reactive nitrogen species

ROS Reactive oxygen species

RPMI Roswell park memorial institute

RT Reverse transcriptase

SA beads Streptavidin beads

15

SDS-PAGE Sodium dodecyl sulfate - polyacrylamide gel electrophoresis

Slc7a11 Cysteine/glutamate transporter xct

SOCS Suppressor of cytokine signalling

SOD Superoxide dismutase

SOX Sulfhydryl oxidase

Srxn Sulfiredoxin

STAT Signal transducer and activator of transcription

SVD Singular value decomposition

TAB TAK bonding protein

TAK Transforming growth factor-β activated kinase

TCEP Tris 2-carboxyethylphosphine

TEMED Tetramethylethylenediamine

TF Transcription factor

TGF-β Transforming growth factor

TIR Toll/interleukin-1 (IL1) receptor

TIRAP Toll-interleukin 1 receptor (TIR) domain-containing adaptor protein

TLR Toll-like receptor

TNF Tumor necrosis factor

TRAF6 Tumour necrosis factor receptor-associated factor 6

TRIF TIR-domain-containing adapter-inducing interferon-β

Trx Thioredoxin

TrxR Trx reductase

TYK Tyrosine kinase

XO Xanthine oxidase

β-ME β-Mercaptoethanol

16

Acknowledgments

I would like to express my deep gratitude to my lead supervisor Prof Pietro Ghezzi

for trusting me to complete this PhD, giving me advices and despite being very

busy, always being there when I needed him.

Also many thanks to my supervisor Dr. Lisa Mullen for her dedication to read again

and again my thesis and also together with Dr. Manuela Mengozzi for their help with

my research questions, their patience, their kind support, their wise advices and

comments and their support all the way through my PhD.

Thank you to Philippe Chan, Prof Fabienne Peyrot, Dr. Kahina Abbas and Dr. Eva

Maria Hanschmann for their collaboration and kindness.

Thanks to all the team of BSMS research staff and in particular: Lamia, Steph,

Giselle, Juliet, Sandy, Natacha and Phil.

During these years, moments of doubts and questioning are presents and without

the friendship and comfort of my amazing PhD crowd, the path would have been

less enlightened. Thank you for taking the time to reread and correct my Frenchie

mistakes. Thank you for being here: George G, Sonia L, Ben A.

Also many thanks to the Trafford center and MRB for the laughter, camaraderie and

complicity: Georgie G, Matt S, Kaj K, Little Matt, Ryan T, Laura H, Daire C, Amy P,

Ben T and Sophie B.

Thank you to my friends who have always been there for me: Mathias, Laura W,

Amandine, Victoire, Cecile, Susana, Heloise, Matt, Will.

Finally, because I would not be here without the support and love they gave me,

thank you to my amazing parents, my brother and my family for believing in me and

my dreams.

“Dans la vie, rien n’est à craindre, tout est à comprendre”

(In life, nothing is to be afraid of, everything is to be understood)

Marie Sklodowska-Curie (1867-1934)

17

Declaration

I declare that the research contained in this thesis, unless otherwise formally

indicated within the text, is the original work of the author. These thesis has not

been previously submitted to this or any other university for a degree, and does not

incorporate any material already submitted for a degree.

Signed

Marina Diotallevi

Dated

14 / 10 / 2017

18

Chapter 1

Introduction

19

1.1 Mechanism of inflammation

1.1.1 Immune system

Perfected over millions of years of evolutionary selection, the immune system protects

us from an invasion of microorganisms. It is particularly complex and can be classified

into the innate system and the adaptive system (Iwasaki and Medzhitov 2015). The

innate system first appeared in unicellular and early multicellular organisms with the

recognition of the non-self to itself (Buchmann 2014). Five hundred million years later,

adaptive immunity was acquired by the first jawed vertebrates, the Gnathostomata

(Flajnik and Kasahara 2010). In mammals, both systems work together; a danger is

recognised by the innate system leading to an organised response to eliminate it

which also leads to the activation of the adaptive system (Iwasaki and Medzhitov

2015). These are two distinct systems with their own receptors and immune cell types

(also referred to as white blood cells or leukocytes).

1.1.1.1 Innate immune system

The innate system reinforces the physical and anatomical barrier already present in

the body. These include the skin with epithelial cells at the surface of organisms and

the junction between them to avoid the entrance of pathogens, the mucus with a low

pH to avoid bacteria contamination in the respiratory, stomach, and genitalia tract and

the cilia lining their surface to refresh it (Turvey and Broide 2010, Romo, Perez-

Martinez et al. 2016). The innate system triggers a direct response to the invasion of

pathogens and rupture of these barriers via specific cells and receptors. Innate

immune cells are derived from the myeloid lineage which itself is derived from

hematopoietic stem cells (HSCs) where all leukocytes come from, representing 0.1 to

0.2% of human blood cells. Innate cells represents 53% to 86% of the leukocytes and

include dendritic cells, macrophages, neutrophils, basophils, eosinophils, and

platelets (Figure 1.1) (Chaplin 2010, Geissmann, Manz et al. 2010, Koenderman,

Buurman et al. 2014). These cells bring together their own properties to fight a danger.

Neutrophils are the first to be activated and release a large amount of reactive species

(reactive oxygen species (ROS), reactive nitrogen species (RNS) and chlorinated

species) to kill invading pathogens. Neutrophils, macrophages and monocytes are

able of phagocytose meaning they can recognise, phagocyte and kill pathogens. They

are also capable of releasing enzymes and reactive species. Eosinophils are

specialists in fighting parasites and helminths. Basophils are still under investigation

20

due to their implication in allergy reactions. Finally, dendritic cells present the antigen

to adaptive immune cells and are referred as antigen-presenting cells (APC).

These innate cells circulate within the body and can recognise invaders or harmful

events thanks to the presence of a limited set of receptors, which are germline-

encoded. If a danger is detected, these receptors trigger different signalling pathways

which lead to the release of different effector molecules, in addition to reactive

species. Among these molecules are the cytokines and chemokines, which are

effectors of the inflammatory response triggering elimination of the pathogen,

reparation of the host and preventing infection (see part 1.1.2.4). It comprises also

the lysozyme which is a hydrolytic enzyme degrading the bacterial cell wall composed

of peptidoglycan. It is found especially in body secretions such as tears and saliva

(Callewaert and Michiels 2010). And finally, the complement, of which there are more

than 30 proteins that can attach to a pathogen leading to its elimination, but also

interfere with the adaptive immune response (Dunkelberger and Song 2010). For

instance, macrophages recognise which particles and pathogens to phagocytose due

to the complement proteins attached to them.

1.1.1.2 Adaptive immune system

This study is focused on innate immunity; however, the adaptive system is also

required to complete an appropriate response from the body to a danger. This

immunity is also named acquired or specific immunity and differs from innate immunity

as cell receptors are not germline encoded but undergo rearrangement and

recombination of the DNA. This ensures specific targeting of new pathogens and

being in constant evolution against danger. Due to the rearrangement of genes, the

adaptive response is slow and takes few days before it is able to mount an immune

response (Kimbrell and Beutler 2001) (Chaplin 2010).

The adaptive response is started by the recognition of an antigen that is presented by

innate cells such as dendritic cells and macrophages. This antigen is then recognised

by naïve T lymphocytes, of which there are among million of them, each carrying a

different receptor. In the human body, there is 0.54 to 1.79 x 10⁶ of T lymphocyte cells

per ml of blood. These cells differentiated from the lymphoid lineage representing 14

to 47% of the leukocyte in the blood (Figure 1.1). Once a T lymphocyte is activated,

it divides forming a clonal selection specific to one antigen of the pathogen. Two type

of T cells are activated; the helper T cells, the CD4+, and the cytotoxic T cells, the

CD8+. Helper cells activate B lymphocytes which then produce specific antibodies

toward the antigen. Cytotoxic cells help to eliminate the pathogen by releasing

21

cytotoxins which perforate and degrade pathogens. Some of the expansion clones

survive and become memory cells, which will help to trigger a faster response to the

invader if the host becomes re-infected.

22

Figure 1.1: Hematopoietic stem cell lineage and leukocytes origin; scheme

adapted and simplified from Hayden and Gosh (Hayden and Ghosh 2011)

23

1.1.2 Inflammatory response

Inflammation is part of the innate immune response. It is defined as the response of

the body to dangers such as pathogens or noxious chemicals but also to tissue

damage by proceeding to elimination of the danger, protection of the host and

initiating repair (Weiss 2008). It was initially described 2000 years ago by Aulus

Cornelius Celsus as the combination of four physiological symptoms: pain, swelling,

redness and heat. This definition has since evolved with the addition of two

parameters: tissue damage and the migration of plasma and leukocytes from the

blood to the area of local injury (Medzhitov 2008).

Essentially, tissue resident macrophages can detect the presence of a pathogen or

tissue injury thanks to pattern recognition receptors (PRRs). Once activated, they

trigger cells to release a variety of signalling molecules: cytokines, chemokines, and

growth factors. Physiologically, vessels are dilated allowing the recruitment of other

leukocytes from the blood to the site of infection maximising the number of immune

cells available to eliminate any invading pathogens (Murray and Wynn 2011)

(Medzhitov 2008). Once the danger is eliminated, anti-inflammatory cytokines are

released and any damaged tissue is repaired (Lawrence and Gilroy 2007). This

resolved inflammation (also referred as acute inflammation) is fast and is responsible

for restoring tissue homoeostasis. On the contrary, the permanent activation of the

inflammatory response is associated with certain chronic conditions, such as

rheumatoid arthritis, or atherosclerosis.

1.1.2.1 PAMPs and DAMPs

Two main families of molecular motifs are recognised by the PRRs; the Pathogen-

Associated Molecular Patterns (PAMPs) which are exogenous dangers, and the

Danger-Associated Molecular Patterns (DAMPs) also called alarmins or danger

signals which are endogenous dangers. The former group include essential

molecules of bacteria, mycobacteria, viruses, fungi and parasites. For instance,

surface components such as lipoproteins or peptidoglycan but also DNA such as

unmethylated DNA found in bacteria or single stranded DNA from viruses. DAMPs

include molecules released in response to trauma, physical injury, necrotic cells (not

from programmed cell death (apoptotic cells)), or autophagy. Once released from

cells, these molecules act as danger signals whereas within the cell they have a

different biological role. DAMPs fulfil two criteria: their administration to a disease-free

host initiates inflammation which is in return inhibited by blocking its receptor or

24

signalling pathway, and they can also participate in the healing process and tissue

regeneration (Venereau, Ceriotti et al. 2015) (Shen, Kreisel et al. 2013). DAMPs can

be proteins, lipids, sugars, metabolites and nucleic acids (Kvietys and Granger 2012).

Protein DAMPs include high mobility group box 1 (HMGB1), a nuclear protein binding

the nucleosome and promoting the bending of DNA, which was one of the first DAMPs

to be identified, heat shock proteins (HSPs), chaperone of good protein folding and

release by necrotic cells, and S100 proteins, calcium-binding proteins. The non-

protein DAMPs include uric acid, which can form monosodium urate crystals,

adenosine triphosphate (ATP), RNA and DNA (Tang, Kang et al. 2012).

1.1.2.2 Toll-Like Receptors

The activation of the inflammatory response is based on the recognition of danger.

This is possible thanks to specific PRRs presents in the inflammatory cells such as

macrophages, dendritic cells and monocytes. Those receptors are encoded in the

germline DNA and are set to recognise a large but limited variety of dangers signals

including toxic particles and molecules expressed specifically by pathogens. There

are five main families of PRR grouped into two classes: the membrane-bounded

receptors and the intracellular cytosolic receptors (Brubaker, Bonham et al. 2015).

The membrane receptors are the Toll-like receptors (TLRs) and the C-type lectin

receptors characterized by the presence of a carbohydrate-binding domain. They are

both transmembrane proteins located at the cell surface or in endosomes. The three

other families of PRR are located intracellularly and encompass the NOD-like

receptors, RIG-I-like receptors, primarily involved in antiviral responses, and the

Absent in Melanoma 2 like receptors, which are characterized by the presence of a

pyrin domain and a DNA-binding HIN domain involved in the detection of intracellular

microbial DNA (Mogensen 2009). It has to be noted that environmental irritants such

as asbestos and noxious chemical are recognised by other receptors than PRRs such

as the NACHT-leucine-rich-repeat- and pyrin-domain-containing protein (NALP3) part

of the inflammasome pathway, a multimeric protein complex (Hornung, Bauernfeind

et al. 2008) (Guo, Callaway et al. 2015).

TLR have been particularly well studied and characterised. They represent the major

PRR in the cell (Newton and Dixit 2012). This family was discovered in Drosophila

melanogaster during development studies in the 1980’s. Since then, 10 TLRs have

been identified in humans and 12 in mice with 10 conserved between them both

(Kawasaki and Kawai 2014). This family share the following characteristics: they are

25

type 1 transmembrane glycoproteins with a ligand-binding domain containing leucine-

rich repeat motifs and a Toll/interleukin-1 (IL1) receptor homology (TIR) domain.

TLR1, TLR2, TLR4, TLR5, TLR6, and TLR10 are found at the cell surface while TLR3,

TLR7, TLR8, TLR9 are in endosomes (Mogensen 2009). Despite their similarity, TLRs

can all recognise different molecules and pathogens. The ones at the cell surfaces

are designed to identify bacteria compounds while endosome TLRs specifically

recognise nucleic acids (see Table 1.1). The first ligand identified was

lipopolysaccharide (LPS) a structural element part of the outer membrane of gram-

negative bacteria which binds TLR4 (Yamamoto and Takeda 2010). It is composed

of three part: lipid A, an oligosaccharide domain and O-antigen of oligosaccharides

units as shown Figure 1.2 (Qiao, Luo et al. 2014). LPS is commonly used to induce

an inflammatory response in-vivo and in-vitro and has been used for this purpose

throughout this study. It is specifically recognised by TLR4 but other bacterial

lipoproteins can also be recognised by TLR1, 2 and 6 (Poltorak, He et al. 1998). TLR6

can also recognise mycoplasma molecules. TLR3 can detect double-stranded RNA

found in virus such as the Reoviridae viruses while single-stranded DNA, such as that

of Influenza viruses, is recognised by TLR7. TLR5 recognises Flagellin. TLR9

recognises unmethylated CpG DNA. Human TLR10 has no known ligand, but a recent

review has shown anti-inflammatory properties of this TLR when heterodimerised with

TLR2 (Oosting, Cheng et al. 2014).

Most of these innate immune receptors recognising PAMPs can also identify DAMPs

(Jounai, Kobiyama et al. 2012). HMGB1, for instance, is recognised by TLR4 (Yu,

Wang et al. 2006). Recently, Peroxiredoxin 1 (Prx1), an antioxidant enzyme was

identified as a possible DAMP that directly interacts with TLR4 (Table 1.1) (Riddell,

Wang et al. 2010).

26

Receptor Location Ligands

TLR1/TLR2 Extracellular Bacteria: peptidoglycan, lipoproteins, Fungi: zymosan Synthetic: Pam3Cys

TLR2/TLR6 Extracellular Bacteria: lipoproteins

TLR3 Intracellular Viruses: double-stranded DNA Endogenous: mRNA Synthetic: PolyI:C

TLR4 Extracellular Bacteria: LPS Fungi: mannan Protozoa: Glycoinositolphospholipids Endogenous: saturated fatty acids, oxLDL, Prx1, HMGB1 Synthetic: Lipid A derivatives

TLR5 Extracellular Bacteria: flagellin

TLR7/TLR8 Intracellular Viruses: single-stranded RNA Endogenous: self RNA

TLR9 Intracellular Bacteria, viruses, protozoa: CpG DNA Endogenous: self DNA

TLR10/TLR2? N.D N.D

TLR11 Extracellular Uropathogenic bacteria

Table 1.1: Location and ligands of human TLRs; adapted from Mills (Mills 2011).

Figure 1.2: Chemical

structure of LPS; adapted

from Qiao et al. (Qiao, Luo et

al. 2014).

27

1.1.2.3 Signalling pathways

Once a PRR is activated, the transduction of signalling pathways will depend on few

steps to trigger a series of phosphorylation, ubiquitinylation and other modifications in

many proteins to finally activate transcription factors such as nuclear factor kappa B

(NF-κB), Interferon pathways such as Irf3, and MAPK pathways (Newton and Dixit

2012). An important factor is the homodimerisation or heterodimerisation of the TLR

domains. In the human system, both TLR1 and TLR6 need dimerization with TLR2 to

be activated while the other proceed to homodimerisation. Another important factor is

the presence of adaptor molecules which help to transduce a signal and determine

the appropriate response (Newton and Dixit 2012, Kawasaki and Kawai 2014). These

adaptors include MyD88, TRIF, TIRAP/MAL, and TRAM. All TLR uses Myd88

activating NF-κB and MAPKs pathway. TRIF is an alternative and it is used by TLR3

and TLR4 in the endosome activating IRF3, NF-κB and MAPK.

TLR4 can therefore use both Myd88 and TRIF pathways to produce an appropriate

response with the good level of cytokines and chemokines. TLR4 signalling is

particularly of interest in this study and is shown in Figure 1.3.

In TLR4-MyD88-dependent signalling pathways, MyD88 recruit IL-1R associate

kinase (IRAK) 1 and 4 and tumour necrosis factor receptor-associated factor 6

(TRAF6). The complex IRAK1-TRAF6 form dissociate from this complex and activate

transforming growth factor-β activated kinase (TAK1) and TAK bonding protein 1 and

2 (TAB1 and TAB2). These lead to activation of the IκB kinases (IKK) and MAPK

cascade signalling pathways.

IKKs are required for the activation of NF-κB which represents a family of 5

transcription factors (TF) members: RelA (p65), Rel (B), C-Rel, p50 (p105 precursor),

p52 (p100 precursor), and Relish which all homo- or hetero- dimerise to activate the

transcription of target genes. In fact, NF-κB is sequestered in the cytosol in a complex

form with IκB molecules. IKK allows the detachment of IκB from the complex by

phosphorylating the molecule. IκB molecules are then ubiquitinylated and therefore

degraded. Consequently, NF-κB is free to join the nucleus and target the transcription

of many inflammatory genes: cytokines such as interleukin -1, TNF, interleukin 6 but

also chemokines, growth factors, adhesion molecules leading to a multitude of

physiological functions such as apoptosis, proliferation and development

(Napetschnig and Wu 2013, Cildir, Low et al. 2016).

The MAPK pathway is activated by a series of downstream phosphorylation activation

of many different MAPK molecules; basically, MAPK kinase kinase (MAP3K) activates

MAPK kinase (MAP2K) which then activate MAPK (Arthur and Ley 2013). In the TLR4

28

pathway, TAK1, which is a MAP3K, drive the activation of ERK1/2, JNK and p38

pathway. All leading to activation by phosphorylation of different TF such as AP-1 and

cAMP Response Element Binding Protein (CREB) involved in many cell process and

with many roles in immunity such as macrophage signalling and induction of pro-

inflammatory molecules (Arthur and Ley 2013).

In TLR4-Myd88 independent pathway, TRIF is linked to TLR4 with the adaptor TRAM

to bridge with the TIR domain. TRIF interact with TRAF6 which activate TAK1

activating MAPK pathway and NF-κB. In addition TRIF interacts with TRAF3 which

activates other molecules such as TBK1 and IKKi leading to IRF3 phosphorylation

and thus induction of type 1 interferon.

All transcription factors lead to the induction of cytokines, crucial for the coordination

and communication of cells to control and regulate the inflammatory response. NF-κB

and MAPK target mainly the induction of interleukins and chemokines while IRFs

allow IFN production (Mogensen 2009).

29

Figure 1.3: TLR4 signalling pathway after LPS induction. Two pathways are

activated; the Myd88-dependent signalling pathway and the MyD88-independent

pathway which involved many signalling molecules. Both lead to TF activation to

promote pro-inflammatory molecules.

30

1.1.2.4 Cytokines

Cytokines are proteins that mediate the inflammatory response leading to a variety of

biological effects such as regulation of inflammation and immunity (Dinarello 2007).

Their action depends on the cell type, their location, and the receptor targeted.

The roles of cytokines are mediated through their receptors which transduce a

cascade of signal mainly through the Janus kinases (JAK) signal transducer and

signal transducer and activator of transcription (STAT) pathway involved in diverse

cellular process such as proliferation, differentiation, migration, or apoptosis. When

the inflammatory process is finished, the pro-inflammatory cytokines are usually

submitted to negative regulation using protein downstream signalling pathway such

as suppressor of cytokine signalling (SOCS) acting on the JAK/STAT signalling

pathway in order to down regulate the inflammatory response (Lawrence and Gilroy

2007).

Cytokines are often given different names, and include interleukins, tumour necrosis

factor (TNF), chemokines, growth factors, and interferons.

Interleukins

Interleukins are defined as secreted proteins binding specific receptors and are

grouped in families according to their structure and receptor similarity (Akdis, Burgler

et al. 2011, Akdis, Aab et al. 2016). The main interleukins studied in the context of

inflammation are IL-1, IL-6 and IL-10. IL-1, was the first cytokine described, it acts on

the nervous system and triggers fever. It includes nowadays 11 family members

including agonist ligands and receptors for instance IL-1α, IL-1β, IL-1 receptor

antagonist and IL-18 (Garlanda, Dinarello et al. 2013). Most of the focus is on pro-

inflammatory cytokines, and antibodies to IL-6 or IL-17 are routinely used in the

therapy of inflammatory disease. In fact, some interleukins, particularly IL-10 have an

anti-inflammatory activity. The name “interleukin” has no particular meaning anymore

and the rule is that if a new human cytokine is identified, it will be given an interleukin

number, irrespective of what its biological activities are.

TNF

Tumor Necrosis Factor (also known as TNF-α) is a glycoprotein which was originally

described as an inducer of necrosis in tumours but was then found to be a strong pro-

inflammatory molecule responsible for the symptoms of sepsis (Kalliolias and Ivashkiv

2016). While there is currently very little interest in developing TNF as an antitumor

agent, due to its toxicity, the characterization of its inflammatory activity led to the

31

development of anti-TNF antibodies to become the best efficient molecule used in the

therapy of rheumatoid arthritis.

Growth factors

This class include G-colony stimulating factors such as G-CSF, GM-CSF, and M-CSF

allowing granulocytes and monocytes production; and the transforming growth factor

TGF-β, a pleiotropic cytokine, helping to repair tissue, differentiate leukocytes but

which can also stop their proliferation (Sanjabi, Zenewicz et al. 2009, Turner, Nedjai

et al. 2014). All of them retained their original names because they were identified in

the 1970s, before the terms interleukin or cytokine were coined. Other growth factors

(EPO, NGF, FGF, etc.,) do not have relevance to this study.

Chemokines

Chemokines are defined as chemotactic cytokines directing and locating leukocytes

to the site required (Griffith, Sokol et al. 2014). They are small proteins of 8 to 12kDa

with four conserved cysteine residues which can be divided in many family according

to the position of the first two cysteines; main families are the C-X-C and C-C

chemokines. There are 44 chemokines known using one of the 23 chemokines

receptors identify (Turner, Nedjai et al. 2014). They have chemotactic function using

a gradient of signal perceived by a chemokine receptor and attract the cells. They

also have other functions such as leukocyte differentiation, vascularisation and

notably angiogenesis a problem in cancer. Their main role in the context of

inflammation is to recruit inflammatory cells (mainly neutrophils but also

macrophages) to the site of infection or injury.

Interferons

Interferons (IFNs) are pro-inflammatory molecules intervening in antiviral response.

The IFN family is subdivided in three types which are classify according to their

recognition receptors: type 1, type 2 and type 3 (Hoffmann, Schneider et al. 2015).

Type 1 IFN group 17 genes including 13 IFN-α and one IFN-β which have antiviral

activity. This type signal through IFNAR1 and IFNAR2 receptors found in all cells.

Type 2 only contain one gene IFN-γ, produce only in leukocyte and act as

macrophage-activating cytokine, which is recognise by IFNGR1 and IGNGR2

receptors. Finally, type 3 comprises 4 genes IFN-λs recognised by IL-10 receptors

and IFNLR1.

Once IFNs bonds their receptor, the JAK/STAT pathway are activated (Figure 1.4).

A following cascade of phosphorylation and ubiquinitation mediated four pathway: the

32

Myxovirus (Mx) GTPase pathway, the 2’5’ oligodenylate-synthetase-directed

ribonuclease L pathway, the protein kinase R pathway and the ISG15 ubiquitin

pathway all leading to the degradation of the virus, inhibition of its proliferation and

activity (Sadler and Williams 2008).

33

Figure 1.4: IFN-signalling pathway by Sadler and Williams (Sadler and Williams

2008). Type 1, 2 and 3 are recognised by specific receptors leading to a cascade of

signalling molecules to activate an antiviral response via the JAK/STAT pathway also

used by other cytokines.

34

1.1.3 Chronic inflammatory diseases

The inflammatory response includes macrophage activation, neutrophil infiltration and

involves many signalling pathways and molecules as discussed above. It is an

essential part of innate immunity in which a derangement in its regulation can be

harmful and is implicated in a number of diseases. Among them, chronic inflammation

is observed in many pathologies. This inflammation is defined as a constant activation

of the inflammatory response generating damage and tissue destruction (Nathan and

Ding 2010). Chronic inflammation has been associated with, among other,

neurodegenerative diseases (Amor, Puentes et al. 2010) including multiple sclerosis

(MS) (Compston and Coles 2008), cardiovascular diseases (Tousoulis, Oikonomou

et al. 2016), gout (Martinon, Petrilli et al. 2006), diabetes type 2 (Donath and Shoelson

2011), autoimmune diseases such as rheumatoid arthritis (McInnes and Schett 2007),

cancer (Grivennikov, Greten et al. 2010), bowel diseases (Neurath 2014), lung

diseases (Hogg, Chu et al. 2004) and fibrosis (Wynn 2008).

Effectors of the inflammatory response could therefore be important pharmacological

targets and the therapy of some of the diseases mentioned above is based on the

use of cytokine inhibitors (antibodies to TNF, IL-6 or IL-17) or inhibitors of cytokine

receptors, including glucocorticoids (Diaz-Borjon, Weyand et al. 2006) (Shah and

Mayer 2010). However, inhibition of inflammation, which is a component of innate

immunity, can increase the risk of infection and cancer (Diaz-Borjon, Weyand et al.

2006). This may be important in elderly people, as they are more vulnerable due to

an immune system already compromised and in which these diseases are more

common (Diaz-Borjon, Weyand et al. 2006).

In fact, this dysregulation of inflammation is more and more observed in the population

as a result of different factors, including genetic factors, aging, the environment and

life style (Libby 2007, Nasef, Mehta et al. 2017). According to a study performed in

2015, the incidence of autoimmune diseases increases by 19% each year (Lerner,

Jeremias et al. 2015). Therefore, despite discovery of important pathways, including

cytokines and Toll-like receptors (whose discovery led to the Nobel Prize in 2011),

the causes of this chronic inflammation are not yet fully understood. In addition to

inflammation, these autoimmune diseases are often associated with oxidative stress.

Inflammation triggers the production of ROS to kill pathogens which can, in turn,

activate inflammation in a vicious circle. This oxidative damage has been reported in

neurodegenerative diseases (Alzheimer’s disease, Parkinson’s disease and

amyotrophic lateral sclerosis) (Niedzielska, Smaga et al. 2016), diabetes (Giacco and

Brownlee 2010), gout (Harijith, Ebenezer et al. 2014), multiple sclerosis (Gilgun-

35

Sherki, Melamed et al. 2004), cancer (Reuter, Gupta et al. 2010), cardiovascular

disease (Ho, Karimi Galougahi et al. 2013) (Dhalla, Temsah et al. 2000), and lung

diseases (Rahman and MacNee 2000). This link between oxidative stress mediated

by ROS and inflammation is investigated in this study.

36

1.2 Oxidative stress and inflammation

1.2.1 Source of Reactive Oxygen Species

ROS derive from molecular oxygen (O2) which was initially a by-product of

photosynthesis by cyanobacteria more than two billion years ago. Following its

significant accumulation in the atmosphere, life has evolved to draw its metabolic

energy from it with the evolution of aerobic life (Dismukes, Klimov et al. 2001,

Falkowski and Godfrey 2008). Chemically, due to spin restriction laws, O2 can

undergo reduction with one electron at a time leading to highly reactive intermediates,

ROS (Buonocore, Perrone et al. 2010). These species are unstable and have a short

life. ROS include free radicals such as the superoxide anion (O2.-), hydroxyl radical

(HO.) and singlet oxygen (1O2) (Naqui, Chance et al. 1986, Buonocore, Perrone et al.

2010). It also includes the non-radical, but highly reactive, hydrogen peroxide (H2O2)

as well as peroxinitrite (ONOO-) which is derived from the rapid reaction between O2.-

and NO. a nitrogen radical (Brieger, Schiavone et al. 2012). In fact, nitrogen similarly

to oxygen can lead to reactive nitrogen species (RNS) which is the theme of a different

field. Essentially NO. is synthesised by nitric oxide synthase (NOS) which converts

arginine into citrulline. NO. has many physiological roles including vasodilation and

neural activity and its toxicity is mainly due to formation of ONOO- (Pacher, Beckman

et al. 2007). Excess of RNS production can lead to nitrosylation of protein modifying

their properties (Valko, Leibfritz et al. 2007).

A variety of ways lead to ROS generation such as those due to ultraviolet light,

radiation, chemicals, pollution and diet (excess of fat, tobacco, alcohol) (Phaniendra,

Jestadi et al. 2015). In living organisms, the reduction of O2 is also very common due

to the presence of enzymes, biomolecules and metallic atoms, thus resulting in the

production of ROS. The human body has many different sources of ROS; the

mitochondrial respiration, NADPH oxidases (NOX), peroxisomes and various

enzymes such as xanthine oxidase (XO), glucose oxidase (GO), and cytochrome

P450 enzymes which are shown in Figure 1.5 (Holmstrom and Finkel 2014). While

O2.- and H2O2 are produced by these enzymes, HO. , the most reactive species, is

generated by their interaction due to the Haber-Weiss reaction (Equation 3). This is

the net reaction of two chemical reactions (Equation 1 and 2) using Fenton chemistry

and iron as a catalyst (Kehrer 2000):

Equation 1: Fe3++ O2.- → Fe2++ O2

Equation 2: Fe2+ + H2O2 → Fe3+ + OH- + HO.

Equation 3: O2.- + H2O2 → O2 + OH- + HO.

37

Mitochondrial respiration

During respiration, 95% of the oxygen goes to the mitochondria resulting in the

production of ATP, H2O and CO2 (Cadenas and Davies 2000, Kowaltowski, de Souza-

Pinto et al. 2009). O2.- are mainly generated from complex I and complex III of the

electron transport chain due to leakage while O2 is reduced into H2O via oxidative

phosphorylation (Murphy 2009).

Peroxisomes

Peroxisomes are involved in many metabolic pathways, such as the degradation of

fatty acids by beta oxidation leading to the formation of ROS (Wanders and Waterham

2006) (Sandalio, Rodriguez-Serrano et al. 2013). In fact, peroxisomes are rich in

enzymes such as Cytochrome P450 and XO which promote xenobiotics catabolism.

Xanthine oxidase

XO is involved in the purine catabolism (Harrison 2004). Essentially, it is a complex

molybdoflavoprotein homodimer reducing different substrates such as hypoxanthine,

xanthine, aldehydes and N-heterocycles which lead to the production of the by-

products; O2.- and H2O2.

Xanthine +2O2 +H2O Uric acid +2O2.-+2H+

Glucose oxidase

Glucose oxidase is a flavoprotein which promote the oxidation of β-D-glucose to

gluconic acid using O2 as an electron donor and producing H2O2 (Bankar, Bule et al.

2009).

NADPH oxidase

A number of enzymatic systems have evolved with the purpose of producing ROS,

either for regulatory purposes (see below 1.3.1 Redox signalling by ROS) or for host

defence, such as killing of infectious agents, infected cells or tumour cells. The most

important example is probably that of the oxidative burst. LPS binds TLR4 thus

triggering the interaction between the TIR region of TLR4 and the C-terminus of NOX,

ultimately leading to the production of O2- (Park, Chun et al. 2006). In 1933, Baldridge

and Gerard were the first to demonstrate an increase of oxygen uptake in leukocytes

during phagocytose outside normal mitochondrial respiration. This phenomenon was

referred as an “extra respiration” (Baldridge and Gerard 1933). In 1964, Filippo Rossi,

helped by Karnovsky’s previous research on the subject, identified NOX, an electron

38

transport system, that functions to generate the respiratory burst by pumping

excessively O2 (Sbarra and Karnovsky 1959, Rossi and Zatti 1964). In the following

twenty years, the biochemical mechanism underlying this burst has become

progressively more understood: O2 is converted into O2.- by NOX:

2O2 + NADPH 2O2.- + NADP + H+

O2.- is then rapidly converted into H2O2 by superoxide dismutase (SOD). H2O2, in turn,

interacts with one electron and can undergo two transformations, either as

hypochlorous acid (HOCl) via myeloperoxidase or as a HO• via the Fenton reaction

(Iyer, Islam et al. 1961, Klebanoff 1967, Babior, Curnutte et al. 1976, Weiss, Klein et

al. 1982). All these toxic molecules are diffused near to the infectious agent into the

phagolysosome (Weiss and Schaible 2015).

Similarly, NOX structure was demonstrated. NOX (also referred as NOX2 the first

characterised) is composed of six subunits: two integral membrane (gp91phox and

p22phox), a heterodimeric flavocytochrome cytb558 and three cytosolic proteins (p40phox,

p47phox and p67phox). A small GTPase (rac1 or rac2 depending on the cell type)

participate as the activation of NOX by binding guanosine triphosphate (GTP)

translocating to the membrane p40phox, p47phox and p67phox upon phosphorylation

(Panday, Sahoo et al. 2015).

The physiological role of the production of these reactive species diversity was also

investigated. Babior and Klebanoff’s research established that due to their high

toxicity, reactive species are part of the host defence mechanism to kill pathogens

(Babior, Kipnes et al. 1973, Klebanoff 1975). Evidence of their biological importance

is illustrated by children affected with chronic granulomatous disease (CGD), a rare

genetic disease where reactive species are not produced due to a NOX mutation. Due

to the lack of ROS, young patients suffer repetitive bacterial and fungal infection of

the skin or the lung, and may not reach adolescence (Curnutte, Whitten et al. 1974,

Holland 2010).

39

Figure 1.5: Overview of the source of ROS in eukaryotic cells. ROS are in red

while enzymes are in grey.

40

1.2.2 Oxidative damage

ROS are very toxic to organisms as they need to pair with other molecules to gain

stability. Consequently they attack many biomolecules such as lipids, nucleic acids,

proteins and carbohydrates resulting in various biological damages (Valko, Leibfritz

et al. 2007). These damages caused by ROS are referred as oxidative stress and are

due to excessive levels of ROS.

DNA and RNA undergo oxidation which can cause strand breaks and mutations both

of which may be responsible for ageing and carcinogenesis. This oxidation occurs in

components of these nucleic acids such as bases; for instance, guanine base is

oxidised in 8-hydroxydeoxyguanisine, a biomarker of DNA damage. Mitochondrial

DNA is more targeted by ROS than nuclear DNA due to its proximity to the electron

chain transport. Similarly, RNA is more sensitive than DNA as it is composed only of

one strand and does not have DNA repair mechanisms. Lipids are also modified by

oxidation. Essentially, a hydrogen atom is abstract from the double bonds of a

polyunsaturated fatty acid which thus react with free radicals. This new lipid peroxyl

radical formed remove the hydrogen atom of another fatty acid starting a chain

reaction and forming a lipid hydroperoxide. This change of lipids cause cell membrane

dysfunction and loss of signal transduction due to inactivation of receptor and

enzymes. In addition, lipid hydroperoxide can produce malondialdehyde (MDA) or 4-

hydroxy-2-nonenal (HNE), both carcinogenic and mutagenic (Esterbauer, Schaur et

al. 1991). As regards of proteins, many oxidative modifications can occur leading to

inactivation, degradation, structure modification and thus disorders in signalling

pathways. Modifications are usually based on the sulphur group of cysteine (Cys) and

methionine amino acids through thiol oxidation, in the carbonyl group leading to

carbonylation and tyrosine amino acids via nitration (3-nitrotyrosine) (Valko, Leibfritz

et al. 2007). Finally, carbohydrate oxidative modifications lead to production of

advanced glycation end products (AGE) which are associated with diabetes, cancer

and ageing diseases.

41

1.2.3 Antioxidants

To protect from the harmful effect of ROS, aerobic organisms have developed

antioxidant defences which either eliminate these species or prevent their formation.

The amount of reactive species inside the cells is maintained through redox

homeostasis, avoiding oxidative damage. A decrease in antioxidant defence or an

excess production of reactive species will lead to an imbalance and may potentially

lead to oxidative damage.

According to a recent update from Halliwell, a pioneer in the antioxidant field, an

antioxidant is “any substance which significantly delays, prevents oxidation or

removes oxidative damage to a target molecule” (Halliwell 2007). There are a wide

range of antioxidants, each with different targets, mechanisms and efficiencies, some

of which cooperate together (Halliwell 2013).

Antioxidants can be enzymatic:

Superoxide dismutase

SOD reduces O2.- to H2O2 and exists in three forms: the cytoplasmic (SOD1);

the mitochondrial (SOD2) and the extracellular one (SOD3). They all require

either Cu/Zn (SOD1 and 3) or Mn (SOD2) to catalyse their reaction (Fukai and

Ushio-Fukai 2011). SODs work in association with catalase and peroxidases

which in turn can reduce H2O2 (see Figure 1.5).

Catalase

Catalase promotes the dismutation of H2O2 into two molecule of H2O and O2

using a heme iron as an electron donor (Kirkman and Gaetani 2007).

2H2O2 2H2O + O2

Peroxidases

Similar to catalases, peroxidases are heme proteins which use iron as an

electron donor and H2O2 or organic peroxide as substrates (Khan, Rahmani et

al. 2014). Among them, glutathione peroxidase (GPx) transforms H2O2 into

water using GSH but also needs the presence of the cofactor Selenium

(Rotruck, Pope et al. 1973). Selenium is an essential trace mineral, in which

dietary deficiency can lead to pathological conditions such as atherosclerosis

(Rayman 2000).

2GSH + H2O2 GSSG +2H2O

42

Peroxiredoxins (Prxs) are also part of this and will be more discussed in further

detail in part 1.3.4.

Thioredoxin

Thioredoxin (Trx) is a ubiquitous oxidoreductase of 12kDa which is the major

thiol antioxidant system. This enzyme reduces disulphide bonds or oxidised

dithiol in proteins using NADPH as an electron donor, and Trx reductase

(TrxR) as an enzyme to recycle Trx to its reduced form (Lu and Holmgren

2014). See reaction in 1.3.4.

Glutaredoxin

Glutaredoxins (Grx) are small protein similar to Trx which reduce disulphide

bonds and will be discussed in further detail in part 1.3.4.

Antioxidants can also be non-enzymatic:

Glutathione

The tripeptide glutathione (GSH, γ-glutamyl-cysteinylglycine) is the main

intracellular non enzymatic thiol antioxidant. This molecule is mainly produced

in the liver, the detoxifying organ, through two cytosolic enzymes: γ-

glutamylcysteine synthetase (GCS) which catalyse the formation of y-

glutamylcysteine from glutamate and cysteine and GSH synthetase which

catalyse the formation of GSH from y-glutamylcysteine and glycine (Meister

and Anderson 1983). Its production is limited by the availability of free cysteine

in the environment (Lu 2013). In mammals, 90% glutathione is in the cytosol

(1 to 10mM) while less than 1% is in the oxidised form, GSSG (Dalle-Donne,

Rossi et al. 2009). The ratio of GSH/GSSG indicates the redox state of the cell

and intracellular it is generally at 100:1 (Cooper, Pinto et al. 2011).

Vitamins and cofactors

Finally, antioxidants can be provided by the diet (Carocho and Ferreira 2013).

For instance, flavonoids, carotenoids, vitamin E and C are present mainly in

photosynthetic food (fruit, vegetables, grains). These molecules act as

scavengers by catching electrons and transferring the radical property to

themselves. The new species that are formed are stable and allow elimination

of the reactive species (Han, Zhang et al. 2012, Jiang 2014). Minerals and

cofactors such as selenium, zinc and copper are also important elements

43

found in the diet and help the different antioxidant enzymes to function

properly.

44

1.2.4 ROS in the inflammatory context

The relationship between ROS and inflammation is ambiguous and particularly of

interest in chronic inflammatory diseases. In fact the toxic effect of ROS is not the only

phenomenon involved in the inflammatory process but other functions played by ROS

have been described.

Studying the effect of H2O2 and thiols in the replication of human immunodeficiency

virus (HIV) in human cell line, two research teams came to the same conclusion: H2O2

can activate NF-κB but also HIV-Long terminal repeat sequence (LTR) (Schreck,

Rieber et al. 1991, Schmidt, Amstad et al. 1995) and in opposition intracellular thiols

and antioxidants (GSH) block this NF-κB and HIV-LTR activation potentially by

quenching the ROS (Staal, Roederer et al. 1990). Furthermore, Droge et al.

demonstrated that GSH could modulate an anti-inflammatory effect or a pro-

inflammatory effect through NF-κB depending on the ratio of reduced GSH and

oxidised GSSG (GSH/GSSG) which determines the redox state of the cell (Mihm,

Galter et al. 1995).

This regulation of NF-κB by ROS was also reported in a variety of cell lines and

studies; in cardiomyocytes cultures (Eisner, Criollo et al. 2006), in human alveolar

macrophages following bone marrow transplantation (Blackwell, Christman et al.

2000), in mesangial cells (Satriano and Schlondorff 1994), in carcinoma cells (Wang,

Huang et al. 2007) and most recently in liver cells infected with a virus (Narayanan,

Amaya et al. 2014). It has to be noted that though most studies demonstrated that

ROS act as pro-inflammatory molecules some studies showed contrary effect or even

not effect at all meaning that the response of NF-κB to reactive species was

dependent on others factors (Gloire, Legrand-Poels et al. 2006, Oliveira-Marques,

Marinho et al. 2009). The role of endogenous GSH will be thus further investigated in

this study (Chapter 3).

This relationship between ROS and inflammation was also reinforced by a study

demonstrating that a number of antioxidants and oxidants genes are under regulation

by NF-κB. Those include SOD, Trx, NOX, and XO (Morgan and Liu 2011).

More recently, the role of ROS as a direct activator of NLRP3 activation has been

investigated (Abais, Xia et al. 2015) (Harijith, Ebenezer et al. 2014). NLRP3 is part of

the inflammasome an important complex allowing the production of pro-inflammatory

cytokines such as Il-1β and Il-18. This complex has also been associated with many

pathologies (e.g. Gout, multiple sclerosis and neurodegenerative diseases) cited

previously to be linked with oxidative stress and inflammation (Guo, Callaway et al.

2015).

45

All these different studies demonstrate that ROS are not only responsible for damage,

but are also important in mediating inflammatory responses. In-vivo studies were

performed and demonstrated that antioxidants could lower the inflammation

response. For instance, Blackwell et al. injected rats with an endotoxin to stimulate

NF-κB in the lung and could reduce this activation when rats were beforehand treated

with N-acetylcysteine (NAC) a precursor of GSH (Blackwell, Blackwell et al. 1996).

As expected, a multitude of clinical trials using antioxidants as therapeutic molecules

took place and still are ongoing. A number of different antioxidants were tested and

in particular NAC. NAC was preferentially used in trials as GSH is less stable due to

intestinal enzyme degradation (Witschi, Reddy et al. 1992, Schmitt, Vicenzi et al.

2015). A sample of clinical trials has been summarised in table 1.2. Despite what has

been observed in cells and in vivo studies, most of the clinical trials into antioxidant

therapies have been inconclusive. Only, a few disorders were improved with NAC but

mainly when it was applied locally (Meyer, Buhl et al. 1994, Blackwell, Blackwell et al.

1996). In fact, some studies have shown a deleterious effect on the health of

volunteers. One clinical trial in 2011 looked at the effects of selenium and Vitamin E

in preventing prostate cancer. These compounds were given to healthy volunteers

and were found to actually increase the risk of prostate cancer (Klein, Thompson et

al. 2011).

The failure of antioxidant trials have been blamed on three main reasons (Dodd, Dean

et al. 2008, Steinhubl 2008, Cocheme and Murphy 2010). First, the therapies used

ROS scavengers leading to non-specific responses; the development of direct

inhibitors of the enzymes which produce ROS, or of oxidised molecules may be more

effective. Secondly, antioxidant treatment in established diseases may be too late to

avoid, and certainly reverse, symptoms. In fact, Blackwell et al. reported a positive

effect in rats when NAC was injected before the endotoxin (Blackwell, Blackwell et al.

1996). Thirdly, oxidation level may differ between diseases and even between

individual patients so tools to detect the oxidation level should be developed to

establish this before treatment with antioxidants.

To conclude, it is clear that ROS and inflammatory pathways are entangled but the

redox mechanisms underlying an inflammatory process remain unclear and may be

a barrier to improve chronic inflammatory disease therapy. Similarly, there is a need

for in vivo biomarkers of oxidative stress to allow identification of those patients which

are more likely to benefit from therapies designed to reduce oxidative stress. This

aspect will be investigated further in this study in Chapter 6.

46

Table 1.2: Examples of clinical trials testing the effect of NAC/GSH.

PATHOLOGY

TARGETTED YEAR

ANTIOXIDANT

USED PATIENTS

LENGTH OF

TRIAL RESULTS

Chronic obstructive

pulmonary disease and

chronic bronchitis

(Johnson, McEvoy et

al. 2016)

2016 Oral NAC 130 8 weeks No benefit

Autism spectrum

disorder (Wink, Adams

et al. 2016)

2016 Oral NAC 31 12 weeks No

improvement

Postresection liver

failure (Grendar,

Ouellet et al. 2016)

2016 Infusion of NAC 206 No benefit

Type 2 diabetes

(Szkudlinska, von

Frankenberg et al.

2016)

2016 Oral NAC 130 4 weeks No

improvement

Pulmonary sarcoidosis

(Hamzeh, Li et al. 2016) 2016 Oral NAC 11 8 weeks

No

improvement

Coronary artery

surgery (Erdil, Eroglu

et al. 2016)

2016 Localised NAC 82 3 day

preoperation Improvement

Alveolar inflammation

in people exposed to

asbestos (Alfonso,

Franklin et al. 2015)

2015 Oral NAC 66 4 months No

improvement

Raynaud's

phenomenon (RP)

secondary to systemic

sclerosis (SSC)

(Correa, Mariz et al.

2014)

2014 Oral NAC 42 4 weeks No

improvement

A myocardial infarction

(Talasaz, Khalili et al.

2014)

2014 Oral NAC 98

3 days

following

operation

Positive effect

in biomarkers

Cystic fibrosis(Griese,

Kappler et al. 2013) 2013 Inhaled GSH 153 6 months

No

improvement

Chronic hepatitis b

(Shohrati, Dermanaki et

al. 2010)

2010 Oral NAC 43 45 days No

improvement

Hypertensive patients

with type 2

diabetes(Martina,

Masha et al. 2008)

2008 Oral NAC +

arginine 24 6 months Improvement

Idiopathic pulmonary

fibrosis (Demedts,

Behr et al. 2005)

2005 Oral NAC 182 12 months Low

improvement

ARDS (Bernard,

Wheeler et al. 1997) 1997

Intravenous

infusion NAC 6 10 days

Low

improvement

Hepatic cirrhosis (Cook

and Sherlock 1965) 1965 Oral GSH 20 28 days

No

improvement

47

1.3 Redox regulation in inflammation

1.3.1 Redox signalling by ROS

The relationship between ROS and inflammation is complex and requires further

study to fully understand whether oxidative stress is a cause or an effect of

inflammation. Importantly, ROS function as cell signalling molecules. Cell signalling

refers to the communication between cells to allow an organism to adapt to new

conditions and environment. Classically, receptors at the cell surface capture

information in the form of extracellular signals which are then transferred and

integrated in the nucleus (Alberts 2002). This communication is particularly observed

during cell development, in the nervous system with the expansion of axons and

synapses in neurons but it also advanced in immune response as discussed

previously in 1.1.2.3. After an extracellular molecule binds to its target receptor, the

signal is usually transmitted through second messengers which are substances that

mediate cellular activity by modifying the protein function. Ca2+ and Phosphorus (Pi)

are particularly well known second messengers (Berridge, Bootman et al. 2003,

Michigami 2013). Similarly, and despite their noxious effects, ROS can also act as

signalling molecules. This image of ROS as second messengers was controversial

10 years ago because of their high reactivity and involvement in many pathologies

(D'Autreaux and Toledano 2007). However, the increase of studies in redox biology

has changed this dogma and nowadays it is accepted that too many ROS lead to

oxidative damage but too little lead to an impairment of signalling pathways Figure

1.6 (Brieger, Schiavone et al. 2012). Two mains discoveries led to this conclusion: the

presence of NOX in a variety of non-phagocytic cells and the ability of ROS to trigger

different signalling pathways.

In 1989, the presence of a soluble component of NOX in non-phagocytic cells was

identified (Pick, Kroizman et al. 1989). It has been reported since that NOX is present

in a diversity of cell types such as epithelial cells, endothelial cells, and neurons and

is responsive to various stimuli such as growth factors or exogenous molecules

(Bedard and Krause 2007, Jiang, Zhang et al. 2011). The main difference with

phagocytic NOX is that the amount of O2- produced are lower and intracellular

(Lambeth 2004). According to Valko and colleagues, one third of ROS is produced by

NOX in non-phagocytic cells compared to neutrophils cells (Valko, Leibfritz et al.

2007). This physiological low level of ROS production could explain a biological role

of ROS in cell function in opposition with a high level to kill pathogens.

48

Reactive species have also been established to be responsible for signalling

pathways (Forman, Maiorino et al. 2010). Among all the existing ROS, H2O2 is the

most likely to be thought of as a candidate second messenger (Stone and Yang 2006).

It is often considered as a mild oxidant and therefore less unstable than other ROS.

It can easily diffuse through cell membranes using specific aquaporin channels

(Bienert, Moller et al. 2007). The first evidence of a potential signalling role for H2O2

came to light in the early nineties with the discovery that it could regulate NF-κB as

mentioned previously (Schreck, Rieber et al. 1991). Another major discovery was

shown in a study of platelet derived growth factor (PDGF): H2O2 was required to

stimulate rat vascular smooth muscle cells with PDGF via downstream signalling by

mediating tyrosine phosphorylation, mitogen-activated protein kinases activation

(MAPK) and chemotaxis (Sundaresan, Yu et al. 1995).

Since then, H2O2 has been studied in several cell processes (Valko, Leibfritz et al.

2007, Sies 2014). It can activate or deactivate many signalling molecules, such as

extracellular signal-regulated protein kinase 2 (ERK2), a MAPK (Guyton, Liu et al.

1996) and protein tyrosine phosphatases which themselves control a variety of

signalling pathways (Meng, Fukada et al. 2002). It is also involved directly in the

activation of STAT1 and STAT3, which are important in cell signalling after stimulation

by growth factors and cytokines, and also JAK2 and TYK2 (Simon, Rai et al. 1998).

H2O2 can also regulate a large variety of transcription factors. For example Nuclear

factor (erythroid 2-derived)-like 2 (Nrf2), which is involved in physical and chemical

stress responses (Ning, Mo et al. 2010), Foxa2 , which is involved in cell replication

and development (Zhang, Ji et al. 2013), AP-1 and CREB involved in differentiation,

proliferation and apoptosis response (Jaramillo and Olivier 2002).

H2O2 is the main signalling molecule among the ROS family however others reactive

species can also play physiological roles. For example, 1O2 can activate MAPK

involved in p38 and JNK which are both important in apoptosis, proliferation and

differentiation (Klotz, Pellieux et al. 1999).

Thus, ROS are involved in different cellular functions. They are responsible for co-

operating with the phosphorylation and calcium signalling pathways and are involved

in immune responses, cell-cell adhesion, cell proliferation, metabolism, aging, and cell

death.

49

Figure 1.6: ROS are signalling molecules when produced at moderate levels.

Scheme from Brieger et al. (Brieger, Schiavone et al. 2012).

50

1.3.2 Thiol oxidation

These signalling roles of ROS are dependent on the quantity, length, and localisation

of ROS production but most of all they imply the reversibility of the oxidative

modifications induced by ROS in biological samples (Brieger, Schiavone et al. 2012).

This reversibility is the key for the transition of a message as irreversible modifications

belong to the field of oxidative damage. Several different oxidative modifications of

proteins exist (as mentioned previously in section 1.2.2) such as nitration, targeting

tyrosine amino acid (Radi 2013), carbonylation, targeting many amino acid side

chains (Suzuki, Carini et al. 2010) and thiol oxidation, targeting cysteine (Cys). Both

nitration and carbonylation are normally irreversible, although recent evidences

suggests potential regulatory roles (Cai and Yan 2013). Instead, thiol oxidation can

be reversible and is the main post-translational modification. In fact, the main target

sensitive to ROS is the thiol group, a sulfhydryl group (-SH; also called mercaptan),

which is part of Cys residues, one of the 20 amino acids (Figure 1.7). The sensitivity

of thiol toward ROS is due to the chemical properties of sulphur: its electron

configuration allows it to gain or lose many electrons leading to a switch in oxidation

states from -2 to +6. The thiol in cysteine can be fully reduced (-2), and is therefore

very nucleophilic, enticing a range of oxidation reactions (Jacob, Giles et al. 2003,

Poole 2015). In comparison, the methionine, the only other amino acid with a sulphur,

has a different oxidation state which is less ionisable, and is therefore less subject to

redox changes. In fact, new insights are actually showing that methionine also has an

antioxidant role and potential regulatory functions (Drazic and Winter 2014, Wani,

Nagata et al. 2014).

Interestingly Cys is one of the least abundant amino acids in the human body but is

also the most conserved within species, stating to the specific role of thiol in biological

functions as a cofactor and structural chaperone (Fomenko, Marino et al. 2008,

Marino and Gladyshev 2010). The sensitivity of thiols to redox is complex and it is still

a challenge today to identify redox-regulatory cysteines. This property depends on a

few factors: the ionization of the thiol in the protein which is defined by its pKa, which

itself is defined by the molecular environment (acidity for instance). To give an idea of

the order, thiols in proteins usually have a pKa of 8-9 (SH), while the subset of redox-

sensitive thiols have a pKa below 7 (S-). Furthermore, if a pKa is low it has more

chance of being ionisable and therefore redox sensitive (Winterbourn and Hampton

2008, Rudyk and Eaton 2014). The microenvironment is a strong limitation of thiol

oxidation. It allows the thiol in the cytoplasm to be kept in a free-state (ionisable)

(Paget and Buttner 2003). Different studies have shown that each cell compartment

51

has a different redox state which depends on the ratio between reduced glutathione

(GSH) and oxidized GSH (GSSG), the GSH:GSSG ratio, and the ratio between

reduced and oxidised cysteine. Classically, cytoplasmic proteins contain mostly free

thiol (=reduced thiol) as the environment is strongly reducing due to the high

concentration of glutathione (GSH). On the contrary, very little free thiol is found in

extracellular proteins which are in an oxidising environment; proteins of the plasma

membrane are at the interface between these two environments (Ghezzi, Bonetto et

al. 2005) (Banerjee 2012). Finally, another important factor is the accessibility of ROS

to cysteines which is influenced by the structure of the protein but also the spatial

proximity of the target thiol to the reactive species source.

The two major thiol modifications are the intramolecular disulphide bond formation

(Cys-Cys-Protein) and glutathionylation (Cys-GSH). However, other reversible redox

states have been described including cysteinylation with free cysteine, S-nitrosylation

(Cys-SNO), S-sulfenylation (Cys-SOH) and S-sulfinylation (Cys-SO2H). This is

illustrated in Figure 1.7. S-sulfonylation (Cys-SO3H) is the last stage of oxidation and

is non-reversible. Consequently, sulfonylation belongs to oxidative damage rather

than signalling. This has been shown in different pathologies, such as multiple

sclerosis where S-sulfonylation is associated with disease duration (Pieragostino, Del

Boccio et al. 2013).

The diversity of thiol modifications implies to a strong redox dynamic within the cell.

Disulphide dimerization

Disulphide dimerization is a mixed disulphide exchange that forms between two

cysteines from the same protein. This mechanism is stable and is very important in

folding and maintaining the secondary or tertiary structure of the protein (Nagy 2013).

It often happens in oxidising environments, such as the endoplasmic reticulum

compartment during the folding process (Braakman and Hebert 2013), but is also

present in the extracellular compartment. The formation or removal of disulphide

bonds by changing the conformation of the protein can also change the functional

state of the protein, and is a post-translational modification. This modification is

particularly studied in the domain of cell surface receptors and in the activation of

transcription factors. For instance, this has been well characterised for erythropoietin

receptor (EPO-R) which require receptor dimerization to mediate signal transduction

(Watowich, Hilton et al. 1994).

52

Glutathionylation

Glutathionylation is the formation of a mixed disulphide exchange between a cysteine

in a protein and the cysteine of GSH (PSSG). This reaction is thermodynamically

reversible and can be formed by direct oxidation depending on the ratio GSH/GSSH

(equation 1) or catalysed by thiol-disulphide exchange (equation 2) (Ghezzi 2013).

Equation 1: PSH + GSH PSSG

Equation 2: PSH +GSSG PSSG+ GSH

Glutathione S-transferase (GST) or glutaredoxin enzymes (Grx) can performe

glutahionylation of a protein while deglutathionylation can be catalysed by Grx ,

sulfiredoxin (Srxn) or protein disulphide isomerase (PDI) (Grek, Zhang et al. 2013)

(Kalinina, Chernov et al. 2014).

There are also other possible mechanisms to form glutathionylated proteins with for

instance S-nitrosothiols: PSNO +GSH PSSG +HNO.

Glutahionylation can occur during oxidative stress as a protective mechanism but is

also observed in physiological conditions indicating a regulatory role of this reversible

modification (Dalle-Donne, Rossi et al. 2009). In fact, glutathionylation can directly

activate or inhibit proteins. For instance, GST catalyses the glutathionylation of Kelch-

like ECH-associated protein 1 (Keap1), an inhibitor of Nrf2 (Carvalho, Marques et al.

2016). Therefore, glutathionylation regulates the activation of Nrf2. Similarly STAT3,

a transcription factor involved in many signalling process including the inflammatory

response by inducing the transcription of cytokines, is regulated by glutathonylation

(Xie, Kole et al. 2009). When glutathionylated, STAT3 leads to a decrease in the

cascade signalling following IL-6 activation to activate NF-κB and MAPkinase

pathways.

S-sulfenylation and S-sulfinylation

Finally, S-sulfenylation and S-sulfinylation are thiol modifications which are under

current investigation (Lo Conte and Carroll 2013). Sulfenylation acts mainly as an

intermediate stage before the structural or functional change of a protein (Beedle,

Lynham et al. 2016). These two modifications are very difficult to probe and assess,

therefore current techniques and methods of study focuse in computational models

and prediction of outcomes (Lo Conte, Lin et al. 2015).

53

Figure 1.7: Thiol oxidation modifications in proteins (adapted from Leonard et al.

(Leonard and Carroll 2011)). A. Chemical structure of cysteine. B. Thiols in proteins

can undergo a series of ROS/RNS modifications. This is possible if thiols are

accessible and have a low pKa. Red indicate oxidative damage (irreversible reaction).

54

1.3.3 Evidence of thiol oxidation modification in inflammation

It is becoming evident that reversible oxidation of protein thiol play a role in the

regulation of the inflammatory response in a similar manner to phosphorylation to

trigger an appropriate response to the stimulus.

For instance, HMGB1 is one example illustrating the importance of thiol modification

in inflammatory responses. This protein is secreted by monocytes in response to an

inflammatory stimulus and participate to the immune response, although it should be

noted that this occurs later than secretion of classical cytokines such as IL-1β and

TNF (Gardella, Andrei et al. 2002). Once secreted, HMGB1 attracts inflammatory

cells, for instance neutrophils, encourages maturation of myeloid and plasmacytoid

cells and recruits stem cells permitting their proliferation (Messmer, Yang et al. 2004,

Dumitriu, Baruah et al. 2005). In 2010, the role of the three cysteines (C23; C46 and

C106) that are contained in HMGB1 was highlighted for the first time via the

demonstration that the thiol in C106, in its reduced form, is associated with increased

TLR4 signalling (Yang, Hreggvidsdottir et al. 2010). Finally, in 2012, using endotoxin

stimulated RAW 264.7 cells, the same team demonstrated via Mass Spectrometry

that HMGB1 had to form an intramolecular disulphide bond between C23 and C45 in

addition to the reduced thiol at C106 to stimulate cytokine production by TLR4

activation (Venereau, Casalgrandi et al. 2012, Yang, Lundback et al. 2012).

Recently, Stottmeier and colleagues have demonstrated that MyD88-dependent NF-

κB signalling pathway is controlled by the redox regulation of MyD88 cysteines

through thiol disulphide exchange with a member of Trx family (Stottmeier and Dick

2016).

Evidence of glutathionylation modified proteins have also been reported in immune

cells. In fact, a recent assay developed by Mullen and colleagues in human

monocytes cells has detected 38 secreted proteins and 55 intracellular undergoing

glutathionylation giving an idea of the importance of this regulation in immune

response (Mullen, Seavill et al. 2015).

A signalling network involving H2O2 and the antioxidant Peroxiredoxin 2 (Prx2) have

recently been highlighted to modulate STAT3 activity (Sobotta, Liou et al. 2015).

Essentially, Prx2 transduces the signal received by H2O2 and transforms it by thiol

disulphide exchange to oligomerise STAT3 leading to its inactivation.

Furthermore, the emergence of redox sensitive thiols identified in receptors and

enzymes at the surface of immune cells illustrates a mechanism of regulation of those

proteins by thiol modification during the inflammatory process (Metcalfe, Cresswell et

al. 2011).

55

1.3.4 Thiol oxidoreductases

Oxidoreduction of protein thiol-disulfides is catalysed by a variety of enzymes called

thiol oxidoreductases. These enzymes usually contain one or more catalytic redox

active cysteines and can have important physiological functions (Marino and

Gladyshev 2009) (Varlamova, Gol'tiaev et al. 2013). In this work, they have been

separated into two groups: the thioredoxin (Trx) fold-like proteins and the peroxidase

catalytic proteins.

1.3.4.1 Thioredoxin fold like protein

Trx fold-like proteins share one main characteristic. They all have a Trx fold-like

structure which consists of a simpler version of the Trx structure: a central core of four

antiparallel β-strands surrounded by three α-helices with the catalytic motif at the

surface of the α2-helix (Berndt, Lillig et al. 2008) (Collet and Messens 2010). This

motif is highly conserved across species. It comprises an attacking cysteine and a

resolving cysteine (CysR), stabilising the substrate, typically Cys-X-X-Cys with X

representing any amino acid (Fomenko, Marino et al. 2008). The two cysteines of the

redox active centre can shift between dithiol and disulphide forms, performing a signal

relay between redox components (Pedone, Ren et al. 2004). Typically, this family

uses an electron donor, in general NADPH, to reduce or oxidise a substrate and a

cofactor, which is often the isoalloxazinic ring of the Flavin Adenine Dinucleotide

(FAD) enzyme.

These enzymes are ubiquitous and found in all living organisms, from bacteria to

plants and mammals. They include thioredoxin (Trx), Grx, protein disulphide

isomerase (PDI), and the sulfhydryl oxidases (SOXs) which catalyse dithiol–

disulphide exchange reactions and therefore can regulate thiol modification.

Thioredoxin

Trx was first isolated from E.Coli in 1964 and was described as a hydrogen donor to

reduce deoxycytidine diphosphate from the ribonucleotide cytidine diphosphate

(Laurent, Moore et al. 1964). The mammalian structure of Trx was then determined

by Holmgren in 1975 but have been completed since (Holmgren, Soderberg et al.

1975). It consists of a central core of five β-strands surrounded by four α-helices with

the catalytic motif at a surface of the helice α2: Cys-Gly-Pro-Cys. The proline helps to

promote the reducing power of Trx while Glycine help to maintain the conformation of

56

the active site. All Trx in nature have the same three-dimensional structure (Collet and

Messens 2010).

The Trx catalytic system is composed of Trx, NADPH and Trx reductase (TrxR)

(Holmgren 1985). In mammals it exists as two Trx antioxidants systems: the cytosolic

Trx1 and the mitochondrial Trx2 (Lu and Holmgren 2014). The reaction consists of

bimolecular nucleophilic substitution reaction (SN2), which is the transfer of the

disulphide bond from the substrate protein to Trx. Trx becomes oxidised and is

reduced using TrxR via a transfer of electron from NADPH to TrxR to the redox active

disulphide (Figure 1.8A).

Trx is involved in many signalling pathways and could target many nuclear proteins

(Wu, Jain et al. 2014). For instance, Trx inhibits ASK1, a MAP3K which is involved

the JNK pathway (Saitoh, Nishitoh et al. 1998). An updated study has recently shown

that the reduced thiol of the redox catalytic centre of Trx could interact with ASK1,

leading to its inhibition (Kosek, Kylarova et al. 2014).

Glutaredoxins

Grx are small proteins between 9 and 15kDa which exist in two forms; monothiol (Cys-

X-X-Ser) with no enzymatic activity and dithiol (Cys-X-X-Cys) (Lillig and Berndt 2013).

Grx utilise the reducing power of glutathione to catalyse disulphide reduction and

therefore process directly to glutathionylation/deglutathionylation of proteins (Lillig

and Berndt 2013). It exist 4 Grxs in mammals: Grx1, Grx2 Grx3 and Grx5 which are

all dithiol. They are located intracellularly in the cytosol, mitochondria and nucleus,

but can also be secreted. They also have a catalytic system which consists of Grx,

NADPH and Grx reductase (Figure 1.8B) (Fernandes and Holmgren 2004). GrxR is

homologous to TrxR, however for enzymatic activity, it requires GSH as a substrate

donor. Due to this particularity, Grx are the main actors to rearrange to a protein and

therefore to glutathionylation.

Grx also have signalling roles. It has been shown that Grx1 was required to have an

optimal TLR4 signalling induction NF-κB pathway by deglutathionylated Traf6, an

important intermediate molecule (Chantzoura, Prinarakis et al. 2010).

Grx and Trx work in parallel with independent activity. In addition, they both can act

as back up for each other, with Trx using GrxR as an electron donor and vice versa

(Kalinina, Chernov et al. 2014).

Sulfhydryl oxidase

Sulfhydryl oxidase (SOX) catalyses the formation of disulphide bonds of free thiols

using molecular oxygen as an electron donor, which is then reduced to hydrogen

57

peroxide as shown in Figure 1.8C (Faccio, Nivala et al. 2011). They carry the Cys-X-

X-Cys motif and are flavin-dependent enzymes.

Different families exist within the SOXs, those of which include the ERV/ALV family

and the Quiescin/SOX (QSOX) family (Coppock and Thorpe 2006). They have a

variety of substrates such as GSH and thiols in protein.

These oxidoreductases play a role in structure and stability of proteins but can also

be secreted with potential antimicrobial function (Faccio, Nivala et al. 2011). They are

also involved in the structure of extracellular matrix and tissue regeneration (Thorpe,

Hoober et al. 2002).Recently in Drosophila, the redox signalling activity of SOXs was

perceived: Er01L, a SOXs, was required in the ER to form disulphide bond in the

Notch necessary for its activation and signalling in cell communication (Tien, Rajan et

al. 2008). Amusingly, SOX are particularly used in food and cosmetic industry to

improve the conservation of product by oxidising volatile thiols and protect flavours

(Faccio, Nivala et al. 2011).

Protein Disulphide Isomerase

Protein Disulphide Isomerase (PDI) catalyses disulphide formation, reduction and

isomerisation. They can modulate the structure of protein by rearranging disulphide

bonds which is particularly important in case of structure mistakes and misfolding.

Thus they represent one of the most abundant proteins in the ER where protein folding

occurs but they also can be freed in the nucleus, the cytosol, extracellularly and at the

cell surface (Shabab, Khan et al. 2014). In addition, PDI plays an important role in the

health and diseases (Benham 2012). In fact, the aggregation of misfolded protein lead

to pathologies such as in Alzheimer disease and cystic fibrosis (Wilkinson and Gilbert

2004). PDI are organised in five domains with four which are similar to Trx fold.

However only two contain the classic redox active site: Cys-X-X-Cys which allows PDI

to catalyse the formation of disulphide bonds if PDI is in the reduced form (PDI-(SH)2)

but also isomerises if PID is in the oxidised form (PDI-S2) .

Around twenty PDI exist in humans interacting with different proteins and substrates.

For instance ERp57 interacts preferentially with glycosylated substrates via

calnextrin, while ERp44 interact with adipoctenin, a secreted hormone of adipocyte

(Ellgaard and Ruddock 2005). Due to their role in the control of protein structure, they

can also participate in cell signalling (Laurindo, Pescatore et al. 2012).

58

1.3.4.2 Peroxidase Catalysis family

This group includes thiol enzymes reducing H2O2 or peroxide products. They include

Gpxs, Prxs, myeloperoxidase, or eosinophil peroxidase (Rhee, Kang et al. 2001)

(O'Brien 2000). They are also in constant communication with the Trx and Grx, which

they utilise as electron donors to proceed to downstream reactions (Bindoli, Fukuto et

al. 2008).

Peroxiredoxin

Prx family members protect against oxidative stress by transforming peroxides (H2O2,

organic peroxide, peroxynitre) into H2O, becoming themselves oxidised as a result

(Figure 1.8D). To proceed, they use a conserved redox-active cysteine (the

peroxidatic cysteine, CysP) with a pKa around 5-6.

In mammals, Prxs are highly abundant and can represent up to 1% of the total

proteins in the cell. In total, six Prxs encoded by six different genes are found in

different cell locations; Prx1, 2 and 6 are found in the cytosol, Prx3 in the mitochondria,

Prx4 in the endoplasmic reticulum, and Prx5 in the mitochondria, peroxisome and

cytosol. These mammalian Prxs are classified into three different types depending on

the position of the CysR to the CysP (Rhee 2016).

The typical 2-cys (Prx1, Prx2, Prx3 and Prx4) have a conserved CysR at the C

terminal forming intermolecular disulphides between two adjacent subunits of homo

dimeric proteins. Atypical 2-Cys (Prx5) have the CysR in the C terminus of same unit.

Finally, 1-cys Prx (Prx6) have the CysR on a different molecule which is not a Prx

(Hanschmann, Godoy et al. 2013, Rhee 2016).

All Prxs have the same catalytic reaction divided in different steps: Essentially, the

free thiol of CysP (CysP-SH) attacks the hydroperoxide substrate and generates

water, while itself becomes oxidised (CysP-sulfenic acid (CysP-SOH)). The CysR

(CysR-SH) attacks then this CysP-SOH forming an intra or inter subunit. This

disulphide bond is then recycled in CysP-SH using an electron donor such as

thioredoxin (Figure 1.8D) (Perkins, Nelson et al. 2015).

The catalytic activity depends upon the three dimensional form of Prxs. All Prxs

structure are similar and contain a Trx-fold domain with additional features (Wood,

Schroder et al. 2003). Atypical 2-cys exist as functional monomers, while the typical

2-cys and 1-cys exists as domain-swapped homodimers enzymes.

59

Glutathione peroxidase

GPx belongs to the peroxidase family which include myeloperoxidase, cited

previously in the respiratory burst. In mammals, 8 GPx are identified (Brigelius-Flohe

and Maiorino 2013). GPx1-4 and Gpx6 are all selenium dependent while Gpx 5, 7 and

8 are not. Despite their different structure and less than 20% homology, they share

the same catalytic centre which is composed of Seleniumcysteine (or Cysteine) – Gln-

Trp and Asn (Battistuzzi, Bellei et al. 2010). The enzymatic catalytic reaction of GPx

is a ping pong mechanism involving different steps: the enzyme is itself oxidized to

Compound I, which contains an oxyferryl (Fe(IV) = O) center and an organic cation

radical. The cation radical then undergoes a one-electron reduction, oxidizing the

substrate molecule and forming Compound II, which maintains the oxyferryl center

(Deponte 2013). Finally, Compound II is reduced back to the resting ferric state with

the concomitant one-electron oxidation of a second substrate molecule (Deponte

2013).

60

Figure 1.8: Catalytic reaction of thiol oxidoreductases. A. Thioredoxin reduces

disulphide bonds in protein. B. Glutaredoxin can promote deglutathionylation of

proteins. C. Sulfhydryl oxidase promote disulphide bonds formation. D. Peroxiredoxin

reduce hydrogen peroxide and uses Trx as an electron donor.

61

1.3.5 Oxidoreductases in Inflammation: Redoxkines

Thiol oxidoreductases do not only modulate the inflammatory response by controlling

redox reactions but can also exist in extracllular form and have cytokine- or

chemokine-like activities. In that case, thiol oxidoreductases have been defined as

“redoxkines” (Salzano, Checconi et al. 2014).

These properties were particularly observed in Prxs: in fact Prx1, Prx2 and Prx5 seem

to act as pro-inflammatory molecules while Prx4 and Prx6 seem to act as anti-

inflammatory molecules.

Secreted Prx1 interacts with TLR4/ Myd88 dependent pathway promoting TNF and

IL-6 secretion from macrophages and dendritic cells (Riddell, Wang et al. 2010). This

interaction seems due to the interaction of C83 with TLR4 when Prx1 is in a dimer or

tetramer form. Increase of Prx1 expression also correlate with progression and growth

tumour in prostate carcinogenesis (Riddell, Bshara et al. 2011).

Prx2 is released upon 24h LPS stimulation in a glutathionylated dimeric form that can

induce TNF production in a macrophages cell line (Salzano, Checconi et al. 2014).

Interestingly, Prx2 has been detected in elevated concentration in lymphocytes from

rheumatoid arthritis patient, when compared with healthy volunteers (Szabo-Taylor,

Eggleton et al. 2012). Similarly, Prx2 is expressed in elevated concentration in the

white matter lesions of chronic MS lesions correlating with an elevated level of

macrophage infiltration (Voigt, Scheidt et al. 2017).

Finally, Prx5 gene was up regulated in macrophages following LPS-induced MAPK

activation (Abbas, Breton et al. 2009).

Prx4 and Prx6 have anti-inflammatories properties; Prx4 can inhibit IL-1β in

chondrocyte suggesting a potential protecting role of Prx4 toward osteoarthritis a

degenerative joint chronic disease (Rao, Wang et al. 2017). While Prx6 appears to

have a protective role in MS by suppressing inflammation caused by oxidative stress

(Yun, Park et al. 2015). In fact, Prx6 seems to have anti-inflammatory properties. It

was shown to be able to inhibit MAPK pathway after induction with LPS in acute

kidney injury mice (Lee, Park et al. 2017).

Trx is also of a great interest as an inflammatory molecule. It has been found in

elevated concentration in association with many pathologies; in cancer tissues, in the

serum of arthritis and HIV patients, after angioplasty, or in chronic heart failure

(Nakamura, De Rosa et al. 1996, Lincoln, Ali Emadi et al. 2003) (Wahlgren and

Pekkari 2005). Furthermore, Trx was identified as a cell growth factor mediated by its

C73 (Gasdaska, Berggren et al. 1995) (Gasdaska, Kirkpatrick et al. 1996). In addition,

extracellular Trx can act as a chemoattractant of immune cells such as monocytes,

62

granulocytes and T lymphocytes via its C32 and C35 (Bertini, Howard et al. 1999). All

these properties lead to it being investigated as a potential anti-cancer target. Different

clinical trials in oncology have been performed using PX-12, a synthetic inhibitor

developed by Powis and colleagues although these have been unsuccessful so far

(Kirkpatrick, Kuperus et al. 1998, Baker, Adab et al. 2013).

Investigation into the release of Prx1, Prx2 and Trx from LPS stimulated macrophages

demonstrated that NAC and dexamethasone (DEX), an anti-glucocorticoid receptor

that reduces the inflammatory response, could lower the release of Prx1, Prx2 and

Trx in contrast to TNF which was only inhibited with DEX and not NAC (Checconi,

Salzano et al. 2015). These results supported the idea of using these thiol-containing

proteins as promising markers of oxidative stress during the inflammatory response.

Regarding other thiol oxidoreductases, Grx1 depletion in mice leads to diminution of

LPS induced inflammation in lungs and the activation of macrophages (Aesif, Anathy

et al. 2011). Extracellular PDI can modulate the activity of an integrin, a

transmembrane receptor interacting with the extracellular matrix (ECM), helping

neutrophil migration to the site of inflammation (Hahm, Li et al. 2013).

63

Aim of this project

Inflammation is the response of the body to eliminate pathogens, react to danger and

repair damaged tissues. Unsurprisingly its permanent activation leads to chronic

conditions, such as rheumatoid arthritis or atherosclerosis. The causes of this self-

activation are still unknown but these diseases are also associated with oxidative

stress. In fact, ROS are released during the inflammatory response and can damage

tissues which lead to inflammation and vice-versa causing a vicious cycle. However,

ROS are not only toxic species but can also act as signalling molecules co-operating

with the phosphorylation and calcium signalling pathways to trigger immune

responses mainly via thiol oxidation modification. In this study, we hypothesised that

thiol oxidation changes can affect the inflammatory response and therefore

investigation of those changes was required.

For this purpose, four lines of investigation were pursued:

1. Failure of antioxidant therapy leads to doubt about whether ROS act as pro-

inflammatory molecules while thiol antioxidants are anti-inflammatory. To

improve understanding of the mechanism mediated by thiols during inflammation,

the role of endogenous GSH, the main cellular thiol antioxidant, was investigated

in LPS-stimulated macrophages (Chapter 3).

2. Thiol oxidoreductases, the enzymes responsible for thiol modification, are

released from immune cells during inflammation and seem to have cytokine or

chemokine effects. Prx1, Prx2 and Trx, in particular, have been detected in the

secretome from macrophages following LPS-stimulation. We thus investigated if

these proteins undergo redox changes which could be associated with their

secretion and potential functions (Chapter 4).

3. To understand better how these proteins function in the extracellular environment

during inflammatory response, we attempted to identify potential protein targets

of oxidoreduction on the cell surface subjected to LPS stimulation (Chapter 5).

4. Finally, redox changes detected in Prx1, Prx2 and Trx proteins were tested as

biomarkers of oxidation in patient’s blood undergoing angioplasty following

coronary artery disease (Chapter 6).

64

Chapter 2

Materials and Methods

65

2.1 Instruments

Product Supplier

Centrifuge: Eppendorf centrifuge S810R A-4-62 4x1.1kg

Thermo Fisher Scientific

CKX41 inverted microscope Olympus

Film processor: SRX-101A Developer Konica Minolta

Hypercassette GE Healthcare Life Science

Incubator: Hera cell 150 Thermo Scientific

Microfuge R centrifuge Beckman Coulter

Mini centrifuge: Pico 17 Heraeus 24 x 1.5/2.0ml rotor Thermo Scientific

Mini Trans-Blot Cell Biorad

Mini-PROTEAN Tetra Vertical Electrophoresis Cell Biorad

Nanodrop ND-1000 Thermo Fisher

Neubauer Improved Haemocytometer Marienfield Superior

Optima MAX ultracentrifuge 130,000rpm Beckman Coulter

PCR instrument: TC-3000X Techne

Plate Reader : Synergy HT BioTek

Plateform rocker STR6 Science Lab

PowerPac Basic Biorad

qPCR machine: Stratagene MX3000 Agilent Technologies

Rotor TLA x 100 Beckman Coulter

SevenCompact pH Meter Mettler-Toledo

Ultrapure water supplier Adrona

Ultrawave ultrasonic bath Ultrawave

Vacufuge Eppendorf Concentrator Plus Thermo Fisher Scientific

Water bath: SUB Aqua 18 Plus Grant

Table 2.1: List of instruments used in this study

66

2.2 Chemicals and kits

Product Supplier

2-Iodoacetamide (IAA) Sigma–Aldrich

30% Acrylamide/Bis solution Bio-Rad

5,5’-dithiobis(2-nitrobenzoic acid) (DTNB) Sigma-Aldrich

Agarose Beads Pierce™ High Capacity NeutrAvidin™ Agarose

ThermoFisher Scientific

Ammonium Bicarbonate (NH4HCO3) Sigma–Aldrich

Ammonium Persulfate (APS) Sigma-Aldrich

Bovine Serum Albumin (BSA) Sigma-Aldrich

Bromophenol Blue Sodium salt (BBP) Sigma-Aldrich

Buthionine Sulfoximine (BSO) Sigma-Aldrich

Diethylene Triamine Pentaacetic Acid (DTPA) Sigma-Aldrich

Dimethyl Sulfoxide (DMSO) Sigma-Aldrich

Disodium hydrogen orthophosphate (Na2HPO4) Fisher Scientific

Dried skimmed milk Marvel original

Dulbecco’s Modified Eagle’s Medium (DMEM) D5796

Sigma-Aldrich

Dulbecco’s Phosphate Buffered Saline (PBS) Sigma-Aldrich

ECL Blotting Detection Reagents GE Healthcare Life Sciences

Ethanol Fisher Scientific

Ethylenediaminetetraacetic acid disodium (EDTA) Fisher Scientific

Glycerol Sigma-Aldrich

Glycine Sigma-Aldrich

Heat Inactivated Fœtal Calf Serum Sigma-Aldrich

HEPES Melford

Hydrochloric Acid (HCl) Fisher Scientific

Hyperfilm ECL GE Healthcare Life Sciences

Lipopolysaccharide from Eschericha coli 055:B5 List Biological Labs, Incorporated

Menadione Sodium Bisulfite (Menadione) Sigma-Aldrich

Methanol Fisher Scientific

67

Methoxypolyethylene glycol Maleimide (Maleimide- PEG)

Nanocs

miRNeasy Mini Kit Qiagen

Molecular weight ladder precision Bio-Rad

MTT Assay kit Sigma-Aldrich

N-(Biotinoyl)-N'-(Iodoacetyl) Ethylenediamine (BIAM)

Sigma-Aldrich

N-Acetylcysteine (NAC) Sigma-Aldrich

N-Ethylmaleimide (NEM) Sigma-Aldrich

Nitrocellulose blotting membrane (ProtainTM

Premium 0.45μM) GE Healthcare Life Sciences

NP-40 surfact-Amps Deterget solution Thermo Scientific

Opti-MEM I medium Gibco by Life Technology

PageRulerTM Plus Prestained Protein Ladder Thermo Fisher Scientific

Penicilin-Streptomicin (P/S) Thermo Fisher Scientific

Pierce BCA Protein Assay Kit Thermo Fisher Scientific

Potassium Chloride (KCl) Fisher Scientific

Potassium Dihydrogen Orthophosphate (KH2PO4) Fisher Scientific

PX 12 (2-[(1-methylpropyl)dithio]-1H-imidazole) Sigma-Aldrich

Roswell Park Memorial Institute (RPMI) 1640 medium

Sigma-Aldrich

Sequencing-grade modified trypsin Promega

Sodium Chloride (NaCl) Fisher Scientific

Sodium Dodecyl Sulphate (SDS) Sigma-Aldrich

Sucrose Fisher Scientific

Superoxide Dismutase (SOD) Sigma–Aldrich

Temed Sigma-Aldrich

Thiazolyl Blue Tetrazalium Bromide (MTT) Sigma-Aldrich

Recombinant Human TNF-α Peprotech

Tris 2-carboxyethylphosphine (TCEP), Bond Breaker solution

Thermo Fisher Scientific

Trizma base Sigma-Aldrich

Tween 20 Thermo Fisher Scientific

Table 2.2: List of reagents, chemicals and kits used in this study

68

2.3 Reagents and buffers

Reagents and solutions:

Reagent Working concentration Diluent

LPS 200μg/ml Distilled H2O

BSO 250mM Distilled H2O

NAC 0.5M Opti-MEM, pH7.4

APS 1M Distilled H2O

Menadione 500mM Distilled H2O

TNF 200μg/ml Distilled H2O

MalPEG 15mM Distilled H2O

NEM 1M Ethanol

DTT 1M Distilled H2O

IAA 10M Ammonium Buffer

PX-12 50mM DMSO

TCEP 2mM Ammonium Buffer

Table 2.3: List of reagents used in this study

Buffer:

Lysis buffer

NP-40 lysis buffer: 10mM Tris HCl, 150mM NaCl, 1mM EGTA, 1% NP-40, 1mM EDTA

in distilled water pH7.4

Electron Paramagnetic Resonance (EPR)

BMPO buffer: 1mM DTPA and 50mM of 5-tert‐butoxycarbonyl-5‐methyl-1‐pyrroline

N‐oxide (BMPO) with or without 200 U/ml SOD in PBS

MTT assay

MTT 10X Buffer: 5mg of MTT in 1ml of distilled H2O

69

MTT Stop Solution: 10% SDS in 0.01M HCL in distilled water

SDS-PAGE

Running gel buffer: 1.5M Tris HCl in distilled water; pH8.8

Stacking gel buffer: 500mM Tris HCl pH6.8 in distilled water

SDS-PAGE sample buffer (6X): 375 mM Tris-HCl; 1.2% of SDS; 60% glycerol,

0.006% of BPB, in distilled water; pH 6.8

Running buffer (10X -1L): 250mM Tris, 144.13g glycine, 1% SDS in distilled water;pH

8.3

Transfer buffer (1X -1L): 3.027g Tris base, 14.41g glycine, 200ml methanol in distilled

water

Western Blot

PBS for Western Blot (10X): 80g NaCl, 2g KCL, 14.4g Na2HPO4, 2.4g KH2PO4, in

distilled water, pH7.4

PBS-T: PBS 1X+ 0.05%Tween20

DNTB assay

Dilution buffer TE: 30mM Tris, 3mM EDTA in distilled water pH8.2

Lysis buffer for DTNB assay (TE+NP40): add 10% of NP-40 to dilution buffer TE

Membrane protein extraction

Homogenisation buffer: 10mM HEPES, 250mM Sucrose, 1mM EDTA in distilled water

Mass Spectrometry preparation

Ammonium Bicarbonate solution (50mM - 40ml): 158mg of Ammonium Bicarbonate

in 35ml dH2O – pH 7.9

Solubilising buffer 60%vol/vol methanol in 40%vol/vol ammonium bicarbonate: 6ml

methanol + 4ml ammonium bicarbonate

70

2.4 Antibodies

Target Name Dilution* Incubation

time

Primary antibody

Prx1 Polyclonal Rabbit-anti-Prx1 (from Dr. Eva Maria Hanschmann) (Godoy, Funke et al. 2011)

1:1000 2h at RT or

overnight at 4˚C

Prx2 Polyclonal Rabbit-anti-Prx2 (from Dr. Eva Maria Hanschmann) 1:1000

2h at RT or overnight at 4˚C

Prx4 Polyclonal Rabbit-anti-Prx4 (from Dr. Eva Maria Hanschmann) 1:1000

2h at RT or overnight at 4˚C

mouse Trx Polyclonal Rabbit-anti-mouse Trx (from IMCO corporation Ltd) 1:1000

2h at RT or overnight at 4˚C

human Trx Polyclonal Goat-anti-human Trx (from IMCO corporation Ltd) 1:2500

2h at RT or overnight at 4˚C

Stat3 Monoclonal Mouse anti-STAT3 (124H6 – from Cell Signaling Technology)

1 :1000 Overnight at

4˚C

Hsp70 Rabbit polyclonal anti-Hsp70 (ab79852) from Abcam

1 :1000 Overnight at

4˚C GAPDH

Monoclonal Rabbit anti-GAPDH (from Cell Signaling Technology)

1:1000 Overnight at

4˚C ATPase

Monoclonal Mouse anti-Alpha 1 Sodium Potassium ATPase (from Abcam)

1:5000 Overnight at

4˚C

HRP-conjugated

Rabbit IgG Goat-anti-Rabbit IgG (from Sigma-Aldrich)

1:25000 45min-1h Mouse IgG

Goat-anti-Mouse IgG (from Enzo Life Sciences Ltd)

1:5000 45min-1h Goat IgG

Rabbit-anti-Goat IgG (from Sigma-Aldrich)

1:50000 45min-1h Biotin

Streptavidine-POD conjugate (from Roche)

1:25000 Overnight 4˚C

* All dilutions were performed in 5% BSA/PBS-T

Table 2.4: List of antibodies used in this study

71

2.5 Software and analytic tools

1. Genesis v1.7.7

Genesis version 1.7.7 is a software package developed in 2002 using Java,

programming language, specifically designed for the analyses of microarray data

(Sturn, Quackenbush et al. 2002). It can hierarchically classify a large-scale data

according to expression pattern and group them into clusters. For this, it uses a

selection of filters and algorithms such as the k-mean, the principal component

analysis and hierarchical analysis to create a heat map.

In this study, data from microarrays were obtained by calculating the ratio of the gene

expression (gProcessed Signal) for each sample for each condition against the

average of the control group in an excel file (matrix) with genes in rows and different

conditions in columns. Once converted to a text file (tab-delimited flat files), data was

transferred to Genesis and clustered using the Hierarchical tool developed by Eisen

in 1998 (Eisen, Spellman et al. 1998). Basically, genes were linked as a tree heat map

according to the degree of similarity of their expression level versus control. Green

indicates decrease and red increase in the level of expression.

2. DAVID v6.8

The Database for Annotation, Visualization and Integrated Discovery (DAVID) version

6.8 was used to identify likely biological function, signalling pathways, tissue

expression or diseases linked to a list of genes (Huang da, Sherman et al. 2009). This

is performed by many algorithms utilising knowledge from genomic resources such

as PubMed, NCBI, BIOCARTA or SWISS-PROT. Millions of annotations from

thousands of species are reported making the accuracy of those studies impossible

to be checked and therefore a weakness of this software.

DAVID was used to analyse the clustered genes obtained by gene expression

microarrays (see part 2.10) and the proteins obtained by Mass Spectrometry (see

part 2.16).

Among the different analytic modules proposed, the Functional Annotation Chart was

selected so that the most enriched annotation terms in the list of genes of interest

were obtained. The drawback of this tool was that many similar or redundant terms

were obtained diluting potential key functions. Two annotation terms databases were

used: the Gene Ontology (GO)-term and the Kyoto Encyclopedia of Genes and

Genome (KEGG) pathways. GO-term classifies genes according to three features:

their molecular function (MF), where these genes are activated (cellular component

72

(CC)) and their biological process (BP). In comparison, KEGG pathways show

molecular interaction and reaction networks of genes.

Before analysis, different parameters were selected to narrow the information and are

shown in the table below:

Experiments Gene Microarray Mass Spectrometry

Identifier of genes Official_Gene_Symbol Uniprot_ID

Background Mus Musculus Mus Musculus

Module Functional Annotation Chart Functional Annotation Chart

Annotation GO-term Biological Process GO-term Biological Process

KEGG pathway KEGG pathway

GO-term Cell Component

Cut-off p-value (EASE score)< 0.05 p-value (EASE score)< 0.05

To calculate the p-value (Expression Analysis Systematic Explorer (EASE)-score),

DAVID uses a modified Fisher’s test looking at the significance of a term in the gene

list.

3. Interferome v2.01

Interferome is a web software program used to analyse a group of genes thought to

be part of the interferon (IFN) pathway (Rusinova, Forster et al. 2013). It can be used

to identify and discriminate which genes are regulated by one of the three interferons,

IFN1, IFN2 and IFN3, using checked published literature. The list of genes obtained

by microarrays is transferred to the website in the form of a text.file and analysed by

the Mus Musculus database where a total of 4166 Interferon Regulated Genes (IRGs)

were listed.

4. oPOSSUM v3.0

oPOSSUM identifies by statistics the over-represented transcription factor binding

sites (TFBS) and families present in DNA sequences but also in a co-regulated set of

genes (Kwon, Arenillas et al. 2012). Thus, it gives information about which TF is more

likely to regulate the list of genes obtained by microarray. For the purpose of this

study, a signal site analysis (SSA) was performed on the list of genes of interest. This

analysis was the first one developed by oPOSSUM and consists in measured the

73

distance between conserved regions in the gene sequence to the gene transcription

start site (TSS) and ranked those using different scoring tests and parameters to

predict TFBS.

Once the analysis was completed, TF were ranked according to their Fisher score

which is defined as a one-tailed probability comparing the number of genes with the

TFBS motifs in the list of genes of interest versus the background which is a data set

of gene with known TSSs (to date : 29,347 are in the database). The % of GC

composition was also given as an indication of the similarity of the nucleotides in the

conserved site of the genes compared with the GC composition in the background

genes. Ideally the cursor was around 50%.

5. Image Studio Lite by LI-COR Biosciences

This image analysis software was used to determine the densitometry of bands in

autoradiography films following Western blot. Dot box to frame the band are drawn

manually giving a raw signal value (from pixels) compared to the background.

74

2.6 Cell line and cell culture

RAW 264.7 cells

RAW 264.7 cells are an adherent immortalised murine macrophage cell line used in

research for over 40 years (Figure 2.1) (Raschke, Baird et al. 1978). They were

obtained at the end of the 1970’s by inducing tumours in a male BAB/14 mouse using

a retrovirus Abselon murine Leukemia Virus (A-MuLV). This virus specifically

transforms lymphoid cells which proliferate and rapidly develop in solid tumours. 56

days after the virus administration, the lymphoid tumour tissues were extracted and

cultured. The RAW macrophages were the only ones able to grow indefinitely among

the other lymphoid cells.

This cell line is nowadays widely used in studies on inflammatory mechanisms as it

can be stimulated by different endotoxin and particularly via linkage between the

endotoxin LPS and TLR4 (Hambleton, Weinstein et al. 1996).

Raw cells used in this study were a kind gift provided by Dr. Jon Mabley (University

of Brighton, UK). For the EPR experiments performed in Universite Paris Descartes:

RAW 264.7 cells were a gift from Dr. Jean-Claude Drapier (CNRS UPR 2301, Gif‐sur‐

Yvette, France) originally from American Type Culture Collection (CRL‐9609).

Figure 2.1: Photo of RAW cells. Cells are adherents and have a macrophage-like

appearance with pseudopodia and a round shape. They were photographed under

an inverted microscope (Olympus CKX41) with a Micropix 5 megapixel color CMOS

digital camera by magnification x200, after overnight incubation in RPMI.

X 200

75

HEK 293 cells

Human Embryonic Kidney 293 cells (HEK cells) are an immortalised human cell line

obtained by transfection of a primary culture of human embryonic kidney cells with

sheared fragment of human adenovirus type 5 (Ad5) DNA (Graham, Smiley et al.

1977). This cell line has been used for over 40 years in particular for recombination

and neuropharmacology studies (Thomas and Smart 2005). They are easily cultured

and can also be stimulated by TNF to activate the NF-κB signalling pathway (Salzano,

Checconi et al. 2014).

Cell culture

RAW 264.7 and HEK 293 cell lines were both stored in liquid nitrogen in freezing

medium containing their culture media (RPMI-1640 containing L-glutamine and

DMEM respectively) plus 30% of FCS and 10% of DMSO. Before use, cells were

thawed in a water bath at 37˚C and resuspended immediately at 1:10 in culture media

plus 10% FCS and 1% Penicillin-Streptomicin (P/S). Cells were then washed by

centrifugation at 300 x g for 10 minutes. The cell pellet obtained was mixed at 1:5 in

fresh culture media for RAW cells and 1:10 for HEK cells and placed into 75cm2 flask

and placed in an incubator at 37˚C, 95% air and 5% CO2. Cells were routinely split

when 80% confluence was reached or used directly for experiments.

76

2.7 Rat Blood Samples collection

Collection of Rat plasma

Blood was collected from Wistar male rats (3 months old) purchased from Charles

Rivers (UK) after being humanely killed by terminal bleed under anaesthesia (2%

inhaled isoflurane).This was done under by Dr Lamia Heikal home-office personal and

project license (PIL 70/23855, PPL 70/7893). Blood was collected in 1.5ml Eppendorf

tube containing 10% EDTA.

77

2.8 Human Blood Samples collection

Collection of Human blood from healthy donors

10ml of Human peripheral blood was collected from healthy donors in tubes

containing EDTA ((BD Vacutainers, purple cap). All donors gave written informed

consent under the approval of the local Research Governance and Ethics Committee

(RGEC) R&D Ref No: 09/043/GHE - Pharmacomodulation of cytokines.

Collection of Human blood from patients’ donors undergoing angioplasty

Blood was collected from patients with coronary bifurcation disease requiring elective

revascularization. All patients gave informed written consent under the approval of

the local Research Ethics Committee (REC) and the Health Research Authority NHS

ethics Ref No: 15/LO/2106 – the absorb bifurcation coronary study (ABC-ONE); a

randomised trial of provisional T-stenting using absorb bio-absorbable scaffolds in

coronary bifurcations- Pilot study.

Dr Rajiv Rampat kindly collected blood at two times by patient:

Baseline (pre intervention): Intra-arterial blood sampling via peripheral arterial

sheath. 1x10ml of blood was collected into EDTA tube (BD Vacutainers, purple

cap)

Baseline (post intervention): Intra-coronary blood sampling via cardiac

catheter. 10mls of blood was collected in 1x10ml EDTA tube (BD Vacutainers,

purple cap)

78

2.9 Spin trapping coupled to EPR

The EPR technique is described as the most specific to detect reactive species

(Deschacht, Horemans et al. 2010). It detects the energy emitted by electrons after

being exposed to a magnetic field, and can therefore be used to determine the

chemical configuration of compounds. The EPR theory also referred as Electron Spin

Resonance (ESR) theory was established by Zavoisky in 1944 and the first EPR

spectrometer was developed in 1950 (Bacic, Pavicevic et al. 2016). This machine has

since evolved and it is now used in many fields from physics to archaeology.

Regarding the biomedical sciences, EPR spectrometer was elaborate, in the 1990’s,

for imaging and in vivo studies, and it is nowadays under investigation to be used as

a potential tool to diagnose pathologies.

The ability to responds to magnetic field is carried only by unpaired electrons, which

are for instance in transition metals, radical species, or organic radicals. However,

due to their high reactivity and instability, EPR was coupled with the spin trapping

technique (Williams and Janzen 1970). Essentially, nitrone cycles (which are spin

trap) can trap any radical species even inside the cell. Once trapped, the new spin

trap-radical formed become paramagnetic spin adducts. They keep the radical

property but are stable and thus can be assessable. After application of a magnetic

field and microwaves, the unpaired electron in the adduct reemit the energy received

which is then detected by EPR. Results are obtained in spectral form with

characteristic lines. Different spin adducts lead to different spectra, and are specific

for each type of radical species.

This technique was used in this project to evaluate the ROS species release from

cells after stimulation by LPS, and if this environment was modified by treatment with

BSO. BMPO (5-tert-butoxycarbonyl 5-methyl-1-pyrroline N-oxide) was used as a spin

trap. It specifically reacts with O2.- forming a superoxide adduct, BMPO-OOH, or with

HO. forming the hydroxyl adduct, BMPO-OH which is characterised by a 4 lines

absorbance spectrum (Figure 2.2). Living cells can transform BMPO-OOH to BMPO-

OH (Beziere, Frapart et al. 2010). Therefore, to discriminate between these two

species, samples were treated with SOD. SOD catalyses the dismutation of O2.- into

molecular oxygen (O2) and H2O2 but cannot enter the plasma membrane, hence it can

only inhibit extracellular O2.-. If the signal drops it indicates that the signal was due to

extracellular O2.- and not HO..

79

Cell preparation

RAW Cells were plated at 5x10⁶cells in 5ml of RPMI media supplemented with

10%FCS and 1%P/S into 25cm2 flasks. At 70% confluence, 120μM of BSO, an

inhibitor of the synthesis of GSH, was added to the culture for overnight incubation.

The next day, cells were stimulated for 2h with LPS. In total four experimental

conditions were tested: control, LPS, BSO, BSO+LPS.

Spin trapping

In each flask, cells were detached using a cell scraper and collected into 5ml of fresh

PBS in 15ml Falcon tubes. Following centrifugation at 900 x g for 5min at 4˚C the cell

pellet was resuspended in 100μl of PBS containing 1mM DTPA and 50mM of 5-tert‐

butoxycarbonyl-5‐methyl-1‐pyrroline N‐oxide (BMPO) (purity above 98%), previously

synthetized by Prof F. Peyrot team as described by Zhao (Zhao, Joseph et al. 2001),

with or without 200 U/ml SOD. The incubation mixture containing living cells was then

transferred by aspiration into gas permeable PTFE tubing folded twice into a W shape

to be inserted into a 4mm EPR quartz tube for EPR analysis.

EPR spectrometry

Before EPR measurement in the Bruker Elexsys 500 EPR spectrometer (Bruker,

Wissembourg, France) tuned at X band (9.85 GHz), different parameters were

adjusted as follows:

microwave power: 10 mW

modulation frequency: 100 kHz

modulation amplitude: 0.2 mT

receiver gain: 60 dB

time constant: 40.96 ms

conversion time: 41.04 ms

sweep width: 15 mT

sweep time: 42.02 s

EPR spectra were then recorded sequentially as a total of 1024 data points were

collected for 30 min at 21 °C.

Data analysis

Data acquisition and processing were performed with the help of Dr Fabienne Peyrot

using the Bruker Xepr software. Briefly, noise in the EPR spectra was filtered using

the singular value decomposition (SVD) method, the sum of a total of 40 spectra scan

were combined and calculated in arbitrary units. Computer simulations of the EPR

spectra expected for hydroxyl adduct BMPO were performed using the program of

Rockenbauer and Korecz.

80

Figure 2.2: Experimental design of the measurement of ROS in RAW cells by spin

trapping coupled to EPR

81

2.10 Gene expression microarrays

The gene expression profile changes influenced by GSH during the inflammatory

response in macrophages were analysed using gene microarray technology. This

high throughput technique was developed during the 90’s at Stanford University by

Patrick O. Brown’s group and enables the quantification of the expression of

thousands of genes within one mRNA sample (Schena, Shalon et al. 1995). This was

done in five steps (Figure 2.3) (Tarca, Romero et al. 2006):

1- Extraction of RNA from a sample

2- Reverse transcription of RNA in complementary DNA (target) and labelling with

fluorescence

3- Hybridisation by Watson-Crick rules on a glass slide (also called “chip”) containing

thousands of different DNA sequences (the probes) specifically located and from a

particular transcriptome (mouse, human, specific signalling pathways for instance).

4- Washing of the chip to avoid cross-hybridization

5- Measurement of the fluorescence which is proportional to the amount of DNA

hybridised to the probes

Cell treatment

Cells were plated at 106/well in 6-well plates. BSO was added at a final concentration

of 120 µM to deplete cells of GSH. After 24 h, control or GSH-depleted cells were

treated with 10 ng/ml LPS for 2 or 6h. All conditions are described here: untreated

(control), treated with 120μM BSO (BSO), with 10ng/ml LPS (LPS) or both BSO and

LPS (BSO+LPS) (see Figure 2.3).

RNA extraction

After 2 or 6 hours respectively, the experiment was stopped by removing the

supernatant from wells, washing them with 1ml of PBS and adding 1ml of QIAzol, a

phenol/guanidine thiocyanate compound allowing RNA extraction and preventing its

degradation. A mixture of cell lysates and QIAzol were then recovered in Eppendorf

tubes and vortexed thoroughly for 1min.

Extraction of total RNA was performed using the miRNeasy Mini Kit (Qiagen, UK) and

consist of the following steps: Firstly, chloroform was added to samples and shaken

for 15seconds to mix solutions. Tubes were then centrifuged for 15min to allow the

separation in two phases: an upper aqueous phase containing the RNA and a lower

organic phase with denaturized proteins. The upper aqueous phase was mixed with

100% ethanol to bind the RNA to the silica-based membrane in the provided

82

Eppendorf tubes. Before collecting the RNA, multiple wash steps were performed with

provided buffers. At the end, water was added and the tubes were centrifuged to elute

RNA from the membrane for collection.

RNA purity (ratio A260/A280) and concentration were measured by the Nanodrop ND-

1000 (NanoDrop Technologies/ Thermo Fisher).

Microarrays Hybridisation and Scanning

The extracted RNA was processed at the Oxford Gene Technology in Begbroke

(Oxfordshire - UK) where its integrity was examined. RNA integrity number (RIN)

obtained for all samples was 10 (1=lowest; 10=highest), meaning excellent quality.

Three RNA samples (A, B, C) were randomly selected from each quadruplicate for

further gene expression analysis: RNA was retro-transcribed into cDNA, amplified,

labelled and hybridized onto Single Color SurePrint G3 Mouse GE 8x60K Microarrays

(AMADID:046066; Agilent) at Oxford Gene Technology. The probes are spotted on

the array, which represent 27,122 genes and 4,578 non coding RNAs. Three slides,

each containing eight high definition arrays were used (see Figure 2.3). Therefore 8

samples were loaded for each chip; each containing: Control 2h, LPS 2h, BSO 2h,

BSO+LPS 2h, Control 6h, LPS 6h, BSO 6h and BSO+LPS 6h.

After scanning each array, feature extraction software v10.7.3.1 was used to generate

the array data from the images.

Analysis and statistics

The raw data obtained in standard format have been deposited in the Gene

Expression Omnibus (GEO) database of NCBI, http://www.ncbi.nlm.nih.gov/geo,

accession number GSE79397.

For each sample, an excel file with normalised gene expression data was obtained

(gProcessed Signal) using GeneSpring (Agilent). Data were normalized with Gene

Spring. All the statistics and analyses were done using the log-transformed data.

Gene expression between the experimental groups was then compared by Student’s

t test on the log2 of the gProcessed Signal with a cut off of p<0.05. Fold change in

the expression was calculated as the ratio between the averages of the Log2

gProcessed Signal of the various groups with a cut off of 1.5 (in log: >0.58 or <-0.58).

Hierarchical cluster analysis was performed using Genesis version 1.7.7 for Windows,

functional annotation and biological term enrichment was done using DAVID version

6.8, transcription factor analysis by oPOSSUM and interferon pathway with

Interferome. All software are described in 2.5 Software and analytic tools.

83

Figure 2.3: Experimental design of the gene microarray method and different steps

realised

84

2.11 Quantitative PCR method

Contrary to the microarray technology, quantitative Polymerase Chain Reaction

(qPCR) allows the quantification of the expression of a given gene in an individual

sample.

This technique is based on the PCR method developed in the 80’s by Kary Mullis

which later received a Nobel Prize in Chemistry in 1993 for his invention (Saiki,

Gelfand et al. 1988). It allows a small amount of nucleic acid sequences to be

amplified indefinitely. This is based on altering heating and cooling cycles in an

appropriate buffer containing nucleotide bases and a specific enzyme to amplify the

nucleic acid sequence. Firstly the DNA is denaturated at 95˚C, secondly two primers

recognise a small fragment in the sequence and hybridise at temperature between

50-65˚. The sequence is then amplified at 72˚C using the thermostable Thermus

aquaticus (Taq) polymerase. This can be repeated as much as wanted until the buffer

runs out of nucleotide bases, each time doubling the amount of DNA. Rapidly, one

sequence of DNA can be copied thousands of thousands of times.

Quantitative PCR (qPCR) adds another dimension to this technique which is the

quantification in real time of the amplicon (Bustin 2000). This is possible due to the

fixation of fluorescents probes to the sequence of interest: the more the sample is

concentrated in nucleic sequence, the less cycles of amplification are required to

reach a point with a fluorescence signal which is significantly above the background.

This point is defined as the Ct (see Figure 2.5).

Cell treatment

In this study, qPCR was used for two purposes:

1– Validating the microarray data by testing individual genes in the same and new

individual experiment

2– Completing it by testing further hypothesis using NAC and Menadione

Cells were treated exactly as they were in the previous section (2.2.2) except this time

three more treatments were added. Cells were treated for 2 hours with 5mM NAC

(buffered at pH 7.4) before stimulation with 10ng/ml LPS (two new conditions:

NAC+LPS and NAC). Cells were also stimulated with 10μM of Menadione for 2 or 6h

instead of LPS (one condition: Men).

Reverse transcriptase (RT)

Because qPCR uses cDNA as a template, it needs a reverse transcriptase step to

reverse RNA into cDNA (Figure 2.4).

85

RNA was extracted as explained previously (2.6. RNA extraction) and was submitted

to reverse transcription into complementary DNA following a two-step protocol. First,

500ng of RNA was incubated for 10min at 65°C with random primers and

deoxynucleoside triphosphate (dNTPs), to dissociate any secondary structures of

RNA and facilitate the RT. Rapidly after this step, reverse transcriptase (RT) buffer,

DTT, RNAse OUT, a ribonuclease inhibitor, and MMLV-RT, a reverse-transcriptase,

were added and samples were incubated at 25°C for 10min, 37°C for 60min and 70°C

for 15min.

qPCR

Two µl of the new cDNA formed was then mixed with 18μl of PCR mix and the mixture

obtained was assayed in duplicate in 96 well plate. The PCR mix contained the

primers of gene-of-interest, the Taqman probe, plus the Brilliant III qPCR master mix

containing all reagents required for PCR amplification: Taq DNA polymerase, dNTPs,

and buffer. Basically, primers recognise the DNA to amplify, the Taqman probe fixed

it and every time the DNA is polymerised the quencher attached to the probe is

released and the fluorescence can be detected (Figure 2.4).

PCR reactions were run on the Stratagene MX3000 PCR machine following this heat-

cool cycle:

1 cycle: 3 min at 95C where Taq polymerase was activated

40 cycles: 15 sec at 95C to denature the DNA + 20 sec at 60C to extend it

For each sample, the housekeeping gene (HPRT1) was measured as a reference

allowing the normalisation of the expression of all genes measured.

Data analysis

The results were then analysed by the Livak method (also referred as the delta delta

CT method) (Livak and Schmittgen 2001). To proceed, the Ct from the housekeeping

gene was subtracted from the Ct of the gene of interest for each sample (= ΔCt). The

ratio of each ΔCt was then expressed versus one of the control samples at 2 or 6 h

chosen as the calibrator. This new value ΔΔCt was log-normalised as 2-ΔΔCt obtaining

the fold change (FC) in gene expression versus the calibrator.

Statistical significance between these samples was determined using the unpaired

two-tailed Student’s t-test.

86

Figure 2.4: Reverse Transcriptase followed by qPCR. After reverse transcriptase

of the mRNA, the cDNA formed is mixed with qPCR mix. The fluorophore present in

Taqman probe is cleaved due to displacement due to polymerisation of the cDNA.

Once cleaved, the fluorophore emits fluorescence which is detected by the

Stratagene MX3000 PCR machine.

87

Figure 2.5: Example of amplification plot obtained by qPCR analysis. The same

cDNA require different cycles of PCR to reach the background level (Ct) depending

on the amount of mRNA of the gene studied and conditions analysed (experimental

group).

88

2.12 Cell viability: MTT assay

Assessment of the cell viability and proliferation of cells under different conditions was

performed by an improved rapid colorimetric assay, the Methyl-Thiazolyl-Tetrazolium

(MTT) assay, developed in 1983 by Mosmann (Mosmann 1983) (Stockert, Blazquez-

Castro et al. 2012). This assay is based on the reduction of yellow tetrazolium salts

(3-(4,5-dimethylthiazolyl-2)-2,5-diphenyltetrazolium bromide) into purple formazan

crystals by the metabolism of living cells using the dehydrogenase enzymes and

NADH as a cofactor. Formazan production is therefore proportional to the number of

living cells and more exactly, to their metabolism. This insoluble product is then

solubilised in a stop solution made usually of SDS and read by the plate reader at 590

wavelength.

In our studies, RAW Cells were plated in 6-well plates at 1x10⁶ cell per ml of RPMI

media. After overnight incubation, cells were treated with different concentrations of

LPS in quadruplicates: untreated, 50ng, 100ng and 200ng per ml of Opti-MEM. 24h

later, supernatant was removed and cells were washed carefully with PBS. Once PBS

was removed, 1ml of MTT buffer diluted at 1:10 in Opti-MEM was added to wells.

Plates were then left in the incubator overnight allowing formation of Formazan

crystals by living cells. The next day, 1ml of MTT stop solution was added to the wells.

Plates were left in incubator for at least 4h to let the formazan solubilise and the

absorbance of the violet solution formed was read at 590nm.

89

2.13 Protein alkylation with Maleimide-PEG

MalPEG alkylation was performed to identify the redox state of proteins among which

Prx1, Prx2 and Trx from different sources including RAW cells, HEK cells and blood.

This part will introduce how samples were alkylated with MalPEG before further

analysis by SDS-PAGE and Western blot however the MalPEG methodology is

explained in Chapter 3. In these experiments, different concentrations of MalPEG

were tested, ranging from 0.1 to 0.8mM. NEM (50mM) was used as a control as it is

also an alkylating agent and can prevent further oxidation of protein. However,

because NEM has a negligible molecular weight compared to the protein, it would not

affect the electrophoretic mobility significantly.

RAW cells

Protein redox states were assessed intracellularly and in the release from RAW cells.

Cell lysis

Cells were plated at 1x10⁶ in 2.5ml of RPMI (supplemented with 10%FCS and

1%P/S). After overnight incubation, media was removed and replaced with 1ml of

Opti-MEM containing different concentrations of LPS. 24h later, cells were lysed using

one if these two buffers: the NP40 lysis buffer or the standard SDS-PAGE sample

buffer.

NP40 Lysis Buffer

After treatment, cells were detached using a cell scraper and collected in 1ml of PBS.

The suspension was centrifuged at 7,000 x g for 5min. After removing the

supernatant, the pellet of cells was mixed with 300μl of NP-40 lysis buffer containing

MalPEG or NEM. NP-40 is a strong detergent breaking cell membranes. Samples

were then left for 15min in the bench at RT to allow the alkylation of free thiols before

centrifugation for 10min x at 4˚C at 17,000 x g to remove cell debris. Supernatant

containing the MalPEG- tagged proteins were collected and processed for Western

Blot analysis.

SDS-PAGE Buffer

In some experiments, cells were lysed directly in the well by adding 300μl SDS-PAGE

sample buffer 1.5X containing MalPEG or NEM. Samples were heated before

processing for Western blot.

Collection of proteins in the supernatant from RAW cells: precipitation with cold

acetone

90

The supernatant of RAW cells (approximately 1ml) was collected 24h after treatment

and spun at 7,000 x g for 5min to remove any cells. Then, the supernatant was

incubated with 0.2-0.5mM MalPEG or 50mM NEM for 15min at RT. 500μl of

supernatants were then transferred to 1000μl of cold acetone (ratio 2:3) and vortexed

thoroughly for 30 seconds before incubation at -20˚C overnight. The next day,

samples were centrifuged at 17,000 x g for 10min at 4˚C. Supernatant was removed

leaving a protein pellet in the tubes. To make sure acetone was removed, tubes were

left open for 30min to let any remaining acetone evaporate. The protein pellet was

then mixed with 1.5X SDS-PAGE sample buffer and directly submitted to

electrophoresis.

HEK cells

HEK cells were plated at 1x10⁶ cells in 2.5ml of DMEM (supplemented with 10%FCS

and 1%P/S) and incubated overnight. The following day, 50ng TNF or 25μM

Menadione were added to 1ml fresh medium in the wells. After 24h, the cells were

lysed in NP-40 lysis buffer containing MalPEG or NEM as described above for RAW

cells.

Rat blood

Around 2ml of rat blood was collected in Eppendorf tubes containing 10% of fresh

EDTA. Blood was centrifuged at 300 x g for 10min, the supernatants (serum) obtained

was transferred to new tubes and washed again to remove any red blood cells left by

a quick spin at 7000 x g for 5min. 25μl of the serum was then diluted at 1:10 in distilled

water and tagged either with NEM or MalPEG before analysis by Western blot.

Plasma and red blood cells extraction from human blood

Immediately after collection, blood was centrifuged at 1,000 x g for 10min (brake 4).

The plasma fraction was separated from the red blood cell (RBC) pellet.

Plasma: Supernatants were transferred to 1.5ml Eppendorf tubes and

centrifuge again to clear any RBC by a centrifugation of 17,000 x g for 10min

at 4˚C. The plasma was then transferred to 0.5ml Eppendorf tubes and tagged

with MalPEG or NEM for 15min at RT before Western blot analysis.

RBC: The pellet containing RBC was again subjected to centrifugation to

remove any trace of plasma. Half ml were recovered and lysed with 9.5ml

(dilution at 1:10) of cold distilled water incubated on ice for 5min. After gently

91

mixing, supernatant was centrifuged at 300 x g for 10min at 4˚C and mixed

with NEM and MalPEG before further analysis by Western blot.

92

2.14 SDS-PAGE and Western blot to detect the redox states of proteins from

cell lysates and blood

The different redox state of proteins were discriminated according to their molecular

weight by Sodium Dodecyl Sulphate - Polyacrylamide Gel Electrophoresis (SDS-

PAGE) and then identified by Western-blotting (Towbin, Staehelin et al. 1979,

Brunelle and Green 2014). Thanks to the anionic detergent property of SDS, the

protein within the sample loses its secondary and tertiary structures becoming linear

but also gaining a uniform negative charge. Once loaded, a vertical electric current is

applied attracting negative charge to the anode part at the bottom of the cassette

(Figure 2.6) therefore allowing protein migration within the polyacrylamide gel. After

vertical separation, proteins were identified by Western blot. Essentially, the migrated

proteins in the gel were transferred, by applying a horizontal current, to a nitrocellulose

membrane with small pores retaining proteins but not RNA and small molecules. The

proteins were identified using an antibody specific of epitopes of the protein which

was itself identified by a second antibody. This second antibody can be visualised by

autoradiography.

All steps are explained below and illustrated in Figure 2.6.

1. Samples preparation

Different samples were analysed: RAW cell lysates, RAW supernatants, HEK cells

and blood samples (including RBC lysate, plasma or serum from mice or humans).

50μl of this samples were then mixed with 10μl of SDS-PAGE sample buffer 6X.

Depending on the protein studied, when indicated this mixture was supplemented with

reductant such as 10% β-mercaptoethanol or 50mM of DTT.

Eight to 15μl of cell lysate, 10 to 25μl of the mixed supernatant, or 10μl of blood

samples were then subjected to separation on polyacrylamide gels. Samples were

heated 5 min below 65˚C.

2. Preparation of acrylamide gels

Polyacrylamide gels were made in two parts: a stacking gel and a running part gel.

The stacking part of the gel (upper) has a low percentage of acrylamide to let the

sample stack, forming a band, before to enter the running part. It was made with

1.25ml of stacking gel buffer, 50μl of 10%SDS, 75μl of 10% APS, 5μl TEMED, 2.86

ml of distilled water and 835μl of acrylamide/Bis solution.

The running part of the gel (lower) was made with 2.5ml of running gel buffer, 100μl

of 10% SDS, 100μl of 10% APS, and 10μl of TEMED. The volume of acrylamide/Bis

93

solution added was dependent of the molecular weight of the protein of interest. In my

work I used either 10% (for Prx1, Prx2) or 15% acrylamide (Trx). To do this, 3.3ml or

5ml of the solution were used. Distilled water was added to complete to 10ml.

The running gel was let polymerised before adding the stacking gel (Figure 2.6).

3. Electrophoresis

Once it is polymerised, the gel was loaded with the samples. The first lane was loaded

with 10μl of molecular weight markers. The gel was then immersed in running buffer

and subjected to electrophoresis at 150V for approximatively 1 to 1.5 hour.

4. Transfer to nitrocellulose membrane

After electrophoresis, the proteins contained in the gel were transferred to a

nitrocellulose membrane. The membrane and the gel formed a sandwich surrounded

by filter paper and sponges in a cassette surrounded by transfer buffer 1X. 400mA

were then applied for 90min.

5. Blocking of non-specific sites and antibody incubation

All following experiments were performed on a rocking shaker. The membrane

obtained was blocked for one hour with 5% BSA in 0.05% tween in PBS-0.05% tween

(PBS-T0.05%) (or 5% Milk in PBS-T0.05%) depending on the antibody requirement

at RT.

A primary antibody (AB1) was then directly added to the membrane blocking buffer

(unless change of buffer was required). This antibody is specific to the protein studied

and ideally polyclonal to recognise different epitopes of the protein. The list of

antibodies used is presented in Table 2.4. The antibody was left overnight at 4˚C but

similar results were obtained by leaving the membrane incubating in primary antibody

for 2h at RT. After three 10min washes with 10ml of PBS-T0.05%, the second

antibody (AB2) carrying a Horseradish Peroxidase (HRP) molecule was added to

10ml in 5%BSA in PBS-T0.05%. This second incubation last 1-2h at RT.

6. Autoradiography

After washing the membrane 3 times with PBS-T0.05% as described above,

Enhanced ChemiLuminescence (ECL) reagent made of 1:1 vol/vol luminol and

hydrogen peroxide (H2O2) was added to the membrane and incubated for 5min.

Luminol is excited by HRP using H2O2 as a substrate and produce light.

94

In the dark room, the membrane is placed in an X-ray film cassette and covered with

an autoradiography film for as long as necessary. This film catch the light emit by the

HRP and therefore indirectly the presence of the protein targeted.

7. Densitometry

Densitometric analysis to quantitate the intensity of the bands in the autoradiography

was performed using Image Studio Lite (see 2.5 Software and analytic tools).

95

Figure 2.6: Experimental design of SDS-PAGE followed by Western Blot.

96

2.15 DTNB assay to measure total free thiols

The total number of free thiols in a sample (released in cell culture medium or cell

lysate) was measured using the DTNB assay.

DTNB (5, 5’-dithiobis-2-nitrobenzoic acid, Ellman’s reagent) is an aromatic disulphide

which reacts rapidly with thiols by an exchange reaction to form a mixed disulphide of

the protein and one mole of TNB (5-thio-2-nitrobenzoicacid) by mole of thiol (Ellman

1959). In diluted buffer, TNB ionizes as a TNB2- ion which has a yellow colour and

therefore can be quantified by measuring the absorbance of visible light at 412 nm in

a spectrophotometer (Figure 2.7).

For each experiment, a standard N-acetyl cysteine (NAC) concentration curve was

prepared in triplicate. For this purpose, a 2mM solution was prepared in dilution buffer

TE. The method is based on a published protocol (Sedlak and Lindsay 1968).

In total, each well of a 96-well plate contained 100μl of sample or NAC standard. 25μl

of DTNB was then added and read in a spectrophotometric plate reader.

Figure 2.7: Reaction of DTNB with free thiols. Modified from Riddles et al. (1978)

(PETER W. RIDDLES 1978)

97

2.16 Determination of protein concentration.

The protein concentration was determined using the kit BCA (bicinchoninic acid)

protein assay from Thermo Fisher. Briefly, 25μl of samples were added to a 96 well

microplate. 200μl of prepared BCA working reagent, an alkaline solution, were then

added and the plate was incubated at 37˚C for 30min. Proteins reduce the copper in

the reagent giving a purple colour, thanks to the bicinchoninic acid, which is read at

562nm. The concentration is then determined using to a standard curve made of BSA

diluted in a range of 0 to 2mg/ml.

98

2.17 Identification of free thiols at the surface of RAW cell

Cell treatment

RAW cells were plated in 6 well plate at 1x10⁶ in 2.5ml of RPMI. After overnight

incubation, cells were treated with 100ng of LPS for 24h in 1ml of Opti-MEM.

BIAM labelling

Before incubation with BIAM (N-(Biotinoyl)-N'-(Iodoacetyl) Ethylenediamine), cells

were detached using a cell scraper, collected and washed with 1ml of PBS by

centrifugation of 7000 x g for 5min. The cell pellet was then resuspended in 1ml of

PBS containing different concentrations of BIAM and incubated at 37˚C for 15min.

BIAM was then removed by centrifugation and cells were re-washed with PBS by

centrifugation of 7000 x g for 5min (Figure 2.8).

Extraction of membrane proteins

To extract membrane proteins, the cell pellet was recovered in 1ml homogenisation

buffer containing sucrose and Hepes and broken by sonication (2 x 15sec) in ice. For

mass spectrometry (MS) experiments, cells from two tubes treated identically were

pooled together to obtain a final volume of 2ml.

Samples were then washed to remove cellular debris by centrifugation of 7,000 x g

for 10min at 4˚C. The supernatant containing membrane proteins was transferred to

glass-microfuge tube and submitted to ultracentrifugation of 108,382 x g at 4˚C for

30min. The hydrophobic pellet was then washed one or two times as indicated in the

results section with 1m of PBS for 20min at 108,382 x g at 4˚C.

The membrane protein pellet obtained was analysed by SDS-PAGE/Western blot or

processed for MS to identify labelled proteins.

Western blot

The pellet containing membrane proteins was resuspended in 100μl SDS-PAGE

sample buffer 2X, heated at 95˚C for 5 min. 10μl were then loaded to a 12% or 15%

SDS-PAGE and proteins of interest detected by Western-Blot. Primary antibodies are

listed in table 2.4.

Mass spectrometric identification of BIAM-tagged proteins (Figure 2.8)

In these experiments, MS was used to identify BIAM-labelled membrane proteins.

This technique is based on ionising the proteins to convert them into gas-phase ion

allowing their separation due to their masse-to-charge ratio (m/z) by a mass analyser

and recorded by a detector to be analysed (Han, Aslanian et al. 2008).

99

Two difficulties were found. First, membrane proteins are hydrophobic and tend to

aggregate thus requiring a specific buffer prior to MS analysis, different from that used

for soluble protein, more often used. Secondly, proteins tagged with BIAM were in a

sample which contained several other proteins, and their separation was challenging.

For these reason, a protocol developed by Blonder et al., for membrane analysis by

MS was used and adjusted (Blonder, Chan et al. 2006); it consists of 3 steps before

MS analysis: reduction/alkylation, solubilisation, and affinity purification.

1. Reduction and Alkylation

Membrane pellet was dispersed by sonication in 50mM ammonium bicarbonate at

pH7.9 (approx. 500μl /tube) directly in the microfuge tube obtained from

ultracentrifugation. Proteins were reduced with 2mM of Tris 2-carboxyethylphosphine

(TCEP) with sonication 1min bath -2min pause in a 5 times cycle. Alkylation was then

performed by adding 10mM of 2-Iodoacetamide (IAA), sonicated in bath and kept in

the dark for 15min at 37C. Samples were then ultracentrifuged at 108,382 x g for 1h

at 4˚C, after saving a small volume for the determination of protein concentration.

2. Solubilisation and denaturation

The reduced and alkylated pellet was then solubilised in a 60% vol/vol of methanol in

40%vol/vol of 50mM ammonium bicarbonate to have a protein concentration around

0.5-1μg/μl. Solubilisation was performed by bath sonication at room temperature for

1min (2min pause in ice for 5 times cycle).

Proteins were then denatured by incubating the tubes in a water bath at 90˚C for 1min

and transferred directly to ice-cold water.

3. Affinity purification and in-column digestion

After denaturation, 250μl of Pierce™ High Capacity NeutrAvidin™ Agarose beads,

previously washed with PBS, were added to the tubes and incubated overnight at 4˚C

in rotary wheel for constant agitation.

The beads where then washed three times by centrifugation. At this point, only BIAM-

tagged proteins should bind the beads.

Solubilising buffer was added along with 0.1μg/μl trypsin for tryptic digestion for 5h at

37˚C with frequent agitation (every 15min).

The supernatants was then recovered and lyophilised.

100

4. qExactivePlus (MS performed by Philippe Chan – Universite de Rouen)

Dried samples were solubilized in 100 μl of 0.1% formic acid (v/v) in 3% acetonitrile.

Samples (1 μl) were injected into the nanoUPLC-system (UtiMate 3000 RSLCnano,

Thermo Fisher Scientific) and analyzed by MS using a binary buffer system of A (0.1%

(v/v) formic acid in H20) and B (0.1% (v/v) formic acid in 80% acetonitrile). Peptides

were first concentrated on a 2 cm x75 μm C18 Pepmap100 pre-column (Thermo

Fisher Scientific) at a flow rate of 5 μl/min using mobile phase A. Separation of the

peptides was achieved by eluting them from the precolumn to a 15 cm × 75 μm Easy

spray Pepmap100 analytical column (Thermo Fisher Scientific) applying a flow rate

of 300 nl/min and using a gradient of 2% to 45% mobile phase B over 45 min. The

mass spectrometric analysis was performed on a QExactive orbitrap mass

spectrometer, equipped with an easy spray nano ion source (Thermo Fisher

Scientific), coupled to the nanoUPLC-system.

MS spectra were acquired using 1e5 as AGC target at a resolution of 70,000 (200

m/z) in a mass range of 400−1800 m/z. A maximum injection time of 100 ms was used

for ion accumulation. MS/MS events were measured in a data-dependent mode for

the 10 most abundant peaks (Top10 method) in the high mass accuracy Orbitrap after

HCD (Higher energy C-Trap Dissociation) fragmentation at 28. The resolution was set

to 17 500 at 200 m/z.

5. MS Data analysis

Proteins were first selected based on a false discovery rate (FDR) < 1 (=-

10logP>19.81). FDR corresponds to the ratio of the false peptide-spectrum match

(PSM) among the true number of PSM; above the score threshold.

101

Figure 2.8: Experimental design of the strategy for the identification of free protein

thiols at the surface of RAW cells before MS analysis.

102

Chapter 3

Regulatory role of glutathione in LPS-stimulated

macrophages

103

3.1 Introduction

The primary role of GSH is to decrease the amount of hydrogen peroxide and other

peroxide molecules. This antioxidant properties of GSH has been particularly

highlighted in the context of inflammation. Indeed, Herzenberg et al. have

demonstrated that N-acetylcysteine (NAC), a GSH precursor, could inhibit NF-κB

(Staal, Roederer et al. 1990), a ubiquitous transcription factor which up-regulates the

expression of pro-inflammatory cytokines such as IL-6, chemokines and immune

receptors (Liu 2005, Hayden and Ghosh 2008). This study was supported by the work

of Baeuerle et al. demonstrating that H2O2 could, by itself, induce the inflammatory

response through NF-κB, suggesting that thiol antioxidants can down-regulate the

inflammatory response by removing excess H2O2 (Schreck, Rieber et al. 1991). All

together these investigations led to the view of ROS as pro-inflammatory signalling

molecules and GSH as an anti-inflammatory mediator. Since then, a succession of

studies have reinforced this hypothesis leading to perform clinical trials by giving

antioxidants to patients with pathologies linked with oxidative stress (Meyer, Buhl et

al. 1994, Blackwell, Blackwell et al. 1996). However, most of the therapies were

unsuccessful as described in Table 1.2: Examples of clinical trials testing the

effect of NAC/GSH.

One possible reason for this is that exogenously administered NAC or GSH are given

at doses higher than the endogenous GSH concentration. This would be effective only

if ROS were produced in excess in those diseases and only caused oxidative damage

or were in any form just harmful. However, as discussed above, ROS also have a role

in the normal signalling mechanism of the cell and their elimination with an antioxidant

would disable a signalling mechanism by which the organism “senses” and responds

to a disease condition. In the context of redox regulation, also the GSH/GSSG couple,

and the change in its ration, could be important in signalling, by relaying signalling

though oxidoreduction of various protein thiols.

Importantly, GSH can regulate protein function via glutathionylation, a post-

translational modification involving thiol-disulphide exchange reactions (Ghezzi

2013). A previous study investigated the regulatory role of GSH (beyond its

antioxidant role) by exposing GSH-depleted monocytes with H2O2 (Fratelli, Goodwin

et al. 2005). As expected, that study observed that genes related with the stress

response were even more up-regulated by GSH-depletion when stimulated by H2O2

supporting the idea that GSH is an antioxidant helping to diminish the stress response

induced by H2O2. However that study also highlighted even more numerous group of

genes, some involved in the immune response, up- or down-regulated directly

104

affected by the absence of GSH but not by H2O2 alone suggesting that GSH was an

inhibitor or activator of their expression. It was then hypothesised that GSH acts as a

signalling molecule that regulates gene expression. In fact, some of the cell responses

are mediated by the GSH/GSSG couple, for instance, through glutathionylation of

regulatory proteins.

In this chapter, the role of endogenous GSH was investigated during the inflammatory

response to identify potential inflammatory genes regulated by GSH. We wanted to

test the hypothesis that some of the changes in gene expression profile induced by

inflammation require glutathione as a signalling molecule. We thought that one way

to do it was to deplete cells from GSH and observe their response to LPS. If induction

of inflammatory and stress genes by LPS was due to LPS induced oxidative stress,

then GSH depletion would amplify their induction and exacerbate the inflammatory

response. However, if some genes were induced by LPS by a signalling cascade

requiring the participation of GSH/GSSG (either by glutathionylation, thiol-disulfide

exchange or other reactions), then we would observe that some of the genes would

not be induced by LPS in the absence of GSH. On the other hand, in those genes that

would be induced by LPS though mechanisms not requiring GSH or redox regulation,

their induction would be unaffected by GSH depletion.

For this purpose, RAW cells were stimulated with the endotoxin LPS with and without

pre-treatment with the GSH synthesis inhibitor BSO (Griffith and Meister 1979). After

RNA extraction, DNA microarrays were used to analyse changes in the gene

expression profile and identify patterns of LPS-induced genes affected by BSO and

thus reliant on GSH or inhibited by it.

Aim: Study of the role of endogenous GSH in the regulation of the changes in

gene expression profile associated with the inflammatory response in

macrophages.

105

3.2 Viability and GSH/GSSG determination

RAW cells were exposed to 120μM BSO for 24h before stimulation with 10ng/ml of

LPS for 2h or 6h. Dose-response experiments carried out in the laboratory by

Dr.Coppo demonstrated that 120μM BSO was sufficient to inhibit γ-GCS and thus

GSH.

Toxicity of BSO and LPS treatment was assessed by Dr. Mengozzi (Brighton &

Sussex Medical School) and is shown in Figure 3.1A. BSO at 120 μM, alone or with

LPS, was not toxic to the cells as detected by Cell-Titer-Blue (viability was: control,

100±1%; BSO, 98±2%; BSO+LPS, 95±1%).

Depletion of GSH and GSSG was measured thanks to a collaboration with Dr. Coppo

(Karolinska Institutet). As shown in Figure 3.1B, after 24h, 120μM BSO pre-

treatment, GSH and GSSG levels were decreased by 99%, whether or not LPS was

present. LPS itself did not significantly affect GSH+GSSG levels.

106

Figure 3.1: Viability and GSH/GSSG determination. A. RAW cell viability after

exposure to BSO and LPS measured by Cell-Titer-Blue by Dr. Mengozzi. Data are

expressed as the % percentage of viability of control cells. B. Total glutathione level

(GSH+GSSG) determination (hashed bars) and ratio GSH/GSSG (black bars)

measured by Dr. Coppo.

0

20

40

60

80

100

no LPS LPS 10ng/ml

% v

iab

ilit

y v

s c

on

tro

l

no BSO

BSO 120 µM

0

20

40

60

80

100

120

140

0

1

2

3

4

5

GS

H/G

SS

G (

rati

o)

To

tal G

SH

+G

SS

G (

nm

ol/

mg

pro

tein

)

GSH+GSSG GSH/GSSG

A

B

*** ***

*

*

107

3.3 ROS measured by Electron Paramagnetic Resonance

ROS are produced by macrophage to kill pathogens (Forman and Torres 2001).

However an excess of ROS production can create an imbalance in cellular redox

status, leading to intracellular damage increasing the inflammatory response (Valko,

Leibfritz et al. 2007). In our study, GSH, the main intracellular antioxidant, was

depleted from RAW cells thus leading to a potentially oxidative environment. To

measure if LPS stimulation leads to an increase in ROS and if BSO has an impact on

the oxidative burst, superoxide (O2.-) and hydroxyl radical (HO.), the two main ROS

produced, were quantified (Forman and Torres 2001). Due to their high reactivity and

instability, their quantification is difficult and is usually performed indirectly (Tarpey

and Fridovich 2001, Chen and Junger 2012). In our study, quantification of ROS in

live cells was performed using the state of the art technology based on spin trapping

coupled with Electron Paramagnetic Resonance (EPR) (Abbas, Hardy et al. 2014,

Abbas, Babic et al. 2016). This method is described Chapter 2 – 2.8. RAW cells were

pre-treated or not with BSO for 24h and then stimulated with LPS for 2h before being

directly mixed, alive, with BMPO(5-tert-butoxycarbonyl 5-methyl-1-pyrroline N-oxide)

for EPR analysis. BMPO reacts with O2.- forming a superoxide adduct, BMPO-OOH,

or with HO. forming the hydroxyl adduct, BMPO-OH. Both spin adducts are

characterised by distinct spectra comprised of 4 lines. All spectra obtained are shown

Figure 3.2A. The area under the spectra was also measured and is shown in Figure

3.2B. The spectra obtained for LPS and BSO+LPS were characteristic of the hydroxyl

radical adduct BMPO-OH. However, conversion of superoxide to hydroxyl radical

adduct in cells due to thiol molecules is well known (Beziere, Frapart et al. 2010).

Therefore to discriminate between these two species in our study, samples were

treated with Superoxide Dismutase (SOD). SOD catalyses the dismutation of O2.- into

molecular oxygen (O2) and H2O

2 but cannot enter the plasma membrane, hence it

can only inhibit extracellular O2.-. Because the signal obtained with either LPS or

BSO+LPS dropped with SOD it can be concluded that most of the signal observed

was mainly due to extracellular O2.- released by RAW cells. The signal obtained was

similar for the control and BSO treated cells meaning that BSO did not increase a

superoxide environment. Similarly, treatment with BSO+LPS did not result in a

change of signal above that obtained for LPS alone suggesting that BSO did not affect

the oxidative release with LPS stimulation. These results demonstrate the release of

radicals following LPS stimulation confirming an oxidative burst. However depleting

cells of their main antioxidant (GSH) did not affect the amount of ROS

(superoxide/hydroxyl radical) nor the oxidative burst response.

108

Figure 3.2: ROS are released from RAW cells after 2h LPS stimulation. A. EPR

spectra obtained as the sum of 40 scans after LPS stimulation with or without BSO treatment.

Each experimental condition was repeated at least 4 times and individual experimental are

shown in shade of grey. Black lines corresponds to the average of individual replicate of each

condition. Red line correspond to the expected spectra for hydroxyl adduct BMPO (n=40)

obtained by computer simulation. B. Quantification of the area under spectra of EPR signal. *

P value < 0.05 versus control by paired two-tailed Student’s t-test (n=4).

109

3.4 Microarray analysis: effect of LPS and BSO alone on gene expression in

RAW cells

A microarray analysis was performed using total RNA isolated from RAW cells that

had been pre-treated with BSO for 24h, then stimulated for 2h or 6h with LPS, as

described above. In fact, pro-inflammatory genes are expressed at early time points

(few hours) following endotoxin stimulation according to Medzhitov and Horng

(Medzhitov and Horng 2009).The individual impact of LPS and BSO on the gene

expression of RAW cells was examined by comparing experimental groups to the

untreated group (control) using an unpaired Student’s t test and a Fold Change cut

off at 1.5.

Transcripts affected by LPS at 2h and 6h represent less than 15% of the total data

set whereas the total of transcripts affected by BSO alone represent less than 2% as

shown in Figure 3.3. Interestingly, BSO and LPS modified a similar number of

transcripts at 2h and 6h.

110

Figure 3.3: Number of transcripts affected either by BSO or by LPS in RAW cells

after 2h and 6h LPS stimulation. Experimental groups were compared using an

unpaired two-tailed Student’s t-test with a cut off threshold of P value < 0.05 and a

Fold Change>1.5 or <-1.5.

111

3.4.1 Effect of LPS on gene expression profiles at 2h and 6h

Due to the similar number of transcripts regulated by LPS at 2h and 6h (4823 versus

5019) we considered whether those transcripts were identical. The list of transcripts

modified by LPS at 2h was compared to the list obtained at 6h and the results are

illustrated by Venn diagrams. As shown in Figure 3.4, almost half of the transcripts

affected at 2 and 6h were identical.

We then asked if these transcripts had a different expression pattern at 2 and 6h. The

FC of each triplicate modified by LPS versus the average of the gProcessed signal of

the controls was obtained and submitted to Genesis v1.7.7. Results are expressed as

a GeneTree view as shown Figure 3.5. Only 148 of the 2250 transcripts identical

between 2 and 6h were expressed differentially over the time course (lines in red and

green). Remaining transcripts were expressed similarly at 2 and 6h. Therefore most

of the identical transcripts affected by LPS at 2 and 6h were either up-or down-

regulated independently of the time point.

112

Figure 3.4: Venn diagram of the number of transcripts affected by LPS at 2h

(grey) and 6h (red).

Figure 3.5: Expression view after HCL of transcripts affected at both 2 and 6h

after LPS stimulation obtained by Genesis v1.7.7. A, B, C represents the

triplicates. Red lines represent transcripts up-regulated at 6h and green lines

represent transcripts down-regulated at 6h. Grey lines represent transcripts with

similar expression at 2 and 6h either up-regulated or down regulated.

113

3.4.2 Functional analysis of the genes whose expression is changed by LPS

The biological role of the list of the 2250 transcripts affected by LPS at both 2h and

6h was then analysed via the functional annotation and term enrichment software

‘DAVID’ v6.8 (Huang da, Sherman et al. 2009). The 15 most overrepresented

categories obtained are shown in Figure 3.6. As observed all functional categories

obtained were related to the host defence system in response to LPS. For instance,

“TNF signalling pathways”, “NF-κB signalling pathways” and “immune system

process” were among the most overrepresented functional categories shared by the

genes affected at 2h and 6h of LPS stimulation.

Each group affected by LPS was also analysed separately at 2h and 6h by DAVID as

shown in Figure 3.7. These groups include:

- Up-regulated at 2h: 2327 transcripts

- Down-regulated at 2h: 2496 transcripts

- Up-regulated at 6h: 2499 transcripts

- Down-regulated at 6h: 2520 transcripts

Only the first ten biological categories are shown and were ordered by their p-value

(EASE score). Genes down-regulated by LPS are shown in the left panel while those

up-regulated by LPS are in the right panel. The list of the first 100 genes more up- or

down-regulated by LPS at 2h and 6h are shown Appendix 1-4.

Unsurprisingly, the genes affected by LPS after 2h and 6h of stimulation belonged to

similar biological categories.

The down-regulated categories at 2h were associated mainly with the transcription

process, and at 6h with cell division, mitosis, and DNA replication. Therefore, LPS

seems to decrease the growth rate of RAW cells. No genes linked with apoptosis or

necrosis were observed.

As expected, at both 2h and 6h, LPS activated immune response and defence system

genes. Two signalling pathways in particular were up-regulated by LPS stimulation,

TNF and NF-κB signalling pathways.

114

Figure 3.6: 15 most highly represented functional categories of genes affected

by LPS at both 2h and 6h in RAW cells. Analyses were performed via the Functional

Chart Annotation analytic module using the GOTERM-biological process (grey bars)

and KEGG pathway (black bars) classification in DAVID. Only the 15 most

significantly enriched biological categories are shown here. The number of genes

obtained per category is shown in brackets.

Immune system process (90)

Response to virus (37)

Innate immune response (85)

Defense response to virus (46)

Inflammatory response (70)

Apoptotic process (97)

Negative regulation of viral genome replication (18)

Lipopolysaccharide-mediated signaling pathway (17)

Response to lipopolysaccharide (45)

NF-kB signaling pathway (39)

TNF signaling pathway (38)

Influenza a (48)

Herpes simplex infection (50)

Measles (38)

0 5 10 15 20-log10(P value)

KEGG pathway GO TERM_Biological Process

115

Figure 3.7: Ten most highly represented functional categories obtained by

Functional Chart analysis in DAVID depending on their up-regulation with LPS

(right panel) or down-regulation (left panel) respectively after 2h (A) and 6h (B)

stimulation. Analyses were performed via the Functional Chart Annotation analytic

module using the GOTERM-biological process (grey bars) and KEGG pathway (black

bars) classification in DAVID. Only the ten more significantly enriched biological

categories are shown here. The number of genes obtained per category is shown in

brackets.

116

3.4.3 Functional analysis of the genes affected by BSO

The process outlined in 3.3.3.2 was repeated for the genes whose expression was

affected by BSO; however only 77 transcripts were affected by BSO at both 2 and 6h

as shown in the Venn diagram in Figure 3.8.

Due to the small number of transcripts affected by BSO (less than 2%), the data

collected at the two time points 2h and 6h were combined according to their differential

expression by BSO (up- or down-regulated by BSO) before being submitted to DAVID.

The data are shown in Figure 3.9. Unsurprisingly, categories up-regulated by BSO

are involved in drug metabolism and GSH metabolism suggesting that the cell detects

the lack of GSH and stimulates the expression of genes involved in GSH synthesis.

Biological categories down-regulated with BSO are diverse and include genes related

to chronic inflammation (inflammatory bowel disease, lens fibre cell differentiation,

intestinal immune network), calcium import, or transcription for instance.

117

Figure 3.8: Venn diagram of the number of transcripts affected by BSO at 2h

(grey) and 6h (red) LPS stimulation.

Figure 3.9: Ten most highly represented functional categories obtained by

Functional Chart analysis in DAVID depending on their up-regulation with BSO

(right panel) or down-regulation (left panel). Analyses were done via the Functional

Chart Annotation analytic module using the GOTERM-biological process (grey bars)

and KEGG pathway (black bars) classification in DAVID. Only the ten more

significantly enriched biological categories are shown here. The number of genes

obtained per category is shown in brackets.

118

3.5 Microarray analysis: effect of GSH depletion during LPS stimulation on

the gene expression profile of RAW cells

3.5.1 Selection of differentially expressed transcripts

The effect of GSH depletion on the expression of genes affected by LPS was analysed

in two steps. First, the LPS experimental group was compared to the control group to

obtain the list of transcripts affected by LPS; then, the transcripts also affected by

BSO were filtered via comparison of the BSO+LPS experimental group versus the

LPS group. As shown in the flow chart in Figure 3.10, 142 transcripts out of 4823

affected by LPS at 2h and 196 out of 5019 affected by LPS at 6h were affected, 0.42%

and 0.58%, of the total transcriptome, respectively. Therefore the effect of BSO on

genes affected by LPS had a minor impact on the expression of the genes.

A hierarchical cluster analysis was done with Genesis to cluster the genes whose LPS

regulation was significantly affected by BSO at 2h (Figure 3.11) and 6h after LPS

stimulation (Figure 3.13). As observed in both heat maps, four clusters were

identified:

Cluster 1: up-regulated by LPS and increased further by BSO

Cluster 2: up-regulated by LPS and decreased by BSO

Cluster 3: down-regulated by LPS and increased by BSO

Cluster 4: down-regulated by LPS and decreased further by BSO

Once a cluster was selected, its attributes were further examined using the GeneTree

expression view mode in Genesis as shown in Figure 3.12 for 2h and Figure 3.14 for

6h to confirm that the cluster was appropriate. The expression view of each clustering

can be found in the Appendix 5-6. As some genes were left out of the clusters, for

instance interleukin 1 beta (IL-1β) was not clustered even though its expression was

induced by LPS but inhibited by BSO and would have been missed by the hierarchical

cluster analysis, we decided, as an additional strategy, to obtain the clusters by

filtering similarly to the first step. Filtering was performed as in Figure 3.10 but in

addition the experimental group BSO+LPS was compared to the LPS group. The flow

chart illustrating this filtering strategy is shown in Figure 3.15. The different clusters

obtained by Genesis after manual addition of some genes and the groups obtained

statistically by cut off were identical. We choose to name them:

Group 1 (G1): up-regulated by LPS and increased further by BSO

Group 2 (G2): up-regulated by LPS and decreased by BSO

Group 3 (G3): down-regulated by LPS and increased by BSO

Group 4 (G4): down-regulated by LPS and decreased further by BSO

119

For each group, the 15 transcripts whose regulation by LPS was the most affected by

BSO according to fold change ranking ordering are shown in Table 3.1 (up-regulated

by LPS) and Table 3.2 (down-regulated by LPS). The full list of genes for each group

can be found in the Appendix 7-10 for 2h and Appendix 11-14 for 6h.

As observed, most of the genes in Group 1 were related with response to oxidative

stress such as Peroxiredoxin1 (Prx1), Sulfiredoxin 1 (Srxn1), the GSH synthetic

enzyme glutamate cysteine ligase modifier (Gclm), and the cysteine/glutamate

transporter xCT (Slc7a11). Therefore the effect of BSO alone on these genes was

also investigated in order to see if these genes were also up-regulated without GSH.

Most of the genes affected by BSO alone were part of Group 1 (indicated with * an

asterisk in the tables). In Group 2, most of the genes were linked with the inflammatory

process, including IL-1β. Group 3 and 4 were more heterogeneous.

120

Figure 3.10: Diagram of the filtering strategy applied to the microarray data to

assess the number of transcripts affected by BSO during LPS stimulation. At

each step, the dataset was filtered to select transcripts that were affected by LPS (first

step), then by BSO (second step). Criteria for selection were a minimum of 1.5 Fold

Change and a P value < 0.05 obtained by an unpaired two-tailed Student’s t-test

comparing three individual samples.

121

Figure 3.11: Hierarchical clustering of 142 GSH-dependent LPS-regulated genes

at 2h represented as a Heat Map Tree. Data represent the expression change as

log2 ratio of each triplicate (A-B-C) compared with the mean of 3 control samples.

Red indicates an increase in the level of expression while green shows a decrease.

Black indicates no change in the level of expression. Clusters are indicated by vertical

bars (1 and 2 in black and 3 and 4 in grey).

122

Figure 3.12: Expression images of set of genes obtained for cluster 1, 2, 3 and

4 respectively at 2h. The median of the expression for a cluster is in pink. The level

of expression is indicated by the ratio of each condition versus the average of the

control (+4;-4).

123

Figure 3.13: Hierarchical clustering of 196 GSH-dependent LPS-regulated genes

at 6h represented as a Heat Map Tree. Data represent the expression change as

log2 ratio of each triplicate (A-B-C) compared with the mean of 3 control samples.

Red indicates an increase in the level of expression while green shows a decrease.

Black indicates no change in the level of expression. Clusters are indicated by vertical

bars (1 and 2 in black and 3 and 4 in grey).

124

Figure 3.14: Expression images of set of genes obtained for cluster 1, 2, 3 and

4 at respectively 6h. The median of the expression for a cluster is in pink. The level

of expression is indicated by the ratio of each condition versus the average of the

control (+4;-4).

125

Figure 3.15: Diagram of the filtering strategy applied to the microarray data to

assess the number of transcripts affected by BSO during LPS stimulation

represented as a heat map. At each step, the dataset was filtered to select

transcripts that were affected by LPS (first step), then by BSO (second step). Criteria

for selection were a minimum of 1.5 Fold Change and a P value < 0.05 obtained by

an unpaired Student’s t-test on three individual experiments. Number of transcripts

selected are indicated either in red for up-regulated transcripts or in green for down-

regulated transcripts. G1, G2, G3 and G4 stand respectively for Group 1, Group 2,

Group 3 and Group 4.

126

Table 3.1: LPS-induced transcripts most affected by BSO in groups 1 and 2.

Transcripts were selected for their differential expression between the two groups

BSO+LPS vs LPS alone (cut-off was: fold change, 1.5; P<0.05). Only the top 15

transcripts most affected by BSO (sorted by fold change) are shown. *Transcripts

affected by BSO alone (BSO vs control, with a cut off of FC 1.5, P<0.05). The full list

can be seen in Supplementary file 1. Transcripts in bold were selected for PCR

validation.

GeneSymbol Genbank

Accession

P value log2(FC) GeneSymbol Genbank

Accession

P value log2(FC)

Ptpn14 * NM_008976 1.28E-05 1.85 Hunk NM_015755 1.20E-03 1.97

Serpinb1b * NM_173052 5.20E-05 1.60 Serpinb1b * NM_173052 1.38E-04 1.85

Ccdc54 NM_027046 1.92E-02 1.31 Gclm * NM_008129 1.28E-03 1.80

Srxn1 * NM_029688 7.32E-05 1.28 Hunk NM_015755 2.37E-05 1.73

Tex19.1 * NM_028602 4.60E-03 1.22 Ptpn14 * NM_008976 1.46E-05 1.52

Hunk * NM_015755 8.32E-05 1.14 Serpina3g NM_009251 4.28E-04 1.42

Esd * NM_016903 9.18E-04 1.14 Slc39a4 * NM_028064 1.15E-04 1.40

Procr NM_011171 3.30E-04 1.13 Mep1a * NM_008585 5.56E-03 1.21

Tfec * NM_031198 6.30E-03 1.03 Tfec* NM_031198 1.31E-02 1.14

Slc7a11 * NM_011990 2.54E-05 1.00 Prdx1 NM_011034 3.35E-05 1.12

Fosl1 NM_010235 5.50E-04 0.99 Fosl1 NM_010235 2.23E-02 1.11

3110068a07rik * AK039947 8.95E-03 0.97 Gem NM_010276 4.86E-02 1.09

Prdx1 * NM_011034 5.28E-05 0.97 Slc7a11 * NM_011990 2.20E-04 1.07

Hunk * NM_015755 2.13E-03 0.94 Acta2 * NM_007392 1.82E-03 1.01

Zdhhc18 NM_001017968 3.07E-03 0.70 Vwce NM_027913 6.72E-03 1.00

Sox14 NM_011440 3.97E-02 -1.52 Nup62cl NM_001081668 6.59E-03 -4.34

Olfr1412 NM_146277 1.35E-02 -1.51 Psg26 * NM_001029893 3.65E-04 -4.21

Il1b NM_008361 3.39E-03 -1.49 Kif12 * NM_010616 3.89E-02 -2.56

Fabp2 NM_007980 2.27E-02 -1.48 LOC102634429 XM_006521612 2.55E-02 -2.29

Mx2 NM_013606 2.46E-04 -1.39 C230030N03Rik AK082264 7.91E-03 -2.22

Epb4.1l5 NM_001113416 3.63E-02 -1.29 Pdia2 NM_001081070 2.37E-02 -1.79

Otor NM_020595 8.70E-03 -1.29 Adrbk2 AK048763 1.25E-02 -1.65

Aldh16a1 AK164374 1.06E-02 -1.24 Glipr1l1 NM_027018 2.02E-02 -1.56

Zfp811 NM_183177 1.50E-04 -1.13 Urah NM_029821 4.09E-04 -1.36

Urah NM_029821 2.60E-03 -1.09 Urah NM_029821 1.80E-04 -1.25

Edn1 NM_010104 2.39E-03 -1.04 Cabp4 NM_144532 2.40E-02 -1.20

Il4i1 NM_010215 5.24E-03 -1.04 Tcp10c NM_001167578 7.71E-03 -1.18

Oas2 NM_145227 1.89E-03 -1.03 ND6 AK140300 2.90E-03 -1.13

5830411N06Rik AK030813 1.49E-02 -1.00 Adora2a NM_009630 2.11E-02 -1.07

Upp2 NM_029692 4.25E-02 -0.99 Faah * NM_010173 1.31E-02 -0.94

6h2h

Up-regulated by BSO (Group 1)

Down-regulated by BSO (Group 2)

127

Table 3.2: LPS-downregulated transcripts most affected by BSO in groups 3

and 4. Transcripts were selected for their differential expression between the two

groups BSO+LPS vs LPS alone (cut-off was: fold change, 1.5; P<0.05). Only the top

15 transcripts most affected by BSO (sorted by fold change) are shown. *Transcripts

affected by BSO alone (BSO vs control, with a cut off of FC 1.5, P<0.05). The full list

can be seen in Supplementary file 1. Transcripts in bold were selected for PCR

validation.

GeneSymbol Genbank

Accession

P value log2(FC) GeneSymbol Genbank

Accession

P value log2(FC)

Enho NM_027147 1.44E-04 1.81 4930415C11Rik AI606402 1.69E-02 1.71

Kcnma1 NM_001253364 2.82E-03 1.53 AU019990 NR_033469 8.49E-03 1.70

Sirpb1b NM_001173460 3.89E-03 1.48 AI661453 NM_145489 3.69E-02 1.64

Tmem116 * AK039773 3.62E-02 1.43 Clec4a4 NM_001005860 6.60E-03 1.43

Msx3 U62523 1.19E-02 1.38 Clec4n * NM_020001 2.86E-04 1.34

Tmem51 NM_145402 4.10E-03 1.37 Abhd15 NM_026185 3.57E-02 1.33

Rnf150 NM_177378 3.45E-02 1.36 Zfpm2 NM_011766 2.25E-02 1.32

AI844869 * BE862015 5.22E-06 1.29 D930027P08Rik AK086428 4.17E-02 1.30

Zfp318 NM_021346 2.79E-02 1.21 Ltb4r2 NM_020490 9.21E-03 1.28

Osgin1 * NM_027950 5.05E-04 1.18 Osgin1 NM_027950 5.17E-06 1.26

Bcl2l14 NM_025778 3.59E-02 1.13 5430425K12Rik NR_103550 9.14E-03 1.24

Ypel2 NM_001005341 1.79E-02 1.10 Prss46 NM_183103 1.87E-05 1.23

4930556M19Rik AK047938 3.24E-02 1.09 Arhgap8 NM_028455 4.17E-06 1.20

Rcvrn * NM_009038 7.55E-03 1.03 Zfyve28 NM_001015039 3.48E-04 1.13

Dact1 NM_001190466 2.48E-02 0.99 Rhox2h NM_001100465 4.37E-02 1.09

Gm10778 NM_001142963 4.89E-02 -1.04 Maf NM_001025577 1.56E-02 -1.33

1600014C10Rik NM_028166 7.88E-03 -1.01 Sulf2 NM_028072 6.27E-03 -1.29

E230012P03 AK054025 3.43E-02 -0.88 C1qa * NM_007572 1.79E-02 -1.24

Gm9779 BC006743 2.74E-02 -0.85 C1qc * NM_007574 8.32E-04 -1.09

Slc25a40 XR_376693 9.89E-03 -0.80 Slc9a3r2 NM_023055 2.49E-02 -0.92

C1qa * NM_007572 1.85E-02 -0.75 Pi16 NM_023734 1.12E-02 -0.92

1700027A07Rik AK006404 2.94E-02 -0.72 Cx3cr1 * NM_009987 3.80E-03 -0.82

A430106G13Rik AK053260 2.12E-02 -0.64 Cx3cr1 * NM_009987 3.54E-03 -0.81

Themis2 NM_001033308 2.93E-02 -0.61 Odf3l1 NM_198673 3.47E-03 -0.75

Cx3cr1 * NM_009987 3.33E-02 -0.69

Sepp1 NM_001042614 3.14E-02 -0.69

Fgf11 XM_006532188 3.07E-03 -0.67

Cenpf NM_001081363 5.89E-03 -0.67

Frat2 NM_177603 1.08E-04 -0.64

4831440E17Rik NR_030700 3.53E-03 -0.62

Up-regulated by BSO (Group 3)

Down-regulated by BSO (Group 4)

2h 6h

128

3.5.2 Biological functions associated with the LPS-regulated transcripts

affected by BSO

The molecular basis and biological function of these groups of genes were then

investigated by DAVID using the Functional Annotation Chart Tool. Groups of similar

expressed genes obtained at 2h and 6h were combined and only GOTERM_BP and

Kegg pathway categories with at least 3 genes were considered. As shown in Figure

3.16, Group 1 included functional categories associated with the response to oxidative

stress confirming the hypothesis made previously in 3.3.3. Group 2 was the group

with the most functional categories represented (51 in total; full list shown in

Appendix 15). These categories were mainly associated with immune responses,

inflammation and antiviral host defence including interferon and TLR signalling.

Genes included IL-1β, interferon regulatory factor 9 (Irf9) and signal transducer and

activator of transcription 1 (Stat1). Amongst the genes whose expression was

inhibited by LPS, i.e. Group 3 and Group 4, only few mapped to some functional

categories despite the fact that genes at 2h and 6h were combined obtaining a higher

number of genes in Groups 3 and 4 than in Groups 1 and 2. Group 3 included genes

associated with xenobiotics metabolism such as GSH transferases and cytochrome

P450. The only genes that were part of a functional category in Group 4 were C1q

components and Cx3cr1.

129

Figure 3.16: Functional categories up-regulated or down-regulated by LPS for

each differentially expressed group affected by BSO (Group 1-4). Functional

categories were obtained by DAVID using the Functional Annotation Chart tool with

GO TERM BP and KEGG pathway for each group independently of the time point and

were ordered by EASE score a modified Fisher’s Test (P value <0.5). Genes

belonging to each categories are annotated near to the respective bar in italic. P value

is expressed as a log 10. Only the 15st out the 51 overrepresented categories for G2

are shown here (the rest are shown in Appendix 15).

130

3.6 Validation of the microarray analysis by qPCR

These results were validated by RT-qPCR for 11 genes from Group 1 (IL-1β, Irf9,

myxovirus resistance 2 (Mx2), interleukin 4 induced 1 (IL-4i1), suppressor of cytokine

signalling 1 (Socs1), 2'-5' oligoadenylate synthetase 2 (Oas2), nitric oxide synthase 2

(Nos2) and prostaglandin-endoperoxide synthase 2 (Ptgs2)) and from Group 2

(Srxn1, Prdx1, and Slc7a11) at 2h (Figure 3.17) and 6h (Figure 3.18).

Validation was performed using two sets of samples, one with the same RNA used

for the microarray experiment (qPCR1) and one with the RNA from an entirely

independent experiment (qPCR2).

For all 11 genes tested, the qPCR1 confirmed the differential expression detected by

microarray analysis both at 2h and 6h. The reproducibility of the data obtained was

then tested with the qPCR2 which confirmed the results for 5 out of 7 genes at 2h,

including IL-1β, Irf9, Mx2, IL-4i1, and Srxn1. At 6h, 3 genes out 4 were validated

including Prdx1, Nos2 and Slc7a11.

131

Figure 3.17 (part 1/2): PCR validation of the microarray data at 2 h. Results for 7

genes (Il1b, Irf9, Mx2, Il4i1, Srxn1, Oas2, Socs1) from Group 1 and Group 2

comparing expression data from microarrays (N=3 biological replicates; left graphs)

with results from PCR analysis using all the 4 replicates of the RNA from the same

experiment (N=4 biological replicates; middle graphs) and RNA from an independent

experiment (N=4 biological replicates; right graphs). Data are expressed as fold

change vs one of the respective control samples. For each experimental group, the

mean is also shown. *P<0.05; **P<0.01; ***P<0.001 by unpaired two-tailed Student’s

t-test.

132

Figure 3.17 (part 2/2): PCR validation of the microarray data at 2 h. Results for 7

genes (Il1b, Irf9, Mx2, Il4i1, Srxn1, Oas2, Socs1) from Group 1 and Group 2

comparing expression data from microarrays (N=3 biological replicates; left graphs)

with results from PCR analysis using all the 4 replicates of the RNA from the same

experiment (N=4 biological replicates; middle graphs) and RNA from an independent

experiment (N=4 biological replicates; right graphs). Data are expressed as fold

change vs one of the respective control samples. For each experimental group, the

mean is also shown. *P<0.05; **P<0.01; ***P<0.001 by unpaired two-tailed Student’s

t-test.

133

Figure 3.18:PCR validation of the microarray data at 6 h. Results for 4 genes

(Prdx1, Nos2, Ptgs2, Slc7a11) from Group 1 and Group 2 comparing expression data

from microarrays (N=3 biological replicates; left graphs) with results from PCR

analysis using all the 4 replicates of the RNA from the same experiment (N=4

biological replicates; middle graphs) and RNA from an independent experiment (N=4

biological replicates; right graphs). Data are expressed as fold change vs one of the

respective control samples. For each experimental group, the mean is also shown.

*P<0.05; **P<0.01; ***P<0.001 by unpaired two-tailed Student’s t-test.

134

3.7 Identification of pathways affected by BSO during LPS stimulation

The effect of BSO on the transcription of those LPS-induced genes that are related to

oxidative stress (Group 1) and inflammatory and immune response (Group 2) was

further investigated due to the high number of genes belonging to these categories.

To identify possible common pathways, an unbiased analysis for the over-

represented transcription factor (TF) binding sites was performed using the

oPOSSUM software (Kwon, Arenillas et al. 2012). The results of the analysis are

shown in Figure 3.19. It can be seen that in Group 1 (Figure 3.19A) the TF resulting

in the highest Fisher score and a high number of target genes is NFE2L2 (Nrf2),

whose main function is the response to oxidative stress, thus confirming the results

obtained with DAVID. The TF analysis for Group 2 transcripts is shown in Figure

3.19B. From these data, the TF that had the highest score was NF-κB with its various

subunits. To confirm these results, the dataset for the expression of all known Nrf2

and NF-κB target genes obtained from the literature was compared with the genes for

Group 1 and Group 2 respectively (Table 3.3). From this research, 30% (11 out 38)

transcripts in Group 1 were part of the Nrf2 target genes. However only 3% (13 out

364) of the genes of Group2 were part of the NF-κB target genes. Thus, as only a

very small percentage of NF-κB target genes induced by LPS are in Group 2 (down-

regulated by BSO), the fact that BSO could act simply by down-regulating NF-κB was

ruled out.

135

Figure 3.19: Transcription Factor analysis of Group 1 (A) and Group 2 (B) genes

using the database oPOSSUM. Only the first five TF are shown according to their

Fisher score ranking. The number of genes targeted is in brackets near its TF. The

threshold (dotted line) is set to the mean+1xSD.

136

TF Number target genes

Reference

Match with

microarrays

Match

with

Group

% of TF

target

Group1 Nrf2

25 (Soriano, Baxter et al.

2009, Gorrini, Baniasadi

et al. 2013)

38 11/65 30%

Group2 NF-κB 434 (Boston 2017) 364 12/118 3.2%

Table 3.3: Number of genes targeted by NF-κB or Nrf2 belonging to Group 2 and

Group 1 respectively.

137

3.8 Antiviral response: BSO increases Influenza A replication in LPS-

stimulated RAW cells

Interestingly, the genes identified from Group 2 were associated with the response to

viral infection (herpes, influenza A, and measles for instance) suggesting that BSO

inhibits the antiviral response during LPS stimulation.

To test this hypothesis, RAW cells were infected for 1h with Influenza Virus strain

Puerto Rico/8/34 H1N1 (PR8) after depletion of GSH with BSO for 18h and

subsequent LPS stimulation for 2h. All experiments were carried out by Dr Checconi

from “Università di Roma” and the results are shown in Figure 3.20. Briefly, the levels

of different virus particles (Nucleoprotein (NP), neuraminidase (NA), hemagglutinin

(HA1), and matrix protein (M1)) and the cytosolic protein β-actin as a control from cell

lysates were measured by western blot (Figure 3.20A-B). The ratio NP to β-actin was

then measured by densitometry and shown in Figure 3.20C. In cells infected with

influenza and treated with BSO, the virus particles and particularly NP were higher

than in the control cells. On the contrary, in cells infected but stimulated only with LPS,

virus particles were slightly decreased in comparison with the control cells suggesting

a protection effect triggered by LPS stimulation. Finally, when cells were stimulated

with LPS and BSO, the numbers of virus particles found in the cells was even greater.

These results demonstrate that BSO prevents the antiviral response activated by LPS

signalling, thus suggesting that GSH has an antiviral effect.

These data also raise the question of why antiviral pathways are activated while

stimulating cells with LPS, a TLR4 activator. In fact it has been reported that activation

of TLR4 could lead to induction of antiviral proteins including IFNs and IFN-related

genes (Takeuchi and Akira 2010, Newton and Dixit 2012) such as MxA and OAS

(Barjesteh, Behboudi et al. 2014, Baharom, Thomas et al. 2015). Our data, although

obtained in a model were infectivity was low, suggest that GSH is important for the

activation of an antiviral response. This happens without affecting inflammatory

genes, except for IL-1b whose induction was also facilitated by the presence of GSH.

There is evidence for a fine tuning of TLR signalling (O'Neill 2008), and these data

indicate that GSH may be important in directing it towards specific small patterns of

genes implicated in host defense rather than towards those responsible for the

inflammatory response. Furthermore, recent studies have highlighted the link

between LPS stimulation and activation of the interferon pathway via Stat1 and Traf6

signalling molecules (Sikorski, Chmielewski et al. 2011, Luu, Greenhill et al. 2014).

The list of genes from Group 2 was therefore transferred to the website Interferome

which uses programming language to identify potential interferon downstream

138

signalling molecules (Rusinova, Forster et al. 2013). As shown in the Venn diagram

Figure 3.21, 33% of the genes were IFN targets particularly of type 1 but also type 2

IFN.

These data suggests that GSH induces the antiviral response activated by LPS

signalling via the interferon pathway of type 1 and 2.

139

Figure 3.20: Effect of LPS and BSO on influenza A replication in RAW cells. A

and B. Western blot for influenza virus proteins in RAW cells stimulated or not 2h with

LPS and pre-treated or not with BSO for 18h. β-Actin was used as loading control.

C. Ratio of NP viral protein versus β-Actin in RAW cells using densitometric analysis

expressed as the mean ± SE of the ratio NP/β-Actin (n=8), *P<0.05, ***P<0.0005,

****P<0.0001 versus infected cells (=I) by a paired two-tailed Student’s t-test.

140

Figure 3.21: Type of interferons recognised in Group 2 genes (up-regulated by

LPS but inhibited by BSO). A total of 118 genes (Group 2) were submitted to the

database Interferome v2.01 which classifies genes according to the interferon they

are part of the downstream signalling. It include three types; type 1, type 2 and type

3.

141

3.9 Effect of NAC and Menadione

To understand if the regulation of Group 1 and Group 2 was due to regulatory

properties of GSH or rather to its ROS-scavenging action, further experiments were

performed. We reasoned that if GSH was acting as a ROS scavenger then another

thiol antioxidant would behave in the same way, while a ROS-generating oxidant

would have an opposite effect. For this purpose, we used NAC that is a precursor of

GSH by providing free cysteines and an antioxidant reacting with superoxide (Samuni,

Goldstein et al. 2013). To generate ROS we used menadione that is a quinone

producing ROS constantly (Hassan and Fridovich 1979).

NAC was added to RAW cells one hour before the 2h LPS stimulation and menadione

was added to the cells for 2h without LPS. The doses of NAC and menadione and

time of incubation were selected as reported in published studies (Checconi, Salzano

et al. 2015, Mullen, Hanschmann et al. 2015). The expression level of selected genes

from Group 1 and Group 2 was then analysed by qPCR. As shown in Figure 3.22A,

NAC did not alter the induction of Group 1, genes up-regulated by LPS and further

up-regulated by BSO (Srx1, Prdx1, and Slc7a11). On the other hand, all these genes

where induced by menadione alone suggesting that they were sensitive to ROS.

However, although they are affected by ROS, if these genes were up-regulated by

the ROS produced during LPS stimulation, then they would have been inhibited by

NAC.

Regarding the Group 2, gene up-regulated by LPS and down-regulated by BSO

(Figure 3.22B), NAC did not increase further, or affect in any way, the LPS induction

of these genes (Il-1b, Mx2 or Irf9); on the contrary, NAC inhibited the induction of Il-

1b by about 45% similarly to what was observed with BSO. Similarly, menadione by

itself did not induce the expression of any of the Group 2 genes studied. TNF, which

was also analysed and used as a control for the inflammatory response, was not

affected either by NAC or by menadione (Figure 3.22C). We could then conclude that

ROS are not involve in the antiviral response of RAW cells as neither menadione nor

NAC affected their expression. GSH mediate the antiviral response via another

mechanism that simply a ROS-scavenger.

142

Figure 3.22: Gene expression of seven selected genes from RAW cells after

treatment with NAC, LPS or Menadione. A. qPCR analysis of genes from Group 1.

B. qPCR analysis of genes from Group 2. C. qPCR analysis of TNF used as a marker

of the inflammatory response. Cells were treated with 5mM NAC for 1 h and then

stimulated with 10 ng/ml LPS for further 2 h. Men was added at 10μM for 2 h. Gene

expression was measured by qPCR. Data are expressed as fold change vs one of

the control samples, and are the mean ± SD of six biological replicates from two

independent experiments (For TNF – mean ± SD of three biological replicates).

**P<0.01, ***P<0.001 vs control; ∆ P<0.01 vs LPS by unpaired two-tailed Student’s t-

test.

143

3.10 Discussion

The main aim of this work was to identify genes regulated by GSH during the

inflammatory response. Using microarray analysis, we could identify three groups of

genes affected differently by GSH following LPS stimulation in RAW cells. Firstly,

genes which are regulated by LPS but not by GSH. In fact GSH has a minimal impact

on the gene expression as only 0.42% at 2h and 0.58% at 6h genes affected by LPS

are regulated further by GSH depletion. Thus, 99% of LPS-induced genes are not

regulated by GSH.

Secondly, LPS-induced genes that are inhibited by endogenous GSH. Most of these

genes were targets of Nrf2, a transcription factor involved in the oxidative stress

response (Brigelius-Flohe and Maiorino 2013).One could hypothesize that these

genes are induced by an increased production of ROS triggered by LPS. In fact, using

the EPR spectrometer, we could demonstrate an increase in O2.- produced from RAW

cells following 2h of LPS stimulation. This ROS is known to be rapidly reduced to H2O2

both spontaneously and by the catalytic action of SOD (Fukai and Ushio-Fukai 2011).

Then, H2O2 is reduced by peroxidases to water (Brigelius-Flohe and Maiorino 2013)

and thus depletion of GSH will increase its accumulation explaining why Nrf2 is

activated. This result also provides evidence for the link between LPS and the release

of O2.-, through TLR4 signalling, as demonstrated by previous studies using indirect

assays to measure O2.- in neutrophils and in monocytes following LPS stimulation

(Figure 3.23 - ①) (Landmann, Scherer et al. 1995, Remer, Brcic et al. 2003, Gill,

Tsung et al. 2010).

Finally, we could identify a third group of genes requiring GSH for their induction by

LPS. Among those, genes involved in the antiviral response were identified indicating

that GSH is important for an optimal antiviral response.

Surprisingly, GSH-depletion did not exacerbate the induction of inflammatory

cytokines or genes associated with the inflammatory response, with the only

exception of CXCL10, an interferon gamma induced protein, was up-regulated during

GSH-depletion and LPS stimulation (Appendix 11). Our results differ from what have

been reported in other published studies reporting that thiol antioxidants inhibit NF-κB

expression and decrease several inflammatory genes (Schreck, Rieber et al. 1991)

(Staal, Roederer et al. 1990, Gosset, Wallaert et al. 1999). In fact, that evidence is

based on in vitro or in vivo experiments using exogenously administered thiol

antioxidants or pro-oxidants as shown in Table 3.4. Importantly, our results are not in

contrast with those studies. We believe that all the studies where inhibition of the LPS

144

induction of inflammatory cytokines was achieved by exogenous NAC or GSH are

reproducible. Only, we don’t think that one can draw conclusions on the role of

endogenous GSH, such as hypothesize its anti-inflammatory role, from the results of

those studies (Gosset, Wallaert et al. 1999). Interestingly, we observed a decrease of

IL-1β with NAC and this was observed in another published study by Cu and

colleagues (Cu, Ye et al. 2009). Even though the induction of this inflammatory

cytokine requires GSH, further supporting the idea that one thing it to study the role

of endogenous GSH and a different thing is adding an exogenous ROS scavenger.

Thus, in our study, the results indicate that the large majority of LPS-induced

inflammatory genes do not require GSH or ROS for their induction.

Most importantly, we find that genes involved in the antiviral response that were up-

regulated by LPS were inhibited by GSH depletion. This suggests that GSH is

required to induce an optimal antiviral response. In addition, we observed that LPS

reduced influenza virus infection in our model but this required the presence of GSH.

Most studies investigating the effect of GSH or GSH depletion on viral replication have

shown similar results which have been summarised in Table 3.5. Other studies have

equally shown that viral infection were often linked with reduced GSH level. This GSH

depletion was observed in erythrocytes of patient infected with hepatitis (Swietek and

Juszczyk 1997), in the T CD4+ of patients with HIV (Herzenberg, De Rosa et al. 1997),

in HeLa cells infected with Rhinovirus type 16, the common cold virus (Papi, Contoli

et al. 2008) and in mice infected with a retrovirus inducing immunodeficiency (Brundu,

Palma et al. 2016). Therefore our studies suggest that depletion of GSH in infected

cells could be a virus strategy to increase its replication as GSH stimulated the

antiviral response.

We then highlighted that the interferons type 1 and 2 response were potentially the

pathways affected by GSH depletion. Indeed most of the genes (Mx2, Oas2, Irf9,

Stat1) belong to the Interferon type 1 and type 2 response (Sadler and Williams 2008).

Recent studies have demonstrated a cross-talk between TLR4 signalling and

interferon downstream pathways via Stat1 and Traf6 (Sikorski, Chmielewski et al.

2011, Luu, Greenhill et al. 2014). Our data suggest then that LPS activates TLR4

signalling which then also stimulates the interferon response pathways. According to

this hypothesis, and our results, GSH is essential in this signalling pathway (Figure

3.23 - ②; ③; ④).

Finally, BSO amplifies the expression of genes up-regulated by LPS which are

associated with oxidative stress (Srxn1, Prx1 and Slc7a11). Using menadione, a

ROS-generating agent, we observed a similar up-regulation of their expression. One

could have hypothesize that, as LPS promote ROS generation and ROS induces the

145

expression of these genes by LPS, NAC, by reducing the ROS, will down-regulated

their expression. Therefore, it seems possible that LPS induces Nrf2 target genes

independently of ROS, for instance via the small GTPase RAC1, as described by

Cuadrado and colleagues (Cuadrado, Martin-Moldes et al. 2014). This could suggest

that endogenous GSH might be important for reasons other than scavenging ROS.

For instance, Nrf2 activation depends on oxidation of Keap1, its redox sensor, whose

thiol groups can also be oxidized by GSSG through a thiol/disulfide exchange reaction

(Turpaev 2013). The change in GSH/GSSG ratio caused by BSO could then causes

Nrf2 activation by oxidation of Keap1 leading to the RAC1-dependent activation by

LPS. This direct effect of GSH to Keap1 in the form of glutahionylation could be a

mechanism by which GSH can regulate Nrf2.

In conclusion, in our study, endogenous GSH does not seem to down-regulate the

inflammatory response contrary to what most studies have reported by measuring the

classic cytokines such as IL-6, IL-10 and TNF. However, most studies came to the

conclusion that GSH is an inhibitor of inflammation using either exogenously

administered NAC or GSH, or ROS. Therefore, we hypothesised that the antioxidant

therapy could be efficient only in conditions where increase of ROS or lack of

antioxidants is verified but will be useless if not damageable to other conditions. Also,

it will be important to ensure that therapy does not increase the level of thiol

antioxidants above the concentration of endogenous GSH, in order to not interfere

with physiological redox signalling.

To strengthen our work quantification of proteins from those genes identified in this

study is required. Indeed, a limitation of microarray analysis is to make sure that

proteins will behave similarly to the genes they are translated from in terms of

abundance and mechanism (Waters, Pounds et al. 2006).

146

Figure 3.23: GSH acts as a signalling molecule during LPS stimulation in

macrophages. GSH is required for optimal induction of Nrf2 genes by LPS and

antiviral response by LPS bus does not regulate most inflammatory genes targeted

by NF-κB. ① Activation of TLR4 signalling through LPS. ② Activation of NADPH

oxidase and downstream TLR4 signalling. ③ Activation of transcription factors. ④

Antiviral response.

147

Experiments Thiol /

inhibitor thiol used

Observation Ref

Injection intraperitoneal of

GSH in rats 30min before

LPS injection

Exogenous GSH

GSH decreased mortality in LPS-injected rats by suppressing the inflammatory response

(Sun, Zhang et al. 2006)

In vitro culture of alveolar macrophages stimulated with LPS

NAC Down-regulation of TNF production and its soluble receptors and IL-1β

(Cu, Ye et al. 2009)

HeLa cells transfected with component of NF-κB and stimulated with TNF

NAC Suppression of NF-κB activation

(Oka, Kamata et al. 2000)

Oral administration of NAC to mice treated with LPS

NAC; BSO Inhibition of TNF in serum ; BSO induce TNF production; no effect of NAC in IL-6 or IL-1α in serum

(Peristeris, Clark et al. 1992)

Human alveolar macrophages stimulated with LPS

GSH; NAC; BSO

BSO increase TNF and IL-8 secretion; NAC and GSH decrease TNF, IL-6 and IL-8 secretion.

(Gosset, Wallaert et al. 1999)

Oral administration of NAC to diabetic induced rats treated with LPS

NAC Decrease of TNF induced by LPS in serum

(Sagara, Satoh et al. 1994)

Table 3.4: Studies on the effect of thiols antioxidants (NAC, GSH) or thiols inhibitors

(BSO) on production of pro-inflammatory cytokines.

Table 3.5: In-vitro studies on the effect of BSO and GSH on replication of different

viruses.

Virus Ref Year Effect of BSO on virus proliferation

Herpes simplex virus type-1 replication

(Palamara, Perno et al. 1995)

1995 BSO increases

Human Immunodeficiency virus

(Garaci, Palamara et al. 1997)

1997 BSO increases

Rat cytomegalovirus (Vossen, Persoons et al. 1997)

1997 BSO increases

Sendai virus (Macchia, Palamara et al. 1999)

1998 BSO increases

Influenza A (Cai, Chen et al. 2003) 2003 BSO increases

Human echovirus 9 (Mikami, Satoh et al. 2004)

2004 BSO decreases

Picomavirus virions (Smith and Dawson 2006)

2006 BSO decreases

Dengue virus production (Tian, Jiang et al. 2010) 2010 BSO increases

Porcine circovirus type 2 (Chen, Ren et al. 2012) 2012 BSO increases

148

Chapter 4

Redox state of Peroxiredoxins and Thioredoxin

in LPS-stimulated macrophages

149

4.1 Introduction

Thiol oxidation is a reversible form of post-translational protein modification (PTM)

which can result in structural and functional changes in thiol-containing proteins.

HMGB1 illustrate the importance of this PTM in an inflammatory context. This classic

DAMP secreted by monocytes after an inflammatory stimulus can attract inflammatory

cells and helps in their maturation when its C23 and C45 form a disulphide bonds and

its C106 is in the reduced form allowing it to bind TLR4 and stimulate cytokine

production (Messmer, Yang et al. 2004, Dumitriu, Baruah et al. 2005, Venereau,

Casalgrandi et al. 2012, Yang, Lundback et al. 2012). However, a change in its

cysteines redox state inhibits its inflammatory functions.

Similarly to HMGB1, Prx1, Prx2 and Trx are released from RAW cells after LPS

stimulation later than classical cytokines (Salzano, Checconi et al. 2014, Checconi,

Salzano et al. 2015). Furthermore, many studies have demonstrated immune

properties of these redox proteins. Trx acts as a chemoattractant for leukocytes

potentially due to its enzymatic activity on cell surface protein through its cysteines;

C32 and C35 (Bertini, Howard et al. 1999). Extracellular dimeric Prx1 binds to TLR4

leading to secretion of cytokines such as TNF and IL-6, helped by its C83 which

stabilise its dimeric form (Riddell, Wang et al. 2010). Finally, it has been demonstrated

that exogenous Prx2 can trigger TNF production from RAW cells indicating potential

pro-inflammatory properties (Salzano, Checconi et al. 2014).

The role of cysteines in the mechanism of secretion of these proteins was also

investigated. As it is the case for HMGB1 and Il-1β, these proteins lack a secretory

signal peptide and therefore use a non-classical secretory pathway that is non-Golgi

dependent (Rubartelli, Bajetto et al. 1992, Nickel 2003). Tanudji and colleagues

investigated the release of Trx by mutating the cysteines contained in its redox active

site C32 and C35 but also C73 which is involved in Trx dimerization (Andersen,

Sanders et al. 1997, Tanudji, Hevi et al. 2003). The study demonstrated that mutation

of these cysteines did not alter Trx release from cells. One limitation of this study is

that it focused on the three main functional cysteines excluding possible thiol

modifications to the two other cysteines present in human Trx. Similarly to this study,

Mullen and co-workers examined the role of cysteine oxidation in the secretion of Prx1

and Prx2 (Mullen, Hanschmann et al. 2015). A series of mutations were performed on

the cysteines in Prx1 and Prx2. Mutation of resolving or peroxidatic cysteines was

sufficient to prevent the release of these Prxs from cells demonstrating that these

proteins were subjected to dimerization through C52 and C173 for Prx1 and C51 and

C172 for Prx2 before secretion via exosomal vesicles. Although the importance of the

150

dimerization of Prx1 and Prx2 has been shown, both techniques were performed on

mutant proteins excluding the redox sensitivity of endogenous proteins.

All post translational modification in those proteins cysteines and associated

properties are shown in Table 4.1 in addition to other post translational modifications

previously reported. To understand better the role of endogenous Prx2, Prx1 and Trx

in inflammation, analysis of the overall redox state of these proteins is required.

However, the lack of sensitive techniques limit previous study and thus development

of techniques to identify redox sensitive cysteine is challenging (Riederer 2009).

Currently, new tools have been developed allowing the direct study of thiol oxidation.

As described by Eaton, a variety of alkyl agents react directly with reduced thiols such

as iodoacetamide, iodoacetate and maleimide. These agents can be attached to

chemical compounds to enable detection, for instance biotin or horseradish

peroxidase which are detectable using downstream processes such as

immunoprecipitation, proteomics such as mass spectrometry or Western blot (Eaton

2006). Cox and colleagues analysed the redox state of Prxs using thiol alkylation with

N-Ethylmaleimide (NEM) by immunoblotting (Cox, Winterbourn et al. 2010). NEM is

an alkene which reacts covalently with the sulfhydryl group of cysteines in proteins to

form an irreversible carbon-sulphur bond. In this study, two redox states of Prx2 were

detected by Western blot: the reduced monomer and the oxidised dimer (catalytic

form). However, although this agent blocks further oxidation it does not indicate the

number of free thiols and thus exclude potential discrimination between hyperoxidised

monomer and completely reduced monomer (Cox, Winterbourn et al. 2010).

In this chapter, we used a 10kDa PEGylated maleimide to binds covalently free thiols

contained in Trx, Prx1 and Prx2 from intracellular and extracellular samples of

untreated and LPS-stimulated RAW cells. This MalPEG fixation of proteins will

increase the molecular weight of protein with free thiols and then be determined by

Western blot analysis in order to detect potential redox changes linked with the

inflammatory response.

Aim: Prxs and Trx are released from macrophages following endotoxin

stimulation. Cytokines- and chemokines-like functions have also been

identified in these proteins. In this chapter, we investigated whether Prxs and

Trx are in a different redox state when secreted than within the cells in

association with potential functions. For this purpose, we set up a methodology

based on labelling protein thiols with PEGylated maleimide (maleimide-PEG;

MalPEG), an alkylating agent.

151

Protein Cysteine Thiol oxidation

modification reported

Role Ref

mouse and human Trx

C62

S-nitrosylation; Disulphide formation C62-C69

n.d (Gasdaska, Kirkpatrick et al. 1996, Haendeler 2006, Wu, Parrott et al. 2011)

C69

S-nitrosylation; Disulphide formation C62-C69

n.d

C73

Glutathionylation, Dimerisation, S-nitrosylation of C73

Growth factor

C32

Redox activty, disulphide formation C32-C35

Catalytic activity / Chemotaxis / Secretion

(Bertini, Howard et al. 1999) C35

Redox activty, disulphide formation C32-C35

Catalytic activity / Chemotaxis / Secretion

mouse C46 n.d n.d

mouse and human Prx1

C52-C173 Interchain disulphide bonds (dimerisation)

Catalytic activity /Secretion

(Mullen, Hanschmann et al. 2015)

C83 n.d Binding TLR4 (when Prx1 is in a dimer)

(Riddell, Wang et al. 2010)

C71 S-nitrosylation n.d

(Engelman, Weisman-Shomer et al. 2013)

mouse and human Prx2

C51-C172 Interchain disulphide bonds (dimerisation)

Catalytic activity / Secretion

(Mullen, Hanschmann et al. 2015)

C51-C172 Glutahionylation Transmission of redox signal with H2O2

(Peskin, Pace et al. 2016)

C70 n.d n.d

Table 4.1: Thiol oxidation modifications reported in Trx, Prx1 and Prx2 and functional

roles associated.

152

4.2 The Maleimide-PEG technique

The MalPEG technique was previously described by Momand and co-workers (Wu,

Thomas et al. 2000). Of note, MalPEG, like NEM, a maleimide group i.e. it is an alkene

which covalently reacts with sulphur groups as shown Figure 4.1. However due to its

10kDa polyethylene glycol (PEG), a long linear hydrosoluble and highly stable

polymer, any protein bound with MalPEG will have a greater molecular weight

(increase by 10kDa) causing a visible shift on a Western blot due to retarded mobility.

As shown Figure 4.2, if the protein does not contains free thiols or if thiols are already

engaged in disulphide bonds (oxidised thiol), the maleimide cannot bind the molecule

and therefore does not change the molecular weight. In the present study, cell lysate

and supernatant (containing potential secreted proteins) were mixed with either NEM

as a control or with MalPEG.

153

Figure 4.1: Chemical structure of NEM and MalPEG. The alkene function of the

maleimide reacts specifically with protein thiols. Skeletal structures were obtained

from Sigma and NANOCS for NEM and MalPEG respectively.

154

Figure 4.2: Methodology of the MalPEG technique. Protein with a free thiol

(=reduced protein) binds with MalPEG increasing its molecular weight by 10kDa. The

change of molecular weight induced by MalPEG is detected by Western blot due to

electrophoresis mobility shift assay. On the contrary if the protein does not contain

free thiol (=oxidised protein), the MalPEG will not bind the protein and therefore its

molecular weight will not change.

155

4.3 Cell viability upon LPS stimulation

A MTT assay was performed to assess the viability of RAW cells with different

concentrations of LPS; 0, 50, 100 and 200ng/ml. As observed by the MTT assay in

Figure 4.3, the viability was affected similarly by concentration of LPS ranging from

50 to 200ng/ml with a 20% decrease in cell viability. Therefore, a concentration of

100ng/ml of LPS was used in most experiments to ensure a robust stimulation that

was sufficient to result in protein secretion (Salzano, Checconi et al. 2014).

156

Figure 4.3: RAW cells viability after treatment with different LPS concentration.

RAW cells were plated at 1x10⁶ cells overnight before treatment in 1ml of Opti-MEM

with or without 50, 100 or 200ng/ml of LPS for 24h. Following the stimulation, cells

were analysed by MTT assay.

0

20

40

60

80

100

120

Control LPS 50 LPS 100 LPS 200

Ab

so

rba

nc

e a

t 5

90

nm

(%

)

157

4.4 Optimisation of MalPEG concentration in RAW cells

Ideally, the MalPEG added to cell lysates or to the supernatant should be sufficient to

block all free thiols present in the sample. RAW cells were stimulated 24h with

100ng/ml of LPS to ensure release of Prxs and Trx. MalPEG was then added to the

lysis buffer at different concentrations from 0 to 1mM. The MalPEG concentration was

then selected using two techniques: a Western blot to detect Trx and a colorimetric

assay, DTNB assay, measuring free thiols in lysates. Of note, in all these experiments,

samples not treated with MalPEG were treated with NEM to block any free thiol and

prevent artefactual formation of oxidized forms during the sample processing. The

Western blot in Figure 4.4 with NEM treatment shows a band at 12kDa corresponding

to the Trx monomer. Using MalPEG, Trx was separated into two forms one around

32kDa and one between 50 and 75kDa. The 32kDa form started to disappear with

concentration greater than 0.4mM MalPEG and the band observed between 50 and

75kDa was also less clear. This was explained by the viscosity of the MalPEG

preventing samples from running correctly through the polyacrylamide gel. A

difference between LPS and non-treated cells was observed at MalPEG

concentrations of 0.2 and 0.3mM. However to make sure that MalPEG reacted with

the majority of free thiols in the sample, the DTNB assay was performed. As shown

Figure 4.5, MalPEG at a concentration of 0.2 and 0.3Mm bound two thirds of the total

free thiols. Therefore, MalPEG was used in this concentration range in further

experiments.

158

Figure 4.4: Optimisation of MalPEG concentration in RAW cells. Two

independent experiments were performed in the same conditions (treated or not with

100ng/ml of LPS) and cell lysates were either mixed with NEM as a control or with

increasing concentrations of MalPEG from 0 to 0.7mM. Tagged Trx was then

analysed by Western blot in non-reducing conditions using polyclonal antibody anti-

mouse Trx.

159

Figure 4.5: Determination of the effect of MalPEG concentration on free thiols

using the DTNB assay. After treatment with 100ng/ml of LPS), cell lysates were

either mixed with NEM as a control or with increasing concentration of MalPEG from

0 to 1mM. Standard curve of NAC concentration (μM) was used for calculation of free

thiols concentration in samples. Assay were performed in triplicate for each condition

and read at 412nm. *<0.005 versus control by T.test.

160

4.5 Determination of the redox states of Prx1, Prx2 and Trx

The redox states of Prx1, Prx2 and Trx were assessed in samples consisting of RAW

cell lysates or their culture supernatants.

4.5.1 Trx is secreted and undergoes redox changes in response to LPS

stimulation

Mouse Trx (12kDa) has six cysteines, and therefore six potential free thiols: C32, C35,

C46, C62, C64 and C73. This is illustrated with the model structure of mouse Trx

monomer obtained from SWISS-MODEL showing two sides of the same molecule in

Figure 4.6A. Therefore MalPEG could theoretically increase the molecular weight of

Trx from 12kDa to 72kDa depending on the number of free thiol as summarise in the

table in Figure 4.6 B.

RAW cells were treated with MalPEG or NEM (which does not modify the molecular

weight) after stimulation with 100ng/ml LPS and the following cell lysates and

supernatant were analysed by Western blot.

As observed in Figure 4.7, samples treated with NEM indicates that Trx is found

intracellularly as a 12kDa band, consistent to its molecular weight. However,

regarding the protein secreted from cells, Trx is only released when the cells are

stimulated with LPS. MalPEG could then discriminate Trx by fixing free thiols. As

observed out all the possibility stated previously, in the table Figure 4.6B, only two

forms were detected in the cell lysate: one of 32kDa (=2 MP / 2 free -SH) and one of

62kDa (= 5 MP / 5 free -SH) and two forms in the release of 32kDa (= 2 MP/2 free -

SH) and 52kDa (= 4 MP/4 free -SH). Molecular weights of the bands were estimated

manually using the migration distance of each band versus the dye front with the

ladder as the standard curve.

Further analysis were then carried on by measuring the densitometry of each band.

These are summarised in a graph in Figure 4.8. It can be noted that the 32kDa form

was considered more oxidised compared to the 52/62kDa forms as they contain more

than 4 free thiols. As observed, the intracellular oxidised form (red bar) disappears

from the cell lysate samples when treated with LPS. The same form seems to appear

in the supernatant where the reduced forms (blue bar) were quasi inexistent

independently of the treatment. This suggest that only oxidised Trx is released.

The fact that at least 4 free thiols could be tagged (MW: 52kDa) indicate that MalPEG

was able to tagged most of the free thiol and therefore these thiol were exposed to

MalPEG. Because intracellular Trx with LPS was mainly reduce, it could also indicate

a conformational change preventing MalPEG fixation in the extracellular media.

161

Figure 4.6: Representation of Mouse Trx structure and potential site of MalPEG

fixation. A. Two sides of the model structure of mouse 105 aa Trx obtained from

SWISS-MODEL by X-RAY diffraction (last reviewed 15th January 2017). Cysteines

are indicated in yellow. B. Table illustrating all the potential possibilities for MalPEG

to bind free thiols in Trx.

162

Figure 4.7: Redox state of Trx in RAW cells lysates and in release after LPS

stimulation. Representation of two Western blot analysis of RAW cell lysate (upper

panels) and RAW cell release after acetone precipitation (lower panels) after

stimulation with LPS. Analysis were performed in reducing conditions using polyclonal

anti-mouse Trx antibody. The black arrows indicate the position of reduced or oxidised

forms determined by the number of MalPEG fixed to the protein.

163

Figure 4.8: Densitometry of each form detected in the cell lysate (n=8) and in

the released from cells (n=12) of Trx. Reduced form (4/5MalPEG = 4 free -SH) are

in blue while oxidised form (2MalPEG = 2 free -SH) are in red. Data are expressed at

the ratio of the mean +/- standard deviation. * P<0.05; ** P<0.005; *** P< 0.001 versus

LPS are a paired two-tailed T.test for eight independent experiments for the cell lysate

and twelve for the release.

164

4.5.2 LPS stimulation has distinct effects on the redox state of Prx1 and Prx2

4.5.2.1 Prx1 is released but does not undergo intracellular redox changes

following LPS stimulation

Mouse Prx1 (22kDa) contains 4 cysteines: C52, C71, C83 and C173 as illustrated in

Figure 4.9A. C52 and C173 can engage in disulphide bonds resulting in a dimer of

44kDa (red dotted line). The table in Figure 4.9B shows all the possibilities for the

bands that could be observed after treatment with MalPEG.

As observed in the Western blots in Figure 4.10 the monomeric form of Prx1 is never

observed in the cell lysate tagged with NEM independently of LPS stimulation. Only

the dimer is observed at a band of 40kDa. Similarly to Trx, this dimer is detected in

the released from cells mainly with LPS stimulation.

The redox state, assessed by the presence of MalPEG, in the cell lysate did not

change whether the cells were treated with LPS or not. But overall, intracellular Prx1

was detectable as a mixture of reduced forms as the dimer shift to a range of

molecular weight from 54 to 94kDa with MalPEG (= 1 to 5 MP/1 to 5 free -SH). In the

supernatant, only LPS-stimulated cells released Prx1 and only two forms were

detected with MalPEG: one at 64 kDa (= 2 MP/2 free -SH) indicating a dimer with two

free thiols and one that was fully oxidised (no MP/no free -SH). This fully oxidised

form was not observed in the cell lysates.

165

Figure 4.9: Representation of Mouse Prx1 and potential site of MalPEG fixation.

A. Scheme of Mouse Prx1 with the four cysteines present in each monomer (22kDa)

and the potential intermolecular disulphide bonds in red dotted line. B. Table

illustrating all the potential possibilities for MalPEG to bind free thiols.

166

Figure 4.10: Redox state of Prx1 in RAW cells lysates and in release after LPS

stimulation. Representation of two Western blot analysis of RAW cell lysate (upper

panels) and RAW cell release after acetone precipitation (lower panels) after

stimulation with LPS. Analysis were performed in non-reducing conditions using

polyclonal anti-mouse Prx1 antibody. The black arrows indicate the position of

reduced or oxidised forms determined by the number of MalPEG (MP) fixed to the

protein.

167

4.5.2.2 LPS stimulation causes a change in the redox state of Prx2 and its

release from RAW cells

Mouse Prx2 (22kDa) contains three cysteines: C51, C70 and C172 as illustrated in

Figure 4.11A, with two cysteines potentially involved in an intersubunit disulphide link

to form a 44kDa dimer. Similarly to Prx1, but simpler due to the presence of three

rather than four cysteines, there are a number of possibilities for MalPEG to bind to

Prx2 as shown in table Figure 4.11B. Analysis of the Western blot of the cell lysate

tagged with NEM only shows the dimer form of Prx2 (Figure 4.12). The monomer was

not detected. Following LPS stimulation this dimer was present in lower amounts

intracellularly but in greater quantities outside the cells. With MalPEG, the dimer was

discriminate in two forms: one fully oxidised at 44kDa (= 0 MP/ no -SH) and one with

two free thiols at 64 kDa (= 2 MP). Interestingly, in the cell lysate, both forms were

observed but only the more reduced one (64kDa) was observed when treated with

LPS. The opposite was observed extracellularly, both form were observed with LPS

but only the fully oxidised form (44kDa) in non-treated cells. Overall, Prx2 is more

reduced inside cells than in the supernatant.

These results were analysed further by densitometry of the bands on the Western

blots as shown Figure 4.13. The oxidised form of Prx2 in the cell lysate was not

present after LPS stimulation. On the contrary, a reduced form was detected in the

supernatant following LPS stimulation. These data illustrate a redox dynamic as the

oxidised disappear with LPS stimulation and a reduced form appeared extracellularly.

168

Figure 4.11: Representation of mouse Prx2 and potential site of MalPEG

fixation. A. Scheme of Mouse Prx2 with the three cysteines present in each monomer

(22kDa) and the potential intermolecular disulphide bonds in red dotted line. B. Table

illustrating all the potential possibilities for MalPEG to bind free thiols.

169

Figure 4.12: Redox state of Prx2 in RAW cells lysates and in release after LPS

stimulation. Representation of two Western blot analysis of RAW cell lysate (upper

panels) and RAW cell release after acetone precipitation (lower panels) after

stimulation with LPS. Analysis were performed in non-reducing conditions using

polyclonal anti-mouse Prx2 antibody. The black arrows indicate the position of

reduced or oxidised forms determined by the number of MalPEG fixed to the protein.

170

Figure 4.13: Densitometry of each form detected in the cell lysate (n=8) and in

the releasate from cells (n=8) of Prx2. Reduced form (2 MalPEG = 2 free -SH) are

in blue while oxidised form (0 MalPEG = 0 free-SH) are in red. Data are expressed at

the ratio of the mean +/- standard deviation. * P<0.05; ** P<0.005; *** P< 0.001 versus

LPS are a paired two tailed T.test for eight independent experiments for the cell lysate

and for the release.

171

4.6 Applicability of the MalPEG methods to other proteins

Once the redox state of Prx1, Prx2 and Trx was monitored, the MalPEG technique

was also tested to other potential proteins that may be redox sensitive such as Prx4,

Hsp70, and STAT3. Prx4 and Hsp70 were studied in RAW cell lysates with and

without LPS stimulation and STAT3 was studied in the rat oligodendrocyte cell line,

CG4 cell lysate without stimulation. Prx4 belongs to the same family as Prx1 and Prx2:

the typical 2-cys peroxidase. Prx4 has four cysteines. This protein has been recently

identified as a potential biomarker in cardiovascular disease (Abbasi, Corpeleijn et al.

2012). Hsp70 is a heat shock protein which is released in stress conditions and

contains five cysteines and has been identified as glutathionylated by redox

proteomics (Fratelli, Demol et al. 2002). Finally, STAT3 which is involved in the

intracellular signalling pathways downstream of TLR activation that result in the

production of cytokines and other inflammatory molecules was investigated in CG4

cells in our laboratory. Unfortunately, most of these studies were unsuccessful. The

anti-Prx4 antibody was not able to detect mouse Prx4. Two antibodies were tested

(Figure 4.14A). Anti-Stat3 could not detect the protein labelled with MalPEG which

could be explained by the fact that MalPEG change the conformation of the protein

and peptide recognise by the antibody (Figure 4.14B). Only Hsp70 was detectable in

the cell lysate but also in the released from cells after LPS stimulation (Figure 4.14C).

However, its redox state was not affected by LPS as no change was observed. These

results show that this technique is wholly dependent upon the availability of specific

antibodies that are able to detect the protein of interest, even when MalPEG is present

on their cysteine residues.

172

Figure 4.14: Redox state of Prx4 (A); STAT3 (B) and Hsp70 (C); analysed by

Western blotting in non-reducing conditions. Redox state of proteins was

measured by adding MalPEG to cell lysate and supernatant. NEM was used as a

control. Proteins were then detected by Western blot following non-reducing SDS-

PAGE using anti-Prx4, anti-STAT3, or anti-Hsp70 antibodies. Molecular weight of

each protein and their number of cysteines are shown in brackets.

173

4.7 Redox state of Prx2 in HEK cells with TNF and Menadione

In order to see if the redox change observed in response to LPS was cell specific, the

redox state of Prx2 was investigated in HEK cells, a human embryonic cell line,

stimulated with TNF and Menadione. TNF was previously used to increase the

secretion of Prx2 in HEK 293 cells while Menadione increase the ROS production

thus implying an oxidant environment (Salzano, Checconi et al. 2014). As shown in

Figure 4.15, without MalPEG, Prx2 was detectable as a monomer (22kDa) and a

double dimer (around 44kDa) as two bands were observable corresponding to the

glutathionylated form and unglutathionylated form (Salzano, Checconi et al. 2014).

When tagged with MalPEG, the monomer form disappear. The double dimer around

44kDa was still present but a new form at 64kDa was also detected. The monomer

form may have disappear by mixing with the dimer form suggesting that the monomer

was not completely oxidised but contains two free thiols (20kDa (=2 x 10kDa MP) +

22kDa (Prx2 monomer) = 42kDa). The form at 64kDa could be explained if the dimer

form contains in total 2 free thiols which correlate with the idea that two out three

cysteine by monomer are engaged in intramolecular disulphide bonds. Interestingly,

no difference in redox forms was observable between the different treatments

indicating that the redox state of Prx2 was not sensitive to the treatment applied.

174

Figure 4.15: Redox state of Prx2 in HEK 293 cells treated with TNF and

menadione. Cells lysate were mixed with 0.2 mM of MalPEG or 50mM NEM used

as a control. Redox state of Prx2 was then analysed by Western blot in non-

reducing condition using polyclonal anti-Prx2 antibody.

175

4.8 Gene profile expression of Prx1, Prx2 and Trx in RAW cells

We wondered if the release of Trx, Prx1 and Prx2 proteins from RAW cells was due

to induction of their respective transcription following LPS stimulation or if these

proteins were secreted from an existing pool of proteins already present in the cells

without LPS-stimulation.

For this purpose, we analysed the data obtained from the gene expression microarray

experiment previously described in Chapter3-3.5 - Effect of GSH depletion during

LPS stimulation on the gene expression profile of RAW cells.

As previously observed and as shown in Table 3.1, Prx1 is up-regulated by LPS

treatment and further up-regulated if cells were previously depleted with GSH using

its inhibitor, BSO. On the contrary, Trx and Prx2 were not affected neither at 2h nor

6h following LPS stimulation and were not affected by GSH depletion (Figure 4.16).

We could then hypothesise that while Prx1 gene is up-regulated by LPS before its

protein secretion, Prx2 and Trx are secreted from a present pool of proteins.

176

Figure 4.16: Gene profile expression of Prx1, Prx2 and Trx in RAW cells

following LPS and BSO stimulation. Data are provided from Chapter3-3.5 - Effect

of GSH depletion during LPS stimulation on the gene expression profile of RAW cells.

RAW cells were incubated 24h with 120μM BSO before being stimulated with 10ng/ml

of LPS for 2 or 6h. Total RNA was extracted and hybridised in cDNA Chip before

further analysis by microarray technology as described Chapter 3-3.5. Data are

expressed as the fold change compared with one chosen control (mean ±SD of three

biological replicates).** P value < 0.001 versus Control by unpaired two-tailed

Student’s t-test, ∆<0.005 versus LPS by unpaired two-tailed Student’s t-test.

0

0,5

1

1,5

2

2,5

3

3,5

4

4,5

5

Prx1 Prx2 Trx Prx1 Prx2 Trx

2h 6h

Control LPS BSO BSO+LPS

**

**

**

**

177

4.9 Discussion

The MalPEG technique has allowed us to define the different redox states of Prx1,

Prx2 and Trx in RAW cells following LPS stimulation. These redox changes are

summarised in Figure 4.17. While we often consider Prx1/2 existing only as two

forms, a reduced monomer or a disulphide-linked oxidised dimer, we found that there

are further degrees of oxidation. Prx1 exists in various reduced dimer forms

intracellularly which are not affected by LPS stimulation. However, LPS led to the

secretion of Prx1 in two forms, a reduced one, with 2 free SH (suggesting one free

SH by monomer), and a fully oxidised dimeric form which is exclusively detected

extracellularly. Prx2 and Trx are both affected similarly by LPS stimulation: in normal

conditions, they both exist as a mixture of reduced and oxidised forms but after LPS

stimulation the oxidised forms disappear from the cell lysate. Trx is then detected as

an oxidised form in the supernatant while Prx2 is detected as a reduced form in the

supernatant. This suggests that Prx2 is released in the oxidised form but is reduced

extracellularly using an electron donor such as Trx (Perez-Perez, Mata-Cabana et al.

2009). This observation also supports the hypothesis that there is an extracellular

redox dynamic mediated by Prx2 and Trx which could catalyse, by thiol disulphide

exchange, extracellular substrates at the surface of cells or in the secretome

(Salzano, Checconi et al. 2014) (Figure 4.17). According to this hypothesis, Trx could

oxidise protein thiols due to the absence of Trx reductase in the extracellular

environment (Salzano, Checconi et al. 2014). This has already been observed in

bacteria where Trx, in an oxidising environment, can act as an oxidant (Debarbieux

and Beckwith 2000). In fact, our work supports this theory, as Trx was mainly found

oxidised in the secretome and could not therefore act as a reductant.

It also can be noted that 24h after LPS stimulation, the cell lysate contains mainly

reduced forms of the proteins compared to the non-treated cells. In fact, cells could

secrete the oxidised form in order to keep a highly reduced intracellular environment,

or because the oxidised form could be toxic. This hypothesis is reinforced by the

microarray analysis data showing that transcription of Trx and Prx2 is not increased

by LPS. Thus, it seems that Prx2 and Trx are released from an existing pool of protein

rather than by increasing their transcription, in contrast to Prx1. Actually, other

significant differences between Prx1 and Prx2 have been reported (Lee, Choi et al.

2007). Although, both are 2-cys Prxs, 90% identical in amino sequence and only differ

by the presence of one extra cysteine in Prx1, they seem to be regulated differently

and have different biological roles (Lee, Choi et al. 2007).While Prx1 acts as a

178

molecular chaperone by protecting substrate from oxidative stress, Prx2 privileges its

detoxifying peroxidase function becoming itself oxidised (Lee, Choi et al. 2007). This

could explain why we detect Prx1 in many reduced forms but never fully oxidised

independently of LPS stimulation while Prx2 is detected in the oxidised and reduced

form prior to LPS stimulation.

Interestingly, the fully oxidised form of dimeric Prx1 is only observed in the

extracellular environment after LPS stimulation and this could be important in its role

as a DAMP which binds TLR4 (Riddell, Wang et al. 2010). It could also be possible

that Prx1 is released in its reduced form (dimer with 2 free SH) and become fully

oxidised extracellularly (Figure 4.17). Although our previous work ruled out this

possibility at least in term of oxidation to a disulphide-linked homodimer (Mullen,

Hanschmann et al. 2015). Oxidation may take place in the form of sulfenylation which

acts as an intermediate stage before interacting with TLR4 (Beedle, Lynham et al.

2016). In fact, this fully oxidised form also suggest inactivation of its catalytic activity

as it cannot interact with molecules and supports the DAMP role of Prx1. However, at

this stage, we have no evidence to tell whether the DAMP activity of Prx1 is restricted

to a specific redox form or it is an intrinsic property of the protein, independently on

its redox state.

Surprisingly, despite the fact that proteins studied have various cysteines, the same

ones were targeted by MalPEG suggesting a stability in the mechanism of maintaining

these redox forms. This was even more evident for Trx which contains 6 cysteines in

the mouse isoform and is only detected in two redox states; with two and five free

thiols in the lysate and with two and four free thiols in the releasate from RAW cells.

Therefore, MalPEG can target most of the thiols and is not limited by steric hindrance

of the 10kdA PEG. However, it is possible that after LPS stimulation, conformational

change of the protein take place and that is why the oxidised Trx form is mainly

observed extracellularly.

Finally, redox changes of Prx2 were not observed in HEK cells despite the use of the

strong oxidant menadione and TNF which helps to secrete Prx2. This suggests a

specificity of the redox change to LPS stimulation as both LPS and TNF stimulate

different signalling pathways. Indeed, LPS bind the TLR4 receptor while TNF is

recognised by TNF Receptor 1 or 2 leading to the activation of different signalling

mechanisms (Wajant, Pfizenmaier et al. 0000). It is possible that oxidation of Prx2

has a role in this series of activation of signalling proteins specific of the TLR4

pathway.

179

We should acknowledge that the MalPEG method has some limitations as shown by

attempting to measure the redox state of other proteins (Prx4, Stat3). Firstly, steric

hindrance of the 10kdA PEG could prevent MalPEG to alkylate non accessible Cys

located in a small pocket or inside the protein. Secondly, the quality, specificity and

sensitivity of the antibodies used are the main technical limitation. Thirdly, another

inconvenience was that samples, once reacted with MalPEG could not be stored

frozen. Indeed it was observed in this study that running previously frozen samples

lead to unclear bands in Western blot possibly due to instability of the MalPEG.

Finally, a recent study has also shown the loss of the PEG during SDS-PAGE and

recommended to avoid heating MalPEG containing-samples above 60˚C; our study

followed that recommendation (Zhang, Liu et al. 2015).

In conclusion, the MalPEG technique has allowed us to detect redox change of

proteins and highlight a redox dynamic performed by extracellular Prx2 and Trx in

response to LPS stimulation in RAW cells. In fact, we could identify different degree

of oxidation of Prxs and Trx and identification of specific redox-dependent biological

function is required to strengthen our findings. Further work to understand the

signalling pathway leading to redoxkines secretion and redox changes is also needed.

The identification of the targets of Prx2 and Trx redox catalytic cycle will be

investigated in the following chapter (Chapter 5).

180

Figure 4.17: Redox forms detected in RAW cells stimulated or not with LPS for

24h. Prx1 (blue), Prx2 (green) and Trx (yellow) are schematised in reduced (red) or

oxidised (ox) forms intracellularly and extracellularly with or without LPS stimulation

according to their relative abundance detected by Western blot. NT, untreated cells.

Following LPS stimulation, Prx1 is released extracellularly and could act as a DAMP

while Prx2 and Trx undergo catalytic activity oxidising free thiol at the cell surface.

181

Chapter 5

Changes in the redox state of membrane

proteins associated with the inflammatory

response

182

5.1 Introduction

Prx1, Prx2 and Trx are released from cells following inflammatory stimuli in specific

redox states probably associated with their pro-inflammatory functions as discussed

in Chapter 4. For instance, extracellular Prx2 can stimulate TNF production in

macrophages, and extracellular Trx can act as a chemokine to attract immune cells

(Salzano, Checconi et al. 2014) (Bertini, Howard et al. 1999). This secretion of

enzymes linked with oxidative stress and redox regulation following inflammatory

stimuli was also reported for protein disulphide isomerase (PDI) in eosinophils (Dias,

Amaral et al. 2014), for myeloperoxidase in neutrophils (Nussbaum, Klinke et al.

2013), and more recently for superoxide dismutase (SOD) in human neutrophils

(Iversen, Gottfredsen et al. 2016).

The secretion role of these redox enzymes in the inflammatory context is currently

under investigation in particular for thiol oxidoreductase enzymes such as Prx and Trx

which could control thiols at the surface of cells to modulate immune functions

(Metcalfe, Cresswell et al. 2011, Salzano, Checconi et al. 2014). According to this

model, and as seen in Figure 5.1, Prxs use Trx as an electron donor which in return

oxidoreduce surface thiols, thus changing target protein conformation for instance by

dimerization. Released PDI could, in addition, control the level of these exofacial thiols

at the surface of immune cells (Jiang, Fitzgerald et al. 1999).

In fact and reinforcing this hypothesis, a number of studies have demonstrated that

an increase in surface free thiols on immune cells is linked with activation of immune

responses (Metcalfe, Cresswell et al. 2011). This was mainly demonstrated in

lymphocytes such as in isolated CD8+ T from mice where an increase in surface free

thiols was observed after stimulation of their T receptor with LCMV-Armstrong a virus

(Pellom, Michalek et al. 2013). Similarly, rats in which surface free thiols of

lymphocytes were artificially increased were more likely to develop arthritis than

control rats (Gelderman, Hultqvist et al. 2006). This was explain by an excessive

immune reactivity following this increase of free thiols demonstrated with an excess

release of IL-2 a pro-inflammatory cytokine previously associated with arthritis.

Recently, this increase of thiols at the cell surface was also detected in monocytes

cell lines following TNF or LPS stimulation and detected using a fluorescent derivative

of maleimide (Szabo-Taylor, Toth et al. 2017). Furthermore, the same research group

observed a correlation between elevated levels of free thiols at the surface of

circulating monocytes in rheumatoid arthritis disease patients in comparison with

healthy donors.

183

In addition, a number of immune receptors in which thiols were sensitive to redox

changes have also been identified. For instance, CD44, a transmembrane protein

receptor on leukocytes that binds hyaluronic acid (HA) a component of extracellular

matrix (ECM). This interaction facilitates migration of leukocytes to sites of

inflammation. When its thiols in Cys77 and Cys97 are in the reduced state and stop

forming a disulphide bonds, this interaction with the ECM is lost (Kellett-Clarke,

Stegmann et al. 2015). This redox reduction were identified by Mass Spectrometry

after reduction using the strong reducing agent TCEP but also the recombinant Trx to

simulate inflammatory conditions. It therefore suggest that these disulphide bonds

was sensitive to redox changes and potentially regulated by redox enzymes.

Likewise, the reduction of a disulphide bond (Cys183-Cys232) in CD132 of IL-2

receptor prevents IL-2 binding, a pro-inflammatory cytokine secreted by lymphocytes,

and therefore its signalling pathway to respond to potential infection (Metcalfe,

Cresswell et al. 2012).

Membrane proteins are rich in proteins linked with cell signalling such as receptors,

channels, transporters and enzymes and are at the forefront of dynamic processes

such as cell migration and cell communication (Winterbourn and Hampton 2008).

Therefore, they represent a particular interest to find key proteins in which immune

function is regulated by thiol exchange inflammation. To detect potential redox

sensitive thiols and therefore identify those targets, the set-up of an appropriate

method is a crucial and challenging step due to the reversibility of thiol exchange but

also the difficulty to study membrane proteins. These are particularly difficult to

analyse due to their hydrophobicity which leads them to aggregate.

In this chapter we tried to set up a technique to identify protein containing free thiols

at the surface of RAW cells in an inflammatory condition by stimulating cells with LPS

for 24h. At that time point, an increase in Prxs and Trx is observed and we

hypothesized than both proteins cooperate to oxidise free thiols by thiol disulphide

exchange. The identification of potential target could help to understand immune role

of Trx and Prx2. For this purpose, RAW cells were stimulate 24h with LPS to make

sure Trx and Prx2 were released and in sufficient amount. Free thiols were then

labelled with a biotin device and membrane proteins were extracted using sonication

and ultracentrifugation. Finally, tagged thiols protein were collected by affinity

purification and analysed by MS-based proteomics techniques to identify potential

targets of redox change during the inflammatory response.

184

Aim: Prx2 and Trx are released in a potential redox dynamic as shown in the

previous chapter (Chapter 4). Furthermore both protein shave cytokine and

chemokine like functions. To understand better how these proteins function in

the extracellular environment, we wanted to identify potential protein targets of

oxidoreduction on the cell surface. Thus, we developed techniques for

measuring and identifying surface protein free thiols that were subject to redox

regulation under LPS stimulation.

185

Figure 5.1: Hypothesis for a mechanism of redox signalling mediated by Prx2

and Trx released during inflammation (Salzano, Checconi et al. 2014).

186

5.2 Protocol for extracting membrane proteins from cultured cells

Before labelling surface thiols, the protocol for extracting membrane proteins

described previously by Laragione et al. was tested and adapted to ensure it was

applicable to our cell system (Laragione, Bonetto et al. 2003). Briefly, cells were

sonicated in homogenization buffer containing Hepes and sucrose and were then

submitted to ultracentrifugation (Chapter 2 – 2.12). As shown in Figure 5.2, without

further washing of the pelleted material (experiment 1), GAPDH, a marker of cytosolic

proteins, was present in similar amount (ratio 50:50) as ATPase, a plasma membrane

marker, indicating contamination with cytosolic proteins.

However the addition of an extra wash with PBS followed by ultracentrifugation

(experiment 2) allowed us to decrease significantly the level of the cytosolic marker

GAPDH detected by Western blotting. With this supplementary wash, the ratio of

GAPDH/ATPase was then close to 1: 100.

187

Figure 5.2: Optimisation of the experimental protocol for extraction membrane

proteins from RAW cells. Final preparations of membrane proteins from untreated

samples (NT) were analysed by Western blot using anti-ATPase antibody as a protein

representative of membranes and anti-GAPDH antibody as a cytosolic marker.

Membrane pellet was either no washed (experiment 1) or undergone an additional

washing step (experiment 2). Densitometry of each band was assessed by Image

Studio Lite.

188

5.3 Labelling of cell surface thiols with BIAM

Surface thiols in RAW cells were labelled using N-(Biotinoyl)-N'-(Iodoacetyl)

Ethylenediamine (BIAM), a biotinoylated iodoacetamide, which irreversibly alkylates

free thiols (Figure 5.3). BIAM is not cell-permeable and therefore can only label

exofacial thiols in proteins located at the surface of the cell. In addition, due to the

covalent linked with BIAM, free thiols from membrane proteins carry a biotin tag.

Therefore, after extraction of membrane protein, this biotin tag could be detected by

Western blot using streptavidin-HRP following SDS-PAGE to separate the membrane

proteins. This biotin tag was also used for affinity purification on streptavidin beads.

189

Figure 5.3: Labelling of free thiols with BIAM at the surface of RAW Cells. RAW

cells are treated with or without LPS before to be labelled with BIAM. Once tagged,

free thiols are extracted from RAW cells and were detected by Western blot using

Streptavidin-HRP.

190

5.4 Optimization of BIAM concentration

The optimal BIAM concentration used to tag surface thiols on RAW cells was

investigated by applying concentrations of BIAM between 0 and 200mM directly to

cells. This optimisation was performed to avoid potential unreacted biotin

contamination and therefore too much background in Western blot. For this purpose,

1x10⁶ of RAW cells were plated in 2.5ml of RPMI, incubated overnight and treated

with 100ng/ml of LPS as described in Chapter 2 – 2.16. Once collected, cells were

incubated 15min at 37˚C with BIAM, cells were then washed with PBS and

membranes proteins extracted by using Homogenisation buffer containing Hepes and

sucrose and sonication. Free thiols contained in isolated membranes proteins from

untreated and LPS stimulated cells were then analysed by Western blot using

streptavidin-HRP. As shown Figure 5.4, a concentration between 10μM and 50μM

seems enough to block all free thiols without excess of biotin leading to a strong

signal. Therefore, in further experiments, a concentration of 20μM of BIAM was used

to label cell surface thiols.

191

Figure 5.4: Determination of BIAM concentration to use to label surface free

thiols. RAW cells were incubated 15 min with different concentration of BIAM. After

isolation and separation by SDS-PAGE, membrane proteins were analysed by

Western blot using HRP-streptavidin. A marker of cytosolic protein (GAPDH) and of

membrane proteins (ATPase) were also analysed by Western blot and their

respective expecting molecular weight are indicated by red arrows.

192

5.5 Effect of LPS on the level of surface thiols detected

Once the protocol for extracting membrane proteins from RAW cells was optimised

and that BIAM working concentration was determined, RAW cells were stimulated for

2h or 24h with 100ng/ml of LPS. After LPS stimulation, cells were labelled with BIAM

and membrane proteins were isolated. It can be seen in Figure 5.5 that membrane

proteins from cells that had been stimulated 2h with LPS had a similar, if not lower,

number of free thiols detected than the one from untreated samples.

At the contrary, following a 24h-LPS stimulation, free thiols detected from the

membrane proteins were more numerous than the one detected from the non-treated

(NT) cells.

Supernatants obtained from the different steps of the membrane protocol extraction

were also analysis. Spin 1 corresponds to the sample containing membrane proteins

just before the first ultracentrifugation. It can be seen that it contained more cytosolic

proteins than membrane proteins as shown by the GAPHD/ATPase bands ratio. Spin

2 which is the first supernatant following ultracentrifugation contained mainly cytosolic

proteins as the membrane proteins are contained in the pellet. Finally, in Wash 1 and

Wash 2 which corresponds to the supernatant of ultracentrifugation with PBS, no free

thiols were detected neither ATPase nor GAPDH marker. All these samples indicate

that membrane proteins were successfully collected.

We then decided to identify the BIAM-labelled proteins from the NT cells and cells

treated for 24h with LPS via Mass Spectrometry (MS). For this purpose we used a

protocol specifically adapted for membrane analysis (Blonder, Chan et al. 2006).

Once membrane proteins were reduced and alkylated with iodoacetamide, protein

concentration in both the NT and LPS samples were assessed using a BCA assay in

Figure 5.6. Respectively, 125μg/ml of membrane protein were collected for the

untreated sample and 149μg/ml for the LPS-stimulated sample. This could explain

why more free thiols were detected in the LPS-treated sample. A similar concentration

of membrane protein from untreated and LPS stimulated samples were then

solubilised in a mixture of methanol and ammonium bicarbonate to solubilise

hydrophobic proteins. This solution was then mixed with streptavidin-agarose beads

to affinity-purify BIAM-tagged proteins. After three washes with PBS, samples were

treated with trypsin in order to collect peptides of protein of interest (Biotin tagged

protein). The peptides obtained were then identified using mass spectrometry (MS).

All samples recovered during each steps during solubilisation and affinity purification

of BIAM-tagged membrane thiols are shown in a Western blot in Figure 5.7. It can be

193

seen in samples 3, 4 and 5, which are the wash supernatant of beads, that no free

thiols were detected suggesting that they were all bind to streptavidin beads.

194

Figure 5.5: Surface thiols in RAW cells after LPS treatment for 2h or 24h.

Membrane proteins were labelled with 20μM BIAM for 15min before extraction and

analysed by Western Blot using streptavidin-HRP. Washes and cytosolic proteins

recovered during the extraction process were also analysed. A cytosolic protein

(GAPDH) and a membrane protein (ATPase) were also analysed. NT, untreated cells.

195

Figure 5.6: Protein concentration in NT and LPS (24h) treated samples. Protein

concentration was analysed with the BCA kit assay. After plate incubation at 37˚C of

the samples with the different reagents for 30min, the absorbance at 562nm was

determined. The concentration was then determined using a standard curve made of

BSA diluted in a range of 0 to 2mg/ml.

196

Figure 5.7: Purification of BIAM-tagged membrane proteins. All samples obtained

during the processes of purification and immunoprecipitation of BIAM-tagged protein

were analysed by Western blot using biotinylated anti-ATPase antibody, a component

of the plasma membrane, followed by streptavidin-HRP. RAW cells were previously

treated with 100ng/ml of LPS (LPS) or untreated (NT).

197

5.6 Analysis of the proteins identified by MS

In the control sample, 1871 proteins were identified while 2427 proteins were

identified in the sample obtained from LPS-treated cells (Appendix 16-17). Proteins

recognised by only one peptide were filtered out leaving 1346 for untreated cells (NT)

and 1757 proteins for LPS-treated cells as shown in Table 5.1 and Table 5.2

respectively. These results correlate with the Western blot using HRP-streptavidin

which shows that membranes from LPS-treated cells contained more free thiols that

NT.

Different types of bioinformatic analyses were then performed. First, both lists were

submitted to DAVID in order to determine in which cellular location the proteins

identified were the most representative among different cellular compartments using

the GOTERM Cell Compartment classification. It can be seen in Figure 5.8 that the

most represented compartment was the membrane which includes any lipid bilayers

within the cells such as exosomes, endoplasmic reticulum and plasma membrane.

However in both control and LPS-treated cells, a similar proportion of proteins

identified were associated with the nucleus, cytoplasm and extracellular exosomes.

Similarly the main functions and molecular pathways within these groups of protein

were analysed using GOTERM Biological Pathways and Kegg pathways

classifications in DAVID (Figure 5.9). The same functional categories were obtained

for both groups. Although “transport” was the category with the largest number of

proteins, “translation” was the second most important functional category confirming

the presence of a large number of nuclear proteins.

198

Description -10logP Coverage (%) #Peptides #Unique Avg. Mass

Myb-binding protein 1A 210.76 27 32 32 152036 MYB binding protein (P160) 1a isoform CRA_b 210.76 27 32 32 152036 Myosin-9 190.03 20 31 26 226370 78 kDa glucose-regulated protein 245.64 46 30 28 72422 Putative uncharacterized protein 245.64 46 30 28 72406 Putative uncharacterized protein 245.64 46 30 28 72423 Calnexin 225.25 41 30 30 67278 Putative uncharacterized protein 225.25 41 30 30 67268 Calnexin isoform CRA_a 225.25 41 30 30 67278 Protein disulfide-isomerase A3 205.55 58 28 27 56678 ATP synthase subunit beta mitochondrial 214.47 56 23 23 56301 Tubulin beta-5 chain 191.48 69 23 4 49671 Dolichyl-diphosphooligosaccharide--protein glycosyltransferase subunit 1 184.75 39 23 23 68528 Rpn1 protein (Fragment) 184.75 39 23 23 68397 Putative uncharacterized protein 184.75 39 23 23 68527 GN=Atp1a1 189.62 23 22 17 112982 Endoplasmin 206.34 32 21 20 92476 Heat shock protein 90kDa beta (Grp94) member 1 206.34 32 21 20 92476 Putative uncharacterized protein 206.34 32 21 20 92476 Heat shock protein 90 beta (Grp94) member 1 206.34 32 21 20 92490 Prelamin-A/C 180.42 35 21 21 74238 Catalase 206.21 46 20 20 59731 Catalase 206.21 46 20 20 59765 ATP synthase subunit alpha mitochondrial 192.33 45 20 20 59753 60S ribosomal protein L4 190.08 48 20 20 47154 Ribosomal protein L4 190.08 48 20 20 47154 Tubulin beta-4B chain 184.02 56 20 1 49831 60S ribosomal protein L7a 186.8 56 19 18 29977 Uncharacterized protein 186.8 56 19 18 29965 MCG11348 186.8 56 19 18 29977

Table 5.1: List of the 30 proteins from which most peptides have been identified

by MS in untreated cells. Proteins were previously selected with a FDR<1 (=-

10logP).

199

Description -10logP Coverage (%) #Peptides #Unique Avg. Mass

Myb-binding protein 1A 254.04 42 53 53 152036 MYB binding protein (P160) 1a isoform CRA_b 254.04 42 53 53 152036

Myosin-9 200.78 23 33 27 226370

Heat shock protein HSP 90-beta 200.11 45 29 19 83281

Calnexin 210.57 42 29 29 67278

Actin cytoplasmic 1 217.4 72 29 0 41737

Actin cytoplasmic 2 216.72 72 29 1 41793

Actin beta 217.4 72 29 0 41737

Putative uncharacterized protein 210.57 42 29 29 67268

Putative uncharacterized protein 217.4 72 29 0 41709

Putative uncharacterized protein 217.4 72 29 0 41811

Putative uncharacterized protein 217.4 72 29 0 41751

Putative uncharacterized protein 207.72 69 29 0 41769

Actin gamma cytoplasmic 1 216.72 72 29 1 41793

Calnexin isoform CRA_a 210.57 42 29 29 67278

Heat shock protein 84b 200.11 45 29 19 83281

78 kDa glucose-regulated protein 214.44 44 28 27 72422 Heterogeneous nuclear ribonucleoprotein M 215.35 43 28 28 77649

Putative uncharacterized protein 215.35 45 28 28 73741

Putative uncharacterized protein 214.44 44 28 27 72406

MKIAA4193 protein (Fragment) 215.35 44 28 28 75182

Putative uncharacterized protein 214.44 44 28 27 72423

Vimentin 193.79 59 27 27 53688 Heterogeneous nuclear ribonucleoprotein U 201.91 38 27 27 87918

Putative uncharacterized protein 201.91 38 27 27 87946

Putative uncharacterized protein 201.91 38 27 27 88017

Putative uncharacterized protein 201.91 38 27 27 87846

Vimentin 193.79 59 27 27 53688

Prelamin-A/C 207.4 51 26 26 74238

Tubulin beta-5 chain 210.42 71 26 5 49671

Table 5.2: List of the 30 proteins from which most peptides have been identified

by MS in LPS-treated cells. Proteins were previously selected with a FDR<1 (=-

10logP).

200

Figure 5.8: Ten most overrepresented cell compartments in free thiol-

containing membrane proteins from RAW cells. The lists of proteins from

untreated or LPS-treated cells obtained by MS were analysed using the GOTERM

cell compartment classification in DAVID. In NT samples, 549 proteins out of 1346

and 699 out of 1757 in the LPS one had a functional classification in DAVID and

therefore were recognised. The ten categories containing the most number of proteins

are shown.

201

Figure 5.9: Ten most overrepresented functional categories in free thiol-

containing membrane proteins from RAW cells. The lists of proteins from

untreated or LPS-treated cell obtained by MS were analysed using the GOTERM

Biological Process (grey bars) and Kegg pathways (black bars) classification in

DAVID. In NT samples, 549 proteins out of 1346 and 699 out of 1757 in the LPS one

had a functional classification in DAVID and therefore were recognised. The ten

categories containing the most number of proteins are shown.

202

5.7 Proteins of interest

We then decided to identify proteins of specific interest linked with redox signalling

pathway or inflammation. For this purpose, those proteins that were identified in both

LPS and untreated cells were displayed using a Venn diagram as shown Figure 5.10.

The proteins in the three groups (those identified only in the membranes from LPS-

treated cells, only in untreated (NT) cells or identified in both samples) were then

analysed manually using selective key words such as “redox”, “cytokine”, or “receptor”

for instance.

In proteins detected only in NT cells (= 416 proteins), we could identify thioredoxin-

related transmembrane protein 2 (2 proteins recognised out 416 identified = 2/416),

insulin-like growth factor 2 receptor (2/416 proteins), PDI (9/416 proteins), NADH

dehydrogenase (16/416 proteins), integrin alpha (12/416 proteins), integrin beta

(2/416 proteins), CD14 antigen fragment (6/416 proteins), CD166 antigen (3/416

proteins).

Among the 826 proteins bearing an exofacial thiol identified exclusively in membranes

from LPS-treated cells, we could recognise proteins linked with the 2'-5'-

oligoadenylate synthase family (Oas1 and Oas3) (5/826); signal transducer and

activator of transcription (STAT) (6/826 proteins) and prostaglandin G/H synthase

precursor (Ptgs2) (1/826 proteins). Interestingly these genes were previously

identified in the microarray experiment (Chapter 3) as up-regulated by LPS and

further down-regulated by BSO, an inhibitor of GSH, therefore suggesting that GSH

was important to mediate their transcription during the inflammatory response.

Other proteins linked with stress and inflammation response were also identified such

as Interferon-induced transmembrane protein (1/826) and eight heat shock proteins

(Hsp) (8/826 proteins), among them Hsp70, Hsp105, and Hsp75. Surprisingly,

although more than 10 integrins were found in the NT group, these proteins were not

detected in the LPS group.

Among the proteins identified in both LPS-treated and control cells were Trx-related

transmembrane protein 1 (1/930 proteins), peroxiredoxin-1 (1/930 proteins), profilin

(4/930 proteins), heme oxygenase (4/930 proteins), CD44 antigen (9/930 proteins),

cytochrome C oxidase (16/930 proteins), PDI (3/930 proteins).

203

Figure 5.10: Venn diagram of membrane proteins shared by LPS-stimulated and

untreated (NT) RAW cells identified by MS.

204

5.8 Investigation of the expression of membrane Trx

Although Trx was not present in the lists of protein identified by MS, some papers

have pointed out its existence at the surface of human cell lines (Sahaf, Soderberg et

al. 1997, Wollman, Kahan et al. 1997). The absence of Trx in the protein identified by

MS could be explained by the fact that membrane Trx is in the oxidized state. In fact,

if a protein was present in the absence of free thiols, the protein would not be labelled

with BIAM and would not attach to the streptavidin beads and consequently the

protein would not be identified by MS.

Therefore, we attempted to detect the protein in the membrane of RAW cells from the

same samples we used for MS identification. As shown in Figure 5.11A, three bands

were detected with the antibody anti-Trx; one at the expected molecular weight (MW)

of 12kDa but also one at a higher MW band (around15kDa) and one at 24kD (all forms

were indicated by black arrows). It has to be noted that no difference was detected

between untreated and LPS-treated samples.

The presence of Trx was confirmed in two other experiments (experiment 2 and

experiment 3) as shown in Figure 5.11. While the form at 24kDa was observed, the

12kDa and 15kDa bands were barely detected (Figure 5.11B and C). Usual controls

of the membrane purification were also made using GAPDH and ATPase marker. This

controls confirmed the low amount of cytosolic protein as illustrated Figure 5.11D, it

also suggests that 12kDa and 15kDa forms of Trx could be due to contamination from

the cytosolic compartment. The 15kDa form could be a Trx in association with a small

chaperone molecule of 3kDa and could belong to the nucleus or other organelles as

cells were lysed differently than in our previous work (Chapter 4).

The form identified at 24kDa could correspond to the molecular weight of the Trx

dimer. To confirm that, β-mercaptoethanol (β-ME) was mixed with the sample in order

to reduce intramolecular disulphide bonds. However, the protein was not reduced

completely as seen Figure 5.12A. DTT, another reducing agent was also tested but

the same result obtained with β-ME was observed (Figure 5.12B). In fact, this dimer

resistance to reductant was recently demonstrated in shrimp Trx as a result of the

disulphide bond Cys73-Cys73 (Campos-Acevedo, Sotelo-Mundo et al. 2017). This

disulphide bonds resist to elevated concentration of DTT higher than 50mM. We

therefore hypothesise that Trx was present at the membrane of RAW cells as a stable

dimer.

205

Figure 5.11: Detection of Trx in membrane RAW cells. A; B; C. Three individual

experiments: Cells were treated or not with 100ng/ml of LPS for 24h, then membranes

were extracted and submitted to electrophoresis. Trx was analysed by Western blot

using a polyclonal antibody anti-mouse Trx antibody. D; Western blot of a marker of

cytosolic protein (GAPDH) and of membrane proteins (ATPase) used as controls for

the membrane extraction in Experiment 2.

206

Figure 5.12: Reduction of the 24kDa form of Trx with β-ME (A) and DTT (B).

Membrane samples were separated by electrophoresis after being mixed with

different concentrations of β-ME or DTT. Trx was then analysed by Western blot using

a polyclonal antibody specific for mouse Trx

207

5.9 Discussion

In the present Chapter, we have successfully set up a protocol for the identification of

proteins with free thiols present at the surface of RAW cells stimulated or not with LPS

for 24h. Despite the limitation that a number of proteins belonging to the nucleus and

cytosolic compartments were identified, suggesting some degree of contamination of

our membrane preparations, a number of observations were made and are discussed

below.

The overall amount of free protein thiols at the surface of 24h LPS-treated cells is

higher than the level of free thiols present in untreated cells. This result is similar to

what was observed in other monocytes cells lines using 100ng/ml of LPS for 24h

(Szabo-Taylor, Toth et al. 2017). This increase in free thiols is also observed in

association with activation of the immune response (Metcalfe, Cresswell et al. 2011).

On the contrary, the levels of surface thiols detected from cells stimulated only 2h with

LPS were similar to the levels observed in untreated cells if not slightly lower. This

may relate to the fact that we detected an increase generation of superoxide anion

(O2.-) at this early time point, as described in Chapter 3 - 3.3. Superoxide, a ROS, is

a highly reactive molecule able to oxidise rapidly proteins and especially free thiols,

and one could have expected an even stronger decrease in the level of free thiols.

Additionally, a number of receptors and signalling proteins were identified by MS

among the membrane proteins bearing a free surface thiol. Integrins were present in

untreated cells but not LPS-treated cells. In fact, integrin α-4, was previously identified

as a redox target in human peripheral blood mononuclear cells and could be oxidised

by oxidoreductases released during LPS stimulation (Laragione, Bonetto et al. 2003).

PDIs were also identified in untreated cells but were less present in LPS-treated cells.

It could be that they actively catalyse thiol disulphide exchange with other molecules

at the surface of the macrophages during LPS stimulation as it was demonstrated in

neutrophils (Hahm, Li et al. 2013). On the other hand, heat shock proteins were only

found in LPS-treated cells and thus correlate with an inflammatory and stress

response.

The fact that some proteins identified in the LPS-treated cells (Oas family; STAT and

Ptgs2) were identified previously as being transcriptionally induced by GSH during

LPS stimulation (as shown in Chapter 3-3.5) strengthens the hypothesis that several

redox changes occur in RAW cells following LPS stimulation, although our results also

suggest some cytosolic contamination.

208

Finally, Trx was detected by Western blot in membrane samples but was not identified

by MS. Although this suggests that membrane Trx is normally in the oxidized state, it

is also possible that its peptides were not identified by MS for technical reasons. In

fact not all peptides ionize to the same extent and some may be difficult to detect by

MS. A better way to confirm one or the other hypothesis would be to use the MalPEG

method; unfortunately Trx detection was not possible potentially due to

conformational changes in the epitopes recognised by the antibody anti-Trx after

attachment of MalPEG molecule(s).

In addition, in our experimental model, Trx was identified as a dimer. This

conformational structure has been suggested in many structural studies but, to our

knowledge, was never detected in the membrane from mammalian cells.

Interestingly, structural studies have suggested that the Trx homodimer plays an

important physiological role due to its high stability, its conserved amino acids

sequence and the fact that it is not a substrate for Trx reductase (Weichsel, Gasdaska

et al. 1996). Possible biological roles of the dimer are still unknown but sensing the

cell redox state has been postulated (Weichsel, Gasdaska et al. 1996). Furthermore,

the oxidized dimer leads to the loss of cytokine-like activity by dimerization of C73

(Gasdaska, Kirkpatrick et al. 1996).

To conclude, the methodology probably needs further refinement including, for

instance, additional solubilisation steps and washes. Nevertheless, we obtained a set

of data pointing at potentially interesting findings. Since the reason why we set up this

technique was to identify potential surface target of extracellular Trx and Prx2, the

next step will consist in inhibiting Trx, to see which protein thiol/disulphides at the cell

surface are among its possible targets.

209

Chapter 6

Redox state of Peroxiredoxin 2 and Thioredoxin

as biomarkers of oxidative stress

210

6.1 Introduction

Coronary artery diseases (CAD) are part of the cardiovascular diseases (CVDs) which

are the main cause of death in the world (World Health Organization n.d.). In 2015,

31% of the deaths worldwide were attributable to CVDs and nearly half of them were

caused by CAD (World Health Organization n.d.). Thus, a decrease of this disease’s

incidence is one of the priorities of the WHO.

Physiologically, CAD occurs when an artery is narrowed, preventing the blood flow to

transport nutrients and oxygen to the heart (also referred as ischemia), and therefore

leading to myocardial infarction, where part of the heart muscle dies. According to the

WHO, risk factors include unhealthy food, alcohol abuse, and tobacco, lack of physical

exercise, diabetes, stress, and ageing. All these factors are linked with oxidation and

inflammation, themselves associated with coronary heart diseases (Hansson 2005,

Libby and Theroux 2005). In fact, CAD is mainly a consequence of years of

atherogenesis, a disorder of the artery walls, which starts as an inflammatory process

through the oxidation of fatty acids activating macrophages and immune response

(Ross and Agius 1992, Libby and Theroux 2005, Hansson and Hermansson 2011).

Essentially, proinflammatory cytokines and chemokines are released in the vessels,

by different processes, attracting monocytes and lymphocytes to the vessels and

leading to their adhesion to endothelium and smooth muscle cells into the intima layer

(just below the endothelium forming the walls of the blood vessels). This forms an

extracellular matrix which binds lipids and lead to the deposit of lipid-laden

macrophages (“foam cells”), differentiated monocytes which ingest lipids. This deposit

undergoes fibrosis and calcification forming an atheroma (Latin for “tumour full of

gruel-like matter”) that stop the blood from correctly supplying the heart (Libby 2002).

This inflammatory process which has become excessive and chronic is defined as

atherosclerosis (Ross and Agius 1992).

Unfortunately, the atheroma cannot be completely removed due to its anchorage in

tissues but can only be controlled by taking drugs such as aspirin in addition of

significantly improving life style with healthy diet and physical activity. However, in

some cases, surgical intervention is the only solution to restore proper blood flow.

This is referred as angioplasty, a common procedure, to flatten the atheroma; a

balloon is inflated directly into the blocked area, pushing the atheroma to the vessels

and placing a stent to prevent it from blocking, again, the blood flow in the vessel.

Ironically, angioplasty can also result in cellular damage due to the reperfusion

ischemia, that is a short period of ischemia followed by reintroduction of molecular

211

oxygen (O2) increasing the formation of ROS and further damage in the vessels

(Kalogeris, Baines et al. 2012 1159).This series of events can initiate inflammatory

responses and aggravate the local injury (Preeshagul, Gharbaran et al. 2013). To

evaluate the potential complication post-injury performed by the insertion of the stent

and to assess patient survival and adapt treatment (Preeshagul, Gharbaran et al.

2013), research has focused on the investigation of damage and inflammation

biomarkers easily accessible in the bloodstream. Ideally a large set of biomarkers is

evaluated for each patient by combining all the data collected leading to different and

specific therapy (Kleber, Goliasch et al. 2014). This required a large pallet of

biomarkers to identify the different facets of the disease; oxidation, inflammation, and

injury.

Currently, the most common biomarkers of CAD are Troponin T, a contractile

component of the heart muscle which is released into the circulation after heart failure,

and C-reactive protein (CRP), an acute protein synthesised in response to

inflammatory cytokines, such as IL-6 and TNF (Saunders, Nambi et al. 2011,

Ikonomidis, Michalakeas et al. 2012, Shrivastava, Singh et al. 2015). More recently,

circulating microRNAs have also been investigated as novel more reliable

biomarkers, easily measured in plasma (Wang, Zhu et al. 2010).

Assessing oxidative damage, an important factor in the progression and complication

of the disease, is however still problematic (Strobel, Fassett et al. 2011). Two main

oxidative biomarkers are currently used: an oxidised lipid, oxidised low-density

lipoprotein (LDL), and myeloperoxidase, a heme peroxidase (Huang, Mai et al. 2008,

Karakas and Koenig 2012). Limitation have been raised in regards to the handling

and standardisation of the samples to keep the same level of oxidative stress

reference (Pastori, Carnevale et al. 2014). Another issue is that the impact of

antioxidant level present in the environment which is not understood, can lead to

different interpretation of these markers (Pastori, Carnevale et al. 2014).

Thiol oxidation of blood proteins could be a response to this difficulty by assessing

potential oxidative damage to the vessels through the redox state of a chosen thiol

protein. In fact, blood, in addition to be easily accessible, is a rich environment in

terms of redox reactions and therefore in potential thiol oxidised molecules. As

explained by Butera et al, at least one fifth of all proteins present in blood contain

disulphide bonds which can be involved in processes such as coagulation, thrombosis

and inflammation (Butera, Cook et al. 2014). Human plasma is rich with free cysteine

or cysteine disulphide which are considered as biomarkers of oxidation due to their

sensitivity to smoke, alcohol abuse and high-fat diet all of which are risk factors for

212

CVD (Go and Jones 2011). Red blood cells are also very sensitive to redox

equilibrium and considered as entities with complex antioxidant systems and carrier

of oxidative biomarkers (Pandey and Rizvi 2011).

Interestingly, studies performed on Trx, Prx1 and Prx2 support the importance of

using thiol oxidation biomarkers in assessing oxidative damage in cardiovascular

disease (Choi, Lee et al. 2005, Martinez-Pinna, Lindholt et al. 2010, Martinez-Pinna,

Ramos-Mozo et al. 2011, Madrigal-Matute, Fernandez-Garcia et al. 2015).

A correlation between increase level of Prx1 and Trx and the evolution of the disease

in abdominal aortic aneurysm (AAA), a type of atherosclerotic disease, suggested that

both of them could be biomarkers of its severity (Martinez-Pinna, Lindholt et al. 2010,

Martinez-Pinna, Ramos-Mozo et al. 2011). Furthermore, recently, the same research

group has shown a dependency of their extracellular release, in plasma patient, with

NOX activation suggesting antioxidant response to atherosclerosis (Madrigal-Matute,

Fernandez-Garcia et al. 2015).

Additionally, overoxidation of Prx2 with sulfenic or sulfonic acid could be used as a

biomarker of the thickness of the intima layer in atherosclerosis and its evolution

(Kang, Lee et al. 2013). This overoxidation of Prx2 was observed in rats intima layer

after injury provoked by balloon insertion in the artery, a model of endothelium

damage, but also in human atherosclerotic lesions. Previous studies lead to

hypothesise that overoxidised Prx2 play a role in the healing process of the injury by

mediating the vascular signalling process (Choi, Lee et al. 2005).

Oxidation is present from the beginning of atherosclerosis in CAD patients until

medical intervention via the reintroduction of molecular oxygen in the blood stream.

This inflammatory disease is therefore an ideal condition to study the potential

occurrence in vivo of the redox changes in Trx and Prx2 previously detected in RAW

cells. To study this, in the experiments described in this chapter, we set up a technique

to measure the redox state of Prx and Trx in the blood of patients with CAD

undergoing percutaneous coronary intervention. During this procedure, the stenotic

portion of the artery is dilated with an intracoronary balloon after which a stent is

deployed to provide structural support to the artery.

Aim: Trx and Prx2 go through redox changes specific to LPS stimulation which

can be detected both intracellularly and in the secreted proteins. We wanted to

investigate whether these changes could be used as biomarkers of oxidation in

patient’s blood. Thus, in this chapter, the redox state of Trx and Prx2 will be

213

studied in human blood from healthy donors before to be determined in blood

from patients undergoing angioplasty.

214

6.2 Assessment of the MalPEG technique in Rat blood

Before applying this methodology to studies with human blood, the MalPEG-

technique was tested in rat plasma. In fact, the viscosity of MalPEG, mentioned

previously, added to the viscosity of blood could be problematic by preventing a

correct migration of the proteins in the polyacrylamide gel electrophoresis. As shown

Figure 6.1, both Trx and Prx2 were detectable in normal rat plasma. Two redox states

were observed with Trx: one fully oxidised at 12kDa (= 0 MP) and one more reduced

at 32kDa having two-SH groups (= 2 MP). For Prx2, two forms were also detected in

the MalPEG-treated proteins: an oxidised dimer without any MalPEG attached (= 0

MP), and a more reduced dimer, with two –SH groups, at 64kDa (= 2 MP).

215

Figure 6.1: Measure of the redox state of Trx (A.) and Prx2 (B.) in plasma from

two rats. Plasma from two independent rats (#1 and #2) were treated with 0.5mM of

MalPEG or with 50mM of NEM as described in the methods section. Trx and Prx2

were then analysed by Western blot in non-reducing or reducing conditions. The

arrows indicate the position of reduced or oxidised forms determined by the number

of MP fixed to the protein.

216

6.3 Measurement of the redox state of Prx2 in human plasma

Having shown that this technique is applicable to the detection of the redox state of

proteins in rat plasma, we assessed the redox state of Prx2 in human plasma from

four healthy human donors.

As shown Figure 6.2, Prx2 treated with NEM (which does not modify the molecular

weight) was mainly found as an oligomer (around 250 kDa) but also as two dimeric

forms, both around 44kDa in the plasma. These two dimers were already described

in human serum (Mullen, Hanschmann et al. 2015, Peskin, Pace et al. 2016). The

micro heterogeneity of the dimer, showing as a doublet, is probably due to small

changes in mobility associated with posttranslational modifications such as

glutathionylation. It has been suggested that they correspond to the glutathionylated

form (upper one) and non-glutathionylated dimer (lower one). The MP technique

allowed to discriminate between oxidized dimers, migrating to a putative MW of 44kDa

(=0MP), therefore no free –SH) and reduced dimers at 64kDa (which implies 2 MP

bound and therefore 2 free –SH).

The four healthy donors have a similar redox profile independent of the total amount

of Prx2 present.

217

Figure 6.2: Redox state of Prx2 in plasma from 4 healthy donors (#1 to #4).

Plasma samples were treated with 0.5mM of MalPEG (MP) or 50mM of NEM. Prx2

was then analysed by Western blot following non-reducing conditions. The arrows

indicate the position of reduced or oxidised forms determined by the number of MP

bound to the protein.

218

6.4 Measurement of the redox state of Trx in human red blood cells

In contrast with Prx2, we could not define the redox state of Trx in human plasma.

Indeed, anti-Trx detected aggregates and several bands at different molecular

weights, making the study of its redox state impossible as shown Figure 6.3A. To

overcome this difficulty, we studied Trx in red blood cells (RBCs) lysate. The

advantage of using biomarkers from RBCs is that they do not have a machinery to

synthetize new proteins due the lack of nucleus but RBCs are also the first cell

exposed to redox changes (Pandey and Rizvi 2011). Therefore oxidised protein are

less diluted than in the plasma and are constantly undergoing redox changes. In

addition, RBCs are full of antioxidant proteins such as Prx2, the third most abundant

protein in RBCs (Low, Hampton et al. 2008). The redox state of Trx was measurable

as three bands were observed: one at 12kDa for the completely oxidised form (= 0

MP), one at 32kDa (= 2 MP) and one around 62kDa (= 5 MP) (Figure 6.3B). The

three donors studied had a similar redox profile for Trx.

219

Figure 6.3: Redox state of Trx in plasma (A) or in RBCs lysate (B) (1:10 dilution)

from 3 healthy donors. Plasma or red blood cells samples were treated 0.5mM of

MalPEG (MP), 50mM of NEM, or left untreated (Ctrl). Trx was then analysed by

Western blot following reducing condition. The arrows indicate the position of reduced

or oxidised forms determined by the number of MP fixed to the protein.

220

6.5 Assessment of potential redox changes in Trx and Prx2 after stent

insertion in blood samples from CAD patients

Blood was taken from patients suffering from coronary artery disease before and after

angioplasty. During the medical procedure, a biodegradable stent was inserted into

the artery via a catheter and directed by radio-imaging to the injury allowing the blood

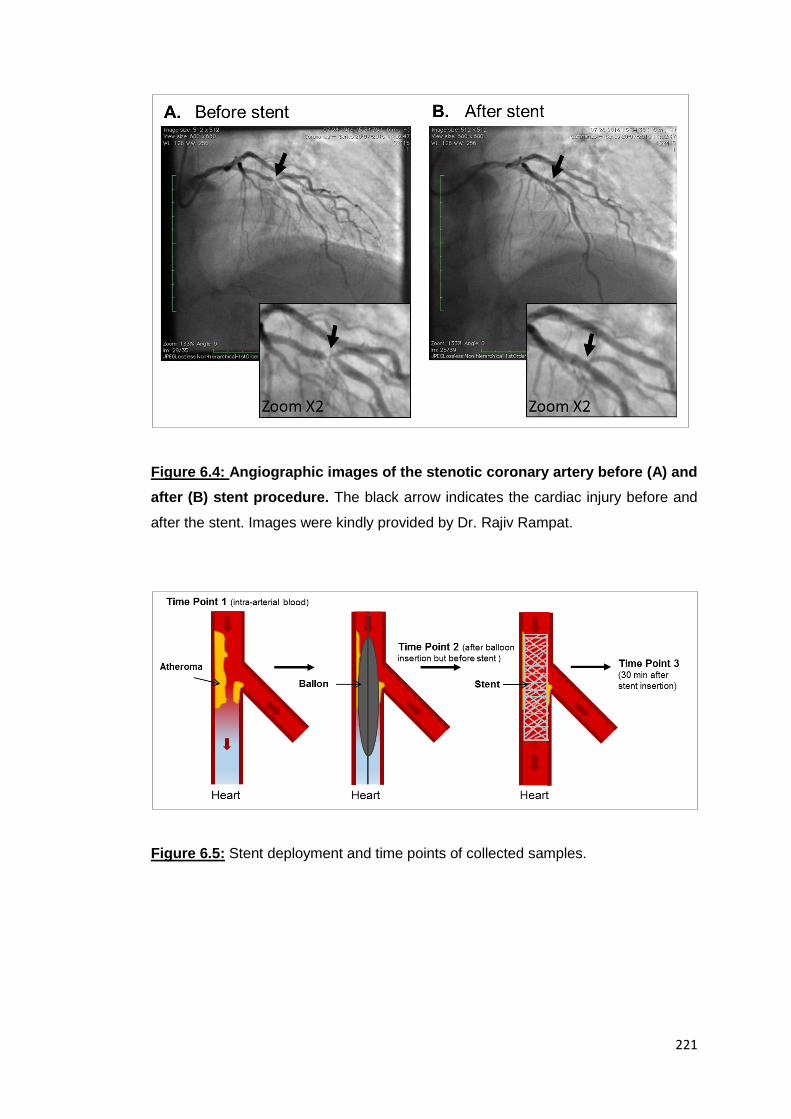
to flow freely as visualized in Figure 6.4A before the stent and Figure 6.4B after the

stent. Blood samples were collected at 3 time points (Figure 6.5). Firstly, before the

intervention, an intra-arterial blood sample was taken via peripheral arterial sheath (=

time point 1). Secondly, a sample was collected from the affected coronary artery after

insertion of the ballon but before stent insertion (=time point 2) or, thirdly, 30min after

the insertion of the stent (= time point 3).

As shown in Figure 6.6, the investigation of the redox state of Prx2 in plasma gave

inconsistent results. Indeed, either the Prx2 from samples treated with MalPEG was

not detected or the control Prx2 was not detected.

Therefore, we decided to measure both Prx2 and Trx in RBCs (Figure 6.7 and Figure

6.8). Results were consistent between the two patients where Prx2 was studied and

between the three tested for Trx. As shown in Figure 6.7, two bands were observed

in the MP-treated samples, one at 44kDa which corresponds to the dimer and one

staining stronger at 64kDa (2 MP). In Figure 6.8, MalPEG-Trx migrated as three

bands: one band at 12kDa (=0MP/0SH) which could be either the completely oxidised

form, another band at 32kDa (= 2 MP/2-SH) and a band at 62kDa (= 5 MP/5-SH).

There was no difference detected before and after stent insertion in any of the three

patients tested.

In that we could distinguish the different redox states but they did not change before

and after the stent (time point 1 versus time point 2 or 3). Two hypothesis could explain

the absence of redox changes; neither Trx nor Prx2 underwent redox modifications

under these conditions or because any specifically-oxidized protein would be

immediately washed away and diluted in the total body’s blood volume. However,

due to the difficulty to access blood samples, the study was stopped at that stage.

221

Figure 6.4: Angiographic images of the stenotic coronary artery before (A) and

after (B) stent procedure. The black arrow indicates the cardiac injury before and

after the stent. Images were kindly provided by Dr. Rajiv Rampat.

Figure 6.5: Stent deployment and time points of collected samples.

222

Figure 6.6: Redox state of Prx2 in plasma at different time point before or after

stent insertion. Plasma samples were treated with 0.5mM MalPEG. Prx2 was then

analysed by Western blot in non-reducing condition. The arrows indicate the missing

bands.

Figure 6.7: Redox state of Prx2 in RBCs at different time point before or after

stent insertion. RBCs samples were treated with 0.5mM MalPEG. Prx2 was then

analysed by Western blot in non-reducing condition. The arrows indicate the position

of reduced or oxidised forms determined by the number of MP fixed to the protein.

223

Figure 6.8: Redox state of Trx in RBCs at different time point before or after

stent insertion. RBCs samples were treated with 0.5mM MalPEG. Trx was then

analysed by Western blot in non-reducing condition. The arrows indicate the position

of reduced or oxidised forms determined by the number of MP fixed to the protein.

224

6.6 Oxidation of Trx and Prx2 with diamide

In order to see whether our technique could detect redox changes in Trx/Prx in patient

RBCs lysates, RBCs samples were treated with 10mM diamide, a thiol-oxidising

agent, for 10min (Kosower, Kosower et al. 1969). When treated with diamide, the

most reduced form of Trx disappeared as indicated by the red arrow (Figure 6.9). The

same observation was made for Prx2 (Figure 6.9). Therefore, our methodology can

detect oxidation of Trx and Prx2.

We then studied the applicability of our technique to a clinical setting, where the blood

may not be processed immediately after sampling which is an issue in the

standardisation of oxidative marker reproducibility between studies.

For this purpose, samples were either processed immediately (Control) or left on the

bench at room temperature for one hour. These were compared with samples

oxidised with diamide for 10min. A shown Figure 6.10, Prx2 was not affected by the

length of time of the procedure. Indeed, the two characteristic redox states of Prx2

(i.e. 44kDa and 64kDa) were still present in the same proportion in the sample left in

the bench for an hour and the one processed immediately. On the contrary, the redox

state of Trx was sensitive to the new condition: the most reduced form that is the band

migrating at 62kDa (= 5 MP/5-SH) disappeared similarly to samples exposed to

diamide.

225

Figure 6.9: Effect of diamide on the redox state of Trx and Prx2 in human RBCs.

After 10mM diamide treatment, proteins were treated with 0.5mM MP and analysed

by Western blot. 1 and 2 indicate the time point samples blood were collected. The

red arrows indicate the missing band. The black arrows indicate the different redox

states of Trx and Prx2.

Figure 6.10: Redox state of Trx and Prx2 in human RBCs left 1h at room

temperature. RBCs were tagged with 0.5mM MalPEG after 1h left on the bench or

after being treated 10min with 10mM diamide. Control are samples processed

immediately. Trx and Prx2 were then analysed by Western blot. The arrows indicate

the different redox states of Trx and Prx2.

226

6.7 Discussion

The aim of this chapter was to investigate the redox states of Prx2 and Trx in human

blood and thus measure redox changes in patients undergoing angioplasty due to

stent insertion by percutaneous coronary intervention.

The redox states of Prx2 and Trx were successfully measured in blood using the

MalPEG technique. However, no measurable redox changes were detected in the

blood of patients undergoing stent insertion, despite the fact that the blood was taken

from the injured area. There are two possible explanations for these observations.

First, it is possible that there are no biological redox changes occurring during the

stent insertion. However, it is well known that damage occurs to the artery due to

mechanical rupture of the atheroma by the stent, the presence of a foreign device and

also due to the reintroduction of oxygen in previously deprived blood vessels (Otsuka,

Finn et al. 2012) (Boos, Balakrishnan et al. 2007, Pelliccia, Del Prete et al. 2012).

Similarly, evidence of inflammation and oxidative stress evidences have been

reported during percutaneous coronary intervention (Cordis, Maulik et al. 1998,

Iliodromitis, Kyrzopoulos et al. 2006) (Chao, Li et al. 2004, Berg, Jynge et al. 2005).

In fact, one could hypothesise that the damage perpetuated by the stent insertion will

release DAMPS, and thus activate the TLR4 pathway leading to an inflammatory

response (Lee, Hutchinson et al. 2016). This is also supported by a recent study

demonstrating that hydrocortisone could reduce the inflammatory effects of stent

insertion by reducing TLR4 expression (Bagheri, Sohrabi et al. 2014). Thus, we could

hypothesise that as seen in RAW cells with LPS stimulation of TLR4 pathway, in

Chapter 4, redox changes may occur later than the time points chosen. Indeed, these

changes were measured 24h later from RAW cells, in both intracellular and

extracellular compartments. So it could be that the redox state of the proteins studied

is not affected by those damages yet.

The second possibility is that redox changes were undetectable due to the rapid

speed of blood flow through the systemic circulation. Cardiac output at rest is 5L/min

so one could expect local changes to be quickly diluted by this rapid blood flow.

In the experiments using diamide we could demonstrate that the redox state of Prx2

is quite stable and not too sensitive to experimental conditions, particularly when

compared to Trx. Incubation at room temperature for one hour, did not result in any

detectable change in redox forms identified in the case of Prx2, while a similar

incubation of Trx resulted in the loss of the more reduced form. Thus, Trx seems to

be more sensitive to oxidation and could therefore be a better, more sensitive, marker

227

of oxidative conditions. For instance, measuring the redox state of Trx could also help

in the quality control of human blood stored for transfusion as transfusion of oxidised

erythrocytes is often associated with dangerous side effects such as myocardial

infarction which can cause mortality (Bayer, Hampton et al. 2015). Another recent

study also demonstrated the role of Prx2 in erythrocytes as an indicator of cell damage

during storage (Harper, Oh et al. 2015). In fact, stored erythrocytes show increased

oxidative damage due to the lack of oxygenation and Prx2 is known to limit this

damage as long as its function is not altered. In their study, Harper and colleagues

attempted to measure Prx2 dimeric or monomeric forms in RBCs in blood stored in

transfusion bags at 4˚C in the dark from 7 to 35 days in order to control the quality of

erythrocytes as they hypothesised that the Prx2 dimeric form will indicate oxidation of

the blood (Harper, Oh et al. 2015). They then conclude that because Prx2 was present

as a dimer in the RBCs of stored blood that its activity was compromised (Harper, Oh

et al. 2015). The MalPEG technique described here could provide more insight into

whether Prx2 is present as a reduced or a fully oxidised dimer as we believe that there

are different degrees of oxidation of Prx2 (Chapter 4) and thus could provide further

information to stratify the degree of blood oxidation.

It has also to be noted that a previous study has demonstrated that the native redox

state of Prx2 from healthy donors obtained by mixing samples with NEM prior to lysis

is mainly found as a reduced monomer in RBCs whereas the dimer was present due

to overoxidation in lysis buffer and thus this dimeric form is overoxidised (Low,

Hampton et al. 2007). In our study, RBCs were lysed in ice-cold conditions and mixed

directly with MalPEG and Prx2 was found as a dimer. Under these conditions, it is

expected that the oxidation of Prx2 occur at a slow rate. In fact, we could see that our

dimer contained free thiols detected by MalPEG and thus was not overoxidized. This

also demonstrates the importance of defining what it is overoxidised. In our opinion,

overoxidation will mean that the monomers cannot dimerize via disulphide bond

formation and thus cannot catalyse the removal of peroxide substrates, while the

dimer form indicates that the protein is active and can catalyse this removal.

Remarkably, the redox profile of Trx and Prx2 in the RBCs from both patients and

healthy donors were similar to the redox profile obtained in RAW cells lysate: Prx2

with no free -SH or 2-SH and Trx with 0, 2 free -SH or 5 free-SH. This consistency of

the overall redox state detected for Prx2 and Trx suggest that the redox state of these

proteins is maintained both in cultured cells and in human blood and that the redox

state of these proteins is likely to be important for their biological functions.

228

In conclusion, we set up a method for identifying the redox state of Prx2 and Trx in

the blood. Further work will be needed to investigate if redox changes of Prx2 and Trx

occur in disease and if they could have a prognostic or diagnostic value.

229

Chapter 7

Discussion and conclusions

230

7.1 Summary of the study

The main aim of this work was to identify molecular redox mechanisms participating

in the inflammatory response in macrophages. This was achieved by investigating

and measuring redox changes in different ways during the inflammatory response. It

was examined at the transcriptome level by depleting GSH, the main thiol antioxidant

but also a regulator of the redox state of protein thiols and disulphides (Chapter 3),

and in the intracellular and extracellular proteome by measuring the redox state of

redoxkines Prx1, Prx2 and Trx (Chapter 4) as well as at the cell surface of

macrophages by identifying proteins with free thiols and thus potential targets of those

redoxkines (Chapter 5). Redox changes of Prx2 and Trx were also tested as oxidative

biomarkers in human blood from healthy donors and patients undergoing angioplasty

due to coronary artery disease; however, no changes in the redox states of these

proteins were detected (Chapter 6). The main findings of each chapter as well as

further work required are summarised in Table 7.1.

We demonstrated that GSH, the main intracellular antioxidant and ROS scavenger,

also acts as a signalling molecule required for antiviral response but also controls the

amount of Prx1 transcribed. In fact, the microarray data has shown that Prx1

transcription is induced by LPS and its level is regulated by GSH, while both Prx2 and

Trx genes are not affected by either LPS stimulation or GSH depletion. Both of them

are redox-regulated at latter steps, by post-translational modification after LPS

stimulation. In fact, we could determine three redox profiles specific of each of these

redoxkines (Prx1, Prx2 and Trx) depending on their cell location and exposure to

inflammatory stimulation. Prx2 and Trx are both detected as a mixture of reduced and

oxidised forms prior to LPS stimulation. After exposure of the cells to LPS, only the

reduced form is observed intracellularly while the oxidised form seems to be released.

This could be a homeostatic measure to maintain a reduced intracellular environment.

Furthermore, while the oxidised form of Trx is detected extracellularly, Prx2 is found

in the reduced form, suggesting that the oxidised form could have been reduced by

Trx, its main electron donor outside of the cell. Thus, the redox state of both proteins

appears to be in dynamic equilibrium with their catalytic activity dependent on LPS.

On the contrary, Prx1 is only found as a reduced form with 2 free-SH (one for each

monomer) and as a fully oxidised form when released, which could correlate with its

DAMP activity due to inactivation of its catalytic centre.

We then hypothesised that the reduced form of Prx, in cooperation with Trx, could

catalyse thiol disulphide exchanges outside the cell using extracellular substrates

231

such as proteins with free thiols at the cell surface. We thus set up a method to detect

those potential targets by merging alkylation of free thiols at the cell surface with a

biotin tag plus MS identification following streptavidin bead enrichment. Although

preliminary, this technique has allowed the detection of interesting receptors such as

integrin-α previously identified as redox regulated by inhibitors of GSH and by NAC

at the surface of PBMC (Laragione, Bonetto et al. 2003).

Unexpectedly, we could also identify Trx in a dimeric form. It seemed that this form

was only present in the membrane (plasma or exosome) as it was not identified in our

previous work in cell lysates and supernatants. This is in agreement with other studies

suggesting that a Trx dimer could be associated with a redox sensor function

(Weichsel, Gasdaska et al. 1996). At the same time, redox changes detected after

LPS stimulation in macrophages were analysed in the plasma and red blood cells

from healthy donors as well as patients undergoing angioplasty due to coronary artery

disease in order to detect potential redox changes. However, no changes were

observed but the same overall redox state in human red blood cells was detected as

observed in RAW cell lysates demonstrating the stability of Prx2 and Trx redox state

across different cells and under different conditions.

We could then also hypothesise that those redox changes of redoxkines were

dependent on LPS. In fact, this endotoxin only reacts with TLR4 triggering a specific

signalling pathway. Therefore, further work to identify these signalling pathways is

required.

232

Chapter Aim Results Further work

3

Identify genes regulated by GSH during LPS stimulation in RAW cells

GSH acts as a signalling molecule to fine tune the antiviral response

Test this hypothesis at the proteomic level

4

Identify redox state changes of Prx1, Prx2 and Trx in LPS-stimulated RAW cells

Following LPS stimulation in RAW cells, Prx2 and Trx undergo redox changes prior to secretion and seem to have a catalytic activity extracellularly while Prx1 is not sensitive to redox change and seems to act as a DAMP

Identify the signalling pathway of secretion; identify specific biological functions for each redox form detected

5

Identification of surface thiols targets of thiol oxidoreductases released in LPS-stimulated RAW cells

Identification of interesting receptors such as integrin-α; Trx exists as a dimer

Optimisation of the technique of membrane extraction is required as well as inhibiting Trx prior to LPS stimulation

6

Utilisation of the redox state change of Prx2 and Trx as biomarkers of oxidative stress

Redox state of Prx2 and Trx are measurable in human blood; No redox changes in patients undergoing angioplasty

Determination of “use-by date” for stored human blood + use another model or use other tissues than blood

Table 7.1: Findings and further work required for each aim of this study.

233

7.2 Advances in the redox and inflammatory field

Potential for novel antioxidant therapies

It is interesting to note that in our experimental model, endogenous GSH does not

inhibit the inflammatory response and that this is contrary to what has been concluded

by pioneers in this field who used a different experimental approach by adding

exogenously thiols antioxidants (Schreck, Rieber et al. 1991). However, one gene,

CXCL10, was increased when cells were depleted of GSH and then stimulated with

LPS. This chemokine, formerly known as IFNγ-inducible protein 10 (IP-10) has been

recently studied in chronic inflammatory diseases such as diabetes (Antonelli, Ferrari

et al. 2014), autoimmune diseases (Lee, Lee et al. 2009), multiple sclerosis

(Vazirinejad, Ahmadi et al. 2014), and cancer (Lunardi, Jamieson et al. 2014) and

therefore could be linked with the increase of ROS due to GSH depletion. In fact, the

effects of thiol antioxidants and ROS vary in studies depending on the experimental

model used as discussed previously (Chapter 3). The fact that some molecules such

as CXCL10 have been identified in a number of studies strengthens the evidence for

its role in, and as a potential therapeutic target for, chronic inflammatory diseases.

Overall, the microarray analysis also brought new insights in defining how complex

the thiol system antioxidants is, highlighting GSH as a signalling molecule important

for host defence. Our results are consistent with other studies as mentioned

previously in Table 3.5 investigating the effect of GSH depletion on viral replication.

It could also explained why viral infection is often linked with reduced GSH level

(Swietek and Juszczyk 1997) (Herzenberg, De Rosa et al. 1997) (Papi, Contoli et al.

2008) as this could be a viral strategy to increase replication and survival by down-

regulating the host antiviral response.

Prxs and Trx have specific redox states depending on their localisation and

could be used as biomarkers or therapeutic targets

In this study, we identified different redox states of Prx1, Prx2 and Trx specific to their

localisation as well as the condition of the cells. It is possible that these specific redox

states could be used as biomarkers of protein oxidation. The MalPEG technique

developed in this study seems a promising technique to identify different degrees of

oxidation of a protein which could be useful to measure the oxidation and hence

quality of stored blood intended for transfusion (Bayer, Hampton et al. 2015). In

addition, it seems that the redox changes in the proteins studied here were specific to

234

LPS stimulation and thus the TLR4 signalling pathway. This activation of TLR4 has

been described, in many autoimmune diseases (Liu, Yin et al. 2014) such as

inflammatory bowel disease (Oostenbrug, Drenth et al. 2005) or Alzheimer’s disease

(Walter, Letiembre et al. 2007) which could be used as models to determine whether

Prx2 and Trx redox changes could be used for prognostic or diagnostic purposes.

A number of studies have pointed out the potential cytokine- and chemokine- like roles

of Prx2, Trx and Prx1 during the inflammatory response. To summarize, Prx1 acts as

a DAMP (Riddell, Wang et al. 2010), Trx acts as a chemoattractant (Bertini, Howard

et al. 1999) but also as a growth factor (Gasdaska, Berggren et al. 1995) and finally

recent studies have shown that Prx2 can promote release of TNF from cells (Salzano,

Checconi et al. 2014). In addition, and in particular for Trx, these proteins are often

detected in elevated concentrations in autoimmune diseases and cancer compared

to healthy individuals (Nakamura, De Rosa et al. 1996, Lincoln, Ali Emadi et al. 2003)

(Wahlgren and Pekkari 2005) (Riddell, Bshara et al. 2011, Szabo-Taylor, Eggleton et

al. 2012). Thus research to inhibit these proteins has started but has been

inconclusive thus far as illustrated by a recent clinical trial inhibiting Trx from

gastrointestinal cancers patients (Baker, Adab et al. 2013). This failure may be related

to the strategy adopted consisting of completely inhibiting Trx instead of specific

functions of Trx. In fact targeting specific redox states of these proteins could be more

efficient to suppress the pro-inflammatory roles of these proteins. Our study has been

able to identify these specific forms and future work will focus on identifying what

biological roles these forms have and which post-translational modifications are

present. In fact, the development of new therapeutic approaches such as antibodies

targeting specific thiol modifications is being investigated in the field of chronic

diseases (Ryan, Nissim et al. 2014) and one could think that targeting specific redox

states of Prx2 and Trx could help to reduce the inflammatory response in chronic

inflammatory conditions.

7.3 Conclusion

Redox regulation is involved in many cellular processes such as apoptosis, cell

development and differentiation, homoeostasis and the immune response. However

due to the reactivity of ROS, the main effectors, the importance and involvement of

this regulation in signalling functions is difficult to elucidate fully. In this project we

successfully demonstrated the importance of protein and non-protein thiols as targets

235

of redox changes during the inflammatory response directly linked with the TLR4

signalling pathways in macrophages.

236

Bibliography

Abais, J. M., M. Xia, Y. Zhang, K. M. Boini and P. L. Li (2015). "Redox regulation of NLRP3 inflammasomes: ROS as trigger or effector?" Antioxid Redox Signal 22(13): 1111-1129.

Abbas, K., N. Babic and F. Peyrot (2016). "Use of spin traps to detect superoxide production in living cells by electron paramagnetic resonance (EPR) spectroscopy." Methods 109: 31-43.

Abbas, K., J. Breton, C. R. Picot, V. Quesniaux, C. Bouton and J. C. Drapier (2009). "Signaling events leading to peroxiredoxin 5 up-regulation in immunostimulated macrophages." Free Radic Biol Med 47(6): 794-802.

Abbas, K., M. Hardy, F. Poulhes, H. Karoui, P. Tordo, O. Ouari and F. Peyrot (2014). "Detection of superoxide production in stimulated and unstimulated living cells using new cyclic nitrone spin traps." Free Radic Biol Med 71: 281-290.

Abbasi, A., E. Corpeleijn, D. Postmus, R. T. Gansevoort, P. E. de Jong, R. O. Gans, J. Struck, J. Schulte, H. L. Hillege, P. van der Harst, L. M. Peelen, J. W. Beulens, R. P. Stolk, G. Navis and S. J. Bakker (2012). "Peroxiredoxin 4, a novel circulating biomarker for oxidative stress and the risk of incident cardiovascular disease and all-cause mortality." J Am Heart Assoc 1(5): e002956.

Aesif, S. W., V. Anathy, I. Kuipers, A. S. Guala, J. N. Reiss, Y. S. Ho and Y. M. Janssen-Heininger (2011). "Ablation of glutaredoxin-1 attenuates lipopolysaccharide-induced lung inflammation and alveolar macrophage activation." Am J Respir Cell Mol Biol 44(4): 491-499.

Akdis, M., A. Aab, C. Altunbulakli, K. Azkur, R. A. Costa, R. Crameri, S. Duan, T. Eiwegger, A. Eljaszewicz, R. Ferstl, R. Frei, M. Garbani, A. Globinska, L. Hess, C. Huitema, T. Kubo, Z. Komlosi, P. Konieczna, N. Kovacs, U. C. Kucuksezer, N. Meyer, H. Morita, J. Olzhausen, L. O'Mahony, M. Pezer, M. Prati, A. Rebane, C. Rhyner, A. Rinaldi, M. Sokolowska, B. Stanic, K. Sugita, A. Treis, W. van de Veen, K. Wanke, M. Wawrzyniak, P. Wawrzyniak, O. F. Wirz, J. S. Zakzuk and C. A. Akdis (2016). "Interleukins (from IL-1 to IL-38), interferons, transforming growth factor beta, and TNF-alpha: Receptors, functions, and roles in diseases." J Allergy Clin Immunol 138(4): 984-1010.

Akdis, M., S. Burgler, R. Crameri, T. Eiwegger, H. Fujita, E. Gomez, S. Klunker, N. Meyer, L. O'Mahony, O. Palomares, C. Rhyner, N. Ouaked, A. Schaffartzik, W. Van De Veen, S. Zeller, M. Zimmermann and C. A. Akdis (2011). "Interleukins, from 1 to 37, and interferon-gamma: receptors, functions, and roles in diseases." J Allergy Clin Immunol 127(3): 701-721 e701-770.

Alberts, B. (2002). Molecular biology of the cell. New York, Garland Science.

Alfonso, H., P. Franklin, S. Ching, K. Croft, P. Burcham, N. Olsen, A. Reid, D. Joyce, N. de Klerk and A. B. Musk (2015). "Effect of N-acetylcysteine supplementation on oxidative stress status and alveolar inflammation in people exposed to asbestos: a double-blind, randomized clinical trial." Respirology 20(7): 1102-1107.

Amor, S., F. Puentes, D. Baker and P. van der Valk (2010). "Inflammation in neurodegenerative diseases." Immunology 129(2): 154-169.

237

Andersen, J. F., D. A. Sanders, J. R. Gasdaska, A. Weichsel, G. Powis and W. R. Montfort (1997). "Human thioredoxin homodimers: regulation by pH, role of aspartate 60, and crystal structure of the aspartate 60 --> asparagine mutant." Biochemistry 36(46): 13979-13988.

Antonelli, A., S. M. Ferrari, A. Corrado, E. Ferrannini and P. Fallahi (2014). "CXCR3, CXCL10 and type 1 diabetes." Cytokine Growth Factor Rev 25(1): 57-65.

Arthur, J. S. and S. C. Ley (2013). "Mitogen-activated protein kinases in innate immunity." Nat Rev Immunol 13(9): 679-692.

Babior, B. M., J. T. Curnutte and B. J. McMurrich (1976). "The particulate superoxide-forming system from human neutrophils. Properties of the system and further evidence supporting its participation in the respiratory burst." J Clin Invest 58(4): 989-996.

Babior, B. M., R. S. Kipnes and J. T. Curnutte (1973). "Biological defense mechanisms. The production by leukocytes of superoxide, a potential bactericidal agent." J Clin Invest 52(3): 741-744.

Bacic, G., A. Pavicevic and F. Peyrot (2016). "In vivo evaluation of different alterations of redox status by studying pharmacokinetics of nitroxides using magnetic resonance techniques." Redox Biol 8: 226-242.

Bagheri, B., B. Sohrabi, A. A. Movassaghpour, S. Mashayekhi, A. Garjani, M. Shokri, M. Pezeshkian and A. Garjani (2014). "Hydrocortisone reduces Toll-like receptor 4 expression on peripheral CD14+ monocytes in patients undergoing percutaneous coronary intervention." Iran Biomed J 18(2): 76-81.

Baharom, F., S. Thomas, A. Bieder, M. Hellmer, J. Volz, K. J. Sandgren, G. M. McInerney, G. B. K. Hedestam, I. Mellman and A. Smed-Sorensen (2015). "Protection of Human Myeloid Dendritic Cell Subsets against Influenza A Virus Infection Is Differentially Regulated upon TLR Stimulation." Journal of Immunology 194(9): 4422-4430.

Baker, A. F., K. N. Adab, N. Raghunand, H. H. Chow, S. P. Stratton, S. W. Squire, M. Boice, L. A. Pestano, D. L. Kirkpatrick and T. Dragovich (2013). "A phase IB trial of 24-hour intravenous PX-12, a thioredoxin-1 inhibitor, in patients with advanced gastrointestinal cancers." Invest New Drugs 31(3): 631-641.

Baldridge, C. W. and R. W. Gerard (1933). "The extra respiration of phagocytosis." American Journal of Physiology 103(1): 235-236.

Banerjee, R. (2012). "Redox outside the box: linking extracellular redox remodeling with intracellular redox metabolism." J Biol Chem 287(7): 4397-4402.

Bankar, S. B., M. V. Bule, R. S. Singhal and L. Ananthanarayan (2009). "Glucose oxidase--an overview." Biotechnol Adv 27(4): 489-501.

Barjesteh, N., S. Behboudi, J. T. Brisbin, A. I. Villanueva, E. Nagy and S. Sharif (2014). "TLR Ligands Induce Antiviral Responses in Chicken Macrophages." Plos One 9(8): 11.

Battistuzzi, G., M. Bellei, C. A. Bortolotti and M. Sola (2010). "Redox properties of heme peroxidases." Arch Biochem Biophys 500(1): 21-36.

238

Bayer, S. B., M. B. Hampton and C. C. Winterbourn (2015). "Accumulation of oxidized peroxiredoxin 2 in red blood cells and its prevention." Transfusion 55(8): 1909-1918.

Bedard, K. and K. H. Krause (2007). "The NOX family of ROS-generating NADPH oxidases: physiology and pathophysiology." Physiol Rev 87(1): 245-313.

Beedle, A. E., S. Lynham and S. Garcia-Manyes (2016). "Protein S-sulfenylation is a fleeting molecular switch that regulates non-enzymatic oxidative folding." Nat Commun 7: 12490.

Benham, A. M. (2012). "The protein disulfide isomerase family: key players in health and disease." Antioxid Redox Signal 16(8): 781-789.

Berg, K., P. Jynge, K. Bjerve, S. Skarra, S. Basu and R. Wiseth (2005). "Oxidative stress and inflammatory response during and following coronary interventions for acute myocardial infarction." Free Radic Res 39(6): 629-636.

Bernard, G. R., A. P. Wheeler, M. M. Arons, P. E. Morris, H. L. Paz, J. A. Russell and P. E. Wright (1997). "A trial of antioxidants N-acetylcysteine and procysteine in ARDS. The Antioxidant in ARDS Study Group." Chest 112(1): 164-172.

Berndt, C., C. H. Lillig and A. Holmgren (2008). "Thioredoxins and glutaredoxins as facilitators of protein folding." Biochim Biophys Acta 1783(4): 641-650.

Berridge, M. J., M. D. Bootman and H. L. Roderick (2003). "Calcium signalling: dynamics, homeostasis and remodelling." Nat Rev Mol Cell Biol 4(7): 517-529.

Bertini, R., O. M. Howard, H. F. Dong, J. J. Oppenheim, C. Bizzarri, R. Sergi, G. Caselli, S. Pagliei, B. Romines, J. A. Wilshire, M. Mengozzi, H. Nakamura, J. Yodoi, K. Pekkari, R. Gurunath, A. Holmgren, L. A. Herzenberg and P. Ghezzi (1999). "Thioredoxin, a redox enzyme released in infection and inflammation, is a unique chemoattractant for neutrophils, monocytes, and T cells." J Exp Med 189(11): 1783-1789.

Beziere, N., Y. Frapart, A. Rockenbauer, J. L. Boucher, D. Mansuy and F. Peyrot (2010). "Metabolic stability of superoxide and hydroxyl radical adducts of a cyclic nitrone toward rat liver microsomes and cytosol: A stopped-flow ESR spectroscopy study." Free Radic Biol Med 49(3): 437-446.

Bienert, G. P., A. L. Moller, K. A. Kristiansen, A. Schulz, I. M. Moller, J. K. Schjoerring and T. P. Jahn (2007). "Specific aquaporins facilitate the diffusion of hydrogen peroxide across membranes." J Biol Chem 282(2): 1183-1192.

Bindoli, A., J. M. Fukuto and H. J. Forman (2008). "Thiol chemistry in peroxidase catalysis and redox signaling." Antioxid Redox Signal 10(9): 1549-1564.

Blackwell, T. S., T. R. Blackwell, E. P. Holden, B. W. Christman and J. W. Christman (1996). "In vivo antioxidant treatment suppresses nuclear factor-kappa B activation and neutrophilic lung inflammation." J Immunol 157(4): 1630-1637.

Blackwell, T. S., J. W. Christman, T. Hagan, P. Price, T. Edens, P. E. Morris, S. N. Wolff, S. A. Goodman and B. W. Christman (2000). "Oxidative stress and NF-kappaB activation: correlation in patients following allogeneic bone marrow transplantation." Antioxid Redox Signal 2(1): 93-102.

239

Blonder, J., K. C. Chan, H. J. Issaq and T. D. Veenstra (2006). "Identification of membrane proteins from mammalian cell/tissue using methanol-facilitated solubilization and tryptic digestion coupled with 2D-LC-MS/MS." Nature Protocols 1(6): 2784-2790.

Boos, C. J., B. Balakrishnan, S. Jessani, A. D. Blann and G. Y. Lip (2007). "Effects of percutaneous coronary intervention on peripheral venous blood circulating endothelial cells and plasma indices of endothelial damage/dysfunction." Chest 132(6): 1920-1926.

Boston, U. o. (2017). "NF-kB Target Genes."

Braakman, I. and D. N. Hebert (2013). "Protein folding in the endoplasmic reticulum." Cold Spring Harb Perspect Biol 5(5): a013201.

Brieger, K., S. Schiavone, F. J. Miller, Jr. and K. H. Krause (2012). "Reactive oxygen species: from health to disease." Swiss Med Wkly 142: w13659.

Brigelius-Flohe, R. and M. Maiorino (2013). "Glutathione peroxidases." Biochim Biophys Acta 1830(5): 3289-3303.

Brubaker, S. W., K. S. Bonham, I. Zanoni and J. C. Kagan (2015). "Innate immune pattern recognition: a cell biological perspective." Annu Rev Immunol 33: 257-290.

Brundu, S., L. Palma, G. G. Picceri, D. Ligi, C. Orlandi, L. Galluzzi, L. Chiarantini, A. Casabianca, G. F. Schiavano, M. Santi, F. Mannello, K. Green, M. Smietana, M. Magnani and A. Fraternale (2016). "Glutathione Depletion Is Linked with Th2 Polarization in Mice with a Retrovirus-Induced Immunodeficiency Syndrome, Murine AIDS: Role of Proglutathione Molecules as Immunotherapeutics." J Virol 90(16): 7118-7130.

Brunelle, J. L. and R. Green (2014). "One-dimensional SDS-polyacrylamide gel electrophoresis (1D SDS-PAGE)." Methods Enzymol 541: 151-159.

Buchmann, K. (2014). "Evolution of innate immunity: clues from invertebrates via fish to mammals." Frontiers in Immunology 5.

Buonocore, G., S. Perrone and M. L. Tataranno (2010). "Oxygen toxicity: chemistry and biology of reactive oxygen species." Semin Fetal Neonatal Med 15(4): 186-190.

Bustin, S. A. (2000). "Absolute quantification of mRNA using real-time reverse transcription polymerase chain reaction assays." J Mol Endocrinol 25(2): 169-193.

Butera, D., K. M. Cook, J. Chiu, J. W. Wong and P. J. Hogg (2014). "Control of blood proteins by functional disulfide bonds." Blood 123(13): 2000-2007.

Cadenas, E. and K. J. Davies (2000). "Mitochondrial free radical generation, oxidative stress, and aging." Free Radic Biol Med 29(3-4): 222-230.

Cai, J., Y. Chen, S. Seth, S. Furukawa, R. W. Compans and D. P. Jones (2003). "Inhibition of influenza infection by glutathione." Free Radic Biol Med 34(7): 928-936.

Cai, Z. and L. J. Yan (2013). "Protein Oxidative Modifications: Beneficial Roles in Disease and Health." J Biochem Pharmacol Res 1(1): 15-26.

240

Callewaert, L. and C. W. Michiels (2010). "Lysozymes in the animal kingdom." J Biosci 35(1): 127-160.

Campos-Acevedo, A. A., R. R. Sotelo-Mundo, J. Perez and E. Rudino-Pinera (2017). "Is dimerization a common feature in thioredoxins? The case of thioredoxin from Litopenaeus vannamei." Acta Crystallogr D Struct Biol 73(Pt 4): 326-339.

Carocho, M. and I. C. Ferreira (2013). "A review on antioxidants, prooxidants and related controversy: natural and synthetic compounds, screening and analysis methodologies and future perspectives." Food Chem Toxicol 51: 15-25.

Carvalho, A. N., C. Marques, R. C. Guedes, M. Castro-Caldas, E. Rodrigues, J. van Horssen and M. J. Gama (2016). "S-Glutathionylation of Keap1: a new role for glutathione S-transferase pi in neuronal protection." FEBS Lett 590(10): 1455-1466.

Chantzoura, E., E. Prinarakis, D. Panagopoulos, G. Mosialos and G. Spyrou (2010). "Glutaredoxin-1 regulates TRAF6 activation and the IL-1 receptor/TLR4 signalling." Biochem Biophys Res Commun 403(3-4): 335-339.

Chao, T. H., Y. H. Li, W. C. Tsai, J. H. Chen, P. Y. Liu and L. M. Tsai (2004). "Elevation of the soluble thrombomodulin levels is associated with inflammation after percutaneous coronary interventions." Clin Cardiol 27(7): 407-410.

Chaplin, D. D. (2010). "Overview of the immune response." J Allergy Clin Immunol 125(2 Suppl 2): S3-23.

Checconi, P., S. Salzano, L. Bowler, L. Mullen, M. Mengozzi, E. M. Hanschmann, C. H. Lillig, R. Sgarbanti, S. Panella, L. Nencioni, A. T. Palamara and P. Ghezzi (2015). "Redox proteomics of the inflammatory secretome identifies a common set of redoxins and other glutathionylated proteins released in inflammation, influenza virus infection and oxidative stress." PLoS One 10(5): e0127086.

Chen, X., F. Ren, J. Hesketh, X. Shi, J. Li, F. Gan and K. Huang (2012). "Reactive oxygen species regulate the replication of porcine circovirus type 2 via NF-kappaB pathway." Virology 426(1): 66-72.

Chen, Y. and W. G. Junger (2012). "Measurement of oxidative burst in neutrophils." Methods Mol Biol 844: 115-124.

Choi, M. H., I. K. Lee, G. W. Kim, B. U. Kim, Y. H. Han, D. Y. Yu, H. S. Park, K. Y. Kim, J. S. Lee, C. Choi, Y. S. Bae, B. I. Lee, S. G. Rhee and S. W. Kang (2005). "Regulation of PDGF signalling and vascular remodelling by peroxiredoxin II." Nature 435(7040): 347-353.

Cildir, G., K. C. Low and V. Tergaonkar (2016). "Noncanonical NF-kappaB Signaling in Health and Disease." Trends Mol Med 22(5): 414-429.

Cocheme, H. M. and M. P. Murphy (2010). "Can antioxidants be effective therapeutics?" Curr Opin Investig Drugs 11(4): 426-431.

Collet, J. F. and J. Messens (2010). "Structure, function, and mechanism of thioredoxin proteins." Antioxid Redox Signal 13(8): 1205-1216.

241

Compston, A. and A. Coles (2008). "Multiple sclerosis." Lancet 372(9648): 1502-1517.

Cook, G. C. and S. Sherlock (1965). "Results of a Controlled Clinical Trial of Glutathione in Cases of Hepatic Cirrhosis." Gut 6(5): 472-&.

Cooper, A. J., J. T. Pinto and P. S. Callery (2011). "Reversible and irreversible protein glutathionylation: biological and clinical aspects." Expert Opin Drug Metab Toxicol 7(7): 891-910.

Coppock, D. L. and C. Thorpe (2006). "Multidomain flavin-dependent sulfhydryl oxidases." Antioxid Redox Signal 8(3-4): 300-311.

Cordis, G. A., G. Maulik, D. Bagchi, W. Riedel and D. K. Das (1998). "Detection of oxidative DNA damage to ischemic reperfused rat hearts by 8-hydroxydeoxyguanosine formation." J Mol Cell Cardiol 30(10): 1939-1944.

Correa, M. J. U., H. A. Mariz, L. E. C. Andrade and C. Kayser (2014). "Oral N-acetylcysteine in the treatment of Raynaud's phenomenon secondary to systemic sclerosis: a randomized, double-blind, placebo-controlled clinical trial." Revista Brasileira De Reumatologia 54(6): 452-458.

Cox, A. G., C. C. Winterbourn and M. B. Hampton (2010). "Measuring the redox state of cellular peroxiredoxins by immunoblotting." Methods Enzymol 474: 51-66.

Cu, A., Q. Ye, R. Sarria, S. Nakamura, J. Guzman and U. Costabel (2009). "N-acetylcysteine inhibits TNF-alpha, sTNFR, and TGF-beta1 release by alveolar macrophages in idiopathic pulmonary fibrosis in vitro." Sarcoidosis Vasc Diffuse Lung Dis 26(2): 147-154.

Cuadrado, A., Z. Martin-Moldes, J. Ye and I. Lastres-Becker (2014). "Transcription factors NRF2 and NF-kappaB are coordinated effectors of the Rho family, GTP-binding protein RAC1 during inflammation." J Biol Chem 289(22): 15244-15258.

Curnutte, J. T., D. M. Whitten and B. M. Babior (1974). "Defective superoxide production by granulocytes from patients with chronic granulomatous disease." N Engl J Med 290(11): 593-597.

D'Autreaux, B. and M. B. Toledano (2007). "ROS as signalling molecules: mechanisms that generate specificity in ROS homeostasis." Nat Rev Mol Cell Biol 8(10): 813-824.

Dalle-Donne, I., R. Rossi, G. Colombo, D. Giustarini and A. Milzani (2009). "Protein S-glutathionylation: a regulatory device from bacteria to humans." Trends Biochem Sci 34(2): 85-96.

Debarbieux, L. and J. Beckwith (2000). "On the functional interchangeability, oxidant versus reductant, of members of the thioredoxin superfamily." J Bacteriol 182(3): 723-727.

Demedts, M., J. Behr, R. Buhl, U. Costabel, R. Dekhuijzen, H. M. Jansen, W. MacNee, M. Thomeer, B. Wallaert, F. Laurent, A. G. Nicholson, E. K. Verbeken, J. Verschakelen, C. D. Flower, F. Capron, S. Petruzzelli, P. De Vuyst, J. M. van den Bosch, E. Rodriguez-Becerra, G. Corvasce, I. Lankhorst, M. Sardina, M. Montanari and I. S. Group (2005). "High-dose acetylcysteine in idiopathic pulmonary fibrosis." N Engl J Med 353(21): 2229-2242.

242

Deponte, M. (2013). "Glutathione catalysis and the reaction mechanisms of glutathione-dependent enzymes." Biochim Biophys Acta 1830(5): 3217-3266.

Deschacht, M., T. Horemans, W. Martinet, H. Bult, L. Maes and P. Cos (2010). "Comparative EPR study of different macrophage types stimulated for superoxide and nitric oxide production." Free Radic Res 44(7): 763-772.

Dhalla, N. S., R. M. Temsah and T. Netticadan (2000). "Role of oxidative stress in cardiovascular diseases." J Hypertens 18(6): 655-673.

Dias, F. F., K. B. Amaral, L. A. Carmo, R. Shamri, A. M. Dvorak, P. F. Weller and R. C. Melo (2014). "Human Eosinophil Leukocytes Express Protein Disulfide Isomerase in Secretory Granules and Vesicles: Ultrastructural Studies." J Histochem Cytochem 62(6): 450-459.

Diaz-Borjon, A., C. M. Weyand and J. J. Goronzy (2006). "Treatment of chronic inflammatory diseases with biologic agents: opportunities and risks for the elderly." Exp Gerontol 41(12): 1250-1255.

Dinarello, C. A. (2007). "Historical insights into cytokines." Eur J Immunol 37 Suppl 1: S34-45.

Dismukes, G. C., V. V. Klimov, S. V. Baranov, Y. N. Kozlov, J. DasGupta and A. Tyryshkin (2001). "The origin of atmospheric oxygen on Earth: the innovation of oxygenic photosynthesis." Proc Natl Acad Sci U S A 98(5): 2170-2175.

Dodd, S., O. Dean, D. L. Copolov, G. S. Malhi and M. Berk (2008). "N-acetylcysteine for antioxidant therapy: pharmacology and clinical utility." Expert Opin Biol Ther 8(12): 1955-1962.

Donath, M. Y. and S. E. Shoelson (2011). "Type 2 diabetes as an inflammatory disease." Nat Rev Immunol 11(2): 98-107.

Drazic, A. and J. Winter (2014). "The physiological role of reversible methionine oxidation." Biochim Biophys Acta 1844(8): 1367-1382.

Dumitriu, I. E., P. Baruah, M. E. Bianchi, A. A. Manfredi and P. Rovere-Querini (2005). "Requirement of HMGB1 and RAGE for the maturation of human plasmacytoid dendritic cells." Eur J Immunol 35(7): 2184-2190.

Dunkelberger, J. R. and W. C. Song (2010). "Complement and its role in innate and adaptive immune responses." Cell Res 20(1): 34-50.

Eaton, P. (2006). "Protein thiol oxidation in health and disease: techniques for measuring disulfides and related modifications in complex protein mixtures." Free Radic Biol Med 40(11): 1889-1899.

Eisen, M. B., P. T. Spellman, P. O. Brown and D. Botstein (1998). "Cluster analysis and display of genome-wide expression patterns." Proc Natl Acad Sci U S A 95(25): 14863-14868.

Eisner, V., A. Criollo, C. Quiroga, C. Olea-Azar, J. F. Santibanez, R. Troncoso, M. Chiong, G. Diaz-Araya, R. Foncea and S. Lavandero (2006). "Hyperosmotic stress-dependent

243

NFkappaB activation is regulated by reactive oxygen species and IGF-1 in cultured cardiomyocytes." FEBS Lett 580(18): 4495-4500.

Ellgaard, L. and L. W. Ruddock (2005). "The human protein disulphide isomerase family: substrate interactions and functional properties." EMBO Rep 6(1): 28-32.

Ellman, G. L. (1959). "Tissue sulfhydryl groups." Arch Biochem Biophys 82(1): 70-77.

Engelman, R., P. Weisman-Shomer, T. Ziv, J. Xu, E. S. Arner and M. Benhar (2013). "Multilevel regulation of 2-Cys peroxiredoxin reaction cycle by S-nitrosylation." J Biol Chem 288(16): 11312-11324.

Erdil, N., T. Eroglu, B. Akca, O. M. Disli, O. Yetkin, M. C. Colak, F. Erdil and B. Battaloglu (2016). "The effects of N-acetylcysteine on pulmonary functions in patients undergoing on-pump coronary artery surgery: a double blind placebo controlled study." European Review for Medical and Pharmacological Sciences 20(1): 180-187.

Esterbauer, H., R. J. Schaur and H. Zollner (1991). "Chemistry and biochemistry of 4-hydroxynonenal, malonaldehyde and related aldehydes." Free Radic Biol Med 11(1): 81-128.

Faccio, G., O. Nivala, K. Kruus, J. Buchert and M. Saloheimo (2011). "Sulfhydryl oxidases: sources, properties, production and applications." Appl Microbiol Biotechnol 91(4): 957-966.

Falkowski, P. G. and L. V. Godfrey (2008). "Electrons, life and the evolution of Earth's oxygen cycle." Philos Trans R Soc Lond B Biol Sci 363(1504): 2705-2716.

Fernandes, A. P. and A. Holmgren (2004). "Glutaredoxins: glutathione-dependent redox enzymes with functions far beyond a simple thioredoxin backup system." Antioxid Redox Signal 6(1): 63-74.

Flajnik, M. F. and M. Kasahara (2010). "Origin and evolution of the adaptive immune system: genetic events and selective pressures." Nature Reviews Genetics 11(1): 47-59.

Fomenko, D. E., S. M. Marino and V. N. Gladyshev (2008). "Functional diversity of cysteine residues in proteins and unique features of catalytic redox-active cysteines in thiol oxidoreductases." Molecules and Cells 26(3): 228-235.

Forman, H. J., M. Maiorino and F. Ursini (2010). "Signaling functions of reactive oxygen species." Biochemistry 49(5): 835-842.

Forman, H. J. and M. Torres (2001). "Signaling by the respiratory burst in macrophages." IUBMB Life 51(6): 365-371.

Fratelli, M., H. Demol, M. Puype, S. Casagrande, I. Eberini, M. Salmona, V. Bonetto, M. Mengozzi, F. Duffieux, E. Miclet, A. Bachi, J. Vandekerckhove, E. Gianazza and P. Ghezzi (2002). "Identification by redox proteomics of glutathionylated proteins in oxidatively stressed human T lymphocytes." Proc Natl Acad Sci U S A 99(6): 3505-3510.

Fratelli, M., L. O. Goodwin, U. A. Orom, S. Lombardi, R. Tonelli, M. Mengozzi and P. Ghezzi (2005). "Gene expression profiling reveals a signaling role of glutathione in redox regulation." Proc Natl Acad Sci U S A 102(39): 13998-14003.

244

Fukai, T. and M. Ushio-Fukai (2011). "Superoxide dismutases: role in redox signaling, vascular function, and diseases." Antioxid Redox Signal 15(6): 1583-1606.

Garaci, E., A. T. Palamara, M. R. Ciriolo, C. D'Agostini, M. S. Abdel-Latif, S. Aquaro, E. Lafavia and G. Rotilio (1997). "Intracellular GSH content and HIV replication in human macrophages." J Leukoc Biol 62(1): 54-59.

Gardella, S., C. Andrei, D. Ferrera, L. V. Lotti, M. R. Torrisi, M. E. Bianchi and A. Rubartelli (2002). "The nuclear protein HMGB1 is secreted by monocytes via a non-classical, vesicle-mediated secretory pathway." EMBO Rep 3(10): 995-1001.

Garlanda, C., C. A. Dinarello and A. Mantovani (2013). "The interleukin-1 family: back to the future." Immunity 39(6): 1003-1018.

Gasdaska, J. R., M. Berggren and G. Powis (1995). "Cell growth stimulation by the redox protein thioredoxin occurs by a novel helper mechanism." Cell Growth Differ 6(12): 1643-1650.

Gasdaska, J. R., D. L. Kirkpatrick, W. Montfort, M. Kuperus, S. R. Hill, M. Berggren and G. Powis (1996). "Oxidative inactivation of thioredoxin as a cellular growth factor and protection by a Cys73-->Ser mutation." Biochem Pharmacol 52(11): 1741-1747.

Geissmann, F., M. G. Manz, S. Jung, M. H. Sieweke, M. Merad and K. Ley (2010). "Development of monocytes, macrophages, and dendritic cells." Science 327(5966): 656-661.

Gelderman, K. A., M. Hultqvist, J. Holmberg, P. Olofsson and R. Holmdahl (2006). "T cell surface redox levels determine T cell reactivity and arthritis susceptibility." Proc Natl Acad Sci U S A 103(34): 12831-12836.

Ghezzi, P. (2013). "Protein glutathionylation in health and disease." Biochim Biophys Acta 1830(5): 3165-3172.

Ghezzi, P., V. Bonetto and M. Fratelli (2005). "Thiol-disulfide balance: from the concept of oxidative stress to that of redox regulation." Antioxid Redox Signal 7(7-8): 964-972.

Giacco, F. and M. Brownlee (2010). "Oxidative stress and diabetic complications." Circ Res 107(9): 1058-1070.

Gilgun-Sherki, Y., E. Melamed and D. Offen (2004). "The role of oxidative stress in the pathogenesis of multiple sclerosis: the need for effective antioxidant therapy." J Neurol 251(3): 261-268.

Gill, R., A. Tsung and T. Billiar (2010). "Linking oxidative stress to inflammation: Toll-like receptors." Free Radic Biol Med 48(9): 1121-1132.

Gloire, G., S. Legrand-Poels and J. Piette (2006). "NF-kappaB activation by reactive oxygen species: fifteen years later." Biochem Pharmacol 72(11): 1493-1505.

Go, Y. M. and D. P. Jones (2011). "Cysteine/cystine redox signaling in cardiovascular disease." Free Radic Biol Med 50(4): 495-509.

245

Godoy, J. R., M. Funke, W. Ackermann, P. Haunhorst, S. Oesteritz, F. Capani, H. P. Elsasser and C. H. Lillig (2011). "Redox atlas of the mouse. Immunohistochemical detection of glutaredoxin-, peroxiredoxin-, and thioredoxin-family proteins in various tissues of the laboratory mouse." Biochim Biophys Acta 1810(1): 2-92.

Gorrini, C., P. S. Baniasadi, I. S. Harris, J. Silvester, S. Inoue, B. Snow, P. A. Joshi, A. Wakeham, S. D. Molyneux, B. Martin, P. Bouwman, D. W. Cescon, A. J. Elia, Z. Winterton-Perks, J. Cruickshank, D. Brenner, A. Tseng, M. Musgrave, H. K. Berman, R. Khokha, J. Jonkers, T. W. Mak and M. L. Gauthier (2013). "BRCA1 interacts with Nrf2 to regulate antioxidant signaling and cell survival." J Exp Med 210(8): 1529-1544.

Gosset, P., B. Wallaert, A. B. Tonnel and C. Fourneau (1999). "Thiol regulation of the production of TNF-alpha, IL-6 and IL-8 by human alveolar macrophages." Eur Respir J 14(1): 98-105.

Graham, F. L., J. Smiley, W. C. Russell and R. Nairn (1977). "Characteristics of a human cell line transformed by DNA from human adenovirus type 5." J Gen Virol 36(1): 59-74.

Grek, C. L., J. Zhang, Y. Manevich, D. M. Townsend and K. D. Tew (2013). "Causes and consequences of cysteine S-glutathionylation." J Biol Chem 288(37): 26497-26504.

Grendar, J., J. F. Ouellet, A. McKay, F. R. Sutherland, O. F. Bathe, C. G. Ball and E. Dixon (2016). "Effect of N-acetylcysteine on liver recovery after resection: A randomized clinical trial." Journal of Surgical Oncology 114(4): 446-450.

Griese, M., M. Kappler, C. Eismann, M. Ballmann, S. Junge, E. Rietschel, S. van Koningsbruggen-Rietschel, D. Staab, C. Rolinck-Werninghaus, U. Mellies, T. Kohnlein, T. Wagner, S. Konig, H. Teschler, H. E. Heuer, M. Kopp, S. Heyder, J. Hammermann, P. Kuster, M. Honer, U. Mansmann, I. Beck-Speier, D. Hartl, C. Fuchs, G. Glutathione Study and A. Hector (2013). "Inhalation treatment with glutathione in patients with cystic fibrosis. A randomized clinical trial." Am J Respir Crit Care Med 188(1): 83-89.

Griffith, J. W., C. L. Sokol and A. D. Luster (2014). "Chemokines and chemokine receptors: positioning cells for host defense and immunity." Annu Rev Immunol 32: 659-702.

Griffith, O. W. and A. Meister (1979). "POTENT AND SPECIFIC-INHIBITION OF GLUTATHIONE SYNTHESIS BY BUTHIONINE SULFOXIMINE (S-NORMAL-BUTYL HOMOCYSTEINE SULFOXIMINE)." Journal of Biological Chemistry 254(16): 7558-7560.

Grivennikov, S. I., F. R. Greten and M. Karin (2010). "Immunity, inflammation, and cancer." Cell 140(6): 883-899.

Guo, H., J. B. Callaway and J. P. Ting (2015). "Inflammasomes: mechanism of action, role in disease, and therapeutics." Nat Med 21(7): 677-687.

Guyton, K. Z., Y. Liu, M. Gorospe, Q. Xu and N. J. Holbrook (1996). "Activation of mitogen-activated protein kinase by H2O2. Role in cell survival following oxidant injury." J Biol Chem 271(8): 4138-4142.

Haendeler, J. (2006). "Thioredoxin-1 and posttranslational modifications." Antioxid Redox Signal 8(9-10): 1723-1728.

246

Hahm, E., J. Li, K. Kim, S. Huh, S. Rogelj and J. Cho (2013). "Extracellular protein disulfide isomerase regulates ligand-binding activity of alphaMbeta2 integrin and neutrophil recruitment during vascular inflammation." Blood 121(19): 3789-3800, S3781-3715.

Halliwell, B. (2007). "Biochemistry of oxidative stress." Biochem Soc Trans 35(Pt 5): 1147-1150.

Halliwell, B. (2013). "The antioxidant paradox: less paradoxical now?" Br J Clin Pharmacol 75(3): 637-644.

Hambleton, J., S. L. Weinstein, L. Lem and A. L. DeFranco (1996). "Activation of c-Jun N-terminal kinase in bacterial lipopolysaccharide-stimulated macrophages." Proc Natl Acad Sci U S A 93(7): 2774-2778.

Hamzeh, N., L. Li, B. Barkes, J. Huang, B. Canono, M. Gillespie, L. Maier and B. Day (2016). "The effect of an oral anti-oxidant, N-Acetyl-cysteine, on inflammatory and oxidative markers in pulmonary sarcoidosis." Respiratory Medicine 112: 106-111.

Han, R. M., J. P. Zhang and L. H. Skibsted (2012). "Reaction dynamics of flavonoids and carotenoids as antioxidants." Molecules 17(2): 2140-2160.

Han, X., A. Aslanian and J. R. Yates, 3rd (2008). "Mass spectrometry for proteomics." Curr Opin Chem Biol 12(5): 483-490.

Hanschmann, E. M., J. R. Godoy, C. Berndt, C. Hudemann and C. H. Lillig (2013). "Thioredoxins, glutaredoxins, and peroxiredoxins--molecular mechanisms and health significance: from cofactors to antioxidants to redox signaling." Antioxid Redox Signal 19(13): 1539-1605.

Hansson, G. K. (2005). "Inflammation, atherosclerosis, and coronary artery disease." N Engl J Med 352(16): 1685-1695.

Hansson, G. K. and A. Hermansson (2011). "The immune system in atherosclerosis." Nat Immunol 12(3): 204-212.

Harijith, A., D. L. Ebenezer and V. Natarajan (2014). "Reactive oxygen species at the crossroads of inflammasome and inflammation." Front Physiol 5: 352.

Harper, V. M., J. Y. Oh, R. Stapley, M. B. Marques, L. Wilson, S. Barnes, C. W. Sun, T. Townes and R. P. Patel (2015). "Peroxiredoxin-2 recycling is inhibited during erythrocyte storage." Antioxid Redox Signal 22(4): 294-307.

Harrison, R. (2004). "Physiological roles of xanthine oxidoreductase." Drug Metab Rev 36(2): 363-375.

Hassan, H. M. and I. Fridovich (1979). "Intracellular production of superoxide radical and of hydrogen peroxide by redox active compounds." Arch Biochem Biophys 196(2): 385-395.

Hayden, M. S. and S. Ghosh (2008). "Shared principles in NF-kappaB signaling." Cell 132(3): 344-362.

247

Hayden, M. S. and S. Ghosh (2011). "NF-kappaB in immunobiology." Cell Res 21(2): 223-244.

Herzenberg, L. A., S. C. De Rosa, J. G. Dubs, M. Roederer, M. T. Anderson, S. W. Ela, S. C. Deresinski and L. A. Herzenberg (1997). "Glutathione deficiency is associated with impaired survival in HIV disease." Proc Natl Acad Sci U S A 94(5): 1967-1972.

Ho, E., K. Karimi Galougahi, C. C. Liu, R. Bhindi and G. A. Figtree (2013). "Biological markers of oxidative stress: Applications to cardiovascular research and practice." Redox Biol 1: 483-491.

Hoffmann, H. H., W. M. Schneider and C. M. Rice (2015). "Interferons and viruses: an evolutionary arms race of molecular interactions." Trends Immunol 36(3): 124-138.

Hogg, J. C., F. Chu, S. Utokaparch, R. Woods, W. M. Elliott, L. Buzatu, R. M. Cherniack, R. M. Rogers, F. C. Sciurba, H. O. Coxson and P. D. Pare (2004). "The nature of small-airway obstruction in chronic obstructive pulmonary disease." N Engl J Med 350(26): 2645-2653.

Holland, S. M. (2010). "Chronic granulomatous disease." Clin Rev Allergy Immunol 38(1): 3-10.

Holmgren, A. (1985). "Thioredoxin." Annu Rev Biochem 54: 237-271.

Holmgren, A., B. O. Soderberg, H. Eklund and C. I. Branden (1975). "Three-dimensional structure of Escherichia coli thioredoxin-S2 to 2.8 A resolution." Proc Natl Acad Sci U S A 72(6): 2305-2309.

Holmstrom, K. M. and T. Finkel (2014). "Cellular mechanisms and physiological consequences of redox-dependent signalling." Nat Rev Mol Cell Biol 15(6): 411-421.

Hornung, V., F. Bauernfeind, A. Halle, E. O. Samstad, H. Kono, K. L. Rock, K. A. Fitzgerald and E. Latz (2008). "Silica crystals and aluminum salts activate the NALP3 inflammasome through phagosomal destabilization." Nat Immunol 9(8): 847-856.

Huang da, W., B. T. Sherman and R. A. Lempicki (2009). "Systematic and integrative analysis of large gene lists using DAVID bioinformatics resources." Nat Protoc 4(1): 44-57.

Huang, H., W. Mai, D. Liu, Y. Hao, J. Tao and Y. Dong (2008). "The oxidation ratio of LDL: a predictor for coronary artery disease." Dis Markers 24(6): 341-349.

Ikonomidis, I., C. A. Michalakeas, J. Parissis, I. Paraskevaidis, K. Ntai, I. Papadakis, M. Anastasiou-Nana and J. Lekakis (2012). "Inflammatory markers in coronary artery disease." Biofactors 38(5): 320-328.

Iliodromitis, E. K., S. Kyrzopoulos, I. A. Paraskevaidis, K. G. Kolocassides, S. Adamopoulos, G. Karavolias and D. T. Kremastinos (2006). "Increased C reactive protein and cardiac enzyme levels after coronary stent implantation. Is there protection by remote ischaemic preconditioning?" Heart 92(12): 1821-1826.

Iversen, M. B., R. H. Gottfredsen, U. G. Larsen, J. J. Enghild, J. Praetorius, N. Borregaard and S. V. Petersen (2016). "Extracellular superoxide dismutase is present in secretory

248

vesicles of human neutrophils and released upon stimulation." Free Radic Biol Med 97: 478-488.

Iwasaki, A. and R. Medzhitov (2015). "Control of adaptive immunity by the innate immune system." Nat Immunol 16(4): 343-353.

Iyer, G. Y., M. F. Islam and J. H. Quastel (1961). "Biochemical Aspects of Phagocytosis." Nature 192(480): 535-&.

Jacob, C., G. I. Giles, N. M. Giles and H. Sies (2003). "Sulfur and selenium: the role of oxidation state in protein structure and function." Angew Chem Int Ed Engl 42(39): 4742-4758.

Jaramillo, M. and M. Olivier (2002). "Hydrogen peroxide induces murine macrophage chemokine gene transcription via extracellular signal-regulated kinase- and cyclic adenosine 5'-monophosphate (cAMP)-dependent pathways: involvement of NF-kappa B, activator protein 1, and cAMP response element binding protein." J Immunol 169(12): 7026-7038.

Jiang, F., Y. Zhang and G. J. Dusting (2011). "NADPH oxidase-mediated redox signaling: roles in cellular stress response, stress tolerance, and tissue repair." Pharmacol Rev 63(1): 218-242.

Jiang, Q. (2014). "Natural forms of vitamin E: metabolism, antioxidant, and anti-inflammatory activities and their role in disease prevention and therapy." Free Radic Biol Med 72: 76-90.

Jiang, X. M., M. Fitzgerald, C. M. Grant and P. J. Hogg (1999). "Redox control of exofacial protein thiols/disulfides by protein disulfide isomerase." J Biol Chem 274(4): 2416-2423.

Johnson, K., C. E. McEvoy, S. Naqvi, C. Wendt, R. A. Reilkoff, K. M. Kunisaki, E. E. Wetherbee, D. Nelson, R. Tirouvanziam and D. E. Niewoehner (2016). "High-dose oral N-acetylcysteine fails to improve respiratory health status in patients with chronic obstructive pulmonary disease and chronic bronchitis: a randomized, placebo-controlled trial." Int J Chron Obstruct Pulmon Dis 11: 799-807.

Jounai, N., K. Kobiyama, F. Takeshita and K. J. Ishii (2012). "Recognition of damage-associated molecular patterns related to nucleic acids during inflammation and vaccination." Front Cell Infect Microbiol 2: 168.

Kalinina, E. V., N. N. Chernov and M. D. Novichkova (2014). "Role of glutathione, glutathione transferase, and glutaredoxin in regulation of redox-dependent processes." Biochemistry (Mosc) 79(13): 1562-1583.

Kalliolias, G. D. and L. B. Ivashkiv (2016). "TNF biology, pathogenic mechanisms and emerging therapeutic strategies." Nat Rev Rheumatol 12(1): 49-62.

Kalogeris, T., C. P. Baines, M. Krenz and R. J. Korthuis (2012). "Cell biology of ischemia/reperfusion injury." Int Rev Cell Mol Biol 298: 229-317.

Kang, D. H., D. J. Lee, J. Kim, J. Y. Lee, H. W. Kim, K. Kwon, W. R. Taylor, H. Jo and S. W. Kang (2013). "Vascular injury involves the overoxidation of peroxiredoxin type II and is recovered by the peroxiredoxin activity mimetic that induces reendothelialization." Circulation 128(8): 834-844.

249

Karakas, M. and W. Koenig (2012). "Myeloperoxidase production by macrophage and risk of atherosclerosis." Curr Atheroscler Rep 14(3): 277-283.

Kawasaki, T. and T. Kawai (2014). "Toll-like receptor signaling pathways." Front Immunol 5: 461.

Kehrer, J. P. (2000). "The Haber-Weiss reaction and mechanisms of toxicity." Toxicology 149(1): 43-50.

Kellett-Clarke, H., M. Stegmann, A. N. Barclay and C. Metcalfe (2015). "CD44 Binding to Hyaluronic Acid Is Redox Regulated by a Labile Disulfide Bond in the Hyaluronic Acid Binding Site." PLoS One 10(9): e0138137.

Khan, A. A., A. H. Rahmani, Y. H. Aldebasi and S. M. Aly (2014). "Biochemical and pathological studies on peroxidases -an updated review." Glob J Health Sci 6(5): 87-98.

Kimbrell, D. A. and B. Beutler (2001). "The evolution and genetics of innate immunity." Nat Rev Genet 2(4): 256-267.

Kirkman, H. N. and G. F. Gaetani (2007). "Mammalian catalase: a venerable enzyme with new mysteries." Trends Biochem Sci 32(1): 44-50.

Kirkpatrick, D. L., M. Kuperus, M. Dowdeswell, N. Potier, L. J. Donald, M. Kunkel, M. Berggren, M. Angulo and G. Powis (1998). "Mechanisms of inhibition of the thioredoxin growth factor system by antitumor 2-imidazolyl disulfides." Biochem Pharmacol 55(7): 987-994.

Klebanoff, S. J. (1967). "Iodination of bacteria: a bactericidal mechanism." J Exp Med 126(6): 1063-1078.

Klebanoff, S. J. (1975). "Antimicrobial mechanisms in neutrophilic polymorphonuclear leukocytes." Semin Hematol 12(2): 117-142.

Kleber, M. E., G. Goliasch, T. B. Grammer, S. Pilz, A. Tomaschitz, G. Silbernagel, G. Maurer, W. Marz and A. Niessner (2014). "Evolving biomarkers improve prediction of long-term mortality in patients with stable coronary artery disease: the BIO-VILCAD score." J Intern Med 276(2): 184-194.

Klein, E. A., I. M. Thompson, Jr., C. M. Tangen, J. J. Crowley, M. S. Lucia, P. J. Goodman, L. M. Minasian, L. G. Ford, H. L. Parnes, J. M. Gaziano, D. D. Karp, M. M. Lieber, P. J. Walther, L. Klotz, J. K. Parsons, J. L. Chin, A. K. Darke, S. M. Lippman, G. E. Goodman, F. L. Meyskens, Jr. and L. H. Baker (2011). "Vitamin E and the risk of prostate cancer: the Selenium and Vitamin E Cancer Prevention Trial (SELECT)." JAMA 306(14): 1549-1556.

Klotz, L. O., C. Pellieux, K. Briviba, C. Pierlot, J. M. Aubry and H. Sies (1999). "Mitogen-activated protein kinase (p38-, JNK-, ERK-) activation pattern induced by extracellular and intracellular singlet oxygen and UVA." Eur J Biochem 260(3): 917-922.

Koenderman, L., W. Buurman and M. R. Daha (2014). "The innate immune response." Immunol Lett 162(2 Pt B): 95-102.

250

Kosek, D., S. Kylarova, K. Psenakova, L. Rezabkova, P. Herman, J. Vecer, V. Obsilova and T. Obsil (2014). "Biophysical and structural characterization of the thioredoxin-binding domain of protein kinase ASK1 and its interaction with reduced thioredoxin." J Biol Chem 289(35): 24463-24474.

Kosower, N. S., E. M. Kosower, B. Wertheim and W. S. Correa (1969). "Diamide, a new reagent for the intracellular oxidation of glutathione to the disulfide." Biochemical and Biophysical Research Communications 37(4): 593-596.

Kowaltowski, A. J., N. C. de Souza-Pinto, R. F. Castilho and A. E. Vercesi (2009). "Mitochondria and reactive oxygen species." Free Radic Biol Med 47(4): 333-343.

Kvietys, P. R. and D. N. Granger (2012). "Role of reactive oxygen and nitrogen species in the vascular responses to inflammation." Free Radic Biol Med 52(3): 556-592.

Kwon, A. T., D. J. Arenillas, R. Worsley Hunt and W. W. Wasserman (2012). "oPOSSUM-3: advanced analysis of regulatory motif over-representation across genes or ChIP-Seq datasets." G3 (Bethesda) 2(9): 987-1002.

Lambeth, J. D. (2004). "NOX enzymes and the biology of reactive oxygen." Nat Rev Immunol 4(3): 181-189.

Landmann, R., F. Scherer, R. Schumann, S. Link, S. Sansano and W. Zimmerli (1995). "LPS directly induces oxygen radical production in human monocytes via LPS binding protein and CD14." J Leukoc Biol 57(3): 440-449.

Laragione, T., V. Bonetto, F. Casoni, T. Massignan, G. Bianchi, E. Gianazza and P. Ghezzi (2003). "Redox regulation of surface protein thiols: identification of integrin alpha-4 as a molecular target by using redox proteomics." Proc Natl Acad Sci U S A 100(25): 14737-14741.

Laurent, T. C., E. C. Moore and P. Reichard (1964). "Enzymatic Synthesis of Deoxyribonucleotides. Iv. Isolation and Characterization of Thioredoxin, the Hydrogen Donor from Escherichia Coli B." J Biol Chem 239: 3436-3444.

Laurindo, F. R., L. A. Pescatore and C. Fernandes Dde (2012). "Protein disulfide isomerase in redox cell signaling and homeostasis." Free Radic Biol Med 52(9): 1954-1969.

Lawrence, T. and D. W. Gilroy (2007). "Chronic inflammation: a failure of resolution?" Int J Exp Pathol 88(2): 85-94.

Lee, D. H., J. H. Park, S. B. Han, D. Y. Yoon, Y. Y. Jung and J. T. Hong (2017). "Peroxiredoxin 6 overexpression attenuates lipopolysaccharide-induced acute kidney injury." Oncotarget.

Lee, E. Y., Z. H. Lee and Y. W. Song (2009). "CXCL10 and autoimmune diseases." Autoimmun Rev 8(5): 379-383.

Lee, S. M., M. Hutchinson and D. A. Saint (2016). "The role of Toll-like receptor 4 (TLR4) in cardiac ischaemic-reperfusion injury, cardioprotection and preconditioning." Clin Exp Pharmacol Physiol 43(9): 864-871.

251

Lee, W., K. S. Choi, J. Riddell, C. Ip, D. Ghosh, J. H. Park and Y. M. Park (2007). "Human peroxiredoxin 1 and 2 are not duplicate proteins: the unique presence of CYS83 in Prx1 underscores the structural and functional differences between Prx1 and Prx2." J Biol Chem 282(30): 22011-22022.

Leonard, S. E. and K. S. Carroll (2011). "Chemical 'omics' approaches for understanding protein cysteine oxidation in biology." Curr Opin Chem Biol 15(1): 88-102.

Lerner, A., P. Jeremias and T. Matthias (2015). "The World Incidence and Prevalence of Autoimmune Diseases is Increasing." International Journal of Celiac Disease 3(4): 151-155.

Libby, P. (2002). "Inflammation in atherosclerosis." Nature 420(6917): 868-874.

Libby, P. (2007). "Inflammatory mechanisms: the molecular basis of inflammation and disease." Nutr Rev 65(12 Pt 2): S140-146.

Libby, P. and P. Theroux (2005). "Pathophysiology of coronary artery disease." Circulation 111(25): 3481-3488.

Lillig, C. H. and C. Berndt (2013). "Glutaredoxins in thiol/disulfide exchange." Antioxid Redox Signal 18(13): 1654-1665.

Lincoln, D. T., E. M. Ali Emadi, K. F. Tonissen and F. M. Clarke (2003). "The thioredoxin-thioredoxin reductase system: over-expression in human cancer." Anticancer Res 23(3B): 2425-2433.

Liu, Y., H. Yin, M. Zhao and Q. Lu (2014). "TLR2 and TLR4 in autoimmune diseases: a comprehensive review." Clin Rev Allergy Immunol 47(2): 136-147.

Liu, Z. G. (2005). "Molecular mechanism of TNF signaling and beyond." Cell Res 15(1): 24-27.

Livak, K. J. and T. D. Schmittgen (2001). "Analysis of relative gene expression data using real-time quantitative PCR and the 2(-Delta Delta C(T)) Method." Methods 25(4): 402-408.

Lo Conte, M. and K. S. Carroll (2013). "The redox biochemistry of protein sulfenylation and sulfinylation." J Biol Chem 288(37): 26480-26488.

Lo Conte, M., J. S. Lin, M. A. Wllson and K. S. Carroll (2015). "A Chemical Approach for the Detection of Protein Sulfinylation." Acs Chemical Biology 10(8): 1825-1830.

Low, F. M., M. B. Hampton, A. V. Peskin and C. C. Winterbourn (2007). "Peroxiredoxin 2 functions as a noncatalytic scavenger of low-level hydrogen peroxide in the erythrocyte." Blood 109(6): 2611-2617.

Low, F. M., M. B. Hampton and C. C. Winterbourn (2008). "Peroxiredoxin 2 and peroxide metabolism in the erythrocyte." Antioxid Redox Signal 10(9): 1621-1630.

Lu, J. and A. Holmgren (2014). "The thioredoxin antioxidant system." Free Radic Biol Med 66: 75-87.

252

Lu, S. C. (2013). "Glutathione synthesis." Biochim Biophys Acta 1830(5): 3143-3153.

Lunardi, S., N. B. Jamieson, S. Y. Lim, K. L. Griffiths, M. Carvalho-Gaspar, O. Al-Assar, S. Yameen, R. C. Carter, C. J. McKay, G. Spoletini, S. D'Ugo, M. A. Silva, O. J. Sansom, K. P. Janssen, R. J. Muschel and T. B. Brunner (2014). "IP-10/CXCL10 induction in human pancreatic cancer stroma influences lymphocytes recruitment and correlates with poor survival." Oncotarget 5(22): 11064-11080.

Luu, K., C. J. Greenhill, A. Majoros, T. Decker, B. J. Jenkins and A. Mansell (2014). "STAT1 plays a role in TLR signal transduction and inflammatory responses." Immunol Cell Biol 92(9): 761-769.

Macchia, I., A. T. Palamara, C. Bue, P. Savini, M. Ciriolo, R. Gaziano and P. di Francesco (1999). "Increased replication of Sendai virus in morphine-treated epithelial cells: evidence for the involvement of the intracellular levels of glutathione." Int J Immunopharmacol 21(3): 185-193.

Madrigal-Matute, J., C. E. Fernandez-Garcia, L. M. Blanco-Colio, E. Burillo, A. Fortuno, R. Martinez-Pinna, P. Llamas-Granda, O. Beloqui, J. Egido, G. Zalba and J. L. Martin-Ventura (2015). "Thioredoxin-1/peroxiredoxin-1 as sensors of oxidative stress mediated by NADPH oxidase activity in atherosclerosis." Free Radic Biol Med 86: 352-361.

Marino, S. M. and V. N. Gladyshev (2009). "A structure-based approach for detection of thiol oxidoreductases and their catalytic redox-active cysteine residues." PLoS Comput Biol 5(5): e1000383.

Marino, S. M. and V. N. Gladyshev (2010). "Cysteine function governs its conservation and degeneration and restricts its utilization on protein surfaces." J Mol Biol 404(5): 902-916.

Martina, V., A. Masha, V. R. Gigliardi, L. Brocato, E. Manzato, A. Berchio, P. Massarenti, F. Settanni, L. Della Casa, S. Bergamini and A. Iannone (2008). "Long-term N-acetylcysteine and L-arginine administration reduces endothelial activation and systolic blood pressure in hypertensive patients with type 2 diabetes." Diabetes Care 31(5): 940-944.

Martinez-Pinna, R., J. S. Lindholt, L. M. Blanco-Colio, T. Dejouvencel, J. Madrigal-Matute, P. Ramos-Mozo, M. Vega de Ceniga, J. B. Michel, J. Egido, O. Meilhac and J. L. Martin-Ventura (2010). "Increased levels of thioredoxin in patients with abdominal aortic aneurysms (AAAs). A potential link of oxidative stress with AAA evolution." Atherosclerosis 212(1): 333-338.

Martinez-Pinna, R., P. Ramos-Mozo, J. Madrigal-Matute, L. M. Blanco-Colio, J. A. Lopez, E. Calvo, E. Camafeita, J. S. Lindholt, O. Meilhac, S. Delbosc, J. B. Michel, M. Vega de Ceniga, J. Egido and J. L. Martin-Ventura (2011). "Identification of peroxiredoxin-1 as a novel biomarker of abdominal aortic aneurysm." Arterioscler Thromb Vasc Biol 31(4): 935-943.

Martinon, F., V. Petrilli, A. Mayor, A. Tardivel and J. Tschopp (2006). "Gout-associated uric acid crystals activate the NALP3 inflammasome." Nature 440(7081): 237-241.

McInnes, I. B. and G. Schett (2007). "Cytokines in the pathogenesis of rheumatoid arthritis." Nat Rev Immunol 7(6): 429-442.

Medzhitov, R. (2008). "Origin and physiological roles of inflammation." Nature 454(7203): 428-435.

253

Medzhitov, R. and T. Horng (2009). "Transcriptional control of the inflammatory response." Nat Rev Immunol 9(10): 692-703.

Meister, A. and M. E. Anderson (1983). "Glutathione." Annu Rev Biochem 52: 711-760.

Meng, T. C., T. Fukada and N. K. Tonks (2002). "Reversible oxidation and inactivation of protein tyrosine phosphatases in vivo." Mol Cell 9(2): 387-399.

Messmer, D., H. Yang, G. Telusma, F. Knoll, J. Li, B. Messmer, K. J. Tracey and N. Chiorazzi (2004). "High mobility group box protein 1: an endogenous signal for dendritic cell maturation and Th1 polarization." J Immunol 173(1): 307-313.

Metcalfe, C., P. Cresswell and A. N. Barclay (2012). "Interleukin-2 signalling is modulated by a labile disulfide bond in the CD132 chain of its receptor." Open Biol 2(1): 110036.

Metcalfe, C., P. Cresswell, L. Ciaccia, B. Thomas and A. N. Barclay (2011). "Labile disulfide bonds are common at the leucocyte cell surface." Open Biol 1(3): 110010.

Meyer, A., R. Buhl and H. Magnussen (1994). "The effect of oral N-acetylcysteine on lung glutathione levels in idiopathic pulmonary fibrosis." Eur Respir J 7(3): 431-436.

Michigami, T. (2013). "Extracellular phosphate as a signaling molecule." Contrib Nephrol 180: 14-24.

Mihm, S., D. Galter and W. Droge (1995). "Modulation of transcription factor NF kappa B activity by intracellular glutathione levels and by variations of the extracellular cysteine supply." FASEB J 9(2): 246-252.

Mikami, T., N. Satoh, I. Hatayama and A. Nakane (2004). "Buthionine sulfoximine inhibits cytopathic effect and apoptosis induced by infection with human echovirus 9." Arch Virol 149(6): 1117-1128.

Mills, K. H. (2011). "TLR-dependent T cell activation in autoimmunity." Nat Rev Immunol 11(12): 807-822.

Mogensen, T. H. (2009). "Pathogen recognition and inflammatory signaling in innate immune defenses." Clin Microbiol Rev 22(2): 240-273, Table of Contents.

Morgan, M. J. and Z. G. Liu (2011). "Crosstalk of reactive oxygen species and NF-kappaB signaling." Cell Res 21(1): 103-115.

Mosmann, T. (1983). "Rapid colorimetric assay for cellular growth and survival: application to proliferation and cytotoxicity assays." J Immunol Methods 65(1-2): 55-63.

Mullen, L., E. M. Hanschmann, C. H. Lillig, L. A. Herzenberg and P. Ghezzi (2015). "Cysteine Oxidation Targets Peroxiredoxins 1 and 2 for Exosomal Release through a Novel Mechanism of Redox-Dependent Secretion." Mol Med 21: 98-108.

Mullen, L., M. Seavill, R. Hammouz, B. Bottazzi, P. Chan, D. Vaudry and P. Ghezzi (2015). "Development of 'Redox Arrays' for identifying novel glutathionylated proteins in the secretome." Sci Rep 5: 14630.

254

Murphy, M. P. (2009). "How mitochondria produce reactive oxygen species." Biochem J 417(1): 1-13.

Murray, P. J. and T. A. Wynn (2011). "Protective and pathogenic functions of macrophage subsets." Nat Rev Immunol 11(11): 723-737.

Nagy, P. (2013). "Kinetics and mechanisms of thiol-disulfide exchange covering direct substitution and thiol oxidation-mediated pathways." Antioxid Redox Signal 18(13): 1623-1641.

Nakamura, H., S. De Rosa, M. Roederer, M. T. Anderson, J. G. Dubs, J. Yodoi, A. Holmgren, L. A. Herzenberg and L. A. Herzenberg (1996). "Elevation of plasma thioredoxin levels in HIV-infected individuals." Int Immunol 8(4): 603-611.

Napetschnig, J. and H. Wu (2013). "Molecular basis of NF-kappaB signaling." Annu Rev Biophys 42: 443-468.

Naqui, A., B. Chance and E. Cadenas (1986). "Reactive oxygen intermediates in biochemistry." Annu Rev Biochem 55: 137-166.

Narayanan, A., M. Amaya, K. Voss, M. Chung, A. Benedict, G. Sampey, K. Kehn-Hall, A. Luchini, L. Liotta, C. Bailey, A. Kumar, S. Bavari, R. M. Hakami and F. Kashanchi (2014). "Reactive oxygen species activate NFkappaB (p65) and p53 and induce apoptosis in RVFV infected liver cells." Virology 449: 270-286.

Nasef, N. A., S. Mehta and L. R. Ferguson (2017). "Susceptibility to chronic inflammation: an update." Arch Toxicol 91(3): 1131-1141.

Nathan, C. and A. Ding (2010). "Nonresolving inflammation." Cell 140(6): 871-882.

Neurath, M. F. (2014). "Cytokines in inflammatory bowel disease." Nat Rev Immunol 14(5): 329-342.

Newton, K. and V. M. Dixit (2012). "Signaling in innate immunity and inflammation." Cold Spring Harb Perspect Biol 4(3).

Nickel, W. (2003). "The mystery of nonclassical protein secretion. A current view on cargo proteins and potential export routes." Eur J Biochem 270(10): 2109-2119.

Niedzielska, E., I. Smaga, M. Gawlik, A. Moniczewski, P. Stankowicz, J. Pera and M. Filip (2016). "Oxidative Stress in Neurodegenerative Diseases." Mol Neurobiol 53(6): 4094-4125.

Ning, J. L., L. W. Mo and X. N. Lai (2010). "Low- and high-dose hydrogen peroxide regulation of transcription factor NF-E2-related factor 2." Chin Med J (Engl) 123(8): 1063-1069.

Nussbaum, C., A. Klinke, M. Adam, S. Baldus and M. Sperandio (2013). "Myeloperoxidase: a leukocyte-derived protagonist of inflammation and cardiovascular disease." Antioxid Redox Signal 18(6): 692-713.

O'Brien, P. J. (2000). "Peroxidases." Chem Biol Interact 129(1-2): 113-139.

255

O'Neill, L. A. J. (2008). "'Fine tuning' TLR signaling." Nature Immunology 9(5): 459-461.

Oka, S., H. Kamata, K. Kamata, H. Yagisawa and H. Hirata (2000). "N-acetylcysteine suppresses TNF-induced NF-kappaB activation through inhibition of IkappaB kinases." FEBS Lett 472(2-3): 196-202.

Oliveira-Marques, V., H. S. Marinho, L. Cyrne and F. Antunes (2009). "Role of hydrogen peroxide in NF-kappaB activation: from inducer to modulator." Antioxid Redox Signal 11(9): 2223-2243.

Oostenbrug, L. E., J. P. Drenth, D. J. de Jong, I. M. Nolte, E. Oosterom, H. M. van Dullemen, K. van der Linde, G. J. te Meerman, G. van der Steege, J. H. Kleibeuker and P. L. Jansen (2005). "Association between Toll-like receptor 4 and inflammatory bowel disease." Inflamm Bowel Dis 11(6): 567-575.

Oosting, M., S. C. Cheng, J. M. Bolscher, R. Vestering-Stenger, T. S. Plantinga, I. C. Verschueren, P. Arts, A. Garritsen, H. van Eenennaam, P. Sturm, B. J. Kullberg, A. Hoischen, G. J. Adema, J. W. van der Meer, M. G. Netea and L. A. Joosten (2014). "Human TLR10 is an anti-inflammatory pattern-recognition receptor." Proc Natl Acad Sci U S A 111(42): E4478-4484.

Otsuka, F., A. V. Finn, S. K. Yazdani, M. Nakano, F. D. Kolodgie and R. Virmani (2012). "The importance of the endothelium in atherothrombosis and coronary stenting." Nat Rev Cardiol 9(8): 439-453.

Pacher, P., J. S. Beckman and L. Liaudet (2007). "Nitric oxide and peroxynitrite in health and disease." Physiol Rev 87(1): 315-424.

Paget, M. S. and M. J. Buttner (2003). "Thiol-based regulatory switches." Annu Rev Genet 37: 91-121.

Palamara, A. T., C. F. Perno, M. R. Ciriolo, L. Dini, E. Balestra, C. D'Agostini, P. Di Francesco, C. Favalli, G. Rotilio and E. Garaci (1995). "Evidence for antiviral activity of glutathione: in vitro inhibition of herpes simplex virus type 1 replication." Antiviral Res 27(3): 237-253.

Panday, A., M. K. Sahoo, D. Osorio and S. Batra (2015). "NADPH oxidases: an overview from structure to innate immunity-associated pathologies." Cell Mol Immunol 12(1): 5-23.

Pandey, K. B. and S. I. Rizvi (2011). "Biomarkers of oxidative stress in red blood cells." Biomed Pap Med Fac Univ Palacky Olomouc Czech Repub 155(2): 131-136.

Papi, A., M. Contoli, P. Gasparini, L. Bristot, M. R. Edwards, M. Chicca, M. Leis, A. Ciaccia, G. Caramori, S. L. Johnston and S. Pinamonti (2008). "Role of xanthine oxidase activation and reduced glutathione depletion in rhinovirus induction of inflammation in respiratory epithelial cells." J Biol Chem 283(42): 28595-28606.

Park, H. S., J. N. Chun, H. Y. Jung, C. Choi and Y. S. Bae (2006). "Role of NADPH oxidase 4 in lipopolysaccharide-induced proinflammatory responses by human aortic endothelial cells." Cardiovasc Res 72(3): 447-455.

Pastori, D., R. Carnevale and P. Pignatelli (2014). "Is there a clinical role for oxidative stress biomarkers in atherosclerotic diseases?" Intern Emerg Med 9(2): 123-131.

256

Pedone, E., B. Ren, R. Ladenstein, M. Rossi and S. Bartolucci (2004). "Functional properties of the protein disulfide oxidoreductase from the archaeon Pyrococcus furiosus: a member of a novel protein family related to protein disulfide-isomerase." Eur J Biochem 271(16): 3437-3448.

Pelliccia, F., G. Del Prete, A. Del Prete, C. Greco and C. Gaudio (2012). "Effects of percutaneous coronary intervention and stenting with different drug-eluting coatings and platforms on endothelial damage and inflammation." Int J Cardiol 156(2): 242-243.

Pellom, S. T., R. D. Michalek, K. E. Crump, P. K. Langston, D. G. Juneau and J. M. Grayson (2013). "Increased cell surface free thiols identify effector CD8+ T cells undergoing T cell receptor stimulation." PLoS One 8(11): e81134.

Perez-Perez, M. E., A. Mata-Cabana, A. M. Sanchez-Riego, M. Lindahl and F. J. Florencio (2009). "A comprehensive analysis of the peroxiredoxin reduction system in the Cyanobacterium Synechocystis sp. strain PCC 6803 reveals that all five peroxiredoxins are thioredoxin dependent." J Bacteriol 191(24): 7477-7489.

Peristeris, P., B. D. Clark, S. Gatti, R. Faggioni, A. Mantovani, M. Mengozzi, S. F. Orencole, M. Sironi and P. Ghezzi (1992). "N-acetylcysteine and glutathione as inhibitors of tumor necrosis factor production." Cell Immunol 140(2): 390-399.

Perkins, A., K. J. Nelson, D. Parsonage, L. B. Poole and P. A. Karplus (2015). "Peroxiredoxins: guardians against oxidative stress and modulators of peroxide signaling." Trends Biochem Sci 40(8): 435-445.

Peskin, A. V., P. E. Pace, J. B. Behring, L. N. Paton, M. Soethoudt, M. M. Bachschmid and C. C. Winterbourn (2016). "Glutathionylation of the Active Site Cysteines of Peroxiredoxin 2 and Recycling by Glutaredoxin." J Biol Chem 291(6): 3053-3062.

PETER W. RIDDLES, R. L. B., AND BURT ZERNER (1978). "Ellman’s Reagent: 5,5’-Dithiobis(2-nitrobenzoic

Acid) -a Reexamination " ANALYTICAL BIOCHEMISTRY 94.

Phaniendra, A., D. B. Jestadi and L. Periyasamy (2015). "Free radicals: properties, sources, targets, and their implication in various diseases." Indian J Clin Biochem 30(1): 11-26.

Pick, E., T. Kroizman and A. Abo (1989). "Activation of the superoxide-forming NADPH oxidase of macrophages requires two cytosolic components--one of them is also present in certain nonphagocytic cells." J Immunol 143(12): 4180-4187.

Pieragostino, D., P. Del Boccio, M. Di Ioia, L. Pieroni, V. Greco, G. De Luca, S. D'Aguanno, C. Rossi, D. Franciotta, D. Centonze, P. Sacchetta, C. Di Ilio, A. Lugaresi and A. Urbani (2013). "Oxidative modifications of cerebral transthyretin are associated with multiple sclerosis." Proteomics 13(6): 1002-1009.

Poltorak, A., X. He, I. Smirnova, M. Y. Liu, C. Van Huffel, X. Du, D. Birdwell, E. Alejos, M. Silva, C. Galanos, M. Freudenberg, P. Ricciardi-Castagnoli, B. Layton and B. Beutler (1998). "Defective LPS signaling in C3H/HeJ and C57BL/10ScCr mice: mutations in Tlr4 gene." Science 282(5396): 2085-2088.

Poole, L. B. (2015). "The basics of thiols and cysteines in redox biology and chemistry." Free Radic Biol Med 80: 148-157.

257

Preeshagul, I., R. Gharbaran, K. H. Jeong, A. Abdel-Razek, L. Y. Lee, E. Elman and K. S. Suh (2013). "Potential biomarkers for predicting outcomes in CABG cardiothoracic surgeries." J Cardiothorac Surg 8: 176.

Qiao, S., Q. Luo, Y. Zhao, X. C. Zhang and Y. Huang (2014). "Structural basis for lipopolysaccharide insertion in the bacterial outer membrane." Nature 511(7507): 108-111.

Radi, R. (2013). "Protein tyrosine nitration: biochemical mechanisms and structural basis of functional effects." Acc Chem Res 46(2): 550-559.

Rahman, I. and W. MacNee (2000). "Oxidative stress and regulation of glutathione in lung inflammation." Eur Respir J 16(3): 534-554.

Rao, Z., S. Wang and J. Wang (2017). "Peroxiredoxin 4 inhibits IL-1beta-induced chondrocyte apoptosis via PI3K/AKT signaling." Biomed Pharmacother 90: 414-420.

Raschke, W. C., S. Baird, P. Ralph and I. Nakoinz (1978). "Functional macrophage cell lines transformed by Abelson leukemia virus." Cell 15(1): 261-267.

Rayman, M. P. (2000). "The importance of selenium to human health." Lancet 356(9225): 233-241.

Remer, K. A., M. Brcic and T. W. Jungi (2003). "Toll-like receptor-4 is involved in eliciting an LPS-induced oxidative burst in neutrophils." Immunol Lett 85(1): 75-80.

Reuter, S., S. C. Gupta, M. M. Chaturvedi and B. B. Aggarwal (2010). "Oxidative stress, inflammation, and cancer: how are they linked?" Free Radic Biol Med 49(11): 1603-1616.

Rhee, S. G. (2016). "Overview on Peroxiredoxin." Mol Cells 39(1): 1-5.

Rhee, S. G., S. W. Kang, T. S. Chang, W. Jeong and K. Kim (2001). "Peroxiredoxin, a novel family of peroxidases." IUBMB Life 52(1-2): 35-41.

Riddell, J. R., W. Bshara, M. T. Moser, J. A. Spernyak, B. A. Foster and S. O. Gollnick (2011). "Peroxiredoxin 1 Controls Prostate Cancer Growth through Toll-Like Receptor 4-Dependent Regulation of Tumor Vasculature." Cancer Research 71(5): 1637-1646.

Riddell, J. R., X. Y. Wang, H. Minderman and S. O. Gollnick (2010). "Peroxiredoxin 1 stimulates secretion of proinflammatory cytokines by binding to TLR4." J Immunol 184(2): 1022-1030.

Riederer, B. M. (2009). "Oxidation Proteomics: The Role of Thiol Modifications." Current Proteomics 6(1): 51-62.

Romo, M. R., D. Perez-Martinez and C. C. Ferrer (2016). "Innate immunity in vertebrates: an overview." Immunology 148(2): 125-139.

Ross, R. and L. Agius (1992). "The process of atherogenesis--cellular and molecular interaction: from experimental animal models to humans." Diabetologia 35 Suppl 2: S34-40.

258

Rossi, F. and M. Zatti (1964). "Biochemical Aspects of Phagocytosis in Polymorphonuclear Leucocytes . Nadh + Nadph Oxidation by Granules of Resting + Phagocytizing Cells." Experientia 20(1): 21-&.

Rotruck, J. T., A. L. Pope, H. E. Ganther, A. B. Swanson, D. G. Hafeman and W. G. Hoekstra (1973). "Selenium: biochemical role as a component of glutathione peroxidase." Science 179(4073): 588-590.

Rubartelli, A., A. Bajetto, G. Allavena, E. Wollman and R. Sitia (1992). "Secretion of thioredoxin by normal and neoplastic cells through a leaderless secretory pathway." J Biol Chem 267(34): 24161-24164.

Rudyk, O. and P. Eaton (2014). "Biochemical methods for monitoring protein thiol redox states in biological systems." Redox Biol 2: 803-813.

Rusinova, I., S. Forster, S. Yu, A. Kannan, M. Masse, H. Cumming, R. Chapman and P. J. Hertzog (2013). "Interferome v2.0: an updated database of annotated interferon-regulated genes." Nucleic Acids Res 41(Database issue): D1040-1046.

Ryan, B. J., A. Nissim and P. G. Winyard (2014). "Oxidative post-translational modifications and their involvement in the pathogenesis of autoimmune diseases." Redox Biology 2: 715-724.

Sadler, A. J. and B. R. Williams (2008). "Interferon-inducible antiviral effectors." Nat Rev Immunol 8(7): 559-568.

Sagara, M., J. Satoh, X. P. Zhu, K. Takahashi, M. Fukuzawa, G. Muto, Y. Muto and T. Toyota (1994). "Inhibition with N-acetylcysteine of enhanced production of tumor necrosis factor in streptozotocin-induced diabetic rats." Clin Immunol Immunopathol 71(3): 333-337.

Sahaf, B., A. Soderberg, G. Spyrou, A. M. Barral, K. Pekkari, A. Holmgren and A. Rosen (1997). "Thioredoxin expression and localization in human cell lines: detection of full-length and truncated species." Exp Cell Res 236(1): 181-192.

Saiki, R. K., D. H. Gelfand, S. Stoffel, S. J. Scharf, R. Higuchi, G. T. Horn, K. B. Mullis and H. A. Erlich (1988). "Primer-directed enzymatic amplification of DNA with a thermostable DNA polymerase." Science 239(4839): 487-491.

Saitoh, M., H. Nishitoh, M. Fujii, K. Takeda, K. Tobiume, Y. Sawada, M. Kawabata, K. Miyazono and H. Ichijo (1998). "Mammalian thioredoxin is a direct inhibitor of apoptosis signal-regulating kinase (ASK) 1." EMBO J 17(9): 2596-2606.

Salzano, S., P. Checconi, E. M. Hanschmann, C. H. Lillig, L. D. Bowler, P. Chan, D. Vaudry, M. Mengozzi, L. Coppo, S. Sacre, K. R. Atkuri, B. Sahaf, L. A. Herzenberg, L. A. Herzenberg, L. Mullen and P. Ghezzi (2014). "Linkage of inflammation and oxidative stress via release of glutathionylated peroxiredoxin-2, which acts as a danger signal." Proc Natl Acad Sci U S A 111(33): 12157-12162.

Samuni, Y., S. Goldstein, O. M. Dean and M. Berk (2013). "The chemistry and biological activities of N-acetylcysteine." Biochim Biophys Acta 1830(8): 4117-4129.

259

Sandalio, L. M., M. Rodriguez-Serrano, M. C. Romero-Puertas and L. A. del Rio (2013). "Role of peroxisomes as a source of reactive oxygen species (ROS) signaling molecules." Subcell Biochem 69: 231-255.

Sanjabi, S., L. A. Zenewicz, M. Kamanaka and R. A. Flavell (2009). "Anti-inflammatory and pro-inflammatory roles of TGF-beta, IL-10, and IL-22 in immunity and autoimmunity." Curr Opin Pharmacol 9(4): 447-453.

Satriano, J. and D. Schlondorff (1994). "Activation and attenuation of transcription factor NF-kB in mouse glomerular mesangial cells in response to tumor necrosis factor-alpha, immunoglobulin G, and adenosine 3':5'-cyclic monophosphate. Evidence for involvement of reactive oxygen species." J Clin Invest 94(4): 1629-1636.

Saunders, J. T., V. Nambi, J. A. de Lemos, L. E. Chambless, S. S. Virani, E. Boerwinkle, R. C. Hoogeveen, X. Liu, B. C. Astor, T. H. Mosley, A. R. Folsom, G. Heiss, J. Coresh and C. M. Ballantyne (2011). "Cardiac troponin T measured by a highly sensitive assay predicts coronary heart disease, heart failure, and mortality in the Atherosclerosis Risk in Communities Study." Circulation 123(13): 1367-1376.

Sbarra, A. J. and M. L. Karnovsky (1959). "The biochemical basis of phagocytosis. I. Metabolic changes during the ingestion of particles by polymorphonuclear leukocytes." J Biol Chem 234(6): 1355-1362.

Schena, M., D. Shalon, R. W. Davis and P. O. Brown (1995). "Quantitative monitoring of gene expression patterns with a complementary DNA microarray." Science 270(5235): 467-470.

Schmidt, K. N., P. Amstad, P. Cerutti and P. A. Baeuerle (1995). "The roles of hydrogen peroxide and superoxide as messengers in the activation of transcription factor NF-kappa B." Chem Biol 2(1): 13-22.

Schmitt, B., M. Vicenzi, C. Garrel and F. M. Denis (2015). "Effects of N-acetylcysteine, oral glutathione (GSH) and a novel sublingual form of GSH on oxidative stress markers: A comparative crossover study." Redox Biology 6: 198-205.

Schreck, R., P. Rieber and P. A. Baeuerle (1991). "Reactive oxygen intermediates as apparently widely used messengers in the activation of the NF-kappa B transcription factor and HIV-1." EMBO J 10(8): 2247-2258.

Sedlak, J. and R. H. Lindsay (1968). "Estimation of total, protein-bound, and nonprotein sulfhydryl groups in tissue with Ellman's reagent." Anal Biochem 25(1): 192-205.

Shabab, M., S. A. Khan, H. Vogel, D. G. Heckel and W. Boland (2014). "OPDA isomerase GST16 is involved in phytohormone detoxification and insect development." FEBS J 281(12): 2769-2783.

Shah, B. and L. Mayer (2010). "Current status of monoclonal antibody therapy for the treatment of inflammatory bowel disease." Expert Rev Clin Immunol 6(4): 607-620.

Shen, H., D. Kreisel and D. R. Goldstein (2013). "Processes of sterile inflammation." J Immunol 191(6): 2857-2863.

260

Shohrati, M., F. Dermanaki, F. Babaei and S. M. Alavian (2010). "Evaluation of the effects of oral N-acetylcysteine and a placebo in paraclinical and oxidative stress parameters of patients with chronic hepatitis B." Hepat Mon 10(2): 95-100.

Shrivastava, A. K., H. V. Singh, A. Raizada and S. K. Singh (2015). "C-reactive protein, inflammation and coronary heart disease." The Egyptian Heart Journal 67(2): 89-97.

Sies, H. (2014). "Role of metabolic H2O2 generation: redox signaling and oxidative stress." J Biol Chem 289(13): 8735-8741.

Sikorski, K., S. Chmielewski, L. Przybyl, U. Heemann, J. Wesoly, M. Baumann and H. A. Bluyssen (2011). "STAT1-mediated signal integration between IFNgamma and LPS leads to increased EC and SMC activation and monocyte adhesion." Am J Physiol Cell Physiol 300(6): C1337-1344.

Simon, A. R., U. Rai, B. L. Fanburg and B. H. Cochran (1998). "Activation of the JAK-STAT pathway by reactive oxygen species." Am J Physiol 275(6 Pt 1): C1640-1652.

Smith, A. D. and H. Dawson (2006). "Glutathione is required for efficient production of infectious picornavirus virions." Virology 353(2): 258-267.

Sobotta, M. C., W. Liou, S. Stocker, D. Talwar, M. Oehler, T. Ruppert, A. N. Scharf and T. P. Dick (2015). "Peroxiredoxin-2 and STAT3 form a redox relay for H2O2 signaling." Nat Chem Biol 11(1): 64-70.

Soriano, F. X., P. Baxter, L. M. Murray, M. B. Sporn, T. H. Gillingwater and G. E. Hardingham (2009). "Transcriptional regulation of the AP-1 and Nrf2 target gene sulfiredoxin." Mol Cells 27(3): 279-282.

Staal, F. J., M. Roederer, L. A. Herzenberg and L. A. Herzenberg (1990). "Intracellular thiols regulate activation of nuclear factor kappa B and transcription of human immunodeficiency virus." Proc Natl Acad Sci U S A 87(24): 9943-9947.

Steinhubl, S. R. (2008). "Why have antioxidants failed in clinical trials?" Am J Cardiol 101(10A): 14D-19D.

Stockert, J. C., A. Blazquez-Castro, M. Canete, R. W. Horobin and A. Villanueva (2012). "MTT assay for cell viability: Intracellular localization of the formazan product is in lipid droplets." Acta Histochem 114(8): 785-796.

Stone, J. R. and S. Yang (2006). "Hydrogen peroxide: a signaling messenger." Antioxid Redox Signal 8(3-4): 243-270.

Stottmeier, B. and T. P. Dick (2016). "Redox sensitivity of the MyD88 immune signaling adapter." Free Radic Biol Med 101: 93-101.

Strobel, N. A., R. G. Fassett, S. A. Marsh and J. S. Coombes (2011). "Oxidative stress biomarkers as predictors of cardiovascular disease." Int J Cardiol 147(2): 191-201.

Sturn, A., J. Quackenbush and Z. Trajanoski (2002). "Genesis: cluster analysis of microarray data." Bioinformatics 18(1): 207-208.

261

Sun, S., H. Zhang, B. Xue, Y. Wu, J. Wang, Z. Yin and L. Luo (2006). "Protective effect of glutathione against lipopolysaccharide-induced inflammation and mortality in rats." Inflamm Res 55(11): 504-510.

Sundaresan, M., Z. X. Yu, V. J. Ferrans, K. Irani and T. Finkel (1995). "Requirement for generation of H2O2 for platelet-derived growth factor signal transduction." Science 270(5234): 296-299.

Suzuki, Y. J., M. Carini and D. A. Butterfield (2010). "Protein carbonylation." Antioxid Redox Signal 12(3): 323-325.

Swietek, K. and J. Juszczyk (1997). "Reduced glutathione concentration in erythrocytes of patients with acute and chronic viral hepatitis." J Viral Hepat 4(2): 139-141.

Szabo-Taylor, K. E., P. Eggleton, C. A. Turner, M. L. Faro, J. M. Tarr, S. Toth, M. Whiteman, R. C. Haigh, J. A. Littlechild and P. G. Winyard (2012). "Lymphocytes from rheumatoid arthritis patients have elevated levels of intracellular peroxiredoxin 2, and a greater frequency of cells with exofacial peroxiredoxin 2, compared with healthy human lymphocytes." Int J Biochem Cell Biol 44(8): 1223-1231.

Szabo-Taylor, K. E., E. A. Toth, A. M. Balogh, B. W. Sodar, L. Kadar, K. Paloczi, N. Fekete, A. Nemeth, X. Osteikoetxea, K. V. Vukman, M. Holub, E. Pallinger, G. Nagy, P. G. Winyard and E. I. Buzas (2017). "Monocyte activation drives preservation of membrane thiols by promoting release of oxidised membrane moieties via extracellular vesicles." Free Radic Biol Med 108: 56-65.

Szkudlinska, M. A., A. D. von Frankenberg and K. M. Utzschneider (2016). "The antioxidant N-Acetylcysteine does not improve glucose tolerance or beta-cell function in type 2 diabetes." Journal of Diabetes and Its Complications 30(4): 618-622.

Takeuchi, O. and S. Akira (2010). "Pattern Recognition Receptors and Inflammation." Cell 140(6): 805-820.

Talasaz, A. H., H. Khalili, F. Fahimi, Y. Jenab, M. A. Broumand, M. Salarifar and F. Darabi (2014). "Effects of N-Acetylcysteine on the Cardiac Remodeling Biomarkers and Major Adverse Events Following Acute Myocardial Infarction: A Randomized Clinical Trial." American Journal of Cardiovascular Drugs 14(1): 51-61.

Tang, D., R. Kang, C. B. Coyne, H. J. Zeh and M. T. Lotze (2012). "PAMPs and DAMPs: signal 0s that spur autophagy and immunity." Immunol Rev 249(1): 158-175.

Tanudji, M., S. Hevi and S. L. Chuck (2003). "The nonclassic secretion of thioredoxin is not sensitive to redox state." Am J Physiol Cell Physiol 284(5): C1272-1279.

Tarca, A. L., R. Romero and S. Draghici (2006). "Analysis of microarray experiments of gene expression profiling." Am J Obstet Gynecol 195(2): 373-388.

Tarpey, M. M. and I. Fridovich (2001). "Methods of detection of vascular reactive species: nitric oxide, superoxide, hydrogen peroxide, and peroxynitrite." Circ Res 89(3): 224-236.

Thomas, P. and T. G. Smart (2005). "HEK293 cell line: a vehicle for the expression of recombinant proteins." J Pharmacol Toxicol Methods 51(3): 187-200.

262

Thorpe, C., K. L. Hoober, S. Raje, N. M. Glynn, J. Burnside, G. K. Turi and D. L. Coppock (2002). "Sulfhydryl oxidases: emerging catalysts of protein disulfide bond formation in eukaryotes." Arch Biochem Biophys 405(1): 1-12.

Tian, Y., W. Jiang, N. Gao, J. Zhang, W. Chen, D. Fan, D. Zhou and J. An (2010). "Inhibitory effects of glutathione on dengue virus production." Biochem Biophys Res Commun 397(3): 420-424.

Tien, A. C., A. Rajan, K. L. Schulze, H. D. Ryoo, M. Acar, H. Steller and H. J. Bellen (2008). "Ero1L, a thiol oxidase, is required for Notch signaling through cysteine bridge formation of the Lin12-Notch repeats in Drosophila melanogaster." Journal of Cell Biology 182(6): 1113-1125.

Tousoulis, D., E. Oikonomou, E. K. Economou, F. Crea and J. C. Kaski (2016). "Inflammatory cytokines in atherosclerosis: current therapeutic approaches." Eur Heart J 37(22): 1723-1732.

Towbin, H., T. Staehelin and J. Gordon (1979). "Electrophoretic transfer of proteins from polyacrylamide gels to nitrocellulose sheets: procedure and some applications." Proc Natl Acad Sci U S A 76(9): 4350-4354.

Turner, M. D., B. Nedjai, T. Hurst and D. J. Pennington (2014). "Cytokines and chemokines: At the crossroads of cell signalling and inflammatory disease." Biochim Biophys Acta 1843(11): 2563-2582.

Turpaev, K. T. (2013). "Keap1-Nrf2 signaling pathway: mechanisms of regulation and role in protection of cells against toxicity caused by xenobiotics and electrophiles." Biochemistry (Mosc) 78(2): 111-126.

Turvey, S. E. and D. H. Broide (2010). "Innate immunity." J Allergy Clin Immunol 125(2 Suppl 2): S24-32.

Valko, M., D. Leibfritz, J. Moncol, M. T. Cronin, M. Mazur and J. Telser (2007). "Free radicals and antioxidants in normal physiological functions and human disease." Int J Biochem Cell Biol 39(1): 44-84.

Varlamova, E. G., M. V. Gol'tiaev, S. V. Novoselov, V. I. Novoselov and E. E. Fecenko (2013). "[Characterization of some thiol oxidoreductase family members]." Mol Biol (Mosk) 47(4): 568-582.

Vazirinejad, R., Z. Ahmadi, M. Kazemi Arababadi, G. Hassanshahi and D. Kennedy (2014). "The biological functions, structure and sources of CXCL10 and its outstanding part in the pathophysiology of multiple sclerosis." Neuroimmunomodulation 21(6): 322-330.

Venereau, E., M. Casalgrandi, M. Schiraldi, D. J. Antoine, A. Cattaneo, F. De Marchis, J. Liu, A. Antonelli, A. Preti, L. Raeli, S. S. Shams, H. Yang, L. Varani, U. Andersson, K. J. Tracey, A. Bachi, M. Uguccioni and M. E. Bianchi (2012). "Mutually exclusive redox forms of HMGB1 promote cell recruitment or proinflammatory cytokine release." J Exp Med 209(9): 1519-1528.

Venereau, E., C. Ceriotti and M. E. Bianchi (2015). "DAMPs from Cell Death to New Life." Front Immunol 6: 422.

263

Voigt, D., U. Scheidt, T. Derfuss, W. Bruck and A. Junker (2017). "Expression of the Antioxidative Enzyme Peroxiredoxin 2 in Multiple Sclerosis Lesions in Relation to Inflammation." Int J Mol Sci 18(4).

Vossen, R. C., M. C. Persoons, M. E. Slobbe-van Drunen, C. A. Bruggeman and M. C. van Dam-Mieras (1997). "Intracellular thiol redox status affects rat cytomegalovirus infection of vascular cells." Virus Res 48(2): 173-183.

Wahlgren, C. M. and K. Pekkari (2005). "Elevated thioredoxin after angioplasty in peripheral arterial disease." Eur J Vasc Endovasc Surg 29(3): 281-286.

Wajant, H., K. Pfizenmaier and P. Scheurich (0000). "Tumor necrosis factor signaling." Cell Death Differ 10(1): 45-65.

Walter, S., M. Letiembre, Y. Liu, H. Heine, B. Penke, W. Hao, B. Bode, N. Manietta, J. Walter, W. Schulz-Schuffer and K. Fassbender (2007). "Role of the toll-like receptor 4 in neuroinflammation in Alzheimer's disease." Cell Physiol Biochem 20(6): 947-956.

Wanders, R. J. and H. R. Waterham (2006). "Biochemistry of mammalian peroxisomes revisited." Annu Rev Biochem 75: 295-332.

Wang, G. K., J. Q. Zhu, J. T. Zhang, Q. Li, Y. Li, J. He, Y. W. Qin and Q. Jing (2010). "Circulating microRNA: a novel potential biomarker for early diagnosis of acute myocardial infarction in humans." Eur Heart J 31(6): 659-666.

Wang, Y., X. Huang, H. Cang, F. Gao, T. Yamamoto, T. Osaki and J. Yi (2007). "The endogenous reactive oxygen species promote NF-kappaB activation by targeting on activation of NF-kappaB-inducing kinase in oral squamous carcinoma cells." Free Radic Res 41(9): 963-971.

Wani, R., A. Nagata and B. W. Murray (2014). "Protein redox chemistry: post-translational cysteine modifications that regulate signal transduction and drug pharmacology." Front Pharmacol 5: 224.

Waters, K. M., J. G. Pounds and B. D. Thrall (2006). "Data merging for integrated microarray and proteomic analysis." Brief Funct Genomic Proteomic 5(4): 261-272.

Watowich, S. S., D. J. Hilton and H. F. Lodish (1994). "Activation and inhibition of erythropoietin receptor function: role of receptor dimerization." Mol Cell Biol 14(6): 3535-3549.

Weichsel, A., J. R. Gasdaska, G. Powis and W. R. Montfort (1996). "Crystal structures of reduced, oxidized, and mutated human thioredoxins: evidence for a regulatory homodimer." Structure 4(6): 735-751.

Weiss, G. and U. E. Schaible (2015). "Macrophage defense mechanisms against intracellular bacteria." Immunol Rev 264(1): 182-203.

Weiss, S. J., R. Klein, A. Slivka and M. Wei (1982). "Chlorination of taurine by human neutrophils. Evidence for hypochlorous acid generation." J Clin Invest 70(3): 598-607.

Weiss, U. (2008). "Inflammation." Nature 454(7203): 427.

264

Wilkinson, B. and H. F. Gilbert (2004). "Protein disulfide isomerase." Biochim Biophys Acta 1699(1-2): 35-44.

Williams, L. T. and E. G. Janzen (1970). "Spin Trapping of Alkyl and Aryl Radicals Produced in Reactions of Organometallic Compiunds - Orgn." Abstracts of Papers of the American Chemical Society(Feb): 20-&.

Wink, L. K., R. Adams, Z. M. Wang, J. E. Klaunig, M. H. Plawecki, D. J. Posey, C. J. McDougle and C. A. Erickson (2016). "A randomized placebo-controlled pilot study of N-acetylcysteine in youth with autism spectrum disorder." Molecular Autism 7.

Winterbourn, C. C. and M. B. Hampton (2008). "Thiol chemistry and specificity in redox signaling." Free Radic Biol Med 45(5): 549-561.

Witschi, A., S. Reddy, B. Stofer and B. H. Lauterburg (1992). "The Systemic Availability of Oral Glutathione." European Journal of Clinical Pharmacology 43(6): 667-669.

Wollman, E. E., A. Kahan and D. Fradelizi (1997). "Detection of membrane associated thioredoxin on human cell lines." Biochem Biophys Res Commun 230(3): 602-606.

Wood, Z. A., E. Schroder, J. Robin Harris and L. B. Poole (2003). "Structure, mechanism and regulation of peroxiredoxins." Trends Biochem Sci 28(1): 32-40.

World Health Organization. (n.d., May 2017). "Cardiovascular diseases (CVDs)." Retrieved 17 June, 2017, from http://www.who.int/mediacentre/factsheets/fs317/en/.

Wu, C., M. R. Jain, Q. Li, S. Oka, W. Li, A. N. Kong, N. Nagarajan, J. Sadoshima, W. J. Simmons and H. Li (2014). "Identification of novel nuclear targets of human thioredoxin 1." Mol Cell Proteomics 13(12): 3507-3518.

Wu, C., A. M. Parrott, C. Fu, T. Liu, S. M. Marino, V. N. Gladyshev, M. R. Jain, A. T. Baykal, Q. Li, S. Oka, J. Sadoshima, A. Beuve, W. J. Simmons and H. Li (2011). "Thioredoxin 1-mediated post-translational modifications: reduction, transnitrosylation, denitrosylation, and related proteomics methodologies." Antioxid Redox Signal 15(9): 2565-2604.

Wu, H. H., J. A. Thomas and J. Momand (2000). "p53 protein oxidation in cultured cells in response to pyrrolidine dithiocarbamate: a novel method for relating the amount of p53 oxidation in vivo to the regulation of p53-responsive genes." Biochem J 351(Pt 1): 87-93.

Wynn, T. A. (2008). "Cellular and molecular mechanisms of fibrosis." J Pathol 214(2): 199-210.

Xie, Y., S. Kole, P. Precht, M. J. Pazin and M. Bernier (2009). "S-glutathionylation impairs signal transducer and activator of transcription 3 activation and signaling." Endocrinology 150(3): 1122-1131.

Yamamoto, M. and K. Takeda (2010). "Current views of toll-like receptor signaling pathways." Gastroenterol Res Pract 2010: 240365.

Yang, H., H. S. Hreggvidsdottir, K. Palmblad, H. Wang, M. Ochani, J. Li, B. Lu, S. Chavan, M. Rosas-Ballina, Y. Al-Abed, S. Akira, A. Bierhaus, H. Erlandsson-Harris, U. Andersson and K. J. Tracey (2010). "A critical cysteine is required for HMGB1 binding to Toll-like receptor 4

265

and activation of macrophage cytokine release." Proc Natl Acad Sci U S A 107(26): 11942-11947.

Yang, H., P. Lundback, L. Ottosson, H. Erlandsson-Harris, E. Venereau, M. E. Bianchi, Y. Al-Abed, U. Andersson, K. J. Tracey and D. J. Antoine (2012). "Redox modification of cysteine residues regulates the cytokine activity of high mobility group box-1 (HMGB1)." Mol Med 18: 250-259.

Yu, M., H. Wang, A. Ding, D. T. Golenbock, E. Latz, C. J. Czura, M. J. Fenton, K. J. Tracey and H. Yang (2006). "HMGB1 signals through toll-like receptor (TLR) 4 and TLR2." Shock 26(2): 174-179.

Yun, H. M., K. R. Park, E. C. Kim and J. T. Hong (2015). "PRDX6 controls multiple sclerosis by suppressing inflammation and blood brain barrier disruption." Oncotarget 6(25): 20875-20884.

Zhang, C., Y. Liu, C. Feng, Q. Wang, H. Shi, D. Zhao, R. Yu and Z. Su (2015). "Loss of PEG chain in routine SDS-PAGE analysis of PEG-maleimide modified protein." Electrophoresis 36(2): 371-374.

Zhang, W., W. Ji, L. Yang, L. Yao, G. Wang, A. Xuan and Z. Zhuang (2013). "The involvement of epigenetic silencing of Foxa2 in cellular replicative and premature senescence induced by hydrogen peroxide." Free Radic Res 47(4): 325-332.

Zhao, H., J. Joseph, H. Zhang, H. Karoui and B. Kalyanaraman (2001). "Synthesis and biochemical applications of a solid cyclic nitrone spin trap: a relatively superior trap for detecting superoxide anions and glutathiyl radicals." Free Radic Biol Med 31(5): 599-606.

266

Appendix

Appendix 1: Transcripts induced by LPS at 2h. Transcripts were selected for their

differential expression between the two groups LPS vs Control (cut-off was: fold

change, 1.5; P<0.05). Only the top 50 transcripts most affected by LPS (sorted by fold

change) are shown.

Appendix 2: Transcripts down-regulated by LPS at 2h. Transcripts were selected

for their differential expression between the two groups LPS vs Control (cut-off was:

fold change, 1.5; P<0.05). Only the top 50 transcripts most affected by LPS (sorted

by fold change) are shown.

Appendix 3: Transcripts induced by LPS at 6h. Transcripts were selected for their

differential expression between the two groups LPS vs Control (cut-off was: fold

change, 1.5; P<0.05). Only the top 50 transcripts most affected by LPS (sorted by fold

change) are shown.

Appendix 4: Transcripts down-regulated by LPS at 6h. Transcripts were selected

for their differential expression between the two groups LPS vs Control (cut-off was:

fold change, 1.5; P<0.05). Only the top 50 transcripts most affected by LPS (sorted

by fold change) are shown.

Appendix 5: Expression images of cluster 1, 2, 3 and 4 at 2h. The median of the

expression for a cluster is in pink. The level of expression is indicated by the ratio of

each condition versus the average of the control (+4;-4).

Appendix 6: Expression images of cluster 1, 2, 3 and 4 at 6h. The median of the

expression for a cluster is in pink. The level of expression is indicated by the ratio of

each condition versus the average of the control (+4;-4).

Appendix 7: List of genes in Group 1 at 2h. Transcripts were selected for their

differential expression between the two groups LPS vs Control (cut-off was: fold

change, 1.5; P<0.05) and the two groups BSO+LPS vs LPS alone (cut-off was: fold

change, 1.5; P<0.05).

267

Appendix 8: List of genes in Group 2 at 2h. Transcripts were selected for their

differential expression between the two groups LPS vs Control (cut-off was: fold

change, 1.5; P<0.05) and the two groups BSO+LPS vs LPS alone (cut-off was: fold

change, 1.5; P<0.05).

Appendix 9: List of genes in Group 3 at 2h. Transcripts were selected for their

differential expression between the two groups LPS vs Control (cut-off was: fold

change, 1.5; P<0.05) and the two groups BSO+LPS vs LPS alone (cut-off was: fold

change, 1.5; P<0.05).

Appendix 10: List of genes in Group 4 at 2h. Transcripts were selected for their

differential expression between the two groups LPS vs Control (cut-off was: fold

change, 1.5; P<0.05) and the two groups BSO+LPS vs LPS alone (cut-off was: fold

change, 1.5; P<0.05).

Appendix 11: List of genes in Group 1 at 6h. Transcripts were selected for their

differential expression between the two groups LPS vs Control (cut-off was: fold

change, 1.5; P<0.05) and the two groups BSO+LPS vs LPS alone (cut-off was: fold

change, 1.5; P<0.05).

Appendix 12: List of genes in Group 2 at 6h. Transcripts were selected for their

differential expression between the two groups LPS vs Control (cut-off was: fold

change, 1.5; P<0.05) and the two groups BSO+LPS vs LPS alone (cut-off was: fold

change, 1.5; P<0.05).

Appendix 13: List of genes in Group 3 at 6h. Transcripts were selected for their

differential expression between the two groups LPS vs Control (cut-off was: fold

change, 1.5; P<0.05) and the two groups BSO+LPS vs LPS alone (cut-off was: fold

change, 1.5; P<0.05).

Appendix 14: List of genes in Group 4 at 6h. Transcripts were selected for their

differential expression between the two groups LPS vs Control (cut-off was: fold

change, 1.5; P<0.05) and the two groups BSO+LPS vs LPS alone (cut-off was: fold

change, 1.5; P<0.05).

Appendix 15: Functional categories of Group 2. Functional categories were

obtained by DAVID using the Functional Annotation Chart tool with GO TERM BP and

268

KEGG pathway for each group independently of the time point and were ordered by

EASE score a modified Fisher’s Test (P value <0.5).

Appendix 16: List of the 80 first proteins out of 1871 from which most peptides

have been identified by MS in untreated cells. Proteins were previously selected

with a FDR<1 (=-10logP) and were ordered by their number of peptides identified by

MS.

Appendix 17: List of the 80 first proteins out of 2427 from which most peptides

have been identified by MS in LPS-treated cells. Proteins were previously selected

with a FDR<1 (=-10logP) and were ordered by their number of peptides identified by

MS.

269

Appendix 1

270

Appendix 2

271

Appendix 3

272

Appendix 4

273

Appendix 5

274

Appendix 5

275

Appendix 6

276

Appendix 6

277

Appendix 7

278

Appendix 8

279

Appendix 9

280

Appendix 10

281

Appendix 11

282

Appendix 12

283

Appendix 13

284

285

Appendix 14

286

Appendix 15

287

Appendix 16

288

Appendix 16

289

Appendix 17

290

Appendix 17

291

Appendix 17


Recommended