114
2 Arja Laitinen RESEARCH Reduced Visual Function and Its Association with Physical Functioning in the Finnish Adult Population Prevalence, Causes, and Need for Eye Care Services

2
Arja Laitinen
RESE
ARCH
Reduced Visual Function and Its Association with Physical Functioning in the Finnish Adult PopulationPrevalence, Causes, and Need for Eye Care Services


Arja Laitinen
reduced visual function and its association with physical functioning
in the finnish adult population
p r e va l e n c e , c a u s e s , a n d n e e d f o r e y e c a r e s e r v i c e s
a c a d e m i c d i s s e r t a t i o n
To be presented with the permission of the Faculty of Medicine of the University of Helsinki for public examination in the large auditorium of Haartman
Institute, Haartmaninkatu 3, Helsinki on March 13th, 2009 at 12 noon.
National Institute for Health and Welfare, Helsinki, Finland
and
Department of Ophthalmology, University of Helsinki, Finland
Helsinki 2009

© author and national institute for health and welfare
layout: riitta nieminencover photo: tapio laitinenisBn 978-952-245-014-2 (print) issn 1798-0054 (print)isBn 978-952-245-015-9 (pdf)issn 1798-0062 (pdf)
yliopistopaino helsinki 2009finland

s u p e r v i s e d b y
professor emerita leila laatikainen, md, phd department of ophthalmology
university of helsinki helsinki, finland
professor arpo aromaa, md, phddepartment of health and functional capacity
national public health institution(current national institute of health and welfare)
helsinki, finland
r e v i e w e d b y
docent pertti era, phdfaculty of medicine, university of tampere
tampere, finlandfaculty of sport and health sciences, university of Jyväskylä
Jyväskylä, finland
professor per söderberg, md, phddepartment of neuroscience, ophthalmology
university of uppsalauppsala, sweden
o p p o n e n t
docent olavi pärssinen, md, phddepartment of ophthalmology
university of turkuturku, finland

To my grandmothers Sylvi and Lyydia

arja laitinen, reduced visual function and its association with physical functioning in the finnish adult population. prevalence, causes, and need for eye care services. national institute for health and welfare, research 2, 112 pages isBn 978-952-245-014-2 (print) issn 1798-0054 (print)isBn 978-952-245-015-9 (pdf)issn 1798-0062 (pdf) http://www.thl.fi
AbstrActthe purpose of this study was to estimate the prevalence and distribution of reduced visual acuity, major chronic eye diseases, and subsequent need for eye care services in the finnish adult population comprising persons aged 30 years and older. in addition, we analyzed the effect of decreased vision on functioning and need for assistance using the world health Organization’s (WHO) International Classification of Functioning, Disability, and Health (icf) as a framework.
the study was based on the health 2000 health examination survey, a nationally representative population-based comprehensive survey of health and functional capacity carried out in 2000 to 2001 in finland. the study sample representing the Finnish population aged 30 years and older was drawn by a two-stage stratified cluster sampling. the health 2000 survey included a home interview and a comprehensive health examination conducted at a nearby screening center. if the invited participants did not attend, an abridged examination was conducted at home or in an institution.
Based on our finding in participants, the great majority (96%) of Finnish adults had at least moderate visual acuity (VA ≥ 0.5) with current refraction correction, if any. However, in the age group 75–84 years the prevalence decreased to 81%, and after 85 years to 46%. in the population aged 30 years and older, the prevalence of habitual visual impairment (va ≤ 0.25) was 1.6%, and 0.5% were blind (VA < 0.1). The prevalence of visual impairment increased significantly with age (p < 0.001), and after the age of 65 years the increase was sharp. Visual impairment was as common in women as in men (OR 1.20, 95% CI 0.82–1.74).
Based on self-reported and/or register-based data, the estimated total prevalences of cataract, glaucoma, age-related maculopathy (arm), and diabetic retinopathy (dr) in the study population were 10%, 5%, 4%, and 1%, respectively. The prevalence of all of these chronic eye diseases increased with age (p < 0.001). Cataract and glaucoma were more common in women than in men (OR 1.55, 95% CI 1.26–1.91 and OR 1.57, 95% CI 1.24–1.98, respectively). the most prevalent eye diseases in people with visual impairment (va
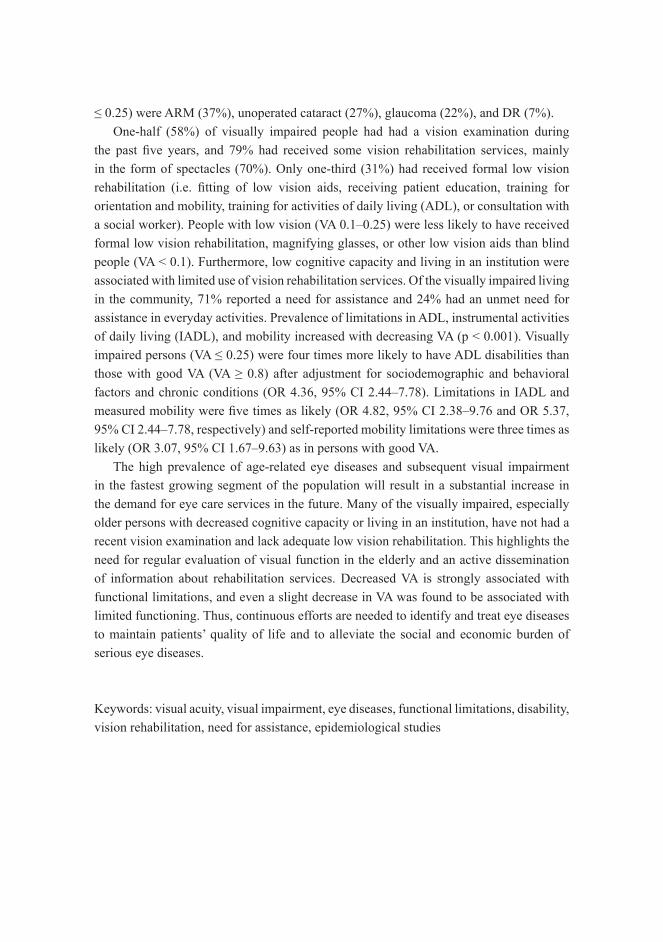
≤ 0.25) were ARM (37%), unoperated cataract (27%), glaucoma (22%), and DR (7%). One-half (58%) of visually impaired people had had a vision examination during
the past five years, and 79% had received some vision rehabilitation services, mainly in the form of spectacles (70%). Only one-third (31%) had received formal low vision rehabilitation (i.e. fitting of low vision aids, receiving patient education, training for orientation and mobility, training for activities of daily living (adl), or consultation with a social worker). people with low vision (va 0.1–0.25) were less likely to have received formal low vision rehabilitation, magnifying glasses, or other low vision aids than blind people (VA < 0.1). Furthermore, low cognitive capacity and living in an institution were associated with limited use of vision rehabilitation services. of the visually impaired living in the community, 71% reported a need for assistance and 24% had an unmet need for assistance in everyday activities. prevalence of limitations in adl, instrumental activities of daily living (IADL), and mobility increased with decreasing VA (p < 0.001). Visually impaired persons (VA ≤ 0.25) were four times more likely to have ADL disabilities than those with good VA (VA ≥ 0.8) after adjustment for sociodemographic and behavioral factors and chronic conditions (OR 4.36, 95% CI 2.44–7.78). Limitations in IADL and measured mobility were five times as likely (OR 4.82, 95% CI 2.38–9.76 and OR 5.37, 95% CI 2.44–7.78, respectively) and self-reported mobility limitations were three times as likely (OR 3.07, 95% CI 1.67–9.63) as in persons with good VA.
the high prevalence of age-related eye diseases and subsequent visual impairment in the fastest growing segment of the population will result in a substantial increase in the demand for eye care services in the future. many of the visually impaired, especially older persons with decreased cognitive capacity or living in an institution, have not had a recent vision examination and lack adequate low vision rehabilitation. this highlights the need for regular evaluation of visual function in the elderly and an active dissemination of information about rehabilitation services. decreased va is strongly associated with functional limitations, and even a slight decrease in va was found to be associated with limited functioning. thus, continuous efforts are needed to identify and treat eye diseases to maintain patients’ quality of life and to alleviate the social and economic burden of serious eye diseases.
Keywords: visual acuity, visual impairment, eye diseases, functional limitations, disability, vision rehabilitation, need for assistance, epidemiological studies
contents
Abstract ......................................................................................................................... 6Abbreviations ................................................................................................................. 10List of original publications ...........................................................................................11
1 Introduction ............................................................................................................ 12
2 Review of the literature ......................................................................................... 152.1 Visual function ............................................................................................. 15
2.1.1 population studies ............................................................................ 152.1.2 visual acuity .................................................................................... 172.1.3 visual impairment ............................................................................ 172.1.4 habitual visual acuity ....................................................................... 212.1.5 visual acuity for near vision ............................................................ 232.1.6 self-reported visual function ............................................................ 23
2.2 Causes of decreased visual acuity ............................................................... 242.2.1 age-related maculopathy ................................................................. 242.2.2 glaucoma ......................................................................................... 262.2.3 diabetic retinopathy ......................................................................... 272.2.4 age-related cataract ......................................................................... 282.2.5 refraction ......................................................................................... 30
2.3 Effect of visual decline on daily life ............................................................ 312.3.1 disability .......................................................................................... 312.3.2 predisposing factors for disability .................................................... 332.3.3 visual function and disability ........................................................... 34
2.4 Need for assistance ....................................................................................... 422.5 Use of eye care services ................................................................................ 43
2.5.1 eye examinations ............................................................................. 432.5.2 low vision rehabilitation ................................................................. 45
3 Aims of the study .................................................................................................... 47
4 Materials and methods .......................................................................................... 484.1 Study population .......................................................................................... 484.2 Visual function ............................................................................................. 50
4.2.1 visual acuity (i–iv) .......................................................................... 504.2.2 self-reported visual function (i, iii) ................................................. 50
4.3 Major eye diseases ...................................................................................... 514.3.1 self-reported eye diseases (ii) .......................................................... 514.3.2 ophthalmic data from registers and case records (ii) ...................... 51
4.4 Physical functioning and need for assistance ............................................ 514.4.1 functioning measurements (iii) ....................................................... 514.4.2 need for assistance (iv) ................................................................... 52

4.5 Use of eye care services (IV) ........................................................................ 524.6 Covariates (III, IV) ...................................................................................... 534.7 Statistical methods ....................................................................................... 54
5 Results ..................................................................................................................... 575.1 Visual acuity ................................................................................................. 57
5.1.1 visual acuity for distance vision ...................................................... 575.1.2 visual acuity for near vision ............................................................ 58
5.2 Self-reported visual function and correlation with measured visual acuity .................................................................................................. 59
5.3 Major eye diseases ....................................................................................... 615.3.1 estimated population prevalence of major eye diseases .................. 61
5.4 Causes of decreased visual acuity ............................................................... 655.5 Agreement between self-reported and documented major chronic
eye diseases ................................................................................................... 655.6 Visual disability ............................................................................................ 66
5.6.1 prevalence of functional limitations by visual acuity ...................... 665.6.2 association of vision with functional limitations ............................ 675.6.3 effect of visual acuity level on functional tasks .............................. 68
5.7 Use of eye health care and social services ................................................ 695.7.1 use of eye health care services ........................................................ 695.7.2 use of eye health care and rehabilitation services by visually
impaired persons .............................................................................. 725.7.3 need for assistance of visually impaired persons ............................ 73
6 Discussion ................................................................................................................ 766.1 Mainfindings ................................................................................................ 76
6.1.1 visual function ................................................................................. 766.1.2 major chronic eye diseases .............................................................. 796.1.3 visual function and disability ........................................................... 816.1.4 visual function and use of health and social services ...................... 83
6.2 Methodological considerations ................................................................... 85
7 Summary and conclusions ..................................................................................... 88
8 Acknowledgments .................................................................................................. 90
9 References ............................................................................................................... 92

10
AbbreviAtions
adl activities of daily livingamd age-related macular degenerationami acute myocardial infarctionarm age-related maculopathyBmi Body mass indexcc cortical cataractCI Confidence intervalcopd chronic obstructive pulmonary diseased diopterdB decibeldm diabetes mellitusdr diabetic retinopathyghQ general health Questionnaireiadl instrumental activities of daily livingICD International Classification of DiseasesICF International Classification of Functioning, Disability, and HealthICIDH International Classification of Impairments, Disabilities, and handicapsiddm insulin-dependent diabetes mellitusiop intraocular pressureLOCS Lens Opacities Classification Systemmi multiple imputationmmse mini-mental state examinationniddm non-insulin-dependent diabetes mellitusno nuclear opalescenceoag open-angle glaucomaor odds ratiopdt photodynamic therapypsc posterior subcapsular cataractrB rosow-Breslauttt transpupillary thermotherapyva visual acuityvegf vascular endothelial growth factorvi visual impairmentwarmgs wisconsin age-related maculopathy grading schemewho world health organization

11
List of originAL pubLicAtions
this thesis is based on the following original articles referred to in the text by their roman numerals:
I laitinen a, Koskinen s, härkänen t, reunanen a, laatikainen l, aromaa a. a nationwide population-based survey on visual acuity, near vision and self-reported visual function in the adult population in finland. ophthalmology 2005; 112: 2227–2237
II laitinen a, laatikainen l, härkänen t, Koskinen s, reunanen a, aromaa a. prevalence of major eye diseases and causes of visual impairment in the adult finnish population: a nationwide population-based survey. acta opthtalmol scand. accepted for publication.
III laitinen a, sainio p, Koskinen s, rudanko s-l, laatikainen l, aromaa a. the association between visual acuity and functional limitations: findings from a nationally representative population survey. ophthalmic epidemiology 2007; 14: 333–342
IV laitinen a, Koskinen s, rudanko s-l, martelin t, laatikainen l, aromaa a. use of eye care services and need for assistance in the visually impaired. optometry and vision science 2008; 85: 341–349
These articles are reproduced with the kind permission of their copyright holders.In addition, some unpublished data are included.

12
1 introduction
demands for vision have increased due to technological evolution at working places and in daily life. a decline in visual function may seriously compromise a person’s ability to perform daily tasks and manage everyday living. moreover, with increasing life expectancy, the number of people with age-related eye diseases and subsequent visual impairment has been predicted to increase significantly in the near future (STAKES Reports 2007). Despite the increasing significance of visual function, information about visual acuity (va) and the prevalence of visual impairment and blindness in the general population is scarce. According to the Finnish Register of Visual Impairment, 0.3% of Finnish people have visual impairment (VA < 0.3), ranging from 0.07% in persons younger than 18 years to 4.8% in persons aged 85 years and older (STAKES Reports 2007). However, coverage of the register may be inadequate due to underreporting of visual impairment. this is in accordance with the findings of Häkkinen (1984) and Hirvelä and Laatikainen (1995), who have reported a prevalence of 20–27% for visual impairment in persons aged 80 years and older in the city of turku and in the county of oulu, finland.
according to studies in europe, north america, and australia, of visual impairment in the middle-aged and elderly, 33–64% is caused by age-related maculopathy (ARM), 18–29% by cataract, 3–4% by glaucoma, and 1–4% by diabetic retinopathy (DR) (attebo et al. 1996, Klaver et al. 1998, wang et al. 2000, Buch et al. 2001a, Buch et al. 2001b). in finland, no earlier nationally representative population studies concerning the prevalence of these major eye diseases exist. Based on information from the finnish register of Visual Impairment, the prevalence of ARM (45%) among persons with permanent visual impairment is consistent with findings in other industrialized countries (STAKES Reports 2007). The prevalences of glaucoma (7%) and DR (7%), by contrast, are higher among finnish adults with visual impairment than in persons from other industrialized countries (attebo et al. 1996, Klaver et al. 1998, wang et al. 2000, Buch et al. 2001a, Buch et al. 2001b, staKes reports 2007). although the finnish register of visual impairment is statutory, coverage of registered persons with visual impairment is thought to be low, especially among the elderly. in addition, the register lacks information on cataract as a cause of visual impairment because with modern surgery permanent deterioration of vision can usually be prevented. however, hirvelä and laatikainen reported in 1995 that 11% of visual impairment in the elderly in Northern Finland was due to cataract.
Vision has a significant effect on functioning and it plays an important role in the development of disability. self-reported visual impairment has been found to be one of the strongest predictors of moderate and severe limitations in activities of daily living (adl) in the elderly (dunlop et al. 2002). along with disability, reduced visual function has a
13
great impact on society as well as on a person’s quality of life and sense of independence by increasing the need for health and social services and institutionalization (Branch and Jette 1982, foley et al. 1992, norburn et al. 1995, torres et al. 1995, aguero-torres et al. 2001). How VA influences the performance of different activities is not well understood.
To plan adequate measures for alleviating the influence of visual impairment on general disability, more detailed information is required to clarify which functions are particularly prone to the effects of worsening va. more information is also needed about the effect of visual function on disability, independent of other coexisting conditions. chronic diseases, cognitive and hearing impairment, depressive symptoms, decreased social contacts and physical activity, and some sociodemographic factors have been found to increase the risk of disability and potentially modify the influence of visual function (carabellese et al. 1993, guralnik et al. 1993, Boult et al. 1994, seeman et al. 1994, goldman et al. 1995, moritz et al. 1995, seeman et al. 1995, gallo et al. 1997, penninx et al. 1998). however, the results of studies on the independent effect of measured visual impairment on disability have been inconsistent (häkkinen 1984, carabellese et al. 1993, ensrud et al. 1994, salive et al. 1994, west et al. 1997, reuben et al. 1999, rubin et al. 2000, rubin et al. 2001, west et al. 2002b).
timely provision of vision examinations and treatment of eye diseases are essential to prevent or postpone visual impairment, but little is known about the factors affecting the use of eye health care. low socioeconomic status is associated with high morbidity and disability (marmot et al. 1997, valkonen et al. 1997). this may be due to a higher prevalence of chronic diseases associated with unfavorable socioeconomic factors and/or inadequate treatment and rehabilitation of persons with low socioeconomic status. education is thought to increase knowledge about diseases and their prevention, giving better opportunities to utilize the health care system (livingston et al. 1998, hoevenaars et al. 2006). people with higher income may have easier access to health care. low socioeconomic status has also been reported to be connected to visual impairment (tielsch et al. 1991a, Klein et al. 1994b). to reduce health disparities associated with decreased visual function, we need information on factors affecting the use of eye health care, vision rehabilitation, and the appropriate supply of assistance for visually impaired people. this information will allow us to identify those population subgroups who would benefit most from special intervention programs. a substantial proportion of people are unaware of their eye diseases and attend eye examinations too rarely (wang et al. 1994, Bylsma et al. 2004). in the case of irremediable visual impairment, low vision aids and rehabilitation have proven effective regardless of the cause of the visual impairment (nilsson 1986, nilsson and nilsson 1986, nilsson 1988). low vision aids and rehabilitation seem to improve both functional ability and the quality of life (scott et al. 1999, hinds et al. 2003).

14
the aim of this study was to determine the prevalence and distribution of reduced va, major chronic eye diseases, and subsequent need for eye care services in the finnish population using data collected in a large nationally representative population-based study of people aged 30 years and older (the health 2000 survey). Based on this data, it was also possible to explore the associations between decreased vision and functioning and need for assistance by analyzing which specific tasks are limited at various levels of va. as a framework, we used the world health organization’s (who) international Classification of Functioning, Disability, and Health (ICF) to shed light on the complexity of the processes leading to disability (who 2001).

15
2 review of the LiterAture
2.1 visual functionvisual function refers to a person’s ability to perceive the surrounding world by sensing the presence of light and the form, size, shape, and color of visual stimuli (who 2001). various ophthalmic and neurological disturbances may affect this ability and compromise a person’s capability to perform usual daily tasks and manage everyday living. visual function is most commonly assessed with the objective measurements of VA, visual field, stereopsis, contrast sensitivity, dark adaptation, and glare. self-reported visual function is also thought to give some additional information on the quality of visual function.
2.1.1 population studies
over the past three decades, several large population-based studies have been conducted to assess the distribution of visual function and the prevalence of deteriorated vision and associated eye diseases. due to the requirements of large-scale population-based studies, they have been forced to focus mainly on measuring va or assessing self-reported visual functions.
the framingham eye study was conducted in 1973–1975 (Kahn et al. 1977, leibowitz et al. 1980). the population sample consisted of all survivors of the framingham heart study cohort originally recruited in 1948 and representing the people of the town of framingham, usa. a comprehensive ophthalmologic examination was conducted on 2 631 persons aged 52–85 years (66% of those eligible). VA was initially assessed with current spectacles, but with deficit (VA < 1.0) a pinhole and subsequent manifest refraction were performed. however, selection by survivorship may cause some bias in the representativeness of the study population.
three subsequent important studies in the united states are the Baltimore eye survey (1985–1988), the Beaver dam eye study (1988–1990), and the salisbury eye evaluation study (1993–1995). the Baltimore eye survey comprised noninstitutionalized people aged 40 years and older residing in the east Baltimore area (tielsch et al. 1990). a screening examination, including va measurement with current correction, was performed on 5 341 persons (79% of those eligible). If VA < 1.0, it was assessed also with pinhole and/or subsequent full refraction correction. the Beaver dam eye study consisted of 5 700 eligible individuals aged 40–86 years living in the city and township of Beaver dam (Klein et al. 1991b, Linton et al. 1991). Of these, 86% participated in the examination, which
16
included va measurement with best refraction correction. the salisbury eye evaluation study comprised noninstitutionalized persons aged 65–84 years living in salisbury (rubin et al. 1997). Persons with cognitive impairment, defined as Mini-Mental State Examination (mmse) score of 17/30 or less, were excluded from the study. a clinical examination, including visual acuity measurement with best refraction correction, was carried out on 2520 persons (61% of those eligible).
the Blue mountains eye study (1991–1993) and the melbourne visual impairment project (vip; 1992–1996) are two large population studies conducted in australia. the Blue mountains eye study consisted of 4 433 eligible persons aged 49 years and older living in the Blue Mountains area in New South Wales (Attebo et al. 1996). Of these, 82% participated in the examination. the vip was performed in the melbourne metropolitan area, and 83% of the 3 946 eligible people aged 40 years and older participated (Livingston et al. 1994, taylor et al. 1997). Both studies included only noninstitutionalized persons. va was assessed with best refraction correction, but in the vip only if initial va had been < 1.0.
also in europe, two widely cited population studies have been carried out. the copenhagen city eye study (1986–1988) consisted of 1 000 eligible individuals aged 60–80 years living in Copenhagen, Denmark (Buch et al. 2001a). Of these, 97% participated in the examination, which included va measurement with current and best refraction correction. the rotterdam study (1990–1993) comprised persons aged 55 years and older living in rotterdam, the netherlands (Klaver et al. 1998). of the eligible sample (n = 10 275), 66% participated in the ophthalmologic examination, including VA measurement with best refraction correction.
in finland, va has been investigated in elderly persons only. häkkinen (1984) evaluated people aged 65 years and over living in the city of turku (eligible sample 595 persons); rouhiainen and teräsvirta (1990) assessed people aged 65, 70, and 75 years living in Kuopio (eligible sample 1 133 persons), and hirvelä and laatikainen (1995) examined people aged 70 years and older living in the county of oulu (eligible sample 560 persons). All of these studies had good participation rates (74–92%) and included examinations of va with best refraction correction. the turku study assessed va also with current spectacles.
all of the earlier studies have potential limitations regarding the generalizability of results due to use of regional data, limited population samples, or restricted age ranges. to our knowledge, no previous nationally representative population-based study assessing va has been published.

17
2.1.2 visual acuity
the majority of the middle-aged or elderly population have good va with best refraction correction. In the Beaver Dam Eye Study, 93% of persons aged 43–54 years had VA ≥ 1.0, and in the Melbourne Visual Impairment Project 73% of persons aged 40 years and older had VA ≥ 1.0 (Klein et al. 1991b, Taylor et al. 1997). The prevalence of VA ≥ 0.8 was as high as 93% in persons aged 52–85 years in the Framingham Eye Study (Leibowitz et al. 1980). the use of data of healthier survivors from the orginal sample potentially explains this figure.
va is strongly and inversely related to age. according to the Beaver dam eye study, only 36% of persons aged 75–84 years had VA ≥ 1.0 (Klein et al. 1991b). In persons aged 75 years and older, the prevalence of VA ≥ 1.0 has been 11–18% and in persons aged 85 years and older 9% (Häkkinen 1984, Gibson et al. 1986, Attebo et al. 1996). However, VA of ≥ 0.8 was still observed in 74% of persons aged 75–85 years in the framingham eye study (Leibowitz et al. 1980). Bergman and Sjöstrand (1992) reported that 45% of persons aged ≥ 82 years had VA ≥ 0.8.
In all age categories, women have been less likely than men to have VA ≥ 1.0, although the age-adjusted difference was significant only in the Blue Mountains Eye Study (leibowitz et al. 1980, häkkinen 1984, Klein et al. 1991b, attebo et al. 1996).
2.1.3 visual impairment
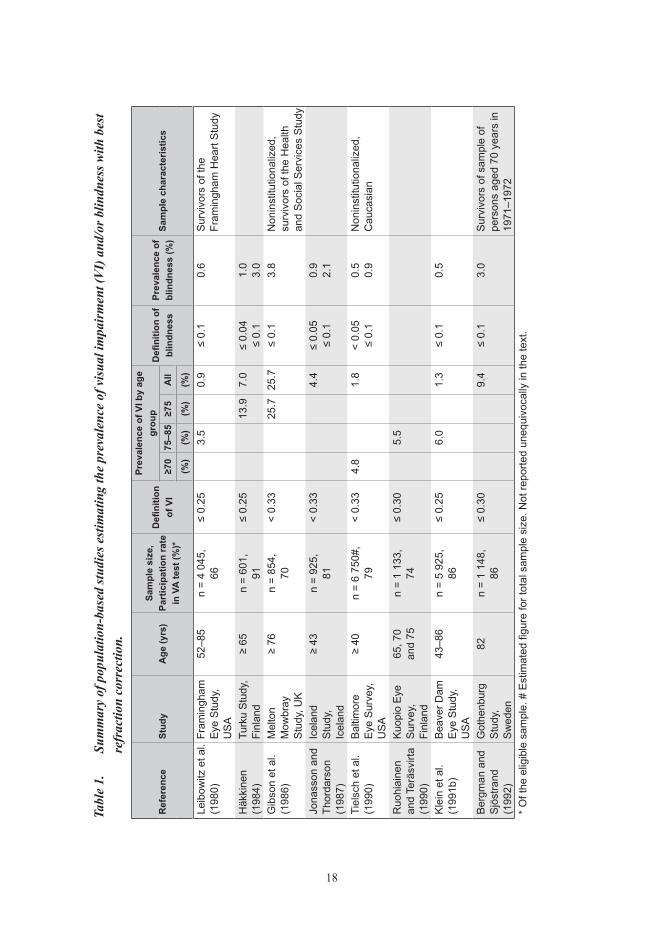
several population studies have estimated the prevalence of visual impairment and blindness in european countries, north america, and australia (table 1). the results have been inconsistent, which is at least partly due to different sampling methods and definitions of visual impairment and blindness. the samples in earlier population studies have had different age distributions, inclusion criteria, and representativeness (e.g. restricted sampling area, use of pre-existing study samples, exclusion of institutionalized persons). Each country also has had different definitions of visual impairment and blindness. To compile comparable data from various countries, the who has recommended a universal definition for visual impairment. This definition is used in the text unless otherwise specified.
18
Tabl
e 1.
Su
mm
ary
of p
opul
atio
n-ba
sed
stud
ies e
stim
atin
g th
e pr
eval
ence
of v
isua
l im
pair
men
t (V
I) a
nd/o
r blin
dnes
s with
bes
t re
frac
tion
corr
ectio
n.
ref
eren
cest
udy
Age
(yrs
)sa
mpl
e si
ze,
part
icip
atio
n ra
te
in v
A te
st (%
)*
Defi
nitio
n of
vi
prev
alen
ce o
f vi b
y ag
e gr
oup
Defi
nitio
n of
bl
indn
ess
prev
alen
ce o
f bl
indn
ess
(%)
sam
ple
char
acte
ristic
s≥7
0 7
5–85
≥75
All
(%)
(%)
(%)
(%)
Leib
owitz
et a
l. (1
980)
Fram
ingh
am
Eye
Stud
y,
USA
52–8
5 n
= 4
045,
66
≤ 0.
253.
50.
9≤
0.1
0.6
Sur
vivo
rs o
f the
Fr
amin
gham
Hea
rt S
tudy
Häk
kine
n
(198
4)Tu
rku
Stud
y,
Finl
and
≥ 65
n
= 60
1,
91≤
0.25
13.9
7.0
≤ 0.
04
≤ 0.
11.
0
3.0
Gib
son
et a
l. (1
986)
Mel
ton
Mow
bray
St
udy,
UK
≥ 76
n =
854,
70
< 0.
3325
.725
.7≤
0.1
3.8
Non
inst
itutio
naliz
ed,
surv
ivor
s of
the
Hea
lth
and
Soc
ial S
ervi
ces
Stu
dyJo
nass
on a
nd
Thor
dars
on
(198
7)
Icel
and
St
udy,
Ic
elan
d
≥ 43
n =
925,
81
< 0.
334.
4≤
0.05
≤
0.1
0.9
2.1
Tiel
sch
et a
l.
(199
0)Ba
ltim
ore
Ey
e Su
rvey
, U
SA
≥ 40
n =
6 75
0#,
79<
0.33
4.8
1.8
< 0.
05
≤ 0.
10.
5 0.
9N
onin
stitu
tiona
lized
, C
auca
sian
Ruo
hiai
nen
and
Terä
svirt
a (1
990)
Kuop
io E
ye
Surv
ey,
Finl
and
65, 7
0
and
75n
= 1
133,
74
≤ 0.
305.
5
Kle
in e
t al.
(199
1b)
Beav
er D
am
Eye
Stud
y,
USA
43–8
6 n
= 5
925,
86
≤ 0.
256.
01.
3≤
0.1
0.5
Ber
gman
and
S
jöst
rand
(1
992)
Got
henb
urg
St
udy,
Sw
eden
82n
= 1
148,
86
≤ 0.
309.
4≤
0.1
3.0
Sur
vivo
rs o
f sam
ple
of
pers
ons
aged
70
year
s in
19
71–1
972
* O
f the
elig
ible
sam
ple.
# E
stim
ated
figu
re fo
r tot
al s
ampl
e si
ze. N
ot re
porte
d un
equi
voca
lly in
the
text
.

19
ref
eren
cest
udy
Age
(yrs
)sa
mpl
e si
ze,
part
icip
atio
n ra
te
in v
A te
st (%
)*
Defi
nitio
n of
vi
prev
alen
ce o
f vi b
y ag
e gr
oup
Defi
nitio
n of
bl
indn
ess
prev
alen
ce o
f bl
indn
ess
(%)
sam
ple
char
acte
ristic
s≥7
0 7
5–85
≥75
All
(%)
(%)
(%)
(%)
Pon
te e
t al.
(199
4)C
aste
ldac
cia
Ey
e St
udy,
Ita
ly
≥ 40
n
= 1
595#
, 67
≤ 0.
255.
61.
7<
0.05
≤
0.1
0.5
1.1
Hirv
elä
and
La
atik
aine
n (1
995)
Oul
u Ey
e St
udy,
Fi
nlan
d
≥ 70
n
= 56
9,
85≤
0.25
12.0
12.0
< 0.
051.
9
Atte
bo e
t al.
(199
6)Bl
ue
Mou
ntai
ns
Eye
Stud
y,
Aust
ralia
≥ 49
n
= 4
433,
82
≤ 0.
255.
01.
3≤
0.1
0.7
Non
inst
itutio
naliz
ed
Tayl
or e
t al.
(199
7)M
elbo
urne
Vi
sual
Im
pairm
ent
Proj
ect,
Aust
ralia
≥ 40
n
= 3
946*
, 83
< 0.
332.
80.
7<
0.05
0.1
Non
inst
itutio
naliz
ed
Rub
in e
t al.
(199
7)Sa
lisbu
ry
Eye
Eval
uatio
n St
udy,
USA
65–8
4 n
= 4
624,
61
< 0.
333.
81.
8<
0.05
≤
0.1
0.2
0.
5N
onin
stitu
tiona
lized
, M
MS
E‡
≥ 18
Kla
ver e
t al.
(1
998)
Rot
terd
am
Stud
y,
Net
herla
nds
≥ 55
n
= 10
275
, 66
< 0.
336.
01.
9<
0.05
≤
0.1
0.5
0.8
Buc
h et
al.
(200
1a a
nd b
)C
open
hage
n C
ity E
ye
Stud
y,
Den
mar
k
60–8
0 n
= 1
000,
97
< 0.
332.
4<
0.05
≤
0.1
0.5
1.1
Ced
rone
et a
l. (2
003)
Priv
erno
Ey
e St
udy,
Ita
ly
45–6
9n
= 76
0,
81≤
0.25
0.7
< 0.
050.
2S
urvi
vors
of s
ampl
e of
pe
rson
s ag
ed 4
5–69
ye
ars
in 1
987
Ced
rone
et a
l. (2
006)
Ponz
a
Stud
y, It
aly
≥ 40
n
= 1
200,
70
< 0.
308.
42.
7<
0.05
0.6
Sur
vivo
rs o
f pre
viou
s P
onza
Stu
dy in
198
8* O
f the
elig
ible
sam
ple.
# E
stim
ated
figu
re fo
r tot
al s
ampl
e si
ze. N
ot re
porte
d un
equi
voca
lly in
the
text
. ‡
MM
SE =
the
Min
i-Men
tal S
tate
Exa
min
atio
n.

20
The WHO has defined visual impairment as better-eye VA of less than 0.3 with best refraction correction. Blindness has been defined as a best-corrected VA of less than 0.05. va less than 0.3 but equal to 0.05 represents low vision (who 1973). Based on these definitions, the prevalence of visual impairment has varied from 0.7% in persons aged 40 years and older in the Melbourne Visual Impairment Project to 2.7% in the Ponza Study (taylor et al. 1997, cedrone et al. 2006). the corresponding proportion of persons aged 40 years and older who are blind is 0.1–0.6%. The Ponza Study was conducted in 2000 and the population consisted of survivors of the earlier ponza study in 1988. a complete ophthalmic examination was conducted on 843 persons living on the island of ponza, located on the western coast of italy (cedrone et al. 2006).
Visual impairment and blindness increase significantly with age. The increase is obvious after 70 years of age and most marked after 80 years of age (tielsch et al. 1990, attebo et al. 1996, taylor et al. 1997, Klaver et al. 1998, cedrone et al. 2006). the prevalence of visual impairment increases from 0–0.6% in persons aged 40–49 years to 3–12% in persons aged 70 years and older and to 6–27% in persons aged 80 years and older (häkkinen 1984, tielsch et al. 1990, ponte et al. 1994, hirvelä and laatikainen 1995, taylor et al. 1997, cedrone et al. 2006).
most previous population studies have shown a higher rate of visual impairment in women than in men, especially in older age groups. The gender difference was significant in the melbourne visual impairment project (taylor et al. 1997). Klein et al. (1991b) and Attebo et al. (1996) also found that women have visual impairment, defined as VA ≤ 0.5, significantly more often than men. In the Melton Mowbray Study, the gender difference was observed only in persons aged 70 years and older (ponte et al. 1994). By contrast, the gender difference was not statistically significant in the Baltimore Eye Study, the turku study, the oulu study, the rotterdam study, or the ponza study (häkkinen 1984, tielsch et al. 1990, hirvelä and laatikainen 1995, Klaver et al. 1998, cedrone et al. 2006). interestingly, in the copenhagen city eye study, men were more likely than women to be blind (Buch et al. 2001a).
visual impairment is most prevalent among the elderly, who also have an increased risk of residing in a nursing home. some population studies have not included institutionalized persons in their study sample, which may influence the prevalence results. Based on the Beaver dam eye study, persons aged 75 years and older living in an institution were 3.3 times more likely to have visual impairment (VA ≤ 0.5) than persons living in their own homes (Klein et al. 1991b). tielsch et al. (1995) reported a prevalence of blindness of 11% and VanNewkirk et al. (2000b) a prevalence of visual impairment of 41% in nursing home residents aged 40 years and older (tielsch et al. 1995, vannewkirk et al. 2000b). these prevalence rates were 16 and 59 times higher, respectively, than among comparable community-living individuals. moreover, in the Blue mountains eye study, the prevalence

21
of blindness (11%) was six times higher in institutionalized persons aged 50 years and older than among community-living people (mitchell et al. 1997b).
2.1.4 habitual visual acuity
distance va is commonly measured with best refraction correction and high-contrast letter-tests in optimal lighting conditions, which may only partly reflect everyday visual functioning. habitual va measured with the subjects’ own spectacles, if any, has only been studied in a few population surveys (table 2). taylor et al. (1997) reported a prevalence of habitual VA of ≥ 1.0 in 65% of persons aged 40 years and older. Compared with the prevalence of best-corrected VA of ≥ 1.0 in the same report, an additional 9% of persons could achieve this va level by optimal refraction correction. the correlation between habitual and best-corrected va has, however, been shown to be high (r = 0.67) (Klein et al. 1999a).
the prevalence of habitual visual impairment in persons aged 40 years and older has varied from 1.3% to 7.0% (Tielsch et al. 1990, Taylor et al. 1997, Cedrone et al. 2006). as expected, these prevalence rates were higher than in studies using best refraction correction. however, the difference was observed mainly in persons with low vision. the prevalence of blindness, varying between 0.2–0.8% with current correction and 0.1–0.6% with optimal correction, seems to be more independent of refraction correction (tielsch et al. 1990, taylor et al. 1997, cedrone et al. 2006).
age-adjusted prevalence of habitual visual impairment has been shown to be more common in women (20%) than in men (17%) aged 40 years and older in the Established populations for the epidemiologic studies of the elderly (epese) (salive et al. 1992). This finding has been confirmed in three later studies (Taylor et al. 1997, van der Pols et al. 2000, evans et al. 2002), but the cause of this gender difference is unknown. taylor et al. (1997) reported the results of the melbourne visual impairment project (vip), van der pols et al. (2000) the results of the national diet and nutrition survey (ndns), and evans et al. (2002) the results of the medical research council trial (mrc) in Britain. the ndns included persons aged 65 years and older (n = 1 487), and the mrc persons aged 75 years and older (n = 14 600). salive et al. (1992) reported the results of the six-year follow-up of the epese conducted in three locations: in east Boston, in iowa and washington counties, and in new haven during 1988 (cornoni-huntley et al. 1985, salive et al. 1992). it included 5 335 participants aged 71 years and older who could be interviewed. all of the participants were survivors of the original sample of about 10 300 participants in 1981–1983.

22
Tabl
e 2.
Su
mm
ary
of p
opul
atio
n-ba
sed
stud
ies e
stim
atin
g th
e pr
eval
ence
of v
isua
l im
pair
men
t (V
I) a
nd/o
r blin
dnes
s with
cu
rren
t ref
ract
ion
corr
ectio
n.
ref
eren
cest
udy
Age
(yrs
)
sam
ple
size
,pa
rtic
ipat
ion
rate
invA
test
(%)*
def
initi
onof
vi
prev
alen
ce o
f vi b
y ag
e gr
oup
def
initi
onof
bl
indn
ess
prev
alen
ceof
blin
dnes
s(%
)
sam
ple
char
acte
ristic
s≥7
0(%
)75
–85
(%)
≥75
(%)
All
(%)
Häk
kine
n(1
984)
Turk
uS
tudy
, Fin
land
≥ 65
n
= 60
1,91
≤ 0.
3026
.917
.0
Tiel
sch
et a
l.(1
990)
Bal
timor
eE
ye S
urve
y, U
SA
≥ 40
n =
6 75
0#,
79<
0.33
3.7
< 0.
05≤
0.1
0.6
1.2
Non
inst
itutio
naliz
ed
Sal
ive
et a
l.(1
992)
Est
ablis
hed
Pop
ulat
ions
for t
he
Epi
dem
iolo
gica
lS
tudi
es fo
r Eld
erly
(EP
ES
E),
US
A
≥ 71
n
= 5
770#
,92
< 0.
3323
.119
.1<
0.1
4.6
Surv
ivor
s of
sam
ple
of p
erso
ns a
ge 6
5 ye
ars
and
olde
r in
1981
–198
3 w
ho c
ould
be
inte
rvie
wed
.
New
land
et a
l.(1
996)
Sou
th A
ustra
lian
Pop
ulat
ion
Stu
dy,
Aus
tralia
≥ 50
n
= 4
000#
41<
0.30
1.5
< 0.
050.
7
Tayl
or e
t al.
(199
7)M
elbo
urne
Vis
ual
Impa
irmen
t P
roje
ct,
Aus
tralia
≥ 40
n =
3 94
6*,
83<
0.33
5.0
1.3
< 0.
05<
0.1
0.2
0.4
Non
inst
itutio
naliz
ed
van
der P
ols
et a
l.(2
000)
Nat
iona
l Die
t and
Nut
ritio
n S
urve
y,
UK
≥ 65
n
= 2
626,
57<
0.33
21.0
14.3
Eva
ns e
t al.
(200
2)M
edic
al R
esea
rch
Cou
ncil
Tria
l, U
K≥
75
n =
21 2
41,
69<
0.33
12.4
12.4
< 0.
052.
1N
onin
stitu
tiona
lized
Ced
rone
et a
l.(2
006)
Pon
za
Stu
dy, I
taly
≥ 40
n
= 1
200,
70<
0.30
7.0
< 0.
050.
8
* O
f the
elig
ible
sam
ple.
# E
stim
ated
figu
re fo
r tot
al s
ampl
e si
ze. N
ot re
porte
d un
equi
voca
lly in
the
text
.
23
2.1.5 Visual acuity for near vision
near and distant va have been strongly correlated, especially when both measurements are based on optimal refraction correction (r = 0.60–0.63) (hirvelä and laatikainen 1995, Klein et al. 1999a). the correlation between habitual va measurements was lower due to better maintained habitual near va than distance va (salive et al. 1992, taylor et al. 1997). the majority of persons were able to read newsprint text size with their current reading spectacles regardless of age and gender. Based on the Melbourne VIP, 98% of persons aged 40 years and older could read 1.5-mm text (J6), which is equivalent to near va of 0.4 at a reading distance of 40 cm (taylor et al. 1997). salive et al. (1992) reported that 86% of persons aged 71 years and older and 61% of persons aged 90 years and older were still able to read a 1.2-mm text (J5; near va of 0.5 at 40 cm distance) with their current reading spectacles. the difference in near va was small between best refraction correction and own spectacles. In the Beaver Dam Eye Study, 99% of persons aged 43–86 years had va > 0.5 (J1–J4) with best correction (Klein et al. 1999a).
2.1.6 self-reported visual function
in many population studies, visual function has been evaluated with a few questions covering aspects such as ability to read newsprint or road signs or to recognize people across the street. measurements of self-reported visual function are a relatively simple way to assess visual disturbances in epidemiological studies because they do not require specialized equipment or personnel and are not time-consuming, and can therefore be applied to large population groups. however, the interpretation of results is not as straightforward as with performance-based measurements.
In concordance with performance-based measurements, self-reported visual difficulties increase with age (hirvelä and laatikainen 1995, Klein et al. 1999a). in general, most of those who have achieved a good result in va measurement also report good vision. however, many persons with decreased va also describe their vision as good or even excellent. in accordance, hiller and Krueger (1983) found that self-reported trouble with vision had high specificity but low sensitivity when assessing VA impairment. This may at least partly explain why correlations between self-reported visual functions and performance-based measurements have only been moderate, although highly significant (p < 0.0001) (Klein et al. 1999a). Spearman correlation coefficients between habitual distant va and reading road signs, between near va and reading newsprint, and between habitual distant va and recognizing people across the street were 0.19, 0.22, and 0.25, respectively (Klein et al. 1999a). self-reported visual functions seemed to be more highly correlated with habitual va than with best-corrected va.

24
environmental and individual demands on vision may alter the subjective assessment of visual ability. unrelated to the actual va result, a subject’s own assessment of visual function may give information about vision to supplement va tests, which do not cover all visual components, e.g. contrast sensitivity and visual field, influencing an individual’s ability to cope with his/her environment (valbuena et al. 1999, rubin et al. 2001). in the turku study, an explanation for visual complaints despite good va was found in 96–97% of cases (Häkkinen 1984). Therefore, self-assessment of visual function has been recommended to be included in ophthalmological studies, although the correlation between self-reported and performance-based visual function tests is moderate at best (Klein et al. 1999a). in addition, elderly visually impaired persons have reported to have less disability in resolution-requiring tasks than younger people despite identical measured va (häkkinen 1984). this indicates that self-reported visual ability may be attributable to age, overall health state, and duration of impaired va and needs to be taken into account when interpreting test-based and self-reported results and discrepancies between these.
2.2 causes of decreased visual acuityfrom the public health perspective, it is important to know the causes of decreased va and their prevalence to assess the need for future health and eye care services. in earlier population studies, the major factors predisposing adults to deteriorated va have been chronic eye diseases and uncorrected refractive errors, which are treatable in many cases (tielsch et al. 1990, rahmani et al. 1996, munoz et al. 2000). of chronic eye diseases, age-related maculopathy (arm), glaucoma, diabetic retinopathy (dr), and age-related cataract have been the most common causes of decreased va although the distribution of the main causes varies in different age groups (rahmani et al. 1996, Klaver et al. 1998, munoz et al. 2000, weih et al. 2000, Buch et al. 2001a, Buch et al. 2001b, vannewkirk et al. 2001).
2.2.1 Age-related maculopathy
arm is thought to be a continuum of a disease process, which is clinically observed as the presence of typical retinal lesions. These clinical findings are usually classified as either early or late ARM. Early ARM includes clinical findings such as retinal drusen and/or pigment epithelial abnormalities and has a strong tendency to evolve into late arm (Klein et al. 2002, van leeuwen et al. 2003, wang et al. 2003a, Klein et al. 2007, wang et al. 2007). signs of exudative age-related macular degeneration or geographic atrophy are related to late arm, also known as age-related macular degeneration (amd). visual impairment associated with arm is mainly related to late arm (Klein et al. 1995, laatikainen and hirvelä 1995). the cause of arm is unknown, but some factors, such as age, family history, smoking, hypertension, and cataract surgery, have been most consistantly associated with

25
an increased risk of arm (Klein et al. 2004). treatment modalities of arm have been limited for the most part, but recently launched new methods, including photodynamic therapy (pdt), transpupillary thermotherapy (ttt), and especially anti-vegf treatment, have improved the possibility of preventing further deterioration of vision due to exudative arm (Bressler 2001, newsom et al. 2001, gragoudas et al. 2004, chang et al. 2007, Kaiser et al. 2007). treatments for geographic arm are limited.
the prevalence of late arm has been evaluated in a few earlier population studies. results seem to depend on the geographic area, age distribution of the study population, and the grading methods used to classify the retinal lesions. the prevalence of late arm has varied between 0.5% and 1.9% in middle-aged and elderly persons in studies using photographs and the wisconsin age-related maculopathy grading scheme (warmgs) (Klein et al. 1991a) to assess arm (Klein et al. 1992c, mitchell et al. 1995, vingerling et al. 1995, Klein et al. 1999b, vannewkirk et al. 2000a). in the nordic countries, the prevalence of late ARM is higher, ranging from 2.8% in the Oslo Macular Study to 3.5% in the reykjavik eye study (Jonasson et al. 2003a, Björnsson et al. 2006). however, these studies had slightly older population samples and used the protocol of the international arm group as a grading method (Bird et al. 1995). in the nordic studies, the prevalence of geographic arm has been higher than of exudative arm, whereas this ratio has been reversed in other population studies.
late arm increases sharply with age, especially after the age of 75 years. in persons aged 70 or 75 years and older, the prevalence of late ARM has varied between 4% and 8% (laatikainen and hirvelä 1995, mitchell et al. 1995, vingerling et al. 1995, topouzis et al. 2006). in persons younger than 65 years, the prevalence of late arm has been low, ranging from 0.1% in the Blue Mountains Eye Study to 0.3% in the Beaver Dam Eye Study and the thessaloniki eye study (Klein et al. 1992c, mitchell et al. 1995, topouzis et al. 2006). three studies found no cases of late arm in persons younger than 55 years (mitchell et al. 1995, vannewkirk et al. 2000a, Björnsson et al. 2006). except for the oulu eye study, women seemed to have late arm more often than men, but these gender differences were not statistically significant. Only Klein et al. (1992c) reported that exudative macular degeneration is more common in women than in men aged 75–86 years (p = 0.02).
ARM is the most common cause of visual impairment (VA < 0.3) in elderly people (hirvelä and laatikainen 1995, attebo et al. 1996, wang et al. 2000, Buch et al. 2001a, Buch et al. 2001b, vannewkirk et al. 2001). Hirvelä and Laatikainen (1995) found that 39% of the visually impaired persons aged 70 years and older had late arm. the prevalence rose to 56% if early ARM changes with cataract were included. In the Copenhagen City Eye Study, 43% of visual impairment was caused by ARM in persons aged 60–80 years (Buch et al. 2001a, Buch et al. 2001b). Wang et al. (2000) reported that 61% of visual impairment was caused by arm in persons aged 60 years and older.

26
2.2.2 glaucoma
glaucoma is a heterogeneous group of conditions that share an irreversible progressive optic neuropathy. diagnosis of glaucoma is based on characteristic optic nerve damage and typical lesions in the nerve fiber layer observed ophthalmoscopically and/or with imaging. the two main categories of glaucoma are open-angle glaucoma (oag) and angle-closure glaucoma depending on the mechanism of increased intraocular pressure (iop), which has been found to be the major risk factor for developing glaucoma. the treatment of glaucoma is based on lowering of iop by medication, laser therapy, or surgery. some other major factors, such as older age, family history, presence of exfoliative material, vascular dysregulation, and myopia, have been reported to be associated with oag (leske 2007, leske et al. 2007). in addition, older age, female gender, shallow anterior chamber, and shorter axial length have been found to increase the risk for angle-closure glaucoma, but the cause of glaucoma remains unknown (foster 2002).
primary oag is the most prevalent and investigated form of glaucoma. however, population studies have had different age distributions and definitions for OAG, which hamper comparison of results. for example, some studies have excluded capsular glaucoma (exfoliation glaucoma), considering it secondary glaucoma. in most studies, the prevalence of OAG has varied from 1% to 3% in middle-aged and older persons (tielsch et al. 1991b, coffey et al. 1993, dielemans et al. 1994, mitchell et al. 1996, Bonomi et al. 1998, wensor et al. 1998, wolfs et al. 2000, weih et al. 2001, anton et al. 2004). due to the low prevalence of other forms of glaucoma, the overall prevalence of all types of glaucoma has varied little, from 2% to 3% (Coffey et al. 1993, Bonomi et al. 1998, Nizankowska and Kaczmarek 2005). The prevalence of OAG increases significantly with age, from 1% in persons younger than 65 years to 3–5% in persons aged 65 or 70 years and older (leibowitz et al. 1980, tielsch et al. 1991b, Klein et al. 1992b, coffey et al. 1993, mitchell et al. 1996, Bonomi et al. 1998, reidy et al. 1998, wensor et al. 1998, weih et al. 2001). In the Rotterdam Study, the prevalence has been lower, increasing from 0.2% in persons younger than 65 years to 1.6% in persons aged 65 years and older (Dielemans et al. 1994).
a substantial geographic variation in the prevalence of oag has been noted. this may be due to differences in the occurrence of the exfoliation syndrome and subsequent capsular glaucoma, which are common in, for example, finland and other nordic countries. In the Nordic countries, the prevalence of OAG has been 4–5% in middle-aged and older persons and 8–10% in persons aged 65 or 70 years and older (Ringvold et al. 1991, hirvelä et al. 1994, Jonasson et al. 2003b). in these studies, 36–60% of persons with OAG have had capsular glaucoma.

27
results concerning the gender difference in prevalence of oag have been inconsistent. some previous studies have reported that glaucoma is more prevalent in men than in women (Jonasson and thordarson 1987, dielemans et al. 1994, ekström 1996, Bonomi et al. 1998, reidy et al. 1998, wolfs et al. 2000), and others have found no gender difference (gibson et al. 1985, ringvold et al. 1991, Klein et al. 1992b, hirvelä et al. 1994, wensor et al. 1998, weih et al. 2001, Jonasson et al. 2003b, anton et al. 2004, nizankowska and Kaczmarek 2005). in the Blue mountains eye study, women had a higher prevalence of glaucoma than men (mitchell et al. 1996).
Glaucoma is the second most frequent cause of irreversible blindness (VA < 0.05) after arm in the elderly (Buch et al. 2001a, vannewkirk et al. 2001). in the copenhagen city Eye Study, 40% of blindness was caused by glaucoma in persons aged 60–80 years (Buch et al. 2001a, Buch et al. 2001b). VanNewkirk et al. (2001) reported that 25% of blindness was caused by glaucoma in persons aged 60 years and older. Despite the high significance of this eye disease, only half of the persons with glaucoma were aware of having the disease (tielsch et al. 1991b, coffey et al. 1993, dielemans et al. 1994, mitchell et al. 1996, wensor et al. 1998, wolfs et al. 2000, topouzis et al. 2007). in finland, however, 70–80% of elderly people with glaucoma are aware of their disease (Häkkinen 1984, hirvelä et al. 1994).
2.2.3 diabetic retinopathy
diabetic retinopathy (dr) is the most common ocular complication of diabetes mellitus (dm), with potentially devastating effects on vision. an estimated 500 000 persons have dm in finland, and the prevalence is expected to increase further, especially due to the increase in non-insulin-dependent diabetes mellitus (niddm, type 2 dm) (reunanen 2006). moreover, the prevalence of insulin-dependent diabetes mellitus (iddm, type 1 dm) in finland is the highest in the world (diabetes epidemiology research international group 1988). the most serious and vision-threatening forms of dr are proliferative dr and macular edema. persons with iddm are at higher risk of developing severe proliferative dr as a result of microvascular changes in the retina, whereas macular edema is more likely in persons with niddm. screening and early treatment of dr with laser therapy and surgery have been shown to reduce the risk of subsequent visual impairment (the early treatment diabetic retinopathy study research group 1987, ferris 1991).
In earlier population studies, the prevalence of DR has varied between 0.8% and 2.3% in middle-aged and elderly persons, increasing in the Blue mountains eye study from 1.7% in persons younger than 60 years to 2.7% in persons aged 70–79 years (Mitchell et al. 1998, Rajala et al. 1998, McKay et al. 2000). Of those with DM, 25–32% have had retinopathic changes. Hirvelä and Laatikainen (1997) observed that 5% of the general

28
population aged 70 years and older and 21% of diabetic persons had DR. In an earlier Finnish study, only 2% of persons aged 65 years and older had DR (Häkkinen 1984). in the majority of cases, the retinal changes were mild. proliferative changes have been present in 2–4% and macular edema in 3–8% of persons with DM (Klein et al. 1992d, hirvelä and laatikainen 1997, mitchell et al. 1998, mcKay et al. 2000).
The prevalence of DR has been found to increase significantly with the duration of dm. retinopathic changes have been quite uncommon among persons with newly diagnosed DM, varying from 8% in persons aged 70 years and older in the Oulu Study to 16% in persons aged 49 years and older in the Blue Mountains Eye Study (Hirvelä and laatikainen 1997, mitchell et al. 1998). of persons with dm diagnosed at least 20 years earlier, 55–86% had retinopathic changes (Hirvelä and Laatikainen 1997, Mitchell et al. 1998, mcKay et al. 2000). dr has also been more common in diabetic persons taking insulin compared with other forms of treatment. of persons using only diet or oral therapy for their NIDDM, less than one-third (29–30%) had retinopathic changes compared with 62% of persons using insulin (Klein et al. 1992d, Mitchell et al. 1998).
of the four major chronic eye diseases, dr has been the most common cause of decreased VA in persons younger than 65 years. In the Baltimore Eye Study, 18% of persons aged 40–64 years with va better than 0.1 but worse than 0.5 had dr (rahmani et al. 1996). the prevalence of decreased va caused by dr (1.6 per 1 000 individuals) was most common in persons aged 50–59 years. vannewkirk et al. (2001) found dr to be the most common cause of low vision (VA 0.1 – < 0.3) in persons aged 40–64 years, but no one was blind due to dr.
2.2.4 Age-related cataract
Age-related cataract refers to an opacification of the originally clear lens of the eye, obstructing the passage of light reaching the retina. the cause of age-related cataract is unknown, but such factors as older age, trauma, intraocular inflammation, ultraviolet light exposure, smoking, and use of steroids increase the risk for developing this disease (hodge et al. 1995). currently, no proven means of preventing development of cataract exist, but with modern surgery permanent deterioration of vision can usually be prevented. nevertheless, cataract has been found to be a common cause of visual impairment. hirvelä and Laatikainen (1995) reported that 11% of visual impairment in persons aged 70 years and older was caused by cataract only. This is in accordance with the finding of Häkkinen (1984), who reported that 10% of VA ≤ 0.3 in persons aged 65 years and older was due to cataract as the only cause. in the copenhagen eye study, cataract was the cause of low vision in 33% of persons aged 60–80 years (Buch et al. 2001b).

29
Previous population studies have used a variety of classifications and grading systems in describing the prevalence of cataract. many recent population studies have been aimed at determining the risk factors for cataract, and therefore, the prevalence rates have included even early abnormalities assessed with thorough ophthalmic examination. some studies have defined lens opacities as cataract only if they are associated with decreased VA. This makes it difficult to generalize the results. In the Swedish community Skövde, the prevalence of cataract has been 42% in women and 27% in men aged 70–84 years (Östberg et al. 2006). In that study, the Lens Opacities Classification System III (LOCS III) was used for grading, and the criteria corresponded to clinically significant cataract (i.e. posterior subcapsular cataract (psc) > 1, cortical cataract (cc) > 3, and nuclear opalescence (no) ≥ 4). Other previously reported prevalence rates have been much higher, at least partly due to the different definitions of cataract. In Finland, for example, Häkkinen (1984) reported a prevalence of 48% in persons aged 65 years and older when cataract was defined as opacities in the retinoscopic reflex, while Hirvelä et al. (1995) found a prevalence of 64% in persons aged 70 and older based on locs ii grading with milder criteria (grade > 0 for psc, grade > 1 for cc and no). of studies using the wisconsin cataract grading system, the Blue Mountains Eye Study has shown that 43% of persons aged 65 years and older had early cataract and 33% had late cataract excluding past cataract surgery (Mitchell et al. 1997a). In the Beaver Dam Eye Study, the figures were almost the same. Of persons aged 65–86 years, 45% had early cataract and 34% late cataract when previous cataract surgery was excluded (Klein et al. 1992a).
In persons younger than 65 years, the prevalence of cataract has been low, with 4% having lens opacities related to VA of ≤ 0.67 or having cataract extraction (Leibowitz et al. 1980, Klein and Klein 1982). Klein et al. reported in 1992 that only 0.4% of person aged 43–64 years had visually significant (VA ≤ 0.63) cataract, excluding previous cataract operations. most earlier studies have shown that lens opacities and cataract are more common in women than in men (leibowitz et al. 1980, häkkinen 1984, gibson et al. 1985, Jonasson and thordarson 1987, Klein et al. 1992a, hirvelä et al. 1995, reidy et al. 1998, Östberg et al. 2006), but the age-adjusted gender difference was statistically significant in only a few studies (Jonasson and thordarson 1987, Klein et al. 1992a, reidy et al. 1998, Östberg et al. 2006).
for comparisons between studies, the prevalence of previous cataract surgery is more unequivocal, although the increasing trend for cataract surgery in recent years must be taken into account when interpreting results. the prevalence of operated cataract has been 4% in persons aged 40 and older (McCarty et al. 2000), 6% in those over 48 (Mitchell et al. 1997a), 5% in those 50 and older (Sasaki et al. 2000), 10% in those 65 and older (Reidy et al. 1998), and 11% in those 70 and older (Hirvelä et al. 1995).

30
2.2.5 Refraction
one major factor affecting visual function is the refractive status of the eyes. in earlier population studies, the prevalence of emmetropia (i.e. spherical equivalent between -0.5 d and +0.5 D) has been found to decrease with age, from 48% in persons aged 49–54 years to 15% in persons older than 84 years (Attebo et al. 1999). In the Baltimore Eye Study, these prevalence rates have been quite similar (Katz et al. 1997). although the prevalence of refractive errors increases with age, they can usually be compensated with corrective lenses, i.e. spectacles.
in the Baltimore eye study, the best refraction correction improved va by 1 or more lines in 54% and by 3 or more lines in 8% of persons aged 40 years and older (Tielsch et al. 1990). In the Blue Mountains Eye Study, the corresponding figures were 45% and 13% (attebo et al. 1996). taylor et al. (1997) reported that in the melbourne visual impairment Project 60% of persons aged 40 years and older improved their VA by at least one line. in these studies, increasing age has been the most important predictor of uncorrected refractive errors (liou et al. 1999, foran et al. 2002, thiagalingam et al. 2002). gender was not related to uncorrected refractive errors.
several studies have also reported a relatively high frequency of un(der)corrected refractive error as a cause of visual impairment in the middle-aged and elderly population. Of the visual impairment (VA < 0.33) assessed with current refraction correction, 45–66% has been due to uncorrected refractive error in noninstitutionalized persons aged 40 years and older (tielsch et al. 1990, taylor et al. 1997). most of the correctable visual impairment was observed in persons with low vision.

31
2.3 effect of visual decline on daily life2.3.1 disability
traditionally, the health status of a population has been evaluated with disease prevalence rates and mortality. Although these figures are important, they are not adequate measures to describe the consequences of diseases and impairments on people’s functional capacity. functional status and assessment of disability are additional approachs for evaluating health. the development of disability may vary considerably even among persons with the same diseases or impairments. thus, identifying the factors associated with disability or maintaining a good functional ability is crucial. to understand the complex process of disability and to clarify the terminology, various conceptual models have been presented.
The first comprehensive framework for disability was introduced by the sociologist nagi in 1976 (nagi 1976, nagi 1979, nagi 1991). his theory included four major concepts: active pathology, impairment, functional limitation, and disability, and it proposed a theoretical pathway from disease (i.e. active pathology) to disability. after this, in 1994, verbrugge and Jette presented a model called the disablement process. it was based on nagi’s scheme, but placed more attention on the dynamics of disablement and introduced predisposing and protective factors that may speed up or slow down the process. Both of these models consider functional limitations as restrictions in basic physical and mental actions and disability as a difficulty to perform activities of daily life in their environmental and social context. Verbrugge and Jette (1994) defined disability as the gap between a person’s capability and environmental demands.
In 2001, the WHO published the International Classification of Functioning, Disability, and Health (ICF), a taxonomy providing a unified terminology and framework for health and functional capacity (who 2001). it was an improved version of the international Classification of Impairments, Disabilities, and Handicaps (ICIDH) published earlier by who (1980). the icf enables disability to be elucidated along a pathway from diseases to functional limitations, defined as activity limitations (i.e. “difficulties an individual may have in executing activities”) and participation restrictions (i.e. “problems an individual may experience in involvement in life situation”) in the context of other health conditions and coexisting factors, including personal factors (i.e. socio-demographic and behavioral factors), environmental demands, and social support. differing from earlier models, the icf perceives disability as an umbrella concept that includes impairments, activity limitations, and participation restrictions instead of being only the endstate of a theoretical pathway.
measurement of disability is difficult and can give only an approximation of a person’s functional capacity. functional limitations have commonly been assessed with self-reported

32
or proxy-reported difficulties in various tasks. The assessment of needing help in the same tasks has given another point of view on disability. the most commonly used scales to assess functioning have been activities of daily living (adl) and instrumental activities of daily living (IADL) (Katz et al. 1963, Lawton and Brody 1969). ADL measures reflect a person’s ability to manage self-care (e.g. eating, washing, and dressing). iadl measures (e.g. cleaning, laundry, shopping, and banking), by contrast, are more complex and reflect how the person manages independently in his surroundings. The scale of Rosow-Breslau (rB) (e.g. walking half a mile, climbing stairs, and doing heavy housework) and nagi’s items (e.g. standing, walking, and carrying weights) has been used to assess self-reported physical performance and mobility limitations (rosow and Breslau 1966, nagi 1976). performance-based measurements have been used to provide more objective and standardized information on functional abilities and to enable assessment of the degree of functional limitations even at the upper end of the functional scale. especially, mobility-related performance-based measurements (e.g. tests of balance, walking, stair-climbing, and chair-rising) have been widely used (Bassey et al. 1992, guralnik et al. 1994).
regardless of the various methodological challenges, disability has been studied extensively. it has been found to increase substantially with age and has a great impact on society as well as on a person’s quality of life and sense of independence by increasing the need for health and social services and institutional care (Branch and Jette 1982, Branch et al. 1984, foley et al. 1992, norburn et al. 1995, torres et al. 1995, aguero-torres et al. 2001). increasing life expectancy has led to a rapid increase in the number of older people, who are particularly prone having various diseases and functional limitations. therefore, it has become increasingly important to prevent and postpone disability and to provide adequate rehabilitation to improve function whenever possible so that the additional years of life are of good quality and can be spent without dependence. disability, like many diseases, is thought to have a preclinical state where incipient functional limitations can still be overcome by conscious or unconscious compensatory strategies (harris et al. 1989, fried et al. 1991, guralnik et al. 1994, fried et al. 1996, fried et al. 2000). disability is usually a progressive process, but functional abilities can also improve (Branch et al. 1984, guralnik et al. 1993, seeman et al. 1994). however, the likelihood of improvement decreases with more severe disability (Branch et al. 1984, mor et al. 1989). thus, identification of preclinical disability could be an important way to prevent its progression to more advanced level and to enhance independence.

33
2.3.2 predisposing factors for disability
identification of the predisposing and protective factors associated with the development of functional limitations has been one of the main topics in the research of disability. factors like chronic health conditions, health behavior, social support, and some sociodemographic factors have consistently been found to modify the risk of disability, in accordance with the hypothesis of prior theoretical frameworks (verbrugge and Jette 1994, who 2001). already existing functional limitations have also been reported to increase the risk for novel chronic conditions and functional limitations, highlighting the dynamic and multidirectional nature of development of disability (guralnik et al. 1994, fried et al. 1996). further evaluating these factors may facilitate understanding of the development of disability and identification of potential targets for preventive actions.
Due to differences in study populations and definitions of both determinants and outcome variables in earlier studies, associations between potential predisposing factors and functional limitations have been difficult to compare. Despite some discordance, certain diseases and subsequent impairments, such as cardiovascular diseases, diabetes mellitus, osteoarthritis, depression, dementia, and cognitive, visual, and hearing impairments, have been related to the development of disability in most prospective studies (harris et al. 1989, mor et al. 1989, leveille et al. 1992, carabellese et al. 1993, guralnik et al. 1993, Boult et al. 1994, Bruce et al. 1994, seeman et al. 1994, moritz et al. 1995, gallo et al. 1997, aguero-torres et al. 1998, penninx et al. 1998, stuck et al. 1999, wang et al. 2002). an increasing number of chronic concomitant health conditions, i.e. comorbidities, seems to increase the probability of functional limitations (guralnik et al. 1993). interactions among specific diseases may also exacerbate the development of disability more than expected on the basis of the effects of single diseases (verbrugge et al. 1989, fried et al. 1999).
Previous studies have also confirmed that the effect of chronic diseases and impairments on functional ability is often modified by personal (i.e. sociodemographic and behavioral) and environmental factors. increasing age is the greatest risk for disability (guralnik et al. 1993). low socioeconomic status (e.g. low income and educational level) has also been found to predict disability (harris et al. 1989, mor et al. 1989, guralnik et al. 1993, Boult et al. 1994, seeman et al. 1994). of the behavioral factors, smoking, low physical activity and high body mass index (Bmi) have been found most consistently to modify the development of disability (harris et al. 1989, mor et al. 1989, seeman et al. 1994, seeman et al. 1995, wang et al. 2002, lang et al. 2007, stenholm et al. 2007a, stenholm et al. 2007b). environmental factors have been examined much less, but some evidence suggests that social support predicts better physical performance (seeman et al. 1995).

34
2.3.3 visual function and disability
several cross-sectional studies have shown an association between impaired visual function and functional limitations (table 3a and 3b). for example, in the established populations for the Epidemiological Studies of the Elderly (EPESE), 39% of persons aged 70 years and older with severe visual impairment (VA < 0.1) had ADL limitations (i.e. inability to perform ADL tasks independently) and 70% had mobility limitations (i.e. inability to climb a flight of stairs or walk a half-mile without help) compared with 7% and 29%, respectively, of persons with VA ≥ 0.5 (Salive et al. 1994). Impaired VA was also associated with performance-based functional limitations. of persons with severe visual impairment, only 18% managed the balance test, 9% completed the eight-foot walk in the fastest quartile, and 11% completed the five chair stands in the fastest quartile (Salive et al. 1994). however, all persons with impaired visual function do not report functional limitations, and one cross-sectional study found no association at all between vision and functional limitations (ensrud et al. 1994). this suggests that some confounding or modifying factors may influence the association between vision and physical functioning.
some prospective population-based studies have also tried to evaluate the independent effect of visual impairment on disability (table 4a and 4b). in the longitudinal study of aging (lsoa) conducted in the usa, self-reported visual impairment predicted functional decline in adl, iadl, or mobility-related tasks even after controlling for medical, demographic, and behavioral factors (mor et al. 1989). the results were based on the two-year follow-up of physically intact persons aged 70–74 years at baseline. These findings were confirmed in the National Health and Nutrition Examination Survey (NHANES I) and its follow-up survey (nhefs) noting that self-reported visual impairment predicted adl, iadl, and mobility-related limitations also in persons aged 55–74 years during a ten-year follow-up (reuben et al. 1999). the north carolina epese reported similar results in persons aged 65 years and older during a six-year follow-up (whitson et al. 2007). in addition, the alameda county study, grading self-reported visual impairment, found an association between it and adl and iadl limitations in persons aged 50 years and older. By contrast, physical performance items (e.g. writing, standing up from a chair, carrying weights, and kneeling) were associated only with moderate visual impairment (wallhagen et al. 2001).

35
Tabl
e 3a
. Su
mm
ary
of p
opul
atio
n-ba
sed
stud
ies e
valu
atin
g th
e as
soci
atio
n be
twee
n re
duce
d se
lf-re
port
ed v
isua
l fun
ctio
n an
d fu
nctio
nal l
imita
tions
* ba
sed
on c
ross
-sec
tiona
l ana
lysi
s.
ref
eren
cest
udy
part
icip
ants
,ag
e gr
oup,
incl
usio
n cr
iteria
Mea
sure
s of
redu
ced
visu
al fu
nctio
nM
easu
res
of
func
tiona
l lim
itatio
nsr
esul
tsA
djus
ted
varia
bles
Jette
et a
l.(1
985)
Mas
sach
uset
ts H
ealth
C
are
Pan
el S
tudy
n =
776,
> 7
0 yr
s,N
onis
titut
iona
lized
surv
ivor
s of
the
orig
inal
pan
el
Sel
f-rep
orte
dqu
ality
of v
isio
n(r
educ
ed q
ualit
y of
vi
sion
)
Dis
abili
ty in
dex
(rec
eivi
ng a
ssis
tanc
e or
una
ble
to p
erfo
rm A
DL
or IA
DL
task
s)
Ass
ocia
tion
+A
ge, g
ende
r, in
com
e, li
ving
si
tuat
ion,
mus
culo
skel
etal
im
pairm
ent,
hear
ing
impa
irmen
t
Frie
d et
al.
(199
9)W
omen
’s H
ealth
and
Agi
ng S
tudy
(WH
AS
)n
= 3
791,
≥ 6
5 yr
s,N
onin
stitu
tiona
lized
Sel
f-rep
orte
dvi
sion
pro
blem
sD
ifficu
lty in
AD
L, IA
DL,
and
Nag
i- an
d R
B-li
ke p
hysi
cal
perfo
rman
ce it
ems
Ass
ocia
tion
with
IAD
Ls +
Ass
ocia
tion
with
AD
Ls a
nd
phys
ical
per
form
ance
item
s -
Age
, rac
e, e
duca
tion,
M
MS
E, c
hron
ic d
isea
ses,
he
arin
g im
pairm
ent
Lee
et a
l.(1
999)
Ass
et a
nd H
ealth
D
ynam
ics
of th
e O
ldes
tO
ld S
urve
y (A
HE
AD
)
n =
7 32
0, ≥
70
yrs,
Non
inst
itutio
naliz
edS
elf-r
ated
vis
ion
(dec
rem
ent o
f vis
ion)
Func
tiona
l sta
tus
scor
e(D
ifficu
lty in
AD
L or
Nag
i-lik
eph
ysic
al p
erfo
rman
ce it
ems)
Ass
ocia
tion
+A
ge, e
duca
tion,
mar
ital
stat
us, i
ncom
e, w
ealth
, ge
nera
l hea
lth, h
earin
g
Cac
ciat
ore
et a
l.(2
004)
Italia
n S
tudy
n =
1 33
2, ≥
65
yrs
Sel
f-rep
orte
d ab
ility
to s
ee(im
paire
d vi
sion
)
Inab
ility
to p
erfo
rm A
DL,
IAD
L,an
d R
B-li
ke p
hysi
cal
perfo
rman
ce it
ems
inde
pend
ently
Ass
ocia
tion
+A
ge, g
ende
r, co
mor
bidi
ty
Mel
zer e
t al.
(200
5)E
nglis
h Lo
ngitu
dina
lS
tudy
of A
gein
g (E
LSA
)n
= 11
216
, ≥ 5
0 yr
s,N
onin
stitu
tiona
lized
Sel
f-rep
orte
d ey
esig
ht (f
air o
r poo
r)D
ifficu
lty in
wal
king
a q
uarte
r of
a m
ileA
ssoc
iatio
n +
Age
, gen
der,
soci
al c
lass
, ed
ucat
ion,
wea
lth, s
mok
ing,
al
coho
l int
ake
Cig
olle
et a
l.(2
007)
Hea
lth a
nd R
etire
men
tS
tudy
n =
11 0
93, ≥
65
yrs
Sel
f-rep
orte
d fa
ir or
poo
r eye
sigh
tR
ecei
ving
ass
ista
nce
due
to
diffi
culty
in ≥
1 A
DL
task
Ass
ocia
tion
+A
ge, g
ende
r, ra
ce, m
arita
l st
atus
, edu
catio
n, in
com
e,
cogn
itive
impa
irmen
t, fa
lls, B
MI,
inco
ntin
ence
, di
zzin
ess,
hea
ring
impa
irmen
t
Whi
tson
et a
l.(2
007)
Nor
th C
arol
ina
Est
ablis
hed
Pop
ulat
ions
for t
he
Epi
dem
iolo
gica
l Stu
dies
of t
he
Eld
erly
(NC
EP
ES
E)
n =
3 87
8, ≥
65
yrs,
Non
inst
itutio
naliz
edVi
sual
impa
irmen
tsc
ale
(sel
f-rep
orte
d tro
uble
with
vis
ion)
Inab
ility
to p
erfo
rm ≥
1 A
DL,
IA
DL,
or R
B (m
obili
ty)
Ass
ocia
tion
+
* F
unct
iona
l lim
itatio
ns a
re a
sses
sed
as a
ctiv
ities
of d
aily
livi
ng (A
DL)
(e.g
. eat
ing,
was
hing
, and
dre
ssin
g), i
nstr
umen
tal a
ctiv
ities
of d
aily
livi
ng (I
AD
L) (e
.g. c
lean
ing,
laun
dry,
sho
ppin
g, a
nd
bank
ing)
, Nag
i-lik
e ph
ysic
al p
erfo
rman
ce it
ems
(e.g
. sta
ndin
g, w
alki
ng, a
nd c
arry
ing
wei
ghts
), an
d R
osow
-Bre
slau
item
s (R
B) (e
.g. w
alki
ng h
alf a
mile
, clim
bing
sta
irs, a
nd d
oing
hea
vy
hous
ewor
k). M
MS
E =
the
Min
i-Men
tal S
tate
Exa
min
atio
n. B
MI =
bod
y m
ass
inde
x.

36
Tabl
e 3b
. Su
mm
ary
of p
opul
atio
n-ba
sed
stud
ies e
valu
atin
g th
e as
soci
atio
n be
twee
n re
duce
d pe
rfor
man
ce-b
ased
vis
ual
func
tion
and
func
tiona
l lim
itatio
ns*
base
d on
cro
ss-s
ectio
nal a
naly
sis.
ref
eren
ce
st
udy
pa
rtic
ipan
ts,
age
grou
p,
incl
usio
n cr
iteria
Mea
sure
s of
redu
ced
visu
al fu
nctio
n
Mea
sure
s of
fun
ctio
nal
limita
tions
r
esul
ts
Adj
uste
d va
riabl
es
Car
abel
lese
et
al. (
1993
)Ita
lian
Stu
dyn
= 1
191,
70–
75 y
rs,
Non
inst
itutio
naliz
edP
erfo
rman
ce-b
ased
ha
bitu
al V
A <
0.4
Poo
r fun
ctio
n in
≥ 1
IAD
LA
ssoc
iatio
n +
Gen
der,
depr
essi
on, h
earin
g im
pairm
ent,
men
tal s
tatu
s, s
ocia
l re
latio
nshi
ps
Ens
rud
et a
l. (1
994)
Stu
dy o
f Ost
eopo
rotic
Fr
actu
res
(SO
F)n
= 9
052,
≥ 6
5 yr
s,
Non
inst
itutio
naliz
ed,
wom
en, a
ble
to w
alk
w
ithou
t hel
p, n
o hi
stor
y of
hip
repl
acem
ent
Per
form
ance
-bas
ed
redu
ced
corr
ecte
d VA
, ne
ar d
epth
pre
cept
ion,
or
cont
rast
sen
sitiv
ity
Diffi
culty
to p
erfo
rm ≥
3
IAD
L or
Nag
i- an
d R
B-li
ke
mob
ility
item
s
Ass
ocia
tion
-A
ge, e
duca
tion,
mar
ital s
tatu
s, l
ivin
g si
tuat
ion,
med
ical
con
ditio
ns, h
abits
/ m
edic
atio
n, p
hysi
olog
ic m
easu
res
Rub
in e
t al.
(199
4)B
altim
ore
Stu
dyn
= 22
2, ≥
65
yrs,
N
onin
stitu
tiona
lized
, M
MS
E ≥
18,
abl
e to
st
and
unas
sist
ed
Per
form
ance
-bas
ed
redu
ced
habi
tual
VA
, co
ntra
st s
ensi
tivity
, gla
re,
and
ster
eoac
uity
Dis
abili
ty s
core
(Diffi
culty
to
per
form
AD
L, IA
DL,
and
N
agi-
and
RB
-like
mob
ility
ite
ms)
Ass
ocia
tion
betw
een
cont
rast
sen
sitiv
ity a
nd
mob
ility
+
Oth
er a
ssoc
iatio
ns -
Age
, gen
der,
race
, num
ber o
f m
edic
al c
ondi
tions
Sal
ive
et a
l. (1
994)
Est
ablis
hed
Pop
ulat
ions
for t
he
Epi
dem
iolo
gica
l S
tudi
es o
f the
Eld
erly
(E
PE
SE
)
n =
5 14
3, ≥
70
yrs
Per
form
ance
-bas
ed
decr
ease
d ha
bitu
al V
A In
abili
ty to
per
form
≥ 1
AD
L ta
sk a
nd N
agi-
and
RB
-like
m
obili
ty it
ems
Ass
ocia
tion
with
AD
L +
Ass
ocia
tion
with
mob
ility
+A
ge, g
ende
r, ra
ce, s
ite, i
ncom
e,
diab
etes
mel
litus
, stro
ke
Dar
gent
-M
olin
a et
al.
(199
6)
Epi
dem
iolo
gy
of O
steo
poro
sis
(EP
IDO
S) (
Par
isia
n sa
mpl
e)
n =
1 21
0, ≥
75
yrs,
N
onin
stitu
tiona
lized
, no
hist
ory
of h
ip fr
actu
re
or re
plac
emen
t, no
rmal
co
gniti
ve fu
nctio
n,
ambu
lato
ry
Per
form
ance
-bas
ed
decr
ease
d co
rrec
ted
VA,
dept
h pe
rcep
tion,
or
cont
rast
sen
sitiv
ity
Inab
ility
to p
erfo
rm ≥
1
IAD
L in
depe
nden
tlyA
ssoc
iatio
n w
ith V
A ≤
0.2
an
d co
ntra
st s
ensi
tivity
+
Ass
ocia
tion
with
dep
th
perc
eptio
n -
Age
Wes
t et a
l. (1
997)
Sal
isbu
ry E
ye
Eva
luat
ion
Pro
ject
(S
EE
)
n =
2 52
0, 6
5–84
yrs
, N
onin
stitu
tiona
lized
, ab
le to
trav
el to
clin
ic,
MM
SE
> 1
7
Per
form
ance
-bas
ed
habi
tual
VA
< 0.
5D
ifficu
lty w
ith ≥
1 A
DL
and
IAD
LA
ssoc
iatio
n +
Age
, gen
der,
race
Wes
t et a
l. (2
002b
)S
alis
bury
Eye
E
valu
atio
n P
roje
ct
(SE
E)
n =
2 52
0, 6
5–84
yrs
, N
onin
stitu
tiona
lized
, ab
le to
trav
el to
clin
ic,
MM
SE
> 1
7
Per
form
ance
-bas
ed
decr
ease
d ha
bitu
al V
A
and
cont
rast
sen
sitiv
ity
Spe
ed in
per
form
ing
mob
ility
task
sA
ssoc
iatio
n +
Age
, gen
der,
race
, edu
catio
n,
cogn
itive
sco
re, n
umbe
r of c
omor
bid
cond
ition
s
* F
unct
iona
l lim
itatio
ns a
re a
sses
sed
as a
ctiv
ities
of d
aily
livi
ng (A
DL)
(e.g
. eat
ing,
was
hing
, and
dre
ssin
g), i
nstr
umen
tal a
ctiv
ities
of d
aily
livi
ng (I
AD
L) (e
.g. c
lean
ing,
laun
dry,
sho
ppin
g, a
nd
bank
ing)
, Nag
i-lik
e ph
ysic
al p
erfo
rman
ce it
ems
(e.g
. sta
ndin
g, w
alki
ng, a
nd c
arry
ing
wei
ghts
), an
d R
osow
-Bre
slau
item
s (R
B) (e
.g. w
alki
ng h
alf a
mile
, clim
bing
sta
irs, a
nd d
oing
hea
vy
hous
ewor
k). M
MS
E =
the
Min
i-Men
tal S
tate
Exa
min
atio
n.

37
Tabl
e 4a
. Su
mm
ary
of p
rosp
ectiv
e po
pula
tion-
base
d st
udie
s eva
luat
ing
the
asso
ciat
ion
betw
een
redu
ced
self-
repo
rted
vis
ual
func
tion
and
func
tiona
l lim
itatio
ns*.
ref
eren
ce
st
udy
pa
rtic
ipan
ts, a
ge
grou
p, a
nd in
clus
ion
crite
ria a
t bas
elin
e
follo
w-
upM
easu
res
of re
duce
d vi
sual
func
tion
Mea
sure
s of
fun
ctio
nal
limita
tions
res
ults
A
djus
ted
varia
bles
Mor
et a
l. (1
989)
Long
itudi
nal S
tudy
of
Agi
ng (L
SO
A)
n =
852,
70–
74 y
rs,
Non
inst
itutio
naliz
ed,
inta
ct in
func
tiona
l lim
itatio
ns
2 yr
sS
elf-r
epor
ted
troub
le w
ith
visi
onIn
abili
ty to
in
depe
nden
tly
perfo
rm ≥
1 A
DL
or IA
DL
or m
odifi
ed
Nag
i’s p
hysi
cal
perfo
rman
ce a
nd
mob
ility
-rel
ated
ite
ms
Ass
ocia
tion
+G
ende
r, ra
ce, m
arita
l sta
tus,
ed
ucat
ion,
inco
me,
livi
ng
situ
atio
n, h
ealth
sta
tus,
life
styl
e ac
tiviti
es
Lafo
rge
et a
l. (1
992)
Stu
dy o
f the
Wel
l-be
ing
of O
lder
P
eopl
e in
Cle
vela
nd
n =
1 31
5, ≥
65
yrs,
N
onin
stitu
tiona
lized
, m
edic
are-
elig
ible
1 yr
Sel
f-rep
orte
d vi
sual
im
pairm
ent
Inab
ility
to
inde
pend
ently
pe
rform
AD
L an
d IA
DL
task
s
Cor
rela
tion
with
dec
line
in fu
nctio
nal
limita
tions
+ (n
o co
rrel
atio
n if
AD
L de
pend
ent a
lread
y at
bas
elin
e)
Age
, gen
der,
cogn
itive
dy
sfun
ctio
n
Rud
berg
et a
l. (1
993)
Long
itudi
nal S
tudy
of
Agi
ng (L
SO
A)
n =
4 45
2, ≥
70
yrs,
N
onin
stitu
tiona
lized
4 yr
sH
avin
g ca
tara
ct, g
lauc
oma,
de
tach
ed re
tina,
oth
er
retin
al c
ondi
tion,
blin
d in
on
e or
bot
h ey
es, t
roub
le
seei
ng
Diffi
culti
es in
AD
LA
ssoc
iatio
n w
ith in
crea
sed
disa
bilit
y +
Age
, gen
der,
race
, mar
ital s
tatu
s,
educ
atio
n, B
MI,
chro
nic
dise
ases
Kap
lan
et a
l. (1
993)
Ala
med
a C
ount
y S
tudy
n =
356,
≥ 6
5 yr
s,
Non
inst
itutio
naliz
ed6
yrs
Sel
f-rep
orte
d po
or o
r fai
r vi
sion
Func
tion
scal
e sc
ore
(Diffi
culti
es in
A
DL,
IAD
L, a
nd R
B)
Ass
ocia
tion
with
cha
nge
in
func
tion
-A
ge, b
asel
ine
func
tion
Reu
ben
et a
l. (1
999)
Nat
iona
l Hea
lth a
nd
Nut
ritio
n E
xam
inat
ion
Sur
vey
(NH
AN
ES
I)
and
its E
pide
mio
logi
c Fo
llow
-up
Stu
dy
(NH
EFS
)
n =
5 64
6, 5
5–74
yrs
, N
onin
stitu
tiona
lized
10 y
rsS
elf-r
epor
ted
troub
le w
ith
visi
onN
eedi
ng a
ssis
tanc
e in
≥ 1
AD
L, IA
DL,
an
d R
B
Ass
ocia
tion
+A
ge, g
ende
r, ra
ce, e
duca
tion,
pa
st A
MI,
diab
etes
mel
litus
, hy
perte
nsio
n, h
eart
failu
re,
hear
ing
impa
irmen
t
Wal
lhag
en e
t al
. (20
01)
Ala
med
a C
ount
y S
tudy
n =
2 44
2, ≥
50
yrs,
N
onin
stitu
tiona
lized
, su
rviv
ors
of o
rigin
al
stud
y
1 yr
Sco
re o
f sel
f-rep
orte
d di
fficu
lties
in s
eein
gTr
oubl
es in
AD
L,
IAD
L, N
agi-
and
RB
-like
phy
sica
l pe
rform
ance
and
m
obili
ty it
ems
Ass
ocia
tion
with
mild
vis
ual
impa
irmen
t and
AD
L, IA
DL
and
mob
ility
+
Ass
ocia
tion
with
mild
vis
ual
impa
irmen
t and
phy
sica
l pe
rform
ance
- A
ssoc
iatio
n w
ith m
oder
ate
visu
al
impa
irmen
t and
AD
L, IA
DL
and
phys
ical
per
form
ance
+
Ass
ocia
tion
with
mod
erat
e vi
sual
im
pairm
ent a
nd m
obili
ty -
Age
, gen
der,
ethn
icity
, edu
catio
n,
mar
ital s
tatu
s, c
hron
ic c
ondi
tions
, ba
selin
e di
sabi
lity,
hea
ring
impa
irmen
t
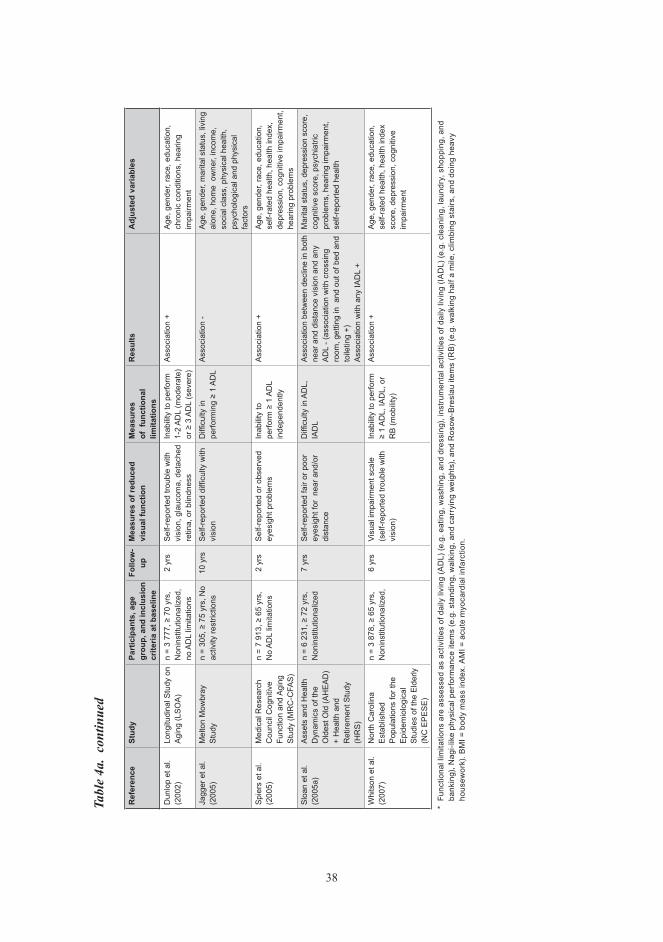
38
ref
eren
ce
st
udy
pa
rtic
ipan
ts, a
ge
grou
p, a
nd in
clus
ion
crite
ria a
t bas
elin
e
follo
w-
upM
easu
res
of re
duce
d vi
sual
func
tion
Mea
sure
s of
fun
ctio
nal
limita
tions
res
ults
A
djus
ted
varia
bles
Dun
lop
et a
l. (2
002)
Long
itudi
nal S
tudy
on
Agi
ng (L
SO
A)
n =
3 77
7, ≥
70
yrs,
N
onin
stitu
tiona
lized
, no
AD
L lim
itatio
ns
2 yr
sS
elf-r
epor
ted
troub
le w
ith
visi
on, g
lauc
oma,
det
ache
d re
tina,
or b
lindn
ess
Inab
ility
to p
erfo
rm
1-2
AD
L (m
oder
ate)
or
≥ 3
AD
L (s
ever
e)
Ass
ocia
tion
+A
ge, g
ende
r, ra
ce, e
duca
tion,
ch
roni
c co
nditi
ons,
hea
ring
impa
irmen
t
Jagg
er e
t al.
(200
5)M
elto
n M
owbr
ay
Stu
dyn
= 30
5, ≥
75
yrs,
No
activ
ity re
stric
tions
10 y
rsS
elf-r
epor
ted
diffi
culty
with
vi
sion
Diffi
culty
in
perfo
rmin
g ≥
1 A
DL
Ass
ocia
tion
-A
ge, g
ende
r, m
arita
l sta
tus,
livi
ng
alon
e, h
ome
ow
ner,
inco
me,
so
cial
cla
ss, p
hysi
cal h
ealth
, ps
ycho
logi
cal a
nd p
hysi
cal
fact
ors
Spi
ers
et a
l. (2
005)
Med
ical
Res
earc
h C
ounc
il C
ogni
tive
Func
tion
and
Agi
ng
Stu
dy (M
RC
-CFA
S)
n =
7 91
3, ≥
65
yrs,
N
o A
DL
limita
tions
2 yr
sS
elf-r
epor
ted
or o
bser
ved
eyes
ight
pro
blem
sIn
abili
ty to
pe
rform
≥ 1
AD
L in
depe
nden
tly
Ass
ocia
tion
+A
ge, g
ende
r, ra
ce, e
duca
tion,
se
lf-ra
ted
heal
th, h
ealth
inde
x,
depr
essi
on, c
ogni
tive
impa
irmen
t, he
arin
g pr
oble
ms
Slo
an e
t al.
(200
5a)
Ass
ets
and
Hea
lth
Dyn
amic
s of
the
Old
est O
ld (A
HE
AD
) +
Hea
lth a
nd
Ret
irem
ent S
tudy
(H
RS
)
n =
6 23
1, ≥
72
yrs,
N
onin
stitu
tiona
lized
7 yr
sS
elf-r
epor
ted
fair
or p
oor
eyes
ight
for
near
and
/or
dist
ance
Diffi
culty
in A
DL,
IA
DL
Ass
ocia
tion
betw
een
decl
ine
in b
oth
near
and
dis
tanc
e vi
sion
and
any
A
DL
- (as
soci
atio
n w
ith c
ross
ing
room
, get
ting
in a
nd o
ut o
f bed
and
to
iletin
g +)
A
ssoc
iatio
n w
ith a
ny IA
DL
+
Mar
ital s
tatu
s, d
epre
ssio
n sc
ore,
co
gniti
ve s
core
, psy
chia
tric
prob
lem
s, h
earin
g im
pairm
ent,
self-
repo
rted
heal
th
Whi
tson
et a
l. (2
007)
Nor
th C
arol
ina
Est
ablis
hed
Pop
ulat
ions
for t
he
Epi
dem
iolo
gica
l S
tudi
es o
f the
Eld
erly
(N
C E
PE
SE
)
n =
3 87
8, ≥
65
yrs,
N
onin
stitu
tiona
lized
,6
yrs
Visu
al im
pairm
ent s
cale
(s
elf-r
epor
ted
troub
le w
ith
visi
on)
Inab
ility
to p
erfo
rm
≥ 1
AD
L, IA
DL,
or
RB
(mob
ility
)
Ass
ocia
tion
+A
ge, g
ende
r, ra
ce, e
duca
tion,
se
lf-ra
ted
heal
th, h
ealth
inde
x sc
ore,
dep
ress
ion,
cog
nitiv
e im
pairm
ent
* F
unct
iona
l lim
itatio
ns a
re a
sses
sed
as a
ctiv
ities
of d
aily
livi
ng (A
DL)
(e.g
. eat
ing,
was
hing
, and
dre
ssin
g), i
nstr
umen
tal a
ctiv
ities
of d
aily
livi
ng (I
AD
L) (e
.g. c
lean
ing,
laun
dry,
sho
ppin
g, a
nd
bank
ing)
, Nag
i-lik
e ph
ysic
al p
erfo
rman
ce it
ems
(e.g
. sta
ndin
g, w
alki
ng, a
nd c
arry
ing
wei
ghts
), an
d R
osow
-Bre
slau
item
s (R
B) (e
.g. w
alki
ng h
alf a
mile
, clim
bing
sta
irs, a
nd d
oing
hea
vy
hous
ewor
k). B
MI =
bod
y m
ass
inde
x. A
MI =
acu
te m
yoca
rdia
l inf
arct
ion.
Tabl
e 4a
. co
ntin
ued

39
Tabl
e 4b
. Su
mm
ary
of p
rosp
ectiv
e po
pula
tion-
base
d st
udie
s eva
luat
ing
the
asso
ciat
ion
betw
een
redu
ced
perf
orm
ance
-bas
ed
visu
al fu
nctio
n an
d fu
nctio
nal l
imita
tions
*.
ref
eren
ce
stud
y
part
icip
ants
, age
gr
oup,
and
incl
usio
n cr
iteria
at b
asel
ine
follo
w-
up
Mea
sure
s of
redu
ced
visu
al
func
tion
Mea
sure
s of
fun
ctio
nal
limita
tions
res
ults
A
djus
ted
varia
bles
Sal
ive
et a
l. (1
994)
Est
ablis
hed
Pop
ulat
ions
for t
he
Epi
dem
iolo
gica
l S
tudi
es o
f the
E
lder
ly (E
PE
SE
)
n =
3 13
3, ≥
70
yrs,
N
o m
obili
ty o
r AD
L lim
itatio
ns
15
mon
ths
Per
form
ance
-bas
ed d
ecre
ased
ha
bitu
al V
AIn
abili
ty to
per
form
≥ 1
A
DL
task
and
Nag
i- an
d R
S-li
ke m
obili
ty it
ems
Ass
ocia
tion
betw
een
seve
re v
isua
l im
pairm
ent
(VA
< 0.
1) a
nd A
DL
+ A
ssoc
iatio
n be
twee
n se
vere
vis
ual i
mpa
irmen
t an
d m
obili
ty +
Age
, gen
der,
race
, site
, in
com
e, d
iabe
tes
mel
litus
, st
roke
Reu
ben
et
al. (
1999
)N
atio
nal H
ealth
an
d N
utrit
ion
Exa
min
atio
n S
urve
y (N
HA
NE
S I)
and
its
Epi
dem
iolo
gic
Follo
w-u
p S
tudy
(N
HE
FS)
n =
5 64
6, 5
5–74
yrs
, N
onin
stitu
tiona
lized
10 y
rsP
erfo
rman
ce-b
ased
hab
itual
VA
≤ 0.
5N
eedi
ng a
ssis
tanc
e in
≥ 1
A
DL,
IAD
L, a
nd R
BA
ssoc
iatio
n be
twee
n VA
≤ 0
.5 a
nd A
DL
and
IAD
L +
Ass
ocia
tion
betw
een
VA
≤ 0.
5 an
d R
B -
Age
, gen
der,
race
, edu
catio
n,
past
AM
I, di
abet
es m
ellit
us,
hype
rtens
ion,
hea
rt fa
ilure
, he
arin
g im
pairm
ent
Lin
et a
l. (2
004)
Stu
dy o
f O
steo
poro
tic
Frac
ture
s (S
OF)
(v
isits
4 a
nd 5
)
n =
1 45
3, ≥
69
yrs,
N
onin
stitu
tiona
lized
, no
hist
ory
of h
ip fr
actu
re
or re
plac
emen
t, w
omen
, sur
vivo
rs o
f or
igin
al s
tudy
4 yr
sP
erfo
rman
ce-b
ased
hab
itual
VA
< 0.
5D
ifficu
lty s
core
(diffi
culty
in
per
form
ing
IAD
L an
d N
agi-l
ike
phys
ical
pe
rform
ance
item
s)
Ass
ocia
tion
betw
een
VA <
0.5
and
incr
ease
in
diffi
culty
sco
re
Age
, edu
catio
n, m
edic
al
com
orbi
ditie
s, h
earin
g im
pairm
ent,
smok
ing,
B
MI,
bent
zodi
azep
ine
use,
ba
selin
e fu
nctio
nal s
tatu
s,
grip
stre
nght
, wal
king
spe
ed,
soci
al in
tera
ctio
ns
Wes
t et a
l. (2
005)
Sal
isbu
ry E
ye
Eva
lutio
n P
roje
ct
(SE
E)
n =
2 24
0, 6
5–84
yrs
, N
onin
stitu
tiona
lized
, no
diffi
culty
in w
alki
ng o
r st
air-
clim
bing
2 yr
sP
erfo
rman
ce-b
ased
hab
itual
VA
< 0.
5, v
isua
l fiel
d (<
30
poin
ts
mis
sed)
, or c
ontra
st s
ensi
tivity
(log
co
ntra
st s
ensi
tivity
< 1
.5)
Diffi
culty
in w
alki
ng a
nd
stai
r-cl
imbi
ng m
obili
ty
item
s
Ass
ocia
tion
with
VA
< 0.
5 an
d co
ntra
st
sens
itivi
ty -
Ass
ocia
tion
with
vis
ual
field
+
Age
, gen
der,
race
, MM
SE
, nu
mbe
r of c
hron
ic c
ondi
tions
Jaco
bs e
t al
. (20
05)
Jeru
sale
m
Lond
itudi
nal S
tudy
n =
261,
70
yrs,
N
onin
stitu
tiona
lized
7 yr
sP
erfo
rman
ce-b
ased
hab
itual
VA
≤ 0.
5N
eedi
ng a
ssis
tanc
e in
≥
1 A
DL
Ass
ocia
tion
betw
een
VA
≤ 0.
5 an
d A
DL
+G
ende
r, fin
anci
al d
ifficu
lties
, di
abet
es m
ellit
us,
hype
rtens
ion,
hea
rt di
seas
e,
visu
al im
pairm
ent,
self-
rate
d he
alth
, gen
eral
tire
dnes
s,
inde
pend
ence
in A
DL,
ph
ysic
al a
ctiv
ity, f
alls
, lo
nelin
ess,
hea
ring
acui
ty
* F
unct
iona
l lim
itatio
ns a
re a
sses
sed
as a
ctiv
ities
of d
aily
livi
ng (A
DL)
(e.g
. eat
ing,
was
hing
, and
dre
ssin
g), i
nstr
umen
tal a
ctiv
ities
of d
aily
livi
ng (I
AD
L) (e
.g. c
lean
ing,
laun
dry,
sho
ppin
g, a
nd
bank
ing)
, Nag
i-lik
e ph
ysic
al p
erfo
rman
ce it
ems
(e.g
. sta
ndin
g, w
alki
ng, a
nd c
arry
ing
wei
ghts
), an
d R
osow
-Bre
slau
item
s (R
B) (e
.g. w
alki
ng h
alf a
mile
, clim
bing
sta
irs, a
nd d
oing
hea
vy
hous
ewor
k). A
MI =
acu
te m
yoca
rdia
l inf
arct
ion.
BM
I = b
ody
mas
s in
dex.
MM
SE
= th
e M
ini-M
enta
l Sta
te E
xam
inat
ion.

40
despite this strong evidence of an association between vision and physical functioning, some conflicting results have also been reported. Kaplan et al. (1993) found that self-reported poor or fair vision did not predict a decline in function scale score based on adl, iadl, and rB limitations. in the alameda county study, results concerning the association between visual impairment and mobility limitation were inconsistent (wallhagen et al. 2001). two studies revealed no association between self-reported visual impairment and adl limitations (Jagger et al. 2005, sloan et al. 2005a), although in two other studies self-reported visual impairment was one of the strongest predictors of the two-year incidence of moderate and severe limitations in adl of the elderly (dunlop et al. 2002, spiers et al. 2005).
Inconsistencies in results may be due to differences in population samples and definitions of both visual impairment and functional limitations. most of the previous studies have been based on community-dwelling people, but inclusion criteria have differed between studies. two studies had included institutionalized persons in the analyses (Jagger et al. 2005, spiers et al. 2005). in addition, the assessment of self-reported visual impairment has varied and definitions and measurements of functional limitations have been diverse among studies. All of these variations render comparison of results difficult. Adjustment for various coexisting chronic conditions and modifying factors potentially affecting the association between vision and physical functioning may also explain some of the observed differences.
some earlier studies have also evaluated whether performance-based visual impairment predicts functional limitations. for practical reasons, most of the prospective studies have based their analyses on measured va although some cross-sectional studies have suggested that also other aspects of visual functions (i.e. visual field, stereopsis, contrast sensitivity, and glare) may be associated with the development of disability (rubin et al. 1994, dargent-molina et al. 1996, west et al. 2002a, west et al. 2002b). salive et al. (1994) found that severe visual impairment (VA < 0.1) increased 15-month incidence for adl and mobility limitations in persons aged 70 years and older after adjustment for sociodemographic factors and chronic diseases. Milder visual impairment (VA < 0.5) has also been found to predict subsequent adl and iadl limitations in a ten-year follow-up of persons aged 55–74 years at baseline (Reuben et al. 1999). This finding was confirmed in the Jerusalem Longitudinal Study, which reported that VA ≤ 0.5 was significantly associated with a seven-year decline in ADL functions in persons aged 70 years at baseline (Jacobs et al. 2005), and the study of osteoporotic fractures (sof), which found an association between VA < 0.5 and an increase in difficulty score during a four-year follow-up (lin et al. 2004). however, west et al. (2005) showed that visual field restrictions were associated with two-year incident walking and stair-climbing disability, but visual impairment (VA < 0.5) did not predict these mobility difficulties.
41
the strength of the link between visual impairment and functional limitations has also been examined. in the salisbury eye evaluation project (see), visual impairment (va < 0.5) increased the likelihood of ADL and IADL limitations twofold after adjustment for some sociodemographic factors (west et al. 1997). also in an italian study and in EPIDOS, VA ≤ 0.2 and VA < 0.4 were found to increase the likelihood of IADL limitations twofold (carabellese et al. 1993, dargent-molina et al. 1996). in the epese, moderate visual impairment (VA < 0.3 but ≥ 0.1) also increased the likelihood of ADL and mobility limitations twofold, but severe visual impairment (VA < 0.1) increased ADL limitations fivefold and mobility limitations threefold (Salive et al. 1994). This suggests that the probability of functional limitations increases with decreasing va. these studies were based on cross-sectional analyses, but also in prospective analyses persons with VA ≤ 0.5 have had 2–3 times greater risk for adl and iadl limitations than persons with va > 0.5 (reuben et al. 1999, Jacobs et al. 2005). however, salive et al. (1994) found no increase in relative risk of new ADL limitations until VA had decreased to < 0.1. Severe visual impairment increased the relative risk of new adl limitations threefold over a 15-month period. the relative risk of new mobility limitations was increased fourfold (salive et al. 1994). reuben et al. (1999), on the contrary, found that self-reported visual impairment predicted mobility-related limitations (i.e. walking a quarter mile, climbing up and down at least two steps, and performing heavy chores), whereas performance-based visual impairment did not. however, baseline functional status was not adjusted in this study. overall, both cross-sectional and prospective studies have reported fairly similar results concerning the strength of the association between visual impairment and physical functioning.
to obtain more detailed information about which physical functions are particularly prone to the effect of worsening vision, a few previous studies have analyzed the association between self-reported visual impairment and difficulties in separating ADL and IADL tasks (Branch et al. 1989, crews and campbell 2004, swanson and mcgwin 2004, sloan et al. 2005a). in addition, one study evaluated the impact of va level on separate adl and iadl tasks (dahlin-ivanoff et al. 2000). visual function seems to have a greater impact on performance of iadl tasks than adl tasks. results concerning separate adl tasks have been more inconsistent (Branch et al. 1989, dahlin-ivanoff et al. 2000, crews and campbell 2004, swanson and mcgwin 2004, sloan et al. 2005a). however, as va level decreased, the proportion of persons needing personal assistance in several adl and iadl tasks increased. already at a va of 0.5–0.7, the relative risk for needing assistance was higher than for persons with normal vision (va 0.8–1.0) (dahlin-ivanoff et al. 2000). in addition, the relationship between decreasing va and mobility tasks is linear, and no evident threshold level for decreased functioning has been identified (West et al. 2002b). for example, results of performance-based mobility tests (i.e. a timed 4-m walk test

42
and chair test) have revealed significant deterioration at the early stages of decreasing va, although more than half of the subjects had unaffected mobility functions until va decreased to ≤ 0.2 (West et al. 2002b).
how visual impairment causes disability remains unknown. visual function is known to play an important role in balance, orientation, and gait, but some of the decreased mobility may be due to the fear of falling (marron and Bailey 1982, stones and Kozma 1987, manchester et al. 1989, tobis et al. 1990, era et al. 1996, lord et al. 1996, Klein et al. 1998, lord and menz 2000, anand et al. 2003, Klein et al. 2003, lee and scudds 2003). in addition, visual impairment may predispose to cognitive impairment and depressive symptoms leading to disability, as suggested by previous studies (lin et al. 2004, reyes-ortiz et al. 2005, sloan et al. 2005a, chou 2008). persons with self-reported visual impairment have been more likely to have lower levels of social relationship and participation, e.g. visiting friends, attending church, or going to the movies (carabellese et al. 1993, crews and campbell 2004). coexisting with other chronic health conditions, e.g. hearing or cognitive impairment, visual impairment has been found to increase the risk for functional limitations more than visual impairment alone (laforge et al. 1992, reuben et al. 1999, lin et al. 2004, whitson et al. 2007).
in conclusion, previous studies suggest that visual impairment increases the risk for functional limitations two- to fourfold depending on the severity of decreased visual functioning. Both the prevalence of functional limitations and visual impairment are high in the elderly, indicating that the need for assistance will increase substantially in the future.
2.4 need for assistancethe majority of persons with functional limitations live in the community independently or with the assistance of either family members and friends (informal help) or health and social services (formal help). in finland, municipalities have the responsibility of organizing health and social services for the disabled. however, individual municipalities have their own criteria for need for assistance when granting these services. in addition, especially social services are fragmented into numerous separate services, e.g. home care, meals-on-wheels, transportation, and home environment modifications, which may predispose to a shortfall in assistance.
previous studies have shown that assistance provided does not always meet the need. for example, in people with adl or iadl limitations, the prevalence of unmet need for assistance has varied between 9% and 21% (tennstedt et al. 1994, desai et al. 2001, Kennedy 2001, laplante et al. 2004). unmet need for assistance in tasks of everyday living may have negative consequences on a person’s quality of life and be a risk factor for increased health care use and institutionalization (allen and mor 1997, chenier 1997,
43
desai et al. 2001, laplante et al. 2004). the estimates of current met and unmet need for assistance may give some insight into the future need for health and social services to enable people to continue living at home. however, very little information exists on the total and unmet need for assistance in visually impaired people.
visual impairment has been shown to be one of the factors associated with increased use of community support services (wang et al. 1999a). Based on the Blue mountains Eye Study, people with visual impairment (VA ≤ 0.5) were 2–3 times more likely to use community support services or rely on informal regular help than community-dwelling people with normal vision (wang et al. 1999b, wang et al. 1999c). a similar result was reported in the Aged Care Client Study (ACCS) when the visually impaired (VA ≤ 0.25) were compared with persons with better va (tay et al. 2007). visual impairment has also been associated with a higher incidence of nursing home admission (wang et al. 2001, wang et al. 2003b). This is in accordance with the finding that more than one-tenth (11–14%) of institutionalized middle-aged or older persons have severe low vision (VA ≤ 0.1) compared with only 0.5–0.9% of those living in the community (Tielsch et al. 1995, Mitchell et al. 1997b). The high rate of institutionalization among the visually impaired may reflect the unmet need for assistance in managing at home. Branch et al. (1989) have also found that older people who reported a decline in their vision were receiving no more health or social services than persons without subsequent vision decline, although the decline in vision was associated with increased functional limitations and unmet need. Specific factors associated with the unmet need for assistance in visually impaired persons are unknown.
2.5 Use of eye care services
2.5.1 Eye examinations
earlier studies have revealed that a substantial proportion of people are unaware of their eye diseases. tielsch et al. (1991b) noted that glaucoma was undiagnosed in about half of the glaucoma patients in the Baltimore eye study. mccarty et al. (1998) and mcKay et al. (2000) reported that almost one-third of their australian subjects with diagnosed dm had never seen an ophthalmologist and only about half of them had had a retinal examination within the last two years. Both of these eye diseases are treatable in most cases, but are typically asymptomatic in their early stages. several studies have also reported that 34–68% of visual impairment (VA < 0.33 or VA < 0.5) could be treated with adequate refraction correction (tielsch et al. 1990, reinstein et al. 1993, taylor et al. 1997, foran et al. 2002). regular eye examinations have been found to reduce the decline in vision as well as in functional status (picone et al. 2004, sloan et al. 2005b). thus, timely treatment of underlying eye diseases and refractive errors is the best way to

44
prevent vision-related disability. to identify subgroups of the population lacking adequate eye health care services, information about sociodemographic and other factors affecting the use of eye care and vision rehabilitation is needed.
the melbourne visual impairment project and the Blue mountains eye study reported that 44–45% of middle-aged or elderly persons living in the community had had a vision examination during the past year, 62–63% during the past two years, and 80–88% during the past five years (wang et al. 1999a, Keeffe et al. 2002, Bylsma et al. 2004). in the Salisbury Eye Evaluation Study, 64% of persons aged 65–84 years had seen an eye care provider in the past year (orr et al. 1999). Of persons aged 40 years and older, 9% had never seen an ophthalmologist or an optometrist (Bylsma et al. 2004). little is known about the associations of sociodemographic and other variables with the use of eye health care services. male gender, rural residence, decreased cognitive capacity, and lack of eye symptoms have most consistently been associated with nonparticipation in eye examinations (orr et al. 1999, wang et al. 1999a, Keeffe et al. 2002). people with a low socioeconomic status have been more likely to have uncorrected refractive errors (liou et al. 1999, foran et al. 2002, munoz et al. 2002, thiagalingam et al. 2002), but results concerning the association between low socioeconomic status and eye examinations are only suggestive (Klein et al. 1994b, orr et al. 1999, Keeffe et al. 2002).
in visually impaired persons, the rate of vision examinations has been similar to that in the general population. of visually impaired persons in north america and australia (va ≤ 0.5), 45–66% had had a vision examination during the past 1–2 years and 77% during the past five years (Orr et al. 1999, Bylsma et al. 2004). However, 5% had never seen an ophthalmologist or an optometrist (Bylsma et al. 2004). earlier studies have reported an association between visual impairment and low socioeconomic status (Kirchner and peterson 1979, dana et al. 1990, tielsch et al. 1991a, salive et al. 1992, Klein et al. 1994a, coppin et al. 2006). this association may be due to sociodemographic differences in the prevalence of eye diseases causing visual impairment or unequal distribution of the use of eye care services. associations between sociodemographic and other factors and use of eye care services in visually impaired persons have been investigated in only a few studies. orr et al. (1999) reported that low educational level and absence of eye problems were associated with nonparticipation of visually impaired persons in an eye examination. lupsakko et al. (2003) noted that only one-third of the visually impaired (va < 0.3) aged 75 years or older with reduced cognitive function had been examined by an ophthalmologist within the last four years.
living in a nursing home may also increase the probability of infrequent use of eye care services. in addition to visual impairment, cognitive impairment and other chronic conditions are also common in institutionalized people. the role of visual impairment as a cause of declining physical or mental functioning may therefore be difficult to recognize.

45
Treatment of uncorrected refractive errors, for example, may significantly improve an institutionalized person’s visual ability as well as their quality of life and physical functioning (Owsley et al. 2007). In the Baltimore Nursing Home Eye Survey, 40% of blindness in institutionalized persons was treatable or preventable with an appropriate intervention, especially with cataract surgery (tielsch et al. 1995). new spectacles could have corrected 37% of visual impairment (VA > 0.1 but < 0.5) and 20% of blindness (VA ≤ 0.1) (tielsch et al. 1995). as part of an intervention study among nursing home residents, 23% of visual impairment (VA < 0.5) was found to be correctable with spectacles (west et al. 2003). de winter et al. (2004) estimated that vision could be improved in 65% of institutionalized people with visual impairment (VA < 0.4) via cataract extraction and/or low vision aids.
2.5.2 Low vision rehabilitation
prevention, early detection, and treatment of eye diseases and subsequent visual impairment are essential ways of reducing disability. in the case of irremediable visual impairment, the aim of low vision rehabilitation is to overcome the visual disability with optical or other devices and adaptive skills. Several intervention studies have evaluated the benefit and success of low vision rehabilitation (nilsson 1990, van rens et al. 1991, virtanen and laatikainen 1991, Bischoff 1995, shuttleworth et al. 1995, raasch et al. 1997, watson et al. 1997a, watson et al. 1997b, harper et al. 1999, margrain 2000, scanlan and cuddeford 2004, Edmonds and Edmonds 2006). Based on these studies, 23–100% of visually impaired persons may benefit from low vision rehabilitation. Different interventions and definitions for success of low vision rehabilitation have made the results difficult to compare.
some studies have also evaluated the long-term success of low vision rehabilitation. nilsson (1986, 1988) and nilsson and nilsson (1986) investigated the low-vision patients attending the low vision clinic in linköping. the mean va of low vision patients at baseline varied from 0.17 to 0.35 depending on the cause of low vision. After the first series of rehabilitation visits, including optical aids and educational training, 94–100% of persons with low vision were able to see a TV picture satisfactorily, 49–88% were able to read TV text, 98–100% were able to read newspaper headlines, and 93–100% were able to read newspaper text (nilsson 1986, nilsson and nilsson 1986, nilsson 1988). during the follow-up of 6 months to 8 years, the proportions of persons managing these tasks declined but rebounded after a new series of rehabilitation visits. the results of low vision rehabilitation seem to be long-lasting, but follow-up visits are required to ensure that low vision aids and educational training continue to meet patients’ needs. however, the capacity to perform various vision-related tasks may be better at the low vision clinic than at home due to standardized conditions (leat et al. 1994). of visually impaired persons,

46
74–81% report using their low vision aids regularly (van Rens et al. 1991, Leat et al. 1994, Bischoff 1995). The continued use of low vision aids probably reflects the actual benefit gained by them.
one major reason for different results concerning the success of low vision rehabilitation in previous studies may be differencies in the training provided. educational training in the use of low vision aids and to improve adaptive skills has been shown to be important. the ability to see a tv picture or to read tv subtitles, newspaper headlines, and newspaper text increased significantly among low vision persons with AMD who received educational training in addition to being given low vision aids (nilsson 1990). among low vision patients who received only low vision aids and instructions on their use, visual abilities did not increase significantly. Other studies evaluating the impact of educational training on success of low vision rehabilitation have also reported that visually impaired persons receiving more comprehensive rehabilitation showed better results in reading, used their low vision aids more frequently, and were more satisfied with rehabilitation services (shuttleworth et al. 1995, scanlan and cuddeford 2004). low vision rehabilitation seems to also improve the quality of life (appollonio et al. 1996, scott et al. 1999, stelmack 2001, hinds et al. 2003).
in finland, people with untreatable eye disease(s) and permanent visual impairment (va < 0.3 with best refraction correction or binocular visual field < 60º or degree of disability ≥ 50% due to vision) are eligible for free low vision aids and related rehabilitation services (ministry of social affairs and health 2005). these free low vision aids are provided by health centers (e.g. recorders, dictating machines, and mobility aids) or by central hospitals (e.g. optical aids, electronic reading machines, computer-related add-ons, and guide dogs). the social insurance institution of finland is responsible for regulation of rehabilitation for seriously disabled persons younger than 65 years together with appropriate rehabilitation institutions (Act on Social Insurance Institutions’s Rehabilitation Benefits and Rehabilitation Monetary Benefits 2005/566). The rehabilitation of visually impaired persons aged 65 years and older is channelled by communal health care services (act on revision of primary health care act 1991/605, act on revision of specialized medical care 10 a § 1991/606, act on specialized medical care 1989/1062, decree on medical rehabilitation 1991/1015, primary health care act 1972/66).
a shortage of low vision rehabilitation services, especially among persons aged 65 years and older, is apparent. in the canadian study of health and aging, less than half of visually impaired (VA < 0.3) people aged 65 years and older had received rehabilitation services (Gresset and Baumgarten 2002). In the United Kingdom, 66% of persons registered as blind or partially sighted had undergone low vision aid assessment (williams et al. 2007). the proportion of visually impaired people receiving low vision rehabilitation services in finland is unknown.
47
3 AiMs of the study
the aim of this study was to estimate the prevalence and distribution of reduced visual acuity and major chronic eye diseases in the finnish population aged 30 years and older. Based on information collected in the large nationally representative health 2000 survey, the association of decreased vision with functioning and subsequent need for help and eye care services, including low vision rehabilitation, were analyzed.
Specific aims of this study were as follows:1. to estimate the prevalence of decreased va and visual impairment in finland.2. to assess the prevalence and distribution of major causes of decreased va and visual
impairment.3. to examine the effect of decreased vision on functioning by analyzing which
specific tasks are limited at various levels of VA independent of other coexistent conditions.
4. to assess the use of eye care services, including a vision examination and low vision rehabilitation, and need for assistance of visually impaired people and the role of sociodemographic and other factors in hampering adequate use of these services.
48
4 MAteriALs And Methods
4.1 study populationthis study was based on the health 2000 health examination survey, a nationwide population-based comprehensive survey of health and functional capacity in finland carried out from 2000 to 2001. the study in which several national institutes and universities participated was coordinated by the national public health institute. approval of the appropriate ethics committee was obtained. written informed consent was obtained from all participants.
The two-stage stratified cluster sample represented the population aged 30 years and older living on the finnish mainland. continental finland was divided into 20 strata: the 15 largest cities and five university hospital districts. Within the five strata representing the university hospital regions, each serving approximately one million inhabitants, 65 health care districts were sampled by applying the probability proportional to population size (pps) method to yield the primary sampling units. finally, a random sample of individuals (n = 8 028) was drawn from the 15 largest towns and the 65 smaller health care districts using systematic sampling from the national population register. persons aged 80 years and older were oversampled by doubling the sampling fraction. details of the sampling method have been published elsewhere (aromaa and Koskinen 2004, heistaro 2008).
In the first phase, a computer-aided interview (i.e. a home interview) was conducted at home by trained interviewers of statistics finland. the second phase comprised a comprehensive examination at a neighborhood screening center established for this survey, usually the local health center. the whole examination consisted of a nine-stage evaluation of subjects’ health and functional capacity. if the invited subjects did not attend, an abridged examination was conducted at home or in an institution, along with an abbreviated health interview (i.e. an abbreviated home interview) if a home interview had not been carried out earlier. to improve the response rate, an abridged interview was conducted by phone (i.e. a phone interview) for subjects unable or unwilling to participate in the interview at home. finally, a questionnaire corresponding to the abridged interview (i.e. a final questionnaire) was mailed to subjects not participating in any of the earlier interviews.
Of the sample, 49 persons (0.6%) had died before the interview and 566 (7.1%) refused to participate or could not be reached. The overall response rate was 92.9%. The age of the participants ranged from 30 to 99 years. those participants who could not be reached or who declined to participate were more often men living in metropolitan areas. Based on the register of the social insurance institution of finland, nonparticipants and
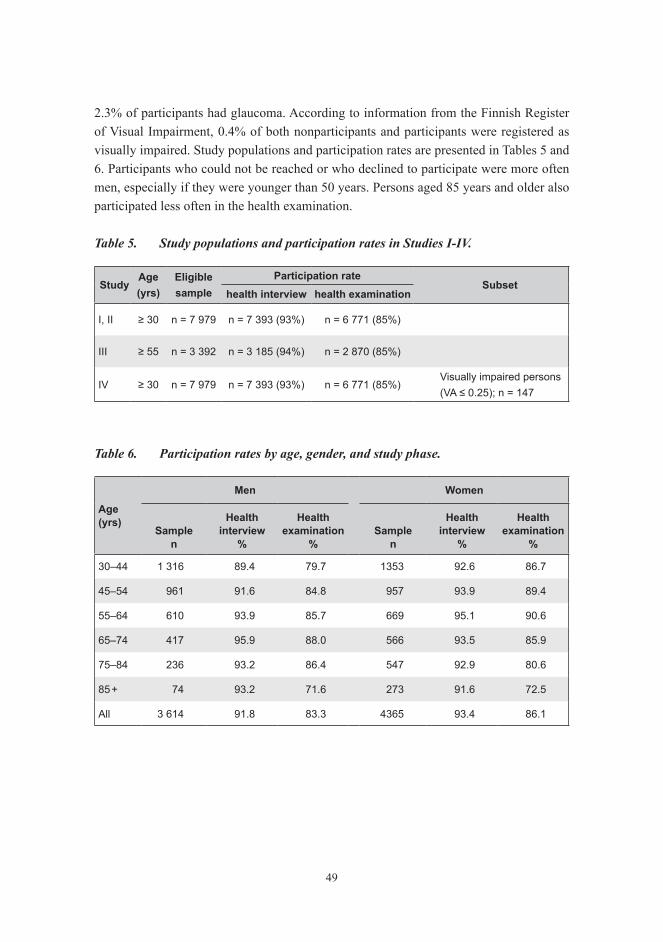
49
2.3% of participants had glaucoma. According to information from the Finnish Register of Visual Impairment, 0.4% of both nonparticipants and participants were registered as visually impaired. study populations and participation rates are presented in tables 5 and 6. participants who could not be reached or who declined to participate were more often men, especially if they were younger than 50 years. persons aged 85 years and older also participated less often in the health examination.
Table 5. Study populations and participation rates in Studies I-IV.
studyAge (yrs)
eligiblesample
participation ratesubset
health interview health examination
I, II ≥ 30 n = 7 979 n = 7 393 (93%) n = 6 771 (85%)
III ≥ 55 n = 3 392 n = 3 185 (94%) n = 2 870 (85%)
IV ≥ 30 n = 7 979 n = 7 393 (93%) n = 6 771 (85%)Visually impaired persons(VA ≤ 0.25); n = 147
Table 6. Participation rates by age, gender, and study phase.
Age (yrs)
Men women
samplen
health interview
%
health examination
%sample
n
health interview
%
health examination
%
30–44 1 316 89.4 79.7 1353 92.6 86.7
45–54 961 91.6 84.8 957 93.9 89.4
55–64 610 93.9 85.7 669 95.1 90.6
65–74 417 95.9 88.0 566 93.5 85.9
75–84 236 93.2 86.4 547 92.9 80.6
85 + 74 93.2 71.6 273 91.6 72.5
All 3 614 91.8 83.3 4365 93.4 86.1

50
4.2 visual function4.2.1 Visual acuity (I–IV)
habitual distance va was measured binocularly, with current spectacles if the participant usually wore them, at 4 m using a modification of the logMAR letter chart published by precision vision. habitual near vision was tested with the near vision chart complying with the same principles as the distance va chart. the test was performed at the subject’s preferred reading distance, which was allowed to differ from the commonly used distance of 40 cm. illumination was optimized to 350 lux or more on far and near vision charts. adequacy of illumination was assessed with an illuminometer (ec-1, hager inc., sweden). va values are presented as decimal (snellen) equivalents. Binocular va with current spectacles (habitual VA) ≥ 0.8 was defined as good vision, VA 0.5–0.63 as moderate vision, and VA 0.3–0.4 as reduced vision. Visual impairment was defined as binocular VA ≤ 0.25 based on WHO (1973) criteria. Binocular VA 0.1–0.25 was defined as low vision and VA < 0.1 as blindness.
4.2.2 self-reported visual function (i, iii)
visual disturbances were assessed by the following questions: (1) is your eyesight good enough (with glasses) to read normal newspaper text? (2) are you able to read tv text (with glasses) from a normal watching distance (about 3 m)? in finland, all television programs in a foreign language are broadcast with finnish subtitling, the height of which is about 4:100 of the height of the tv screen. (3) does your eyesight restrict your ability to move about? Moving about was divided into three categories: able, difficulties during twilight, and difficulties also in good lighting. First two questions were divided into categories: able, with difficulties, and unable. Question no. 1 was asked of all interviewed persons (i.e. those participating in a home interview, an abbreviated home interview, a phone interview, or a final questionnaire; n = 7 393). Question no. 2 was asked only of subjects participating in a home interview (n = 6 986). Question no. 3 was asked of subjects participating in a home interview or an abbreviated home interview (n = 7 087). to analyze the association between vision and functional limitations, self-reported capability was dichotomized to subjects without difficulties and subjects with difficulties or unable to read TV text.
51
4.3 Major eye diseases
4.3.1 self-reported eye diseases (ii)
Interviews and a final questionnaire included the following questions on eye diseases: “Has a doctor diagnosed one of the following diseases: cataract, glaucoma, degenerative fundus changes, or other visual defect or injury?” and/or “Have changes caused by diabetes been diagnosed in the fundus of your eye?” information on cataract and glaucoma was also obtained by a field physician based on patients’ disease history and symptoms during the comprehensive health examination.
4.3.2 ophthalmic data from registers and case records (ii)
to identify people with chronic eye diseases, we gathered information on the national hospital discharge register, the national medication reimbursement register, and the national prescription register concerning the entire sample (study ii, figure 1). the two latter-mentioned registers only included information on glaucoma. diagnosis codes of International Classification of Diseases (ICD) 8, 9, and 10 used are shown in study ii / table 1. for 1 243 persons, information on chronic eye diseases before the year 2002 was also traced from the case records of public central hospitals and offices of private ophthalmologists. these included 360 persons with or without self-reported eye diseases who had decreased VA (< 0.5) assessed in the survey examination, 317 persons who had reported eye diseases or difficulties in vision but VA was unknown, and 566 nonparticipants. Case records were obtained for 55%, 39%, and 14% of these individuals, respectively. the presence of chronic eye diseases was assessed based on icd codes or remarks on clinical examination.
4.4 physical functioning and need for assistance4.4.1 functioning measurements (iii)
Self-reported mobility functions were considered limited if the subject reported difficulties or inability in moving about, climbing one flight of stairs, or walking about half a kilometer without resting. Self-reported mobility was divided into three categories: no difficulties in any of the three tasks (i.e. mobility is not restricted), difficulties in at least one task (i.e. able to move about alone and without any aids, but with difficulty), and major difficulties in at least one task (i.e. able to move about, but only with help or in a wheelchair, with crutches or other aids, or totally unable to move about).

52
performance-based mobility measurements included testing the ability to walk 6.1 m, including timing (Bassey et al. 1992). walking was considered limited if the subject was unable to walk at a speed of 1.2 m/s or faster, which is required to cross the road safely (langlois et al. 1997). performance-based mobility was also considered limited if the subject was unable to stand up and sit down five times without using hands for help (chair test), to climb up two stairs (stair test), or to stand in tandem position for 10 s (balance test) (sievers et al. 1985, guralnik et al. 1994). in the tandem position, subjects stood with the heel of one foot directly in front of the other foot.
participation restrictions were evaluated with questions about activities of daily living (adl; getting in and out of bed, dressing and undressing, eating, washing oneself, going to the toilet, and ability to move about in the apartment) and instrumental activities of daily living (iadl; shopping, cooking, laundering, using the phone, and handling matters in public offices, e.g. banking). The following four alternatives were given: without difficulties, with minor difficulties, with major difficulties, not at all. ADL and IADL functions were considered limited if the subject reported difficulties or inability in one or more of the above tasks.
4.4.2 need for assistance (iv)
Need for assistance was evaluated with two questions: “Do you, because of your reduced functional capacity, repeatedly receive assistance or help in your everyday activities, e.g. household work, washing up, and shopping?” and “Would you need this kind of assistance or help?” a positive answer to either of these questions was considered to indicate a need for assistance. if a subject not already receiving assistance in his everyday activities reported needing this kind of help, he was considered to have an unmet need for assistance. furthermore, an unmet need for assistance was assessed by asking persons already receiving assistance: “Do you get enough help to manage at home?” The perceived need for assistance in the separate tasks of activities of daily living (adl; i.e. cooking, eating, washing, dressing and undressing, and taking care of medication) and instrumental activities of daily living (iadl; i.e. cleaning, laundry or other care of clothes, shopping, and handling other tasks outside home, e.g. banking) were also assessed.
4.5 Use of eye care services (IV)The health interview included questions on vision examinations during the past five years. the use of vision rehabilitation services was assessed by questions on the possession of spectacles, a magnifying glass because of poor sight, and/or some other vision aids, and the receiving of low vision rehabilitation (i.e. fitting of low vision aids, receiving

53
patient education, training for orientation and mobility, training for activities of daily living (adl), or consultation with a social worker). data on self-reported low vision rehabilitation therapy were supplemented with hospital records, which were available for 72% (106 people) of the visually impaired. Visually impaired people were considered to have received low vision rehabilitation if at least one rehabilitation practitioner at a low vision clinic had evaluated their need for low vision aids.
4.6 covariates (iii, iv)the sociodemographic factors used in analyses were age, gender, living arrangement, region of residence (i.e. living region), urbanicity, education, and income. living arrangement was divided into three categories: living with someone, living alone, and living in an institution. Region was classified as the metropolitan area (i.e. Helsinki university central hospital region) and other parts of the country. urbanicity was divided into two categories: urban or semi-urban and rural municipalities. education was divided into three categories: low (≤ 6 years of all-round education), middle (7–11 years of all-round education or ≤ 6 years of all-round education plus vocational school), and high (7–11 years of all-round education plus vocational school, matriculation examination, or a higher vocational institution or university). annual income adjusted for the number of consumption units in the household was obtained from national taxation records and classified into tertiles.
data on chronic diseases were based on self-reports. the following diseases were included separately: coronary heart disease (angina pectoris and/or myocardial infarction), hypertension, stroke, diabetes mellitus, rheumatoid arthritis, osteoarthritis, back disease, asthma, chronic obstructive pulmonary disease (copd), cancer, and parkinson’s disease.
Cognitive impairment was defined as a score of < 10/16 points in the short version of the mini-mental state examination (mmse) or less than 15 animal names memorized in one minute as part of the neuropsychological test battery of the consortium to establish a registry for alzheimer’s disease (cerad) when analyzing the association between VA and functional limitations. The cut-off score < 10/16 in the short version of MMSE provides a distribution corresponding to the cut-off score of < 24/30 used in the original mmse to determine cognitive impairment (suutama t, personal communication). when estimating the use of eye care services and need for assistance, the result of the short version of the MMSE was classified into tertiles.
Hearing threshold was measured in a quiet examination room using a screening audiometer (micromate 304, madsen electronics) in both ears at three frequencies: 0.5, 1, and 2 khz. the average hearing threshold of the better ear at the aforementioned frequencies was classified into four categories according to WHO (1991) recommendations:

54
normal (≤ 25 dB), mild impairment (26–40 dB), moderate impairment (41–60 dB), and severe impairment (≥ 61 dB).
Psychological symptoms, especially in the areas of anxiety and depression, were evaluated with the 12-item version of the general health Questionnaire (ghQ-12) (Pevalin 2000). Significant psychological symptoms were defined as a score of 3 or more points as suggested in previous reports (goldberg et al. 1997). diagnosis of clinical depression, including major depressive disorder and dysthymia during the past 12 months based on DSM-IV classification, was determined by a Finnish translation of the German computerized version of the structured mental health interview (m-cidi).
as an anthropometric measure, we used body mass index (Bmi). Bmi was calculated by dividing body weight (kg) by the height squared (m2). the body weight was measured with the subject wearing light clothing without shoes using the bioimpedance apparatus (inBody 3.0, Biospace inc., south Korea). Body height was measured using a tape measure fastened to the wall. self-reported information on body weight and height was used in case of nonattendance to the health examination. Bmi was divided into three categories: low weight (BMI ≤ 20 kg/m2), normal weight (20 < BMI < 30 kg/m2), and obesity (BMI ≥ 30 kg/m2).
Behavioral factors assessed included smoking and self-reported ambulatory doctor’s appointment during the past 12 months. smoking habits were categorized as nonsmokers, current smokers, and ex-smokers.
Social support was evaluated with the question: “From whom do you get practical help when needed?” The total number of persons reported as a source of help was classified into three categories: no one, 1 person, and ≥ 2 persons.
4.7 Statistical methodsthe sampling design was accounted for by using sudaan software (versions 9.0.0 and 9.0.1) for sas (versions v8 and v9.1; sas institute, cary, nc). the oversampling of persons aged 80 years and older was accounted for by weighting the observations. as an alternative to post-stratification weights, the SAS multiple imputation (MI) procedure with 15 or 50 imputations was used to estimate the impact of missing data on the distribution of va (rubin 1987). the single-chain markov chain monte carlo method with 200 burn-in iterations and 100 iterations was applied.
the prevalences of va for distance and near vision were calculated as percentages of the population of Study I stratified by age and gender. Prevalence of cataract, ARM, and glaucoma was estimated as a percentage of all participants (n = 7 413) of the health 2000 survey. Because self-reported diabetic retinopathy was assessed only in the home interview, its prevalence was assessed among participants of that phase alone (n = 6 986).

55
persons who had not reported chronic eye diseases and for whom we had no information on chronic eye diseases based on register data, case records, or the survey examination were presumed not to have chronic eye diseases.
agreement between self-reported and documented chronic eye diseases was assessed by overall kappa value (Fleiss 1981) in persons with VA < 0.5 (n = 360). The overall kappa statistic, which is a weighted average of stratum-specific kappa values, was used because the standard kappa statistic can be sensitive to confounding factors. in this case, age is strongly associated with eye diseases, and therefore, the stratification was based on age groups. The sensitivity of self-reported data was defined as the proportion of persons with a positive diagnosis in documented data matched by corrected positive reports in the interview (i.e. weighted number of positive in both / weighted number of positive in documented data x 100) and the specificity of self-reported data as the proportion of persons without a particular eye disease in documented data matched by correct negative reports in the interview (i.e. weighted number of negative in both / weighted number of negative in documented data x 100).
gender- and/or age-adjusted prevalences were determined with binomial logistic regression analysis in all studies. a multinomial generalized logistic model was used when the outcome variable was trichotomous.
In the Study III, the age- and gender-adjusted prevalence of difficulty in performing separate adl, iadl, and mobility tasks in different classes of va was determined. interactions between va, age, and gender were tested. the p-value was corrected for multiple tests using a sidak correction. associations between both va and functioning measures (adl, iadl, and mobility functions) and potential confounding variables were tested with a multinomial generalized logistic procedure adjusting for age and gender. Variables with significance of p < 0.20 were included in further analyses.
multivariate logistic regression models were used to assess the independent effect of va and self-reported visual function for distance on summary variables of adl, iadl, and mobility functions after controlling for confounding variables. the analysis was carried out by adding groups of variables one by one. first, the association between functioning measures and va was examined. variables assumed to precede impaired va and disability were then included in the model. finally, variables assumed to coexist with impaired va or to intervene between va and disability were included in the analyses. the effect of graded va on separate adl, iadl, and mobility functions was assessed, controlling for all confounding variables. Odds ratios with 95% confidence intervals were calculated.
in the study iv, the associations of the vision examination, vision rehabilitation services, and need for assistance with the covariates (sociodemographic variables, cognitive function, and mobility) were tested adjusting for age and gender. in addition to age and gender, covariates showing a statistical suggestive association (p ≤ 0.20) with the

56
outcome variables were included in multivariate logistic regression models. odds ratios with 95% confidence intervals were calculated.

57
5 RESULtS
5.1 Visual acuity
5.1.1 Visual acuity for distance vision
Binocular distance va measured with the subject’s own spectacles, if any, was assessed for 6 663 persons (98% of those who took part in the examination and 84% of the eligible sample). In all, 3 497 persons (52%) had spectacles for distance vision and 98% of them wore spectacles in the va test.
Of the study population, 77% had habitual VA ≥ 1.0 and 96% had VA ≥ 0.5 required for a driving licence. The prevalence of VA ≥ 1.0 declined with increasing age, from 94% in the youngest age group to 6% in people aged 85 years or older (Fig. 1). The decline became obvious after 65 years. Of all participants, 16% had VA 0.63–0.8 and 6% had VA 0.3–0.5. the prevalence of these va levels increased until the age of 75–84 years, after which the prevalence of va 0.63–0.8 started to decline. differences in the distribution of VA across the age groups were significant (p < 0.001).
0
10
20
30
40
50
60
70
80
90
100
30–44 45–54 55–64 65–74 75–84 85 +
Age group
% > 1.0
0.63–0.8
0.3–0.5
0.1–0.25
< 0.1
Figure 1. Prevalence of habitual binocular distance visual acuity levels in different age groups.

58
Visual impairment (VA ≤ 0.25) was recorded in 1.6% of the subjects. Of the participants, 1.1% had low vision (VA 0.1–0.25), and blindness (VA < 0.1) was present in 0.5%. The prevalence of visual impairment and blindness increased significantly with age (p < 0.001), and after the ages of 65 and 75 years the growth was sharp. visual impairment seemed to be more common in women than in men, but this gender difference was not significant (OR 1.20, 95% CI 0.82–1.74).
to analyze the possible effect of nonresponse on the distribution of va, information on factors correlating with va was used to estimate the missing va values of nonparticipants. the results from these imputation models suggested a higher prevalence of visual impairment (2.1% in women and 1.7% in men) than those obtained from the original analyses (1.7% in women and 1.2% in men) (Study I, Fig. 3). The increase was particularly pronounced in the age group of 75 years or older, in which the prevalence of visual impairment increased from 12% (95% CI 9.2–14.6) to 16% (95% CI 12.7–18.8) in women and from 9% (95% CI 5.0–12.3) to 12% (95% CI 8.2–16.4) in men. when the original rates of visual impairment and blindness from this study were applied to the finnish adult population aged 30 years and older, the estimated number of visually impaired persons in the finnish population in 2000 was 48 000 and the corresponding number of blind persons was 15 000. Based on the results of the imputation, these numbers were higher: 65 000 visually impaired persons and 17 000 blind persons.
5.1.2 Visual acuity for near vision
Near vision was assessed for 6 667 persons (84% of those eligible). In all, 4 586 persons (68%) had spectacles for reading, and 95% (4 321 persons) wore their reading glasses in the va test for near vision.
The prevalence of habitual good to moderate VA for near vision (near VA ≥ 0.5) was 96%, and it declined with age (p < 0.001). However, a minimum of 95% of people retained VA ≥ 0.5 for near vision until reaching the age of 75 years. A marked decline occurred after 75 years of age and particularly after 85 years. In the age group of 30–74 years, 98% had near VA ≥ 0.5 compared with 83% in participants aged 75–84 years or older and 55% in participants aged 85 years and older.
Near VA ≤ 0.25 was observed in 1.8% of the total population, increasing from 0.8% in persons aged 30–74 years to 8% in persons aged 75–84 years and older and to 31% in persons aged 85 years and older. Reduced VA for near vision (VA ≤ 0.25) was rarer in women than in men (OR 0.66, 95% CI 0.48–0.91 adjusted for age).

59
5.2 Self-reported visual function and correlation with measured visual acuity
A total of 6 942 persons (87% of those eligible) answered the question about ability to read TV text, 7 358 persons (92% of those eligible) answered the question about ability to read newsprint, and 7 020 persons (88.0% of those eligible) answered the question about limitations in moving about due to poor vision.
Of the respondents, 95% were able to read TV text, 92% were able to read newsprint, and 92% had no vision-related difficulties in moving about (Fig. 2). By contrast, 2% were unable to read TV text, and 1% were unable to read newsprint. Moreover, 5% had vision-related difficulties in moving about in twilight, and 2% had difficulties also in good lighting.
0
10
20
30
40
50
60
70
80
90
100
Men Men Women
Age and Gender
%
Able With difficulties Unable
30–64 65+ 30–64 65+
Television text Newsprint
30–64 65+
Moving about
Women Men Men WomenWomen Men Men WomenWomen
Figure 2. Self-reported capability to read television text and newsprint and vision-related ability to move about in age groups of 30–64 years and ≥ 65 years by gender. Categories for moving about are as follows: able, difficulties during twilight, and difficulties also in good lightning.

60
The proportion of persons who reported difficulties in or inability to perform these self-reported tasks increased significantly with age (p < 0.001) (Fig. 2). No significant gender difference existed in reading TV text, but women significantly more often had difficulties in reading newsprint than men when controlling for age (OR 1.26, 95% CI 1.08–1.47) (fig. 2). however, the prevalence of persons unable to read newsprint at all was equally common in both genders. Working-aged women reported more often having difficulties in moving about in twilight than men (OR 1.36, 95% CI 1.03–1.82), but women aged 65 years and older had this difficulty more seldom than men (OR 0.68, 95% CI 0.48–0.97).
self-reported ability to read tv text correlated highly with measured va for distance vision (Spearman’s correlation coefficient 0.40, p < 0.0001), and self-reported ability to read newsprint correlated with measured near VA (Spearman’s correlation coefficient 0.32, p < 0.0001) in all persons (Table 7). Moreover, the correlation between VA for distance and near vision was high (Spearman’s correlation coefficient 0.46, p < 0.0001). However, the self-reported ability to move about without visual restrictions correlated only moderately with measured VA for distance vision (Spearman’s correlation coefficient 0.27, p < 0.0001). correlations between self-reported and performance-based visual function did not seem to depend on age. when analyzed separately, the results were similar in persons aged younger than 65 years and in those aged 65 years and older (study i, table 4).
Table 7. Relationship among performance-based and self-reported measures of visual function.
binocular distance acuity with current correction
binocular near visual acuity with current correction
≤ 0.25 0.32–0.4 0.5–2.0 total ≤ 0.25 0.32–0.4 0.5–1.25 total
Read tV text read newsprint
Able 44 136 5 996 6 176 Able 49 132 5 946 6 127
With difficulty 30 52 167 249 With difficulty 40 47 335 422
Unable 62 21 29 112 Unable 70 6 14 90
All 136 209 6 192 6 537 All 159 185 6 295 6 639
r = 0.40*, p < 0.0001** r = 0.32*, p < 0.0001**
vision restricts movement
No 53 141 5 866 6 060
Only in twilight 19 27 322 368
Yes 67 39 80 186
All 139 207 6 268 6 614
r = 0.27*, p < 0.0001**
* Age- and gender-adjusted Spearman’s correlation coefficient, ** Significance of correlation coefficients

61
differences between self-reported and measured visual performance were mainly observed in persons with impaired distance or near VA. Of those with distance VA ≤ 0.25, 34% (44 of 136 persons) reported that they were able to read TV text. By contrast, 0.4% of people with VA ≥ 0.5 reported that they were unable to read TV text. Correspondingly, 36% of people with near VA ≤ 0.25 (49 of 159 persons) reported that they could read newsprint, but only 0.2% of people with good near VA reported that they could not read newsprint. some of the difference may be explained by half of the persons with near va ≤ 0.25 and able to read newsprint (24 of 49 persons) not using their reading glasses at the examination. In addition, most persons with distance VA ≥ 0.5 who nevertheless reported inability to read tv text (16 of 29 persons) had at least one ocular disease or had had a stroke earlier. The same was true for persons with near VA ≥ 0.5 who were unable to read newsprint (9 of 14 persons).
5.3 Major eye diseases5.3.1 Estimated population prevalence of major eye diseases
Self-reported information on cataract, glaucoma, and ARM was received from 99% of participants (92% of all eligible) and on DR from 6 790 persons (97% of interviewed participants and 85% of all those eligible). Self-reported eye diseases were complemented with data from national registers, and case records were gathered for nonparticipants and persons with VA < 0.5 or reporting difficulty with vision or eye diseases without assessed va.
Of the study population, 10% had either operated or unoperated cataract (Table 8). The prevalence increased significantly with age (p < 0.001) and the increase became obvious after 65 years of age (Fig. 3, Table 8). In the age group 30–64 years, 2% had cataract compared with 31% of participants aged 65–84 years or older and 67% of participants aged 85 years or older. the prevalence of all cataract (operated and unoperated) seemed to be more common in women than in men (OR 1.55, 95% CI 1.26–1.91) (Fig. 3), but this gender difference was only due to the statistically significant gender difference in unoperated cataract (OR 1.66, 95% CI 1.28–2.15). No statistically significant gender difference was present in operated cataract (OR 1.19, 95% CI 0.93–1.55). Cataract had been operated in one or both eyes in one-half (53%) of persons with cataract.
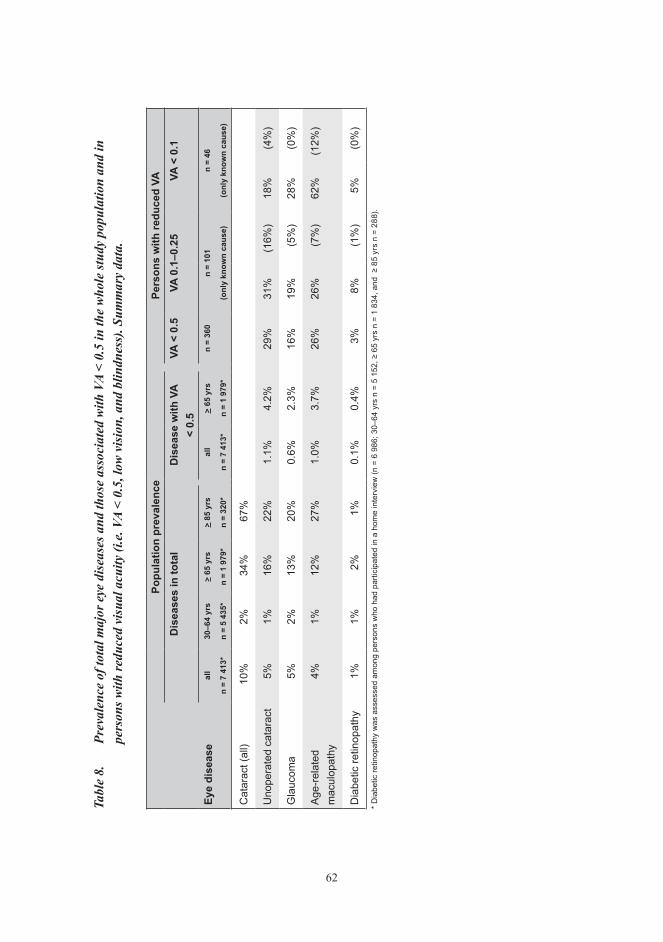
62
Tabl
e 8.
Pr
eval
ence
of t
otal
maj
or e
ye d
isea
ses a
nd th
ose
asso
ciat
ed w
ith V
A <
0.5
in th
e w
hole
stud
y po
pula
tion
and
in
pers
ons w
ith re
duce
d vi
sual
acu
ity (i
.e. V
A <
0.5,
low
vis
ion,
and
blin
dnes
s). S
umm
ary
data
.
popu
latio
n pr
eval
ence
pers
ons
with
redu
ced
vAd
isea
ses
in to
tal
dis
ease
with
vA
< 0.
5VA
< 0
.5VA
0.1
–0.2
5VA
< 0
.1
eye
dise
ase
all
n =
7 41
3*
30–6
4 yr
s
n =
5 43
5*
> 65
yrs
n =
1 97
9*
> 85
yrs
n =
320*
all
n =
7 41
3*
> 65
yrs
n =
1 97
9*
n =
360
n =
101
(onl
y kn
own
caus
e)
n =
46
(onl
y kn
own
caus
e)
Cat
arac
t (al
l)10
%2%
34%
67%
Uno
pera
ted
cata
ract
5%1%
16%
22%
1.1%
4.2%
29%
31%
(16%
)18
%(4
%)
Gla
ucom
a5%
2%13
%20
%0.
6%2.
3%16
%19
%(5
%)
28%
(0%
)
Age
-rel
ated
m
acul
opat
hy4%
1%12
%27
%1.
0%3.
7%26
%26
%(7
%)
62%
(12%
)
Dia
betic
retin
opat
hy1%
1%2%
1%0.
1%0.
4%3%
8%(1
%)
5%(0
%)
* D
iabe
tic re
tinop
athy
was
ass
esse
d am
ong
pers
ons
who
had
par
ticip
ated
in a
hom
e in
terv
iew
(n =
6 9
86; 3
0–64
yrs
n =
5 1
52, ≥
65
yrs
n =
1 83
4, a
nd ≥
85
yrs
n =
288)
.

63
2 1 0 2 2 0
28
12
3
38
1823
9
68
22
11
0
10
20
30
40
50
60
70
80
Cataract Unoperatedcataract
Cataract withVA < 0.5
Cataract Unoperatedcataract
Cataract withVA < 0.5
%
30–64 65+ 85+
MEN WOMEN
65
5
Figure 3. Prevalence of self-reported and/or register-based cataract (i.e. operated and unoperated cataract), unoperated cataract, and cataract related to VA < 0.5 in age groups of 30–64 years, ≥ 65 years, and ≥ 85 years by gender.
The proportion of persons with unoperated cataract and VA < 0.5 was 1% in the whole population, increasing significantly with age (p < 0.01) (Table 8). In persons aged 65–84 years and in persons aged 85 years and older, the proportion of VA < 0.5 related to unoperated cataract was 3% and 10%, respectively. Altogether, one-quarter (28%) of persons with unoperated cataract had VA < 0.5. By aggregating the prevalence of operated cataract and unoperated cataract with VA < 0.5, the estimated need for cataract surgery was 6% for the whole population.
The second most common chronic eye disease, with a prevalence of 5%, was glaucoma. Its prevalence increased significantly with age, from 2% in people aged 30–64 years to 20% in the oldest age group (p < 0.001) (Fig. 4, Table 8). ARM was almost as common as glaucoma, with a prevalence of 4% (Fig. 4, Table 8). Its prevalence also increased with age, from 1% in people aged 30–64 years to 27% in the oldest age group (p < 0.001). Both glaucoma and arm seemed to be more common in women than in men, but this gender difference was significant only for glaucoma (OR 1.57, 95% CI 1.24–1.98). Almost one-third (30%) of persons with ARM and 16% of those with glaucoma had VA < 0.5.

64
1 1 1 1 1
10 11
2
15
2
21
29
0
20
27
1
0
5
10
15
20
25
30
35
Glaucoma ARM DR Glaucoma ARM DR
%
30–64 65+ 85+
MEN WOMEN
14
3
Figure 4. Prevalence of self-reported and/or register-based glaucoma, age-related maculopathy (ARM), and diabetic retinopathy (DR) in the age groups 30–64 years, ≥ 65 years, and ≥ 85 years by gender.
0
10
20
30
40
50
60
70
< 0.5 0.1–0.25 < 0.1
Visual acuity category
%
Unoperated cataract
Glaucoma
ARM
DR
Figure 5. Prevalence of chronic eye diseases in persons with decreased visual acuity (i.e. VA < 0.5, low vision, and blindness).
65
DR had a prevalence of 1%, varying from 1% to 2% in the different age groups (Fig. 4, Table 8). Of those with DR, 15% had VA < 0.5. In the study population, 16% of persons with known DM and 23% of those taking medication for DM reported having DR. However, the presence of DR could not be assessed for 41% of the 425 persons with DM and 23% of those taking medication for DM reported having DR.
5.4 Causes of decreased visual acuityIn persons with VA < 0.5 (n = 360), the prevalence of unoperated cataract, ARM, glaucoma, DR, and other chronic eye diseases was 29%, 26%, 16%, 3%, and 23%, respectively (Table 8, Fig. 5). Of the 228 participants with any eye disease, 53% had a single eye disease, 35% had two eye diseases, and 12% had three or more eye diseases. One hundred and thirty-two persons with VA < 0.5 had no documented or self-reported chronic eye diseases. Of these individuals, 61% had not had a vision examination during the past five years and 35% had not had any previous vision examinations.
we were able to gather ophthalmological information on 108 of 147 visually impaired persons. in persons with low vision (va 0.1–0.25), the most common chronic eye diseases with or without other eye diseases were unoperated cataract (31%), ARM (26%), glaucoma (19%), and DR (8%) (Table 8, Fig. 5). Of the low vision, 16% was associated with unoperated cataract, 7% with ARM, 5% with glaucoma, and 1% with DR alone. In blind persons (VA < 0.1), ARM (62%) and glaucoma (28%) were the most prevalent eye diseases, whereas prevalence of unoperated cataract and dr alone or with other eye diseases comprised only 18% and 5% of blindness, respectively (Table 8, Fig. 5). Of blind persons, 4% had unoperated cataract but no other eye disease and 12% had ARM alone. glaucoma and dr caused blindness only in conjunction with other eye diseases.
5.5 Agreement between self-reported and documented major chronic eye diseases
the agreement between self-reported and documented major chronic eye diseases was analyzed among persons most likely to have eye diseases, i.e. persons with VA < 0.5 (n = 360). diagnoses of one or more major chronic eye diseases (i.e. operated or unoperated cataract, glaucoma, arm, dr, or other chronic eye diseases) could be assessed for 219 persons based on national registers and/or case records. when self-reported eye diseases were included, an additional 30 persons had one or more eye diseases. agreement between all four self-reported and documented major chronic eye diseases was between fair and

66
good (Kappa values 0.30–0.78) (study ii, table 2). for glaucoma, the agreement was excellent. overall, sensitivity of self-reported eye diseases was good to moderate (55–72%) and specificity was very high (88–100%).
5.6 Visual disability
5.6.1 Prevalence of functional limitations by visual acuity
the effect of decreased va on functioning was assessed in persons aged 55 years and older (n = 2 781). The proportion of persons having functional limitations (i.e. difficulties in at least one adl / iadl / self-reported mobility / measured mobility function) increased with decreasing VA (p < 0.001) (Fig. 6). Of persons with VA ≥ 0.8, 48% had functional limitations compared with 59% of persons with VA 0.5–0.63, 64% of persons with VA 0.4–0.3, and 82% of visually impaired persons (VA ≤ 0.25). No significant gender difference existed in the association between va and functional limitations.
0
10
20
30
40
50
60
70
80
90
< 0.25 0.3–0.4 0.5–0.63 > 0.8
Visual acuity
%
ADL function IADL function Self-reported mobility Performance-based mobility
Any
Figure 6. Proportion of subjects with difficulty or unable to perform ADL, IADL and mobility functions in different visual acuity categories adjusted for age and gender.

67
5.6.2 Association of vision with functional limitations
VA was significantly associated with the sociodemographic factors included in the analyses, i.e. age, gender, education, and living region (p < 0.05). Asthma, hypertension, stroke, dm, osteoarthritis, rheumatoid arthritis, back disease, impaired cognitive and hearing functions, and psychological symptoms were all associated with VA (p < 0.10). Anthropometric and behavioral factors, such as obesity (p < 0.20), smoking (p = 0.10), and a doctor’s appointment within the past 12 months (p < 0.05), were also associated with va. however, coronary heart disease, copd, cancer, clinical depression, parkinson’s disease, and receiving help had no association with VA (p ≥ 0.20). All variables associated with VA were also significantly linked to one or more functional limitations.
Decreased VA remained significantly associated with ADL limitations, even after adjustment for all variables associated with va (fig. 7). visually impaired persons (va ≤ 0.25) were four times more likely to have at least one ADL limitations than those with good VA (VA ≥ 0.8). IADL and performance-based mobility limitations were five times as likely to occur in visually impaired persons as in those with good va, and reported mobility limitations three times as likely. functional limitations were also one to two times more likely in persons with va 0.3–0.4 or va 0.5–0.63 than in those with good va.
adjustment for sociodemographic factors (i.e. education level and living region), especially level of education, slightly reduced the association between va and all disability measurements (study iii, table 3). on the other hand, the anthropometric and behavioral factors (i.e. Bmi, smoking, doctor appointment within the past 12 months) included did not contribute to the higher disability prevalence of persons with decreased va (study iii, table 3). after adjustment for chronic diseases (i.e. asthma, hypertension, stroke, dm, rheumatoid arthritis, osteoarthritis, and back disease), cognitive and hearing impairment, and psychological symptoms, the association between va and all functional limitations decreased (study iii, table 3). among the separate covariates, cognitive impairment, psychological symptoms, hearing impairment, stroke, and dm made the greatest contribution to the association between va and disability.
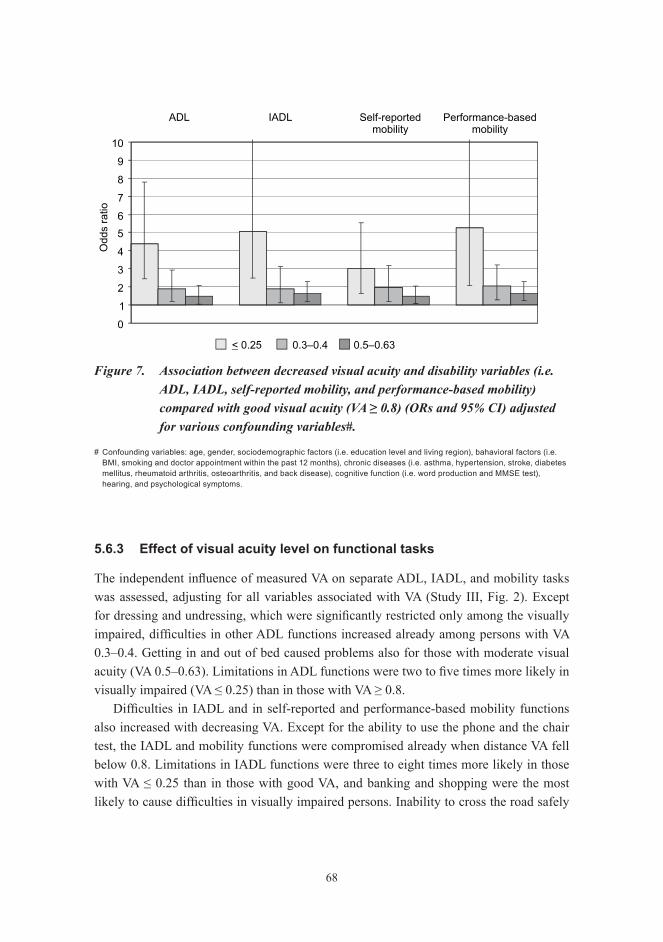
68
0
1
2
3
4
5
6
7
8
9
10
ADL IADL Self-reportedmobility
Performance-basedmobility
< 0.25 0.3–0.4 0.5–0.63
Odds
ratio
Figure 7. Association between decreased visual acuity and disability variables (i.e. ADL, IADL, self-reported mobility, and performance-based mobility) compared with good visual acuity (VA ≥ 0.8) (ORs and 95% CI) adjusted for various confounding variables#.
# Confounding variables: age, gender, sociodemographic factors (i.e. education level and living region), bahavioral factors (i.e. BMI, smoking and doctor appointment within the past 12 months), chronic diseases (i.e. asthma, hypertension, stroke, diabetes mellitus, rheumatoid arthritis, osteoarthritis, and back disease), cognitive function (i.e. word production and MMSE test), hearing, and psychological symptoms.
5.6.3 Effect of visual acuity level on functional tasks
The independent influence of measured VA on separate ADL, IADL, and mobility tasks was assessed, adjusting for all variables associated with va (study iii, fig. 2). except for dressing and undressing, which were significantly restricted only among the visually impaired, difficulties in other ADL functions increased already among persons with VA 0.3–0.4. getting in and out of bed caused problems also for those with moderate visual acuity (VA 0.5–0.63). Limitations in ADL functions were two to five times more likely in visually impaired (VA ≤ 0.25) than in those with VA ≥ 0.8.
Difficulties in IADL and in self-reported and performance-based mobility functions also increased with decreasing va. except for the ability to use the phone and the chair test, the iadl and mobility functions were compromised already when distance va fell below 0.8. limitations in iadl functions were three to eight times more likely in those with VA ≤ 0.25 than in those with good VA, and banking and shopping were the most likely to cause difficulties in visually impaired persons. Inability to cross the road safely

69
(i.e. walk 6.1 m at a speed of 1.2 m/s or faster) or difficulties in climbing up two stairs were three times more likely in visually impaired persons than in those with good va. visually impaired persons were also four times more likely to be unable to stand in the tandem position for 10 s (balance test) than those with good va. limitations in self-reported mobility functions were two- to three times more likely to occur in visually impaired persons than in those with good va.
5.7 Use of eye health care and social services
5.7.1 Use of eye health care services
the prevalence of a recent vision examination seemed to be slightly more common in women (71%; 95% CI 69%–72%) than in men (69%; 95% CI 67%–71%), but this rate changed differently across age groups by gender and a significant gender difference could not be verified (Fig. 8). Possession of spectacles was more common in women than in men (82% vs. 72%; p < 0.001).
the prevalence of a recent vision examination and having spectacles changed significantly across age groups (p < 0.001) (Fig. 8). A recent vision examination increased from 63% in the youngest age group to 80% in persons aged 45–54 years, after which the prevalence started to decline, being only 56% in persons aged 85 years and older. In addition, the prevalence of having spectacles increased from 59% in women and 39% in men aged 30–44 years to 98% in women aged 55–64 years and 94% in men aged 55–74 years, after which the prevalence began to decline.
the use of eye care services and the associated socioeconomic factors were analyzed in persons aged 55 years and older. the prevalence of vision examination and spectacle usage decreased with decreasing VA (p < 0.001). After adjustment for age and gender, 73% of persons with good VA (≥ 0.8) aged 55 years and older had had a recent vision examination compared with 58% of visually impaired persons (VA ≤ 0.25). Also, 97% of persons with good VA had spectacles compared with 62% of those visually impaired. according to the multivariate models, living in an institution, lower annual income level, and decreased cognitive capacity seemed to decrease the prevalence of vision examination and possession of spectacles in all va categories (table 9). persons with lower educational level were also less likely to have had vision examinations.
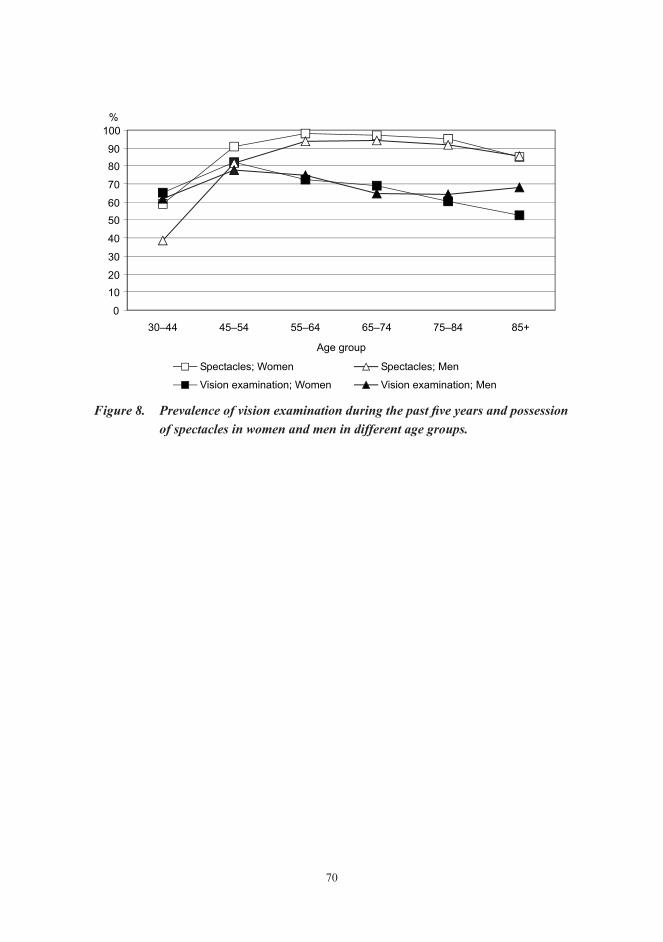
70
0
10
20
30
40
50
60
70
80
90
100
30–44 45–54 55–64 65–74 75–84 85+
Age group
%
Spectacles; Women Spectacles; Men
Vision examination; Women Vision examination; Men
Figure 8. Prevalence of vision examination during the past five years and possession of spectacles in women and men in different age groups.

71
Table 9. Odds ratios and associated confidence intervals from a multivariate logistic regression model for variables associated with vision examination and possession of spectacles in different visual acuity categories in persons aged 55 years and older according to sociodemographic characteristics, cognitive capacity, and mobility.
variable
Vision examination spectaclesVA ≤ 0.25
or(95% CI)
VA 0.3–0.4or
(95% CI)
VA 0.5–0.63or
(95% CI)
VA ≥ 0.8or
(95% CI)
VA ≤ 0.25or
(95% CI)
VA 0.3–0.4or
(95% CI)
VA 0.5–0.63or
(95% CI)
VA ≥ 0.8or
(95% CI)gender
Women 1.0 1.0 1.0 1.0 1.0 1.0 1.0 1.0
Men 0.57 2.14 0.97 1.00 0.42 0.76 0.32 0.28(0.22–1.47) (1.05–4.37) (0.63–1.48) (0.83–1.21) (0.15–1.17) (0.23–2.56) (0.14–0.72) (0.15–0.52)
Age (yrs)55–64 1.0 1.0 1.0 1.0 1.0 1.0 1.0
65–74 2.88 2.37 1.11 0.86 0.24 0.69 0.93
(0.22–37.77) (0.70–8.08) (0.56–2.19) (0.67–1.10) (0.01–6.05) (0.06–8.09) (0.70–5.35)
75–84 1.84 3.58 1.67 0.88 0.78 0.49 5.55
(0.14–23.39) (1.23–10.43) (0.85–3.29) (0.65–1.21) (0.03–19.75) (0.05–4.47) (1.75–17.62)
85+ 2.54 6.67 2.18 0.8 0.56 0.64 3.9
(0.17–37.79) (2.08–21.40) (0.90–5.25) (0.36–1.79) (0.02–13.71) (0.06–7.18) (1.07–14.21)
Living arrangementWith someone 1.0 1.0 1.0 1.0 1.0 1.0
Alone 1.33 0.79 0.72 0.38 0.62 1.25
(0.46–3.89) (0.42–1.51) (0.48–1.07) (0.10–1.40) (0.27–1.40) (0.62–2.49)
Institution 0.85 0.3 0.16 0.26 0.32 0.17
(0.28–2.62) (0.06–1.58) (0.04–0.64) (0.07–1.00) (0.06–1.68) (0.02–1.39)
urbanicityUrban or suburban 1.0 1.0 1.0 1.0
Rural 0.53 0.88 0.83 3.16
(0.23–1.22) (0.51–1.52) (0.62–1.12) (0.66–15.06)
educationHighest 1.0 1.0 1.0 1.0
Middle 0.66 0.67 0.71 1.09
(0.16–2.67) (0.20–2.25) (0.35–1.44) (0.85–1.39)
Lowest 0.49 0.30 0.78 0.84
(0.13–1.81) (0.10–0.90) (0.38–1.59) (0.61–1.15)
Annual income per consumption unit≥ 9 500 euros 1.0 1.0 1.0 1.0 1.0
7 001–9 499 euros 0.51 0.65 0.38 0.63 0.66
(0.30–0.89) (0.49–0.85) (0.31–6.17) (0.20–1.96) (0.30–1.42)
< 7 000 euros 0.57 0.72 0.83 0.30 0.45(0.33–1.0) (0.55–0.95) (0.20–3.47) (0.12–0.73) (0.20–0.99)
cognitive capacityNormal 1.0 1.0 1.0 1.0 1.0 1.0 1.0
Decreased 0.24 0.56 0.56 0.70 0.66 0.39 0.46
(0.10–0.59) (0.29–1.11) (0.37–0.85) (0.52–0.92) (0.22–1.95) (0.11–1.38) (0.19–1.15)
MobilityNo difficulty 1.0 1.0 1.0
Difficulty 0.48 0.68 3.10
(0.22–1.05) (0.43–1.08) (0.96–10.03)
Major difficulty 0.49 0.94 0.83
(0.21–1.13) (0.56–1.58) (0.30–2.32)

72
5.7.2 Use of eye health care and rehabilitation services by visually impaired persons
Of all visually impaired (VA ≤ 0.25) persons aged 30 years and older, 58% had had a vision examination during the past five years and 79% had received rehabilitation services (Fig. 9). Vision examination was provided by an ophthalmologist in almost all cases (93%). Of the visually impaired, 70% had spectacles, 31% a magnifying glass, and 9% other low vision aids (e.g. electronic reading and writing aids, or telescopic magnifiers), and 31% had received low vision rehabilitation (Fig. 9). Instead, 16% (n = 23) had not had any vision examination during the past five years, nor had they had vision aids or vision rehabilitation. all of these individuals were 65 years or older, and three-quarters (n = 18) were cognitively impaired.
0
10
20
30
40
50
60
70
80
90
Visionexamination
Visionrehabilitation
services #
Spectacles Magnifier orother low vision
aid
Low visionrehabilitation
%
< 0.1 0.1–0.25
** ***
Figure 9. Age- and gender-adjusted prevalence (%) of the use of eye care services and possession of visual aids among the visually impaired.
** p = 0.01, *** p < 0.01.
# Including spectacles, magnifier, or other low vision aid, and low vision rehabilitation.

73
after adjustment for age and gender, people with low vision (va 0.1–0.25) had received low vision rehabilitation less often (18% vs. 52%, p < 0.01) and had fewer low vision aids (27% vs. 49%, p = 0.01) than people with blindness (VA < 0.1), while spectacles were more common in people with low vision (75% vs. 59%, p = 0.06) (Fig. 10 and Study IV, table 2). also, according to the multivariate model, low vision rehabilitation or low vision aids (magnifying glasses and other low vision aids) were less common among people with low vision than among people who were blind (OR 0.14, 95% CI 0.05–0.39 and OR 0.37, 95% CI 0.16–0.85, respectively) (Study IV, Table 3).
Nonparticipation in vision rehabilitation procedures was significantly associated with decreased cognitive capacity (p ≤ 0.01) (Study IV, Table 2). Living in an institution reduced the likelihood of having received rehabilitation services (57% vs. 84%, p = 0.01). a lower level of income also reduced the likelihood of having received visual rehabilitation services, especially spectacles (p < 0.05). According to the multivariate model, people in the lowest tertile of cognitive capacity appear less likely to have received low vision rehabilitation (OR 0.10, 95% CI 0.01–0.95) (Study IV, Table 3). Magnifying glasses or other low vision aids were less commonly possessed by people living in institutions (or 0.17, 95% CI 0.03–0.85).
5.7.3 Need for assistance of visually impaired persons
the need for assistance was analyzed only among people with visual impairment living in the community (n = 120). Of these, 71% reported the need for assistance and 24% of those needing assistance reported not receiving enough assistance for everyday living. the need for assistance increased with decreasing VA, from 67% in people with low vision (VA 0.1–0.25) to 82% in blind people (VA < 0.1) (p = 0.09) (Fig. 10).
The need for assistance was significantly associated with age and mobility difficulties after adjustment for age and gender (p < 0.05) (Study IV, Table 4). Almost all (95%) visually impaired people aged 85 years or older reported a need for assistance, whereas in other age groups the proportion was around 60%. Female gender, living alone, living in an urban or suburban municipality, and low cognitive capacity also seemed to increase the probability of needing assistance, but these associations were not statistically significant. Based on a multivariate model, only mobility difficulties increased the likelihood of needing assistance (table 5).

74
0
10
20
30
40
50
60
70
80
90
100
No need for
assistance
Met need for
assistance
Unmet need for
assistance
%
VA < 0.1
VA 0.1–0.25
**
Figure 10. Prevalence of total, met, and unmet need for assistance by visual acuity adjusted for age and gender.
** p = 0.01.
An unmet need for assistance was significantly associated only with age after adjustment for gender (p < 0.05) (Study IV, Table 4). In addition, female gender, living alone, living in rural municipalities, normal or near-normal cognitive capacity, and mobility difficulties seemed to increase the reported unmet need for assistance. on the basis of a multivariate model, only mobility difficulties increased the likelihood of having an unmet need for assistance (table 10). however, the number of people in these analyses was small.

75
Table 10. Associations between need for assistance and getting sufficient help to manage at home and various sociodemographic variables, cognitive function, and mobility in visually impaired (VA ≤ 0.25) persons in a multivariate model.
variableneed for assistance unmet need for assistanceor (95% CI) or (95% CI)
visual acuity0.1–0.25 1.0
< 0.1 1.87 (0.47–7.40)
gender Women 1.0 1.0
Men 0.37 (0.08–1.71) 0.46 (0.08–2.81)
Age (yrs)30–64 1.0 1.0
65–74 0.37 (0.04–3.52) 0.84 (0.10–7.32)
75–84 0.31 (0.06–1.59) 0.04 (0.00–0.54)
85+ 0.86 (0.09–8.42) 0.18 (0.02–1.96)
Living arrangementWith someone 1.0
Alone 2.85 (0.84–9.69)
cognitive capacityHighest tertile 1.0
Middle 0.39 (0.09–1.67)
Lowest tertile 0.24 (0.04–1.44)
MobilityAble 1.0 1.0
Difficulty 9.67 (2.71–34.49) 6.01 (0.75–47.90)
Major difficulty or unable 93.58 (9.67–906.08) 10.09 (1.04–98.09)

76
6 discussion
6.1 Main findings
6.1.1 visual function
populations in industrialized countries are aging. in finland, the number of elderly people (65 years and older) is expected to increase by 77% by the year 2040, from 874 700 persons (16.5% of the population in 2007) to 1 548 400 persons (27.0% of the population). the number of persons aged 85 years and older is anticipated to increase particularly rapidly, by 256%, from 98 000 to 349 000 (Statistics Finland 2007). our results show that also the prevalence of decreased VA increases with age. The majority (96%) of people aged 30 years and older maintained at least a moderate vision (VA ≥ 0.5) up to the age of 85 years. However, in the age group 75–84 years the prevalence had decreased to 81%, and after 85 years to 46%. Although the overall rate of visual impairment was low, more than one in ten persons 75 years or older had visual impairment. the high rate of visual impairment in the fastest growing segment of the population means that the demand for eye care services is on the rise.
in all, visual impairment (VA ≤ 0.25) was observed in 1.6% of the population, and 0.5% were blind (VA < 0.1). After compensating for the missing information due to nonparticipation, the prevalence of visual impairment increased from 1.7% to 2.1% in women and from 1.2% to 1.7% in men, mostly due to the significant proportion of nonparticipants in the age group 75 years or older. selective response seems to have produced an underestimation of the prevalence of visual impairment by about 0.5% in both men and women. visual impairment for distance vision started to increase at around 65 years of age and for near vision at around 75 years of age, after which the increase was sharp. Even without correction for nonparticipation, 30% of the population aged 85 years and older were visually impaired and 11% were blind. We found that visual impairment was slightly more common in women than in men, but the gender difference was not statistically significant, in accordance with most previous studies (häkkinen 1984, tielsch et al. 1990, salive et al. 1992, west et al. 1997, Klaver et al. 1998, Buch et al. 2001b). however, higher prevalence rates of visual impairment in women have also been reported (Klein et al. 1991b, attebo et al. 1996, taylor et al. 1997).
we observed predominantly lower prevalences of visual impairment, especially low vision, than in previous studies measuring va with the participant’s own spectacles (häkkinen 1984, salive et al. 1992, van der pols et al. 2000). however, our prevalences of visual impairment with current spectacle correction were mainly higher than in earlier
77
studies with best refraction correction (tielsch et al. 1990, Klein et al. 1991b, attebo et al. 1996, Klaver et al. 1998). compared with previous studies with best refraction correction, the higher prevalence of visual impairment in our study may be due to the lack of recent refraction. This is in accordance with results that a significant proportion of visually impaired persons have had insufficiently corrected refractive errors (leibowitz et al. 1980, tielsch et al. 1990, taylor et al. 1997). moreover, surveys concerning everyday-seeing in the elderly have suggested that the current eyeglasses of these subjects have not met their needs (hiller and Krueger 1983, west et al. 1997, evans et al. 2002). higher prevalence rates of visual impairment and blindness in our study may also be explained by nursing home residents being included in the subject pool (tielsch et al. 1990, attebo et al. 1996, taylor et al. 1997).
we, however, found that a higher proportion of persons who had at least moderate va (≥ 0.5) for distance or near vision used their spectacles than persons with lower VA. This may indicate that persons with lower VA did not benefit from spectacle correction and consequently did not use eyeglasses rather than having insufficiently corrected refractive error, as reported in some studies (leibowitz et al. 1980, tielsch et al. 1990, taylor et al. 1997). This finding is supported by no notable discordance being present between near and distance vision. the prevalence rates of blindness in our study were also similar to those reported in population-based surveys based on best refraction correction (tielsch et al. 1990, Klein et al. 1991b, Buch et al. 2001a).
compared with a previous population-based study in older persons in finland (hirvelä and laatikainen 1995), the prevalence of blindness was fairly close since a similar definition of blindness had been used. the lower prevalence of visual impairment than in other finnish surveys on older persons may be partly due to nonparticipation in the older age groups, but it may also reflect improved treatment possibilities within the last 10–20 years.
self-reported ability to read newsprint was previously assessed in the mini-finland health survey, which used largely similar methods to assess health and functional capacity in finland as those used in the health 2000 survey, although it was carried out two decades earlier (aromaa et al. 1989). this data enabled us to evaluate the change in visual function in the adult population from 1978–1980 to 2000–2001. the proportion of persons who had difficulties or could not read newsprint with their current spectacles had decreased significantly (p < 0.001), from 16% to 8% in women and from 12% to 6% in men over the past 20 years (laitinen et al. 2005). the comparison suggests that visual impairment has decreased significantly, especially in the age group 65 years and older. In this age cohort, the proportion of persons with difficulties or unable to read newsprint with their current spectacles had decreased from 30% to 19%. Since the late 1970s cataract surgery and intraocular lens technology have improved considerably, enabling more accurate

78
postoperative correction of refraction. there is also some evidence that the incidence of severe visual loss due to diabetes and glaucoma has decreased because of better treatment possibilities (Backlund et al. 1997, Klein et al. 2001, chen 2003). these improvements in therapy may at least partly explain the favorable time trend in the prevalence of reading difficulties.
measurement of self-reported visual functioning may be a relatively simple way to assess the prevalence of visual disturbances in the general population. in our study, the habitual va for distance and near vision correlated quite well with the self-reported capability to read TV text and newsprint, respectively. We analyzed findings also in the age group of 65 years or older to ascertain that the large proportion of younger persons with good VA did not skew the results. Despite the significant correlation between measured values and subjective assessment, we observed some discordance, especially in the low vision group, which may partly be due to differences in classification of these two categorical variables. in addition, self-reports on visual function may underestimate the prevalence of visual impairment because some persons with visual impairment do not perceive having difficulties due to compensation strategies adopted (Fried et al. 1991, sager et al. 1992). in persons with good va, self-rating of visual disturbances includes not only vision disorders due to refractive errors, but also disturbances regarding contrast sensitivity, glare sensitivity, stereopsis, and visual field (Carta et al. 1998). It is also possible that some of the reported subjective difficulties were not entirely visual.
when the original rates of visual impairment and blindness from this study were applied to the finnish general population, a total of 48 000 visually impaired persons (va ≤ 0.25) and 15 000 blind persons (VA < 0.1) emerged in 2000. Based on the results of the imputation (study i, fig. 3 / model iv), these numbers were higher: 65 000 visually impaired persons and 17 000 blind persons. in 2000, there were 13 000 visually impaired adults (VA < 0.3) and 5 000 blind persons (VA < 0.05) in the Finnish Register of Visual impairment (staKes reports 2001). several potential reasons exist for these differences, a different definition for blindness being one. Unfortunately, we were unable to assess the prevalence of blindness using the WHO definition, which was used by the Finnish register of visual impairment, to obtain a comparable prevalence rate. it is, however, likely that the prevalence of VA of < 0.1 in our study is quite tenable. Our results are similar to previous reports, even though the best correction was not defined, which may indicate that an additional refraction correction does not benefit blind persons and has negligible effect on the assessed prevalence of blindness. however, our estimation for the number of visually impaired persons may be too high because we measured va with current spectacle correction instead of the best-corrected va required for registration in the finnish register of visual impairment. on the other hand, we report the prevalence of visual impairment only due to decreased va. the total prevalence of visual impairment in

79
finland may be higher since some visual impairment has also been reported to be caused by visual field restrictions (Taylor et al. 1997). Moreover, registries of the blind have been shown to underestimate true prevalence because of their voluntary nature (robinson et al. 1994).
6.1.2 Major chronic eye diseases
as expected, in persons aged 30–64 years, the prevalence of major chronic eye diseases (i.e. cataract, glaucoma, arm, and dr) was very low, and only 18 of the 5 434 persons (0.3%) in this age group had decreased VA (< 0.5) with any of these diseases. According to previous reports, in persons aged 20–64 years, the most common causes of impaired vision (0.1 > VA < 0.5) have been myopia-related and other retinal disorders (ARM excluded), accounting for 46% of all visual impairment in this age group (Buch et al. 2004). the most common causes of blindness (VA ≤ 0.1) have been retinitis pigmentosa and optic neuropathy, each causing 29% of blindness (Buch et al. 2004).
in this survey, the major chronic eye diseases, especially cataract, glaucoma and arm, were strongly related to increasing age, consistent with earlier reports. of persons aged 65 years and older, 34% had cataract, 13% glaucoma, 12% ARM, and 2% DR. One half of the persons with cataract had not been operated on (16% of the whole population of that age). In all, one-quarter (23%) of the population aged 65 years and older seems to need cataract surgery when the prevalences of operated cataract and unoperated cataract with VA < 0.5 are taken into account. Different sampling methods and definitions for chronic eye diseases have a great influence on reported prevalence rates and may at least partly explain the different prevalence rates found in our study compared with previous studies. earlier population studies have reported much higher prevalence rates for cataract, arm, and dr than we observed. many of these studies have been aimed at estimating risk factors for eye diseases, and therefore, the prevalence rates have included even early abnormalities assessed with thorough ophthalmic examination, unlike in our study, which estimated the prevalence of clinically relevant prevalence rates of these major eye diseases. Our findings were in agreement with the skövde cataract study, which used a grading system and criteria corresponding to clinically significant cataract (Östberg et al. 2006). Our results were also consistent with those of Mitchell et al. (1993), who found that 19% of persons aged 75–84 years and 26% of persons aged 85 years and older had ARM based on case records.
individuals reporting arm probably had either advanced early arm or late arm. in previous studies, the prevalence of late ARM has varied between 4% and 5% in persons aged 75–84 (compared with 15% of all ARM in our study) and between 11% and 35% in persons aged 85 or older (compared with 27% of all ARM in our study) (Laatikainen

80
and hirvelä 1995, mitchell et al. 1995, vingerling et al. 1995). it is obvious that persons with late arm are more aware of their eye disease, although a previous study showed that 67% of patients with late ARM were unaware of it (Topouzis et al. 2006). late arm may go unnoticed because 40–60% of late ARM is found in only one eye, and binocular VA remains unaffected (vinding 1989, laatikainen and hirvelä 1995, topouzis et al. 2006).
despite the higher prevalence rates of dr found in earlier studies, proliferative changes have been present in only 2–4% and macular edema in 3–8% of middle-aged and elderly persons with dm, and in the majority of cases the changes have been mild (Klein et al. 1992d, hirvelä and laatikainen 1997, mitchell et al. 1998, mcKay et al. 2000). this may at least partly explain the low prevalence of dr in our study. however, we are concerned that 41% of persons with DM reported not having ever had diabetes-related retinal photography or a fundus examination, although a quarter of these persons had seen an ophthalmologist earlier. perhaps they were merely unaware that a fundus examination had been performed on that occasion. however, mccarty et al. (1998) and mcKay et al. (2000) also reported that almost one-third of their australian subjects with a self-reported history of dm had never seen an ophthalmologist, and only about half had had a retinal examination in the last two years.
the prevalence of glaucoma seemed to be higher in our data than in many earlier studies (tielsch et al. 1991b, dielemans et al. 1994, mitchell et al. 1996, Bonomi et al. 1998, wolfs et al. 2000, weih et al. 2001, nizankowska and Kaczmarek 2005). however, a substantial geographic variation has been observed in the prevalence rates according to differences in occurrence of pseudoexfoliation and subsequent capsular glaucoma. consequently, the prevalence of glaucoma in other nordic countries has been more similar to our findings (Jonasson and Thordarson 1987, Ringvold et al. 1991, Hirvelä et al. 1994, ekström 1996, Jonasson et al. 2003b, Åström and linden 2007, Åström et al. 2007, Tarkkanen et al. 2008). In these studies, the prevalence of OAG has been 2–5% in middle-aged or older persons, and capsular glaucoma explained 30–85% of this prevalence. Thus, one explanation for the higher prevalence of glaucoma in finland, as in other nordic countries, may be the higher prevalence of capsular glaucoma than in other european, north american, and australian countries.
in this study, women had unoperated cataract and glaucoma more often than men. most previous studies have shown that lens opacities and cataract are more common in women than in men, but the age-adjusted gender difference was significant in only a few of these studies (leibowitz et al. 1980, häkkinen 1984, gibson et al. 1985, Jonasson and Thordarson 1987, Klein et al. 1992a, Hirvelä et al. 1995, Reidy et al. 1998, Östberg et al. 2006). Contrary to our findings, earlier studies have reported that glaucoma is more prevalent in men than in women (leibowitz et al. 1980, Jonasson and thordarson 1987, dielemans et al. 1994, ekström 1996, Bonomi et al. 1998, reidy et al. 1998, wolfs et

81
al. 2000) or have shown no gender difference (martinez et al. 1982, gibson et al. 1985, ringvold et al. 1991, Klein et al. 1992b, hirvelä et al. 1994, weih et al. 2001, Jonasson et al. 2003b, nizankowska and Kaczmarek 2005). the gender differences in our study may be due to earlier manifestation of eye diseases in women and/or differences in seeking treatment, which is supported by there being no gender difference in the prevalences of major eye diseases in persons with VA < 0.5. the prevalence of operated cataract was similar in both men and women.
in accordance with previous studies, the most prevalent eye diseases among persons with visual impairment were ARM (37%), unoperated cataract (27%), glaucoma (22%), and DR (7%). However, the exact prevalence rates are impossible to compare between studies due to different sampling methods, diagnostic criteria, and definitions for visual impairment and blindness. moreover, previous studies have assessed the main reason for visual impairment and blindness, whereas we report the prevalence of major eye diseases with or without the presence of other chronic eye diseases. this may at least partly explain the higher prevalence of cataract in our blind subjects (18%) compared with earlier reports (Attebo et al. 1996, Buch et al. 2004). However, only in 4% of our subjects was unoperated cataract considered to be the only cause of blindness.
6.1.3 visual function and disability
previous studies have suggested that visual function affects physical performance and everyday living, but the strength of these links remains unknown. In our study, 82% of visually impaired persons (VA ≤ 0.25) aged 55 years or above had limitations in at least one ADL, IADL, or mobility function, compared with 48% of those with good vision (VA ≥ 0.8) The impact of decreasing VA on functional limitations was uniform across genders. in addition to vision, physical functioning is often affected by various coexisting chronic diseases, which may at least partly explain the association between va and functional limitations. as the close association between va and physical functioning attenuated only slightly when we adjusted for many of the relevant diseases, our results suggest that VA has a strong independent influence on physical functioning in persons aged 55 years and above. the association between both measured and self-reported visual function and functional limitations remained after controlling for some potential confounding or modifying factors, such as other chronic diseases, psychological well-being, cognitive function, hearing, and sociodemographic and behavioral factors. even after controlling for these factors, visual impairment (VA ≤ 0.25) increased the odds for ADL, IADL, and mobility limitations three- to fivefold. The association between self-reported visual function and functional limitations was quite similar.
our observations concerning the strong effect of va on adl, iadl, and mobility

82
limitations correspond with those in most previous reports with comparable outcome variables (salive et al. 1994, west et al. 1997, reuben et al. 1999). however, we observed a stronger effect of self-reported visual function on functional limitations than the previous studies, which may be due to the different definitions of self-reported difficulties in vision (rudberg et al. 1993, spiers et al. 2005). Some fi ndings suggesting no association between visual function and functional limitations have also been reported, but these analyses were based on subjects who were healthier and had relatively fewer functional limitations than the general population (ensrud et al. 1994, Jagger et al. 2005). we found that all separate adl, iadl, and mobility tasks were also associated with va. this is in accordance with two previous studies reporting an association between self-reported visual function and iadl limitations (swanson and mcgwin 2004, sloan et al. 2005a). however, results concerning adl tasks have been inconsistent (swanson and mcgwin 2004, sloan et al. 2005a).
in our study, even a slight decrease in va, which may easily go undetected, was associated with limitations in adl and, particularly, with iadl and mobility tasks. most of the iadl and mobility tasks, especially tasks requiring moving about, were compromised already at VA 0.5–0.63. Persons with VA < 0.5 were more likely to have limitations in almost all adl, iadl, and mobility functions than persons with normal vision. however, increased likelihood of having limitations in dressing and undressing was observed only in visually impaired persons. the complexity of physical functions and their demands on vision vary from task to task. our results suggest that persons with visual impairment most likely had difficulties in such IADL tasks as banking and shopping compared with those with normal vision after adjustment for potential confounding variables. this may indicate that functioning in a wider social context demands sufficient visual ability to cope with an unfamiliar environment. visual function is also known to play an important role in balance, orientation, and gait, but some of the decreased mobility may be due to fear of falling (marron and Bailey 1982, stones and Kozma 1987, Klein et al. 2003, lee and scudds 2003, deshpande et al. 2008). decreased visual function may lead to multiple undesirable consequences, such as social isolation and poorer quality of life. in addition, lack of physical activity is known to be a major risk factor for further disability (mor et al. 1989). this highlights the need for evaluation and correction of va also among those who are not classified as visually impaired. Improvement in mobility and ADL performance is more likely with better va (salive et al. 1994). prevention, early detection, treatment, and rehabilitation of decreased visual function are essential in reducing disability.
the associations between vision and various health conditions and behavioral and sociodemographic factors have been well established, but only a few studies have explored the potential causal or mediating effect of these variables on the complex process through which impaired vision leads to disability. By using a large, representative, population-based

83
data and a more comprehensive set of potential confounding factors in analyses, our study was able to shed further light on the relationship between impaired vision and functional limitations. in accordance with our results, age, gender, and education have been observed to explain some of the effect of visual function on functional limitations (rudberg et al. 1993, reuben et al. 1999). we found that cognitive impairment, psychological symptoms, and hearing impairment also contribute to the association between va and functional limitations. persons with visual impairment are known to more often suffer from depression or dementia, which may be due to a common underlying cause. alternatively, visual impairment may predispose to cognitive impairment and depressive symptoms, leading to disability as suggested by previous studies (rovner and ganguli 1998, lin et al. 2004, sloan et al. 2005a). in addition, concomitant hearing and visual impairment have been found to increase the risk for functional limitations more than visual impairment alone (laforge et al. 1992, lin et al. 2004).
6.1.4 visual function and use of health and social services
visual impairment is generally a nonfatal condition, but it is a major public health problem due to its significant impact on functional ability, independent living, and need for assistance. Based on our results, many visually impaired people, older persons in particular, have not had a recent vision examination and lack adequate low vision rehabilitation. we found that only one-half of the visually impaired (VA ≤ 0.25) aged 30 years and older had had a vision examination within the last five years. Previous studies have reported that 45–66% of visually impaired people (VA ≤ 0.5) have had a vision examination during the past one or two years and 77% during the past five years (Orr et al. 1999, Bylsma et al. 2004). different definitions of visual impairment (VA ≤ 0.25 vs. VA < 0.5 used in previous studies) and different population samples may partly explain the lower percentage of eye examination in our study, as we included institutionalized people. the low overall proportion of vision examinations in visually impaired people may partly be due to the fact that in cases of untreatable end-stage eye disease, regular eye examinations have not been considered useful. diagnosis of visual impairment and untreatable eye disease may lead to the belief that nothing can be done to improve visual functioning. the role and benefits of rehabilitation may have been forgotten.
In our study, one-third (31%) of the visually impaired had received low vision rehabilitation. This finding is consistent with the results reported by Gresset and Baumgarten (2002), who showed that 29% of people with self-reported visual impairment had received rehabilitation services for visual impairment. however, they estimated that the prevalence of low vision services would have been about twofold if it had been assessed only among persons with permanent visual impairment (i.e. visually impaired persons after refraction

84
correction) (gresset and Baumgarten 2002). This is in accordance with our finding that low vision rehabilitation was almost twice (52% vs. 31%) as common in people with blindness (VA < 0.1) as in all visually impaired people (VA ≤ 0.25). In Finland, only people with untreatable eye disease(s) and permanent visual impairment (VA < 0.3 with best refraction correction or binocular visual field < 60º or degree of disability ≥ 50% due to vision) are eligible for free low vision aids and rehabilitation services. in our study, va was measured binocularly with the participant’s own spectacles, but best-corrected va was not assessed. thus, there may have been people with correctable visual impairment in our sample, and our results may underestimate the prevalence of low vision rehabilitation received, especially among people with low vision.
sociodemographic and functional status potentially affect the use of eye care services in the visually impaired. our results suggest that low education and low income are associated with limited use of many eye care services. orr et al. (1999) have also reported that a low educational level in visually impaired people is associated with nonparticipation in an eye examination. in accordance with our results, previous studies have found that people with lower socioeconomic status are also more likely to have an uncorrected refractive error (liou et al. 1999, foran et al. 2002, munoz et al. 2002, thiagalingam et al. 2002). education is thought to increase knowledge about diseases and their prevention, giving better opportunities to utilize the health care system (livingston et al. 1998, hoevenaars et al. 2006). people with higher income may have easier access to eye care. however, in multivariate analyses none of the socioeconomic factors significantly affected the odds of receiving eye care services, but the number of people in our analyses was small.
cognitive capacity was one of the most important factors affecting the use of eye care services. Consistent with our findings, Lupsakko et al. (2003) noted that only one-third of the visually impaired (VA < 0.3) aged 75 years or older who had a reduced cognitive function had been examined by an ophthalmologist in the past four years. we also found that people living in institutions less often had had eye examinations, low vision rehabilitation, spectacles, and low vision aids than those living at home. in addition to visual impairment, cognitive impairment and other chronic conditions are common in elderly institutionalized people. It may, therefore, be difficult to recognize the role of visual impairment and its consequences in people living in institutions. decreasing va in the elderly may also be seen as part of normal aging. however, de winter et al. (2004) have estimated that vision could be seen as improved in 65% of institutionalized people with visual impairment (VA < 0.4) through cataract extraction and/or low vision aids.
visually impaired people have been shown to be two to three times more likely to use community support services or to rely on informal regular help than people with normal vision (wang et al. 1999b, wang et al. 1999c). visual impairment has been associated with a higher incidence of nursing home admission, which may be partly due to the unmet
85
need for assistance in managing at home (wang et al. 2001, wang et al. 2003b). previous studies have demonstrated that in people with adl or iadl limitations the prevalence of unmet need for assistance varies between 9% and 21% (Tennstedt et al. 1994, Desai et al. 2001, laplante et al. 2004). in our study, a need for assistance was reported by 71% of visually impaired people, and 24% felt that they received inadequate assistance in everyday activities. By contrast, only 9% of the general adult population in Finland report a need for assistance (aromaa and Koskinen 2004). Based on multivariate regression models, total and unmet need for assistance were both highly associated with mobility difficulties independent of VA (data not shown). Female gender and older age seemed to accentuate the need for assistance in visually impaired people.
6.2 Methodological considerations
a major concern in population studies is nonparticipation. potentially selective nonparticipation may cause nonresponse bias unless the participation rate is sufficiently high (livingston et al. 1997, Klaver et al. 1998). the health 2000 survey had an exceptionally high response rate, but still the evaluation of the differences between participants and nonparticipants suggested that participation in the survey was selective. Of both nonparticipants and participants, 0.4% were registered as visually impaired in the finnish register of visual impairment, but based on national registers and obtainable case records, nonparticipants were less likely to have glaucoma (p = 0.13) and more likely to have ARM (p < 0.01). Furthermore, persons who were only interviewed had more limitations in adl, iadl, and mobility functions than those who also attended the health examination. there are various potential explanations for this nonparticipation. in addition to eye diseases, cognitive impairment and other chronic conditions are common in elderly persons, and the elderly may have mobility restrictions or be too frail to attend the population survey. persons with known eye disease requiring regular follow-ups and medication may, in turn, be more willing to participate in a health examination survey.
to minimize the effect of nonparticipation, the health 2000 survey also included an abridged health examination, including measurement of va, conducted at home or in an institution. an abridged interview at home or by phone was carried out in case of nonparticipation. even when the abridged examination was taken into account, participation in the health examination seemed to be less likely in persons aged 75 years and older, potentially resulting in an underestimation of the prevalence of visual impairment, which is most common in this age group. since we had information from the home interview, we were able to compensate for missing information due to nonparticipation by replacing each missing value with a set of plausible values using the multiple imputation method (lehtonen and pahkinen 1995) and to evaluate the effect of nonparticipation on the

86
prevalence of visual impairment. the prevalence estimates of clinically relevant proportions of major eye diseases are
predominantly based on self-reported data. Previous studies have reported that only 18% of persons with ARM, 33% of persons with DR, and 46% of persons with cataract reported having these eye diseases, possibly due to recall error or uncertainty in the diagnosis (Klein et al. 1986, linton et al. 1991). mild changes, in particular, were less likely to be reported. wang et al. (1994) have shown that half of the unreported but earlier diagnosed eye diseases could be verified in case records. To improve the reliability of our results, we complemented information on self-reported eye diseases with data from national registers. in addition, case records for those most likely to have one or more chronic eye diseases, i.e. nonparticipants and persons with VA < 0.5 or reporting difficulties in vision or eye diseases without assessed va, were gathered. our results concerning the correlation between register-based and self-reported eye diseases were parallel with previous findings, but we got higher sensitivity rates than earlier studies. only the correlation between self-reported and specialist-assessed arm in persons aged 30–74 years was poor, due to other degenerative fundus changes being included in self-reports and the low prevalence of arm in this age group. the prevalences of cataract, arm, and dr in our study may be underestimations of the true rates in the finnish population. persons with glaucoma could be determined more comprehensively as a result of data obtained from the national medication reimbursement register and the national prescription register, and they seemed to be more likely to participate in the survey. however, even the prevalence of glaucoma may be an underestimate because previous studies have reported that 10–50% of glaucoma patients are unaware of their disease (tielsch et al. 1991b, wormald et al. 1992, wang et al. 1994).
the cross-sectional nature of the data did not enable us to establish the chronology of the events. however, when studying the association between visual function and disability, it is more likely that vision impairment affects success in adl, iadl, and mobility tasks than functional limitations enhancing visual impairment. visual impairment and functional limitations may result from common background factors connected to living circumstances, behavior patterns, and diseases. this shared origin of visual impairment and functional limitations was taken into account in our analysis by adjusting for a wide variety of covariates. however, the data may not have included all relevant confounding factors, and therefore, we cannot rule out the possibility that at least part of the association between visual impairment and functional limitations may result from common background factors. furthermore, we were unable to analyze how the association between visual impairment and functional limitations changed along with new compensatory strategies adopted to perform adl, iadl, and mobility tasks.
selective participation may also have had an effect on the results concerning the use of

87
eye care services and the need for assistance in visually impaired persons because the use of eye care services and vision aids may be different among participants and nonparticipants. furthermore, information on the use of eye care services was based on self-reports and therefore subject to memory lapses. to improve the credibility of results, the health 2000 survey data on low vision rehabilitation were supplemented with hospital records.

88
7 SUMMARy AND CoNCLUSIoNS
This study provides the first nationwide population-based prevalence estimates of clinically relevant major eye diseases, visual impairment, and blindness. the majority (96%) of people maintained at least a moderate visual acuity (≥ 0.5) up to the age of 85 years when assessed with current refraction correction, if any. the prevalence of habitual visual impairment (VA ≤ 0.25) was 1.6%, and 0.5% of subjects were blind (VA < 0.1). The prevalence of visual impairment and blindness increased rapidly with age. although the overall rate of visual impairment was low, more than 10% of persons 75 years or older had visual impairment.
applying the imputated numbers of visually impaired and blind subjects to the finnish population (about 3 million aged 30 years or older), yielded ca 65 000 (2.1%) visually impaired and 17 000 (0.6%) blind adults in Finland in 2000. The high rates of visual impairment in the fastest growing population segment indicate that the demand for eye care services will increase substantially in the future.
Based on self-reported and register-based data, the estimated total prevalences of cataract, glaucoma, ARM, and DR in the study population were 10%, 5%, 4%, and 1%, respectively. as expected, in persons younger than 65 years the prevalence of these major eye diseases was low, and only 0.3% of persons having these eye diseases in this age group had decreased VA (< 0.5). However, all of these chronic eye diseases increased significantly with age (p < 0.001), and among persons aged 65 years and older, 34% had cataract, 13% glaucoma, 12% ARM, and 2% DR.
The most prevalent eye disease in people with visual impairment (VA ≤ 0.25) was ARM (37%). Of the visually impaired, 27% had unoperated cataract, 22% glaucoma, and 7% dr. the high prevalence and important role of these mainly age-related eye diseases as a cause of visual impairment, together with the growing number of the elderly, necessiate continuous efforts to discover and treat eye diseases in order to maintain the quality of life of patients and to alleviate the social and economic burden of serious eye diseases.
Our results suggest that VA has a strong independent influence on physical functioning in persons aged 55 years and above. decreased va was strongly associated with functional limitations, and even a slight decrease in va was found to be associated with limited functioning. the prevalence of limitations in most iadl and mobility functions increased already at VA 0.5–0.63. Persons with VA < 0.5 had an increased likelihood of having limitations in almost all adl, iadl, and mobility functions. a need for assistance was reported by 71% of visually impaired persons, 24% of whom described receiving inadequate assistance in everyday activities.
Our findings showed that many of the visually impaired, older persons in particular,

89
have not had a recent vision examination and lack adequate low vision rehabilitation. only one-half (58%) of visually impaired people had had a recent vision examination, and one-third (31%) had received formal low vision rehabilitation. Level of visual impairment, low cognitive capacity, and living in an institution were associated with limited use of vision rehabilitation services. this highlights the need for regular evaluation of the visual function of elderly persons and actively supplying information about rehabilitation services.
as the number of elderly people is expected to increase markedly in the near future, age-related macular degeneration and subsequent visual impairment will also increase due to lack of a curative treatment. in the majority of cases, rehabilitation services will help to reduce the impact of visual impairment on functioning, postponing institutionalization and improving the quality of life (scott et al. 1999, hinds et al. 2003). the low prevalence of regular vision examinations and limited use of vision rehabilitation services highlight the need to screen visual function in elderly people living either at home or in an institution and to actively deliver information on rehabilitation services. every visually impaired person should receive vision rehabilitation tailored to meet their specific needs. Furthermore, timely provision of assistance and an adequate supply of social services are essential to prevent or postpone the need for institutionalization.

90
8 ACkNowLEDgMENtS
this study was carried out at the department of health and functional capacity, national public health institute. i am deeply grateful for the opportunity to work in this highly professional and supportive environment. i am indebted to the staff and to the participants of the health 2000 survey and the mini-finland survey for high-quality data sets. i am especially grateful to my fellow workers in the Tampere field group of the Health 2000 survey during 2000–2001.
my deepest gratitude is owned to my two supervisors. professor emerita leila laatikainen is thanked for her constructive criticism, tireless encouragement, and constant readiness to advise me during all phases of this work. she not only broadened my view on scientific thinking, but showed me that research is a way of life. I will forever be grateful to professor arpo aromaa for his expert guidance in epidemiology and public health. he also provided me with the opportunity to use the excellent research facilities of the Department of Health and Functional Capacity. I also thank my unofficial third supervisor, docent seppo Koskinen, for his friendly guidance and valuable advice. in the midst of the worst rush, he always made time to instruct me. i have been privileged to learn much from these three outstanding individuals.
I sincerely thank my official referees, Docent Pertti Era and Professor Per Söderberg, for the thorough evaluation and constructive comments that helped to improve the final version of this manuscript. i am grateful to carol ann pelli, honBsc, for revising the english language of this thesis.
i thank all coauthors for seamless collaboration and companionship. tommi härkänen, phd, and tuija martelin, phd, advised me on statistical and methodological issues, professor antti reunanen, provided expertise in epidemiology spiced with clinical knowledge, sirkka-liisa rudanko, md, phd, widened my view on visual function and vision rehabilitation, and päivi sainio, pt, msc, introduced me to the terminology of physical functioning and disability. i am also grateful for päivi’s unwavering support throughout this process.
my sincere gratitude is due to the entire staff at our department. especially to pirkko alha, virpi Killström, noora Kuosmanen, mikko pekkarinen, sirkka rinne, harri rissanen, ninni vanhalakka, and esa virtala for advice with various practical issues. i also wish to thank professor paul Knekt, for advice on statistical issues and vesa tanskanen for technical realization of the computer program for recording data.
i am grateful to the finnish federation of the visually impaired and the finnish register of visual impairment, especially researcher matti ojamo, for providing research material.

91
special thanks to rehabilitation workers and archivists at the central hospitals of finland and finnish ophthalmologists for collaboration during supplemental data collection.
i thanks to riitta nieminen for creating the layout of this thesis and tapio laitinen for the cover picture of this book. special thanks to mikael mustonen for providing a photo for the fourth orginal article and to my other coworkers in näkökeskus visio, the finnish federation of the visually impaired.
financial support provided to me by silmäsäätiö (in 2004–2007), the doctoral programme for public health (1.1.2007–30.6.2008), the social insurance institution of finland (in 2006–2008), the suomen silmälääkäriyhdistys (2007), and the evald and hilda nissin säätiö (2008) is gratefully acknowledged.
warm thanks to my family and relatives for their love and support throughout this project.
Helsinki, February 2009 Arja Laitinen
92
9 references
act on revision of primary health care act 1991/605 (in finnish). [laki kansanterveyslain muuttamisesta 1991/605]. http://www.finlex.fi/fi/laki/alkup/1991/19910605.
act on revision of specialized medical care 10 a § 1991/606 (in finnish). [laki erikoissairaanhoitolain 10 a §:n muuttamisesta 1991/606]. http://www.finlex.fi/fi/laki/alkup/2003/20030499.
Act on Social Insurance Institutions’s Rehabilitation Benefits and Rehabilitation Monetary Benefits 2005/566 (In Finnish). [laki Kansaneläkelaitoksen kuntoutusetuuksista ja kuntoutusrahaetuuksista 2005/566]. http://www.finlex.fi/fi/laki/ajantasa/2005/20050566.
act on specialized medical care 1989/1062 [erikoissairaanhoitolaki 1989/1062]. http://www.finlex.fi/fi/laki/ajantasa/1989/19891062.
aguero-torres h, fratiglioni l, guo Z, viitanen m, von strauss e and winblad B (1998): dementia is the major cause of functional dependence in the elderly: 3-year follow-up data from a population-based study. am J public health 88: 1452-1456.
aguero-torres h, von strauss e, viitanen m, winblad B and fratiglioni l (2001): institutionalization in the elderly: the role of chronic diseases and dementia. cross-sectional and longitudinal data from a population-based study. J clin epidemiol 54: 795-801.
allen sm and mor v (1997): the prevalence and consequences of unmet need. contrasts between older and younger adults with disability. med care 35: 1132-1148.
anand v, Buckley Jg, scally a and elliott dB (2003): postural stability in the elderly during sensory perturbations and dual tasking: the influence of refractive blur. Invest ophthalmol vis sci 44: 2885-2891.
anton a, andrada mt, mujica v, calle ma, portela J and mayo a (2004): prevalence of primary open-angle glaucoma in a spanish population: the segovia study. J glaucoma 13: 371-376.
appollonio i, carabellese c, frattola l and trabucchi m (1996): effects of sensory aids on the quality of life and mortality of elderly people: a multivariate analysis. age ageing 25: 89-96.
aromaa a, heliövaara m, impivaara o, Knekt p, maatela J, Joukamaa m, Klaukka t, lehtinen v, melkas t, mälkiä e, nyman K, paunio i, reunanen a, sievers K, Kalimo e and Kallio v (1989): health, functional limitations and need for care in finland; Basic results from the mini-finland health survey (in finnish with an english summary). publications of the social insurance institution, al:32. helsinki and turku.
aromaa a and Koskinen s (2004): health and functional capacity in finland. Baseline results of the health 2000 health examination survey. publications of the national public health institute. B12/2004. helsinki.

93
attebo K, ivers rQ and mitchell p (1999): refractive errors in an older population: the Blue mountains eye study. ophthalmology 106: 1066-1072.
attebo K, mitchell p and smith w (1996): visual acuity and the causes of visual loss in australia. the Blue mountains eye study. ophthalmology 103: 357-364.
Backlund lB, algvere pv and rosenqvist u (1997): new blindness in diabetes reduced by more than one-third in stockholm county. diabet med 14: 732-740.
Bassey eJ, fiatarone ma, o’neill ef, Kelly m, evans wJ and lipsitz la (1992): leg extensor power and functional performance in very old men and women. clin sci (lond) 82: 321-327.
Bergman B and sjöstrand J (1992): vision and visual disability in the daily life of a representative population sample aged 82 years. acta ophthalmol (copenh) 70: 33-43.
Bird ac, Bressler nm, Bressler sB, chisholm ih, coscas g, davis md, de Jong pt, Klaver cc, Klein BE, Klein R and et al. (1995): An international classification and grading system for age-related maculopathy and age-related macular degeneration. the international arm epidemiological study group. surv ophthalmol 39: 367-374.
Bischoff p (1995): long-term results of low vision rehabilitation in age-related macular degeneration. doc ophthalmol 89: 305-311.
Björnsson om, syrdalen p, Bird ac, peto t and Kinge B (2006): the prevalence of age-related maculopathy (arm) in an urban norwegian population: the oslo macular study. acta ophthalmol scand 84: 636-641.
Bonomi l, marchini g, marraffa m, Bernardi p, de franco i, perfetti s, varotto a and tenna V (1998): Prevalence of glaucoma and intraocular pressure distribution in a defined population. the egna-neumarkt study. ophthalmology 105: 209-215.
Boult c, Kane rl, louis ta, Boult l and mccaffrey d (1994): chronic conditions that lead to functional limitation in the elderly. J gerontol 49: m28-36.
Branch lg, horowitz a and carr c (1989): the implications for everyday life of incident self-reported visual decline among people over age 65 living in the community. gerontologist 29: 359-365.
Branch lg and Jette am (1982): a prospective study of long-term care institutionalization among the aged. am J public health 72: 1373-1379.
Branch lg, Katz s, Kniepmann K and papsidero Ja (1984): a prospective study of functional status among community elders. am J public health 74: 266-268.
Bressler nm (2001): photodynamic therapy of subfoveal choroidal neovascularization in age-related macular degeneration with verteporfin: two-year results of 2 randomized clinical trials-tap report 2. arch ophthalmol 119: 198-207.
Bruce ml, seeman te, merrill ss and Blazer dg (1994): the impact of depressive symptomatology on physical disability: macarthur studies of successful aging. am J public health 84: 1796-1799.

94
Buch h, vinding t, la cour m, appleyard m, Jensen gB and nielsen nv (2004): prevalence and causes of visual impairment and blindness among 9980 scandinavian adults: the copenhagen city eye study. ophthalmology 111: 53-61.
Buch h, vinding t, la cour m and nielsen nv (2001a): the prevalence and causes of bilateral and unilateral blindness in an elderly urban danish population. the copenhagen city eye study. acta ophthalmol scand 79: 441-449.
Buch h, vinding t and nielsen nv (2001b): prevalence and causes of visual impairment according to world health organization and united states criteria in an aged, urban scandinavian population: the copenhagen city eye study. ophthalmology 108: 2347-2357.
Bylsma gw, le a, mukesh Bn, taylor hr and mccarty ca (2004): utilization of eye care services by Victorians likely to benefit from eye care. Clin Experiment Ophthalmol 32: 573-577.
cacciatore f, abete p, maggi s, luchetti g, calabrese c, viati l, leosco d, ferrara n, vitale df and rengo f (2004): disability and 6-year mortality in elderly population. role of visual impairment. aging clin exp res 16: 382-388.
carabellese c, appollonio i, rozzini r, Bianchetti a, frisoni gB, frattola l and trabucchi m (1993): sensory impairment and quality of life in a community elderly population. J am geriatr soc 41: 401-407.
Carta A, Braccio L, Belpoliti M, Soliani L, Sartore F, Gandolfi SA and Maraini G (1998): Self-assessment of the quality of vision: association of questionnaire score with objective clinical tests. curr eye res 17: 506-511.
cedrone c, nucci c, scuderi g, ricci f, cerulli a and culasso f (2006): prevalence of blindness and low vision in an italian population: a comparison with other european studies. eye 20: 661-667.
chang ts, Bressler nm, fine Jt, dolan cm, ward J and Klesert tr (2007): improved vision-related function after ranibizumab treatment of neovascular age-related macular degeneration: results of a randomized clinical trial. arch ophthalmol 125: 1460-1469.
chen pp (2003): Blindness in patients with treated open-angle glaucoma. ophthalmology 110: 726-733.
chenier mc (1997): review and analysis of caregiver burden and nursing home placement. geriatr nurs 18: 121-126.
chou Kl (2008): combined effect of vision and hearing impairment on depression in older adults: evidence from the english longitudinal study of ageing. J affect disord 106: 191-196.
cigolle ct, langa Km, Kabeto mu, tian Z and Blaum cs (2007): geriatric conditions and disability: the health and retirement study. ann intern med 147: 156-164.
coffey m, reidy a, wormald r, Xian wX, wright l and courtney p (1993): prevalence of glaucoma in the west of ireland. Br J ophthalmol 77: 17-21.
95
coppin aK, ferrucci l, lauretani f, phillips c, chang m, Bandinelli s and guralnik Jm (2006): low socioeconomic status and disability in old age: evidence from the inchianti study for the mediating role of physiological impairments. J gerontol a Biol sci med sci 61: 86-91.
cornoni-huntley Jc, foley dJ, white lr, suzman r, Berkman lf, evans da and wallace rB (1985): epidemiology of disability in the oldest old: methodologic issues and preliminary findings. Milbank Mem Fund Q Health Soc 63: 350-376.
crews Je and campbell va (2004): vision impairment and hearing loss among community-dwelling older americans: implications for health and functioning. am J public health 94: 823-829.
dahlin-ivanoff s, sonn u, lundgren-lindqvist B, sjostrand J and steen B (2000): disability in daily life activities and visual impairment. scand J occup ther 7: 148-155.
dana mr, tielsch Jm, enger c, Joyce e, santoli Jm and taylor hr (1990): visual impairment in a rural appalachian community. prevalence and causes. Jama 264: 2400-2405.
dargent-molina p, hays m and Breart g (1996): sensory impairments and physical disability in aged women living at home. int J epidemiol 25: 621-629.
de winter lJ, hoyng cB, froeling pg, meulendijks cf and van der wilt gJ (2004): prevalence of remediable disability due to low vision among institutionalised elderly people. gerontology 50: 96-101.
decree on medical rehabilitation 1991/1015 (in finnish). [asetus lääkinnällisestä kuntoutuksesta 1991/1015]. http://www.finlex.fi/fi/laki/ajantasa/1991/19911015.
desai mm, lentzner hr and weeks Jd (2001): unmet need for personal assistance with activities of daily living among older adults. gerontologist 41: 82-88.
deshpande n, metter eJ, lauretani f, Bandinelli s, guralnik J and ferrucci l (2008): activity restriction induced by fear of falling and objective and subjective measures of physical function: a prospective cohort study. J am geriatr soc 56: 615-620.
diabetes epidemiology research international group (1988): geographic patterns of childhood insulin-dependent diabetes mellitus. diabetes epidemiology research international group. diabetes 37: 1113-1119.
dielemans i, vingerling Jr, wolfs rc, hofman a, grobbee de and de Jong pt (1994): the prevalence of primary open-angle glaucoma in a population-based study in the netherlands. the rotterdam study. ophthalmology 101: 1851-1855.
dunlop dd, manheim lm, sohn mw, liu X and chang rw (2002): incidence of functional limitation in older adults: the impact of gender, race, and chronic conditions. arch phys med rehabil 83: 964-971.
edmonds sa and edmonds se (2006): new evidence that vision rehabilitation is a key component in the management of patients with macular degeneration. curr opin ophthalmol 17: 278-280.

96
ekström c (1996): prevalence of open-angle glaucoma in central sweden. the tierp glaucoma survey. acta ophthalmologica scandinavica 74: 107-112.
ensrud Ke, nevitt mc, yunis c, cauley Ja, seeley dg, fox Km and cummings sr (1994): correlates of impaired function in older women. J am geriatr soc 42: 481-489.
era p, schroll m, ytting h, gause-nilsson i, heikkinen e and steen B (1996): postural balance and its sensory-motor correlates in 75-year-old men and women: a cross-national comparative study. J gerontol a Biol sci med sci 51: m53-63.
evans Jr, fletcher ae, wormald rp, ng es, stirling s, smeeth l, Breeze e, Bulpitt cJ, nunes m, Jones d and tulloch a (2002): prevalence of visual impairment in people aged 75 years and older in Britain: results from the mrc trial of assessment and management of older people in the community. Br J ophthalmol 86: 795-800.
ferris fl, 3rd (1991): photocoagulation for diabetic retinopathy. early treatment diabetic retinopathy study research group. Jama 266: 1263-1265.
fleiss Jl (1981): statistical methods for rates and proportions. second edition. John wiley & sons, inc., new york.
foley dJ, ostfeld am, Branch lg, wallace rB, mcgloin J and cornoni-huntley Jc (1992): the risk of nursing home admission in three communities. J aging health 4: 155-173.
foran s, rose K, wang JJ and mitchell p (2002): correctable visual impairment in an older population: the blue mountains eye study. am J ophthalmol 134: 712-719.
foster pJ (2002): the epidemiology of primary angle closure and associated glaucomatous optic neuropathy. semin ophthalmol 17: 50-58.
fried lp, Bandeen-roche K, chaves ph and Johnson Ba (2000): preclinical mobility disability predicts incident mobility disability in older women. J gerontol a Biol sci med sci 55: m43-52.
fried lp, Bandeen-roche K, Kasper Jd and guralnik Jm (1999): association of comorbidity with disability in older women: the women’s health and aging study. J clin epidemiol 52: 27-37.
fried lp, Bandeen-roche K, williamson Jd, prasada-rao p, chee e, tepper s and rubin gs (1996): functional decline in older adults: expanding methods of ascertainment. J gerontol a Biol sci med sci 51: m206-214.
fried lp, herdman sJ, Kuhn Ke, rubin g and turano K (1991): preclinical disability. hypotheses about the bottom of the iceberg. J aging health 3: 285-300.
gallo JJ, rabins pv, lyketsos cg, tien ay and anthony Jc (1997): depression without sadness: functional outcomes of nondysphoric depression in later life. J am geriatr soc 45: 570-578.
gibson Jm, lavery Jr and rosenthal ar (1986): Blindness and partial sight in an elderly population. Br J ophthalmol 70: 700-705.
gibson Jm, rosenthal ar and lavery J (1985): a study of the prevalence of eye disease in the elderly in an english community. trans ophthalmol soc u K 104 ( Pt 2): 196-203.

97
goldberg dp, gater r, sartorius n, ustun tB, piccinelli m, gureje o and rutter c (1997): the validity of two versions of the ghQ in the who study of mental illness in general health care. psychol med 27: 191-197.
goldman n, Korenman s and weinstein r (1995): marital status and health among the elderly. soc sci med 40: 1717-1730.
gragoudas es, adamis ap, cunningham et, Jr., feinsod m and guyer dr (2004): pegaptanib for neovascular age-related macular degeneration. n engl J med 351: 2805-2816.
gresset J and Baumgarten m (2002): prevalence of visual impairment and utilization of rehabilitation services in the visually impaired elderly population of Quebec. optom vis sci 79: 416-423.
Guralnik JM, LaCroix AZ, Abbott RD, Berkman LF, Satterfield S, Evans DA and Wallace RB (1993): maintaining mobility in late life. i. demographic characteristics and chronic conditions. am J epidemiol 137: 845-857.
guralnik Jm, simonsick em, ferrucci l, glynn rJ, Berkman lf, Blazer dg, scherr pa and wallace rB (1994): a short physical performance battery assessing lower extremity function: association with self-reported disability and prediction of mortality and nursing home admission. J gerontol 49: m85-94.
harper r, doorduyn K, reeves B and slater l (1999): evaluating the outcomes of low vision rehabilitation. ophthalmic physiol opt 19: 3-11.
harris t, Kovar mg, suzman r, Kleinman Jc and feldman JJ (1989): longitudinal study of physical ability in the oldest-old. am J public health 79: 698-702.
heistaro s (2008): methodology report. health 2000 survey. publications of the national public health institute. B26/2008. helsinki, finland.
hiller r and Krueger de (1983): validity of a survey question as a measure of visual acuity impairment. am J public health 73: 93-96.
hinds a, sinclair a, park J, suttie a, paterson h and macdonald m (2003): impact of an interdisciplinary low vision service on the quality of life of low vision patients. Br J ophthalmol 87: 1391-1396.
hirvelä h and laatikainen l (1995): visual acuity in a population aged 70 years or older; prevalence and causes of visual impairment. acta ophthalmol scand 73: 99-104.
hirvelä h and laatikainen l (1997): diabetic retinopathy in people aged 70 years or older. the oulu eye study. Br J ophthalmol 81: 214-217.
hirvelä h, luukinen h and laatikainen l (1995): prevalence and risk factors of lens opacities in the elderly in finland. a population-based study. ophthalmology 102: 108-117.
hirvelä h, tuulonen a and laatikainen l (1994): intraocular pressure and prevalence of glaucoma in elderly people in finland: a population-based study. int ophthalmol 18: 299-307.
hodge wg, whitcher Jp and satariano w (1995): risk factors for age-related cataracts. epidemiol rev 17: 336-346.

98
hoevenaars Jg, schouten Js, van den Borne B, Beckers hJ and webers ca (2006): socioeconomic differences in glaucoma patients’ knowledge, need for information and expectations of treatments. acta ophthalmol scand 84: 84-91.
häkkinen l (1984): vision in the elderly and its use in the social environment. scand J soc med suppl 35: 5-60.
Jacobs Jm, hammerman-rozenberg r, maaravi y, cohen a and stessman J (2005): the impact of visual impairment on health, function and mortality. aging clin exp res 17: 281-286.
Jagger c, spiers n and arthur a (2005): the role of sensory and cognitive function in the onset of activity restriction in older people. disabil rehabil 27: 277-283.
Jette am and Branch lg (1985): impairment and disability in the aged. J chronic dis 38: 59-65.
Jonasson f, arnarsson a, sasaki h, peto t, sasaki K and Bird ac (2003a): the prevalence of age-related maculopathy in iceland: reykjavik eye study. arch ophthalmol 121: 379-385.
Jonasson f, damji Kf, arnarsson a, sverrisson t, wang l, sasaki h and sasaki K (2003b): prevalence of open-angle glaucoma in iceland: reykjavik eye study. eye 17: 747-753.
Jonasson f and thordarson K (1987): prevalence of ocular disease and blindness in a rural area in the eastern region of iceland during 1980 through 1984. acta ophthalmol suppl 182: 40-43.
Kahn ha, leibowitz hm, ganley Jp, Kini mm, colton t, nickerson rs and dawber tr (1977): The Framingham Eye Study. I. Outline and major prevalence findings. Am J Epidemiol 106: 17-32.
Kaiser pK, Brown dm, Zhang K, hudson hl, holz fg, shapiro h, schneider s and acharya nr (2007): ranibizumab for predominantly classic neovascular age-related macular degeneration: subgroup analysis of first-year ANCHOR results. Am J Ophthalmol 144: 850-857.
Kaplan ga, strawbridge wJ, camacho t and cohen rd (1993): factors associated with change in physical functioning in the elderly: a six-year prospective study. Journal of aging and health 5: 140-153.
Katz J, tielsch Jm and sommer a (1997): prevalence and risk factors for refractive errors in an adult inner city population. invest ophthalmol vis sci 38: 334-340.
Katz s, ford aB, moskowitz rw, Jackson Ba and Jaffe mw (1963): studies of illness in the aged. the index of adl: a standardized measure of Biological and psychosocial function. Jama 185: 914-919.
Keeffe Je, weih lm, mccarty ca and taylor hr (2002): utilisation of eye care services by urban and rural australians. Br J ophthalmol 86: 24-27.
Kennedy J (2001): unmet and undermet need for activities of daily living and instrumental activities of daily living assistance among adults with disabilities: estimates from the 1994 and 1995 disability follow-back surveys. med care 39: 1305-1312.
Kirchner c and peterson r (1979): the latest data on visual disability from nchs. J vis impair Blind 73: 151-153.
99
Klaver CC, Wolfs RC, Vingerling JR, Hofman A and de Jong PT (1998): Age-specific prevalence and causes of blindness and visual impairment in an older population: the rotterdam study. arch ophthalmol 116: 653-658.
Klein Be and Klein r (1982): cataracts and macular degeneration in older americans. arch ophthalmol 100: 571-573.
Klein Be, Klein r, lee Ke and cruickshanks KJ (1998): performance-based and self-assessed measures of visual function as related to history of falls, hip fractures, and measured gait time. the Beaver dam eye study. ophthalmology 105: 160-164.
Klein Be, Klein r, lee Ke and cruickshanks KJ (1999a): associations of performance-based and self-reported measures of visual function. the Beaver dam eye study. ophthalmic epidemiol 6: 49-60.
Klein Be, Klein r and linton Kl (1992a): prevalence of age-related lens opacities in a population. the Beaver dam eye study. ophthalmology 99: 546-552.
Klein Be, Klein r, sponsel we, franke t, cantor lB, martone J and menage mJ (1992b): prevalence of glaucoma. the Beaver dam eye study. ophthalmology 99: 1499-1504.
Klein Be, moss se, Klein r, lee Ke and cruickshanks KJ (2003): associations of visual function with physical outcomes and limitations 5 years later in an older population: the Beaver dam eye study. ophthalmology 110: 644-650.
Klein r, davis md, magli yl, segal p, Klein Be and hubbard l (1991a): the wisconsin age-related maculopathy grading system. ophthalmology 98: 1128-1134.
Klein r, Klein Be, Jensen sc, mares-perlman Ja, cruickshanks KJ and palta m (1999b): age-related maculopathy in a multiracial united states population: the national health and nutrition examination survey iii. ophthalmology 106: 1056-1065.
Klein r, Klein Be, Jensen sc and moss se (1994a): the relation of socioeconomic factors to the incidence of proliferative diabetic retinopathy and loss of vision. ophthalmology 101: 68-76.
Klein r, Klein Be, Jensen sc, moss se and cruickshanks KJ (1994b): the relation of socioeconomic factors to age-related cataract, maculopathy, and impaired vision. the Beaver dam eye study. ophthalmology 101: 1969-1979.
Klein r, Klein Be, Knudtson md, meuer sm, swift m and gangnon re (2007): fifteen-year cumulative incidence of age-related macular degeneration: the Beaver dam eye study. ophthalmology 114: 253-262.
Klein r, Klein Be, lee Ke, cruickshanks KJ and chappell rJ (2001): changes in visual acuity in a population over a 10-year period : the Beaver dam eye study. ophthalmology 108: 1757-1766.
Klein r, Klein Be and linton Kl (1992c): prevalence of age-related maculopathy. the Beaver dam eye study. ophthalmology 99: 933-943.
Klein r, Klein Be, linton Kl and de mets dl (1991b): the Beaver dam eye study: visual acuity. ophthalmology 98: 1310-1315.
100
Klein r, Klein Be, moss se and demets dl (1986): the validity of a survey question to study diabetic retinopathy. am J epidemiol 124: 104-110.
Klein r, Klein Be, moss se and linton Kl (1992d): the Beaver dam eye study. retinopathy in adults with newly discovered and previously diagnosed diabetes mellitus. ophthalmology 99: 58-62.
Klein r, Klein Be, tomany sc, meuer sm and huang gh (2002): ten-year incidence and progression of age-related maculopathy: the Beaver dam eye study. ophthalmology 109: 1767-1779.
Klein r, peto t, Bird a and vannewkirk mr (2004): the epidemiology of age-related macular degeneration. am J ophthalmol 137: 486-495.
Klein r, wang Q, Klein Be, moss se and meuer sm (1995): the relationship of age-related maculopathy, cataract, and glaucoma to visual acuity. invest ophthalmol vis sci 36: 182-191.
laatikainen l and hirvelä h (1995): prevalence and visual consequences of macular changes in a population aged 70 years and older. acta ophthalmol scand 73: 105-110.
laforge rg, spector wd and sternberg J (1992): the relationship of vision and hearing impairment to one-year mortality and functional decline. J aging health 4: 126-148.
laitinen a, Koskinen s, harkanen t, reunanen a, laatikainen l and aromaa a (2005): a nationwide population-based survey on visual acuity, near vision, and self-reported visual function in the adult population in finland. ophthalmology 112: 2227-2237.
lang ia, guralnik Jm and melzer d (2007): physical activity in middle-aged adults reduces risks of functional impairment independent of its effect on weight. J am geriatr soc 55: 1836-1841.
langlois Ja, Keyl pm, guralnik Jm, foley dJ, marottoli ra and wallace rB (1997): Characteristics of older pedestrians who have difficulty crossing the street. Am J Public health 87: 393-397.
laplante mp, Kaye hs, Kang t and harrington c (2004): unmet need for personal assistance services: estimating the shortfall in hours of help and adverse consequences. J gerontol B psychol sci soc sci 59: s98-s108.
lawton mp and Brody em (1969): assessment of older people: self-maintaining and instrumental activities of daily living. gerontologist 9: 179-186.
leat sJ, fryer a and rumney nJ (1994): outcome of low vision aid provision: the effectiveness of a low vision clinic. optom vis sci 71: 199-206.
lee hK and scudds rJ (2003): comparison of balance in older people with and without visual impairment. age ageing 32: 643-649.
lee p, smith Jp and Kington r (1999): the relationship of self-rated vision and hearing to functional status and well-being among seniors 70 years and older. am J ophthalmol 127: 447-452.

101
lehtonen r and pahkinen e (1995): practical methods for design and analysis of complex surveys. wiley, chichester.
leibowitz hm, Krueger de, maunder lr, milton rc, Kini mm, Kahn ha, nickerson rJ, pool J, colton tl, ganley Jp, loewenstein Ji and dawber tr (1980): the framingham eye study monograph: an ophthalmological and epidemiological study of cataract, glaucoma, diabetic retinopathy, macular degeneration, and visual acuity in a general population of 2631 adults, 1973-1975. surv ophthalmol 24: 335-610.
leske mc (2007): open-angle glaucoma -- an epidemiologic overview. ophthalmic epidemiol 14: 166-172.
leske mc, heijl a, hyman l, Bengtsson B, dong l and yang Z (2007): predictors of long-term progression in the early manifest glaucoma trial. ophthalmology 114: 1965-1972.
leveille sg, lacroix aZ, hecht Ja, grothaus lc and wagner eh (1992): the cost of disability in older women and opportunities for prevention. Journal of women’s health 1: 53-61.
lin my, gutierrez pr, stone Kl, yaffe K, ensrud Ke, fink ha, sarkisian ca, coleman al and mangione cm (2004): vision impairment and combined vision and hearing impairment predict cognitive and functional decline in older women. J am geriatr soc 52: 1996-2002.
linton Kl, Klein Be and Klein r (1991): the validity of self-reported and surrogate-reported cataract and age-related macular degeneration in the Beaver dam eye study. am J epidemiol 134: 1438-1446.
liou hl, mccarty ca, Jin cl and taylor hr (1999): prevalence and predictors of undercorrected refractive errors in the victorian population. am J ophthalmol 127: 590-596.
livingston pm, carson ca, stanislavsky yl, lee se, guest cs and taylor hr (1994): methods for a population-based study of eye disease: the melbourne visual impairment project. ophthalmic epidemiol 1: 139-148.
livingston pm, lee se, mccarty ca and taylor hr (1997): a comparison of participants with non-participants in a population-based epidemiologic study: the melbourne visual impairment project. ophthalmic epidemiol 4: 73-81.
livingston pm, mccarty ca and taylor hr (1998): Knowledge, attitudes, and self care practices associated with age related eye disease in australia. Br J ophthalmol 82: 780-785.
lord sr, lloyd dg and li sK (1996): sensori-motor function, gait patterns and falls in community-dwelling women. age ageing 25: 292-299.
lord sr and menz hB (2000): visual contributions to postural stability in older adults. gerontology 46: 306-310.
lupsakko ta, mantyjarvi mi, Kautiainen hJ and sulkava ro (2003): decrease of functional or cognitive capacity explains the lack of eye examination in visually impaired older persons. J am geriatr soc 51: 573-574.
102
manchester d, woollacott m, Zederbauer-hylton n and marin o (1989): visual, vestibular and somatosensory contributions to balance control in the older adult. J gerontol 44: m118-127.
margrain th (2000): helping blind and partially sighted people to read: the effectiveness of low vision aids. Br J ophthalmol 84: 919-921.
marmot m, ryff cd, Bumpass ll, shipley m and marks nf (1997): social inequalities in health: next questions and converging evidence. soc sci med 44: 901-910.
marron Ja and Bailey il (1982): visual factors and orientation-mobility performance. am J optom physiol opt 59: 413-426.
martinez gs, campbell aJ, reinken J and allan Bc (1982): prevalence of ocular disease in a population study of subjects 65 years old and older. am J ophthalmol 94: 181-189.
mccarty ca, lloyd-smith cw, lee se, livingston pm, stanislavsky yl and taylor hr (1998): use of eye care services by people with diabetes: the melbourne visual impairment project. Br J ophthalmol 82: 410-414.
mccarty ca, nanjan mB and taylor hr (2000): operated and unoperated cataract in australia. clin experiment ophthalmol 28: 77-82.
mcKay r, mccarty ca and taylor hr (2000): diabetic retinopathy in victoria, australia: the visual impairment project. Br J ophthalmol 84: 865-870.
melzer d, gardener e and guralnik Jm (2005): mobility disability in the middle-aged: cross-sectional associations in the english longitudinal study of ageing. age ageing 34: 594-602.
ministry of social affairs and health (2005): uniform criteria for access to non-emergency treatment. handbooks of the ministry of social affairs and health. helsinki.
mitchell p, cumming rg, attebo K and panchapakesan J (1997a): prevalence of cataract in australia: the Blue mountains eye study. ophthalmology 104: 581-588.
mitchell p, hayes p and wang JJ (1997b): visual impairment in nursing home residents: the Blue mountains eye study. med J aust 166: 73-76.
mitchell p, smith w, attebo K and healey pr (1996): prevalence of open-angle glaucoma in australia. the Blue mountains eye study. ophthalmology 103: 1661-1669.
mitchell p, smith w, attebo K and wang JJ (1995): prevalence of age-related maculopathy in australia. the Blue mountains eye study. ophthalmology 102: 1450-1460.
mitchell p, smith w, wang JJ and attebo K (1998): prevalence of diabetic retinopathy in an older community. the Blue mountains eye study. ophthalmology 105: 406-411.
mitchell ra (1993): prevalence of age related macular degeneration in persons aged 50 years and over resident in australia. J epidemiol community health 47: 42-45.
mor v, murphy J, masterson-allen s, willey c, razmpour a, Jackson me, greer d and Katz s (1989): risk of functional decline among well elders. J clin epidemiol 42: 895-904.

103
moritz dJ, Kasl sv and Berkman lf (1995): cognitive functioning and the incidence of limitations in activities of daily living in an elderly community sample. am J epidemiol 141: 41-49.
munoz B, west sK, rodriguez J, sanchez r, Broman at, snyder r and Klein r (2002): Blindness, visual impairment and the problem of uncorrected refractive error in a mexican-american population: proyecto ver. invest ophthalmol vis sci 43: 608-614.
munoz B, west sK, rubin gs, schein od, Quigley ha, Bressler sB and Bandeen-roche K (2000): causes of blindness and visual impairment in a population of older americans: the salisbury eye evaluation study. arch ophthalmol 118: 819-825.
nagi sZ (1976): an epidemiology of disability among adults in the united states. milbank mem fund Q health soc 54: 439-467.
nagi sZ (1979): the concept and measurement of disability. in: ed Berkowitz (ed.) disability policies and government programs. (pp 1-15). praeger, new york.
nagi sZ (1991): disability concepts revisted: implications for prevention. in: am pope and ar tarlov (eds.). disability in america: toward a national agenda for prevention. (pp 309-327). division of health promotion and disease prevention, institute of medicine. national academy press, washington, d.c.
newland hs, hiller Je, casson rJ and obermeder s (1996): prevalence and causes of blindness in the south australian population aged 50 and over. ophthalmic epidemiol 3: 97-107.
newsom rs, mcalister Jc, saeed m and mchugh Jd (2001): transpupillary thermotherapy (ttt) for the treatment of choroidal neovascularisation. Br J ophthalmol 85: 173-178.
nilsson ul (1986): visual rehabilitation of patients with advanced diabetic retinopathy. a follow-up study at the low vision clinic, department of ophthalmology, university of linkoping. doc ophthalmol 62: 369-382.
nilsson ul (1988): visual rehabilitation of patients with advanced stages of glaucoma, optic atrophy, myopia or retinitis pigmentosa. doc ophthalmol 70: 363-383.
nilsson ul (1990): visual rehabilitation with and without educational training in the use of optical aids and residual vision. a prospective study of patients with advanced age-related macular degeneration. clin vision sci 6: 3-10.
nilsson ul and nilsson se (1986): rehabilitation of the visually handicapped with advanced macular degeneration. a follow-up study at the low vision clinic, department of ophthalmology, university of linkoping. doc ophthalmol 62: 345-367.
nizankowska mh and Kaczmarek r (2005): prevalence of glaucoma in the wroclaw population. the wroclaw epidemiological study. ophthalmic epidemiol 12: 363-371.
norburn Je, Bernard sl, Konrad tr, woomert a, defriese gh, Kalsbeek wd, Koch gg and ory mg (1995): self-care and assistance from others in coping with functional status limitations among a national sample of older adults. J gerontol B psychol sci soc sci 50: s101-109.
104
orr p, Barron y, schein od, rubin gs and west sK (1999): eye care utilization by older americans: the see project. salisbury eye evaluation. ophthalmology 106: 904-909.
owsley c, mcgwin g, Jr., scilley K, meek gc, seker d and dyer a (2007): effect of refractive error correction on health-related quality of life and depression in older nursing home residents. arch ophthalmol 125: 1471-1477.
penninx Bw, guralnik Jm, ferrucci l, simonsick em, deeg dJ and wallace rB (1998): depressive symptoms and physical decline in community-dwelling older persons. Jama 279: 1720-1726.
pevalin dJ (2000): multiple applications of the ghQ-12 in a general population sample: an investigation of long-term retest effects. soc psychiatry psychiatr epidemiol 35: 508-512.
picone g, Brown d, sloan f and lee p (2004): do routine eye exams improve vision? int J health care finance econ 4: 43-63.
ponte f, giuffre g and giammanco r (1994): prevalence and causes of blindness and low vision in the casteldaccia eye study. graefes arch clin exp ophthalmol 232: 469-472.
Primary Health Care Act 1972/66 [Kansanterveyslaki 1972/66]. http://www.finlex.fi/fi/laki/ajantasa/1972/19720066.
raasch tw, leat sJ, Kleinstein rn, Bullimore ma and cutter gr (1997): evaluating the value of low-vision services. J am optom assoc 68: 287-295.
rahmani B, tielsch Jm, Katz J, gottsch J, Quigley h, Javitt J and sommer a (1996): the cause-specific prevalence of visual impairment in an urban population. The Baltimore Eye survey. ophthalmology 103: 1721-1726.
rajala u, laakso m, Qiao Q and Keinanen-Kiukaanniemi s (1998): prevalence of retinopathy in people with diabetes, impaired glucose tolerance, and normal glucose tolerance. diabetes care 21: 1664-1669.
Reidy A, Minassian DC, Vafidis G, Joseph J, Farrow S, Wu J, Desai P and Connolly A (1998): prevalence of serious eye disease and visual impairment in a north london population: population based, cross sectional study. Bmj 316: 1643-1646.
reinstein dZ, dorward nl, wormald rp, graham a, o’connor i, charlton rm, yeatman m, dodenhoff r, touquet r and challoner t (1993): ‘correctable undetected visual acuity deficit’ in patients aged 65 and over attending an accident and emergency department. Br J ophthalmol 77: 293-296.
reuben dB, mui s, damesyn m, moore aa and greendale ga (1999): the prognostic value of sensory impairment in older persons. J am geriatr soc 47: 930-935.
reunanen a (2006): [diabetes yleistyy suomessa entistä kiivaammin, mutta diabeetikoiden ennuste paranee ja lisäsairauksien ilmaantuminen vähenee]. diabetes ja lääkäri 35: 7-10.
reyes-ortiz ca, Kuo yf, dinuzzo ar, ray la, raji ma and markides Ks (2005): near vision impairment predicts cognitive decline: data from the hispanic established populations for epidemiologic studies of the elderly. J am geriatr soc 53: 681-686.
105
ringvold a, Blika s, elsas t, guldahl J, Brevik t, hesstvedt p, hoff K, hoisen h, Kjorsvik s and rossvold i (1991): the middle-norway eye-screening study. ii. prevalence of simple and capsular glaucoma. acta ophthalmol (copenh) 69: 273-280.
robinson r, deutsch J, Jones hs, youngson-reilly s, hamlin dm, dhurjon l and fielder ar (1994): unrecognised and unregistered visual impairment. Br J ophthalmol 78: 736-740.
rosow i and Breslau n (1966): a guttman health scale for the aged. J gerontol 21: 556-559.
rouhiainen h and teräsvirta m (1990): Kuopio eye survey (Keys). acta ophthalmol (copenh) 68: 554-558.
rovner Bw and ganguli m (1998): depression and disability associated with impaired vision: the movies project. J am geriatr soc 46: 617-619.
rubin d (1987): multiple imputation for nonresponse in surveys. wiley, new york.
rubin gs, Bandeen-roche K, huang gh, munoz B, schein od, fried lp and west sK (2001): the association of multiple visual impairments with self-reported visual disability: see project. invest ophthalmol vis sci 42: 64-72.
rubin gs, munoz B, Bandeen-roche K and west sK (2000): monocular versus binocular visual acuity as measures of vision impairment and predictors of visual disability. invest ophthalmol vis sci 41: 3327-3334.
rubin gs, roche KB, prasada-rao p and fried lp (1994): visual impairment and disability in older adults. optom vis sci 71: 750-760.
rubin gs, west sK, munoz B, Bandeen-roche K, Zeger s, schein o and fried lp (1997): a comprehensive assessment of visual impairment in a population of older americans. the see study. salisbury eye evaluation project. invest ophthalmol vis sci 38: 557-568.
rudberg ma, furner se, dunn Je and cassel cK (1993): the relationship of visual and hearing impairments to disability: an analysis using the longitudinal study of aging. J gerontol 48: m261-265.
sager ma, dunham nc, schwantes a, mecum l, halverson K and harlowe d (1992): measurement of activities of daily living in hospitalized elderly: a comparison of self-report and performance-based methods. J am geriatr soc 40: 457-462.
salive me, guralnik J, christen w, glynn rJ, colsher p and ostfeld am (1992): functional blindness and visual impairment in older adults from three communities. ophthalmology 99: 1840-1847.
salive me, guralnik J, glynn rJ, christen w, wallace rB and ostfeld am (1994): association of visual impairment with mobility and physical function. J am geriatr soc 42: 287-292.
sasaki h, Jonasson f, Kojima m, Katoh n, ono m, takahashi n and sasaki K (2000): the Reykjavik Eye Study--prevalence of lens opacification with reference to identical Japanese studies. ophthalmologica 214: 412-420.
scanlan Jm and cuddeford Je (2004): low vision rehabilitation: a comparison of traditional and extended teaching programs. J vis impair Blind 98: 601-611.

106
scott iu, smiddy we, schiffman J, feuer wJ and pappas cJ (1999): Quality of life of low-vision patients and the impact of low-vision services. am J ophthalmol 128: 54-62.
seeman te, Berkman lf, charpentier pa, Blazer dg, albert ms and tinetti me (1995): Behavioral and psychosocial predictors of physical performance: macarthur studies of successful aging. J gerontol a Biol sci med sci 50: m177-183.
seeman te, charpentier pa, Berkman lf, tinetti me, guralnik Jm, albert m, Blazer d and rowe Jw (1994): predicting changes in physical performance in a high-functioning elderly cohort: macarthur studies of successful aging. J gerontol 49: m97-108.
shuttleworth gn, dunlop a, collins JK and James cr (1995): how effective is an integrated approach to low vision rehabilitation? two year follow up results from south devon. Br J ophthalmol 79: 719-723.
sievers K, melkas t and heliövaara m (1985): survey methods for musculoskeletal diseases. part 3. in: a aromaa, m heliövaara, o impivaara, p Knekt and J maatela (eds.). the execution of the mini-finland health survey (in finnish with an english summary). (pp 68-71). publications of the social insurance institution, ml:50. helsinki and turku.
sloan fa, ostermann J, Brown ds and lee pp (2005a): effects of changes in self-reported vision on cognitive, affective, and functional status and living arrangements among the elderly. am J ophthalmol 140: 618-627.
sloan fa, picone g, Brown ds and lee pp (2005b): longitudinal analysis of the relationship between regular eye examinations and changes in visual and functional status. J am geriatr soc 53: 1867-1874.
spiers na, matthews rJ, Jagger c, matthews fe, Boult c, robinson tg and Brayne c (2005): diseases and impairments as risk factors for onset of disability in the older population in England and Wales: findings from the Medical Research Council Cognitive Function and ageing study. J gerontol a Biol sci med sci 60: 248-254.
staKes reports (2001): the finnish register of visual impairment. annual statistics 2001. helsinki.
staKes reports (2007): the finnish register of visual impairment. annual statistics 2006. helsinki.
statistics finland (2007): statistical yearbook of finland 2007. statistics finland, helsinki.
stelmack J (2001): Quality of life of low-vision patients and outcomes of low-vision rehabilitation. optom vis sci 78: 335-342.
stenholm s, sainio p, rantanen t, alanen e and Koskinen s (2007a): effect of co-morbidity on the association of high body mass index with walking limitation among men and women aged 55 years and older. aging clin exp res 19: 277-283.
stenholm s, sainio p, rantanen t, Koskinen s, Jula a, heliovaara m and aromaa a (2007b): high body mass index and physical impairments as predictors of walking limitation 22 years later in adult finns. J gerontol a Biol sci med sci 62: 859-865.

107
stones mJ and Kozma a (1987): Balance and age in the sighted and blind. arch phys med rehabil 68: 85-89.
stuck ae, walthert Jm, nikolaus t, Bula cJ, hohmann c and Beck Jc (1999): risk factors for functional status decline in community-living elderly people: a systematic literature review. soc sci med 48: 445-469.
swanson mw and mcgwin g (2004): visual impairment and functional status from the 1995 national health interview survey on disability. ophthalmic epidemiol 11: 227-239.
tarkkanen a, reunanen a and Kivela t (2008): frequency of age-related macular degeneration among patients with primary chronic open-angle glaucoma and exfoliation glaucoma. acta ophthalmol 86: 697-698.
Tay T, Wang JJ, Lindley R, Chia EM, Landau P, Ingham N, Kifley A and Mitchell P (2007): sensory impairment, use of community support services, and quality of life in aged care clients. J aging health 19: 229-241.
taylor hr, livingston pm, stanislavsky yl and mccarty ca (1997): visual impairment in Australia: distance visual acuity, near vision, and visual field findings of the Melbourne visual impairment project. am J ophthalmol 123: 328-337.
tennstedt s, mcKinlay J and Kasten l (1994): unmet need among disabled elders: a problem in access to community long term care? soc sci med 38: 915-924.
the early treatment diabetic retinopathy study research group (1987): photocoagulation for diabetic macular edema: early treatment diabetic retinopathy study report no. 4. the early treatment diabetic retinopathy study research group. int ophthalmol clin 27: 265-272.
thiagalingam s, cumming rg and mitchell p (2002): factors associated with undercorrected refractive errors in an older population: the Blue mountains eye study. Br J ophthalmol 86: 1041-1045.
tielsch Jm, Javitt Jc, coleman a, Katz J and sommer a (1995): the prevalence of blindness and visual impairment among nursing home residents in Baltimore. n engl J med 332: 1205-1209.
tielsch Jm, sommer a, Katz J, Quigley h and ezrine s (1991a): socioeconomic status and visual impairment among urban americans. Baltimore eye survey research group. arch ophthalmol 109: 637-641.
tielsch Jm, sommer a, Katz J, royall rm, Quigley ha and Javitt J (1991b): racial variations in the prevalence of primary open-angle glaucoma. the Baltimore eye survey. Jama 266: 369-374.
tielsch Jm, sommer a, witt K, Katz J and royall rm (1990): Blindness and visual impairment in an american urban population. the Baltimore eye survey. arch ophthalmol 108: 286-290.
tobis Js, Block m, steinhaus-donham c, reinsch s, tamaru K and weil d (1990): falling among the sensorially impaired elderly. arch phys med rehabil 71: 144-147.

108
topouzis f, coleman al, harris a, anastasopoulos e, yu f, Koskosas a, pappas t, mavroudis l and wilson mr (2006): prevalence of age-related macular degeneration in greece: the thessaloniki eye study. am J ophthalmol 142: 1076-1079.
topouzis f, wilson mr, harris a, anastasopoulos e, yu f, mavroudis l, pappas t, Koskosas a and coleman al (2007): prevalence of open-angle glaucoma in greece: the thessaloniki eye study. am J ophthalmol 144: 511-519.
torres ha, Kabir Zn and winblad B (1995): distribution of home help services in an elderly urban-population – data from the Kungsholmen project. scand J soc welf 4: 274-279.
valbuena m, Bandeen-roche K, rubin gs, munoz B and west sK (1999): self-reported assessment of visual function in a population-based study: the see project. salisbury eye evaluation. invest ophthalmol vis sci 40: 280-288.
valkonen t, sihvonen ap and lahelma e (1997): health expectancy by level of education in finland. soc sci med 44: 801-808.
van der pols Jc, Bates cJ, mcgraw pv, thompson Jr, reacher m, prentice a and finch s (2000): visual acuity measurements in a national sample of British elderly people. Br J ophthalmol 84: 165-170.
van leeuwen r, Klaver cc, vingerling Jr, hofman a and de Jong pt (2003): the risk and natural course of age-related maculopathy: follow-up at 6 1/2 years in the rotterdam study. arch ophthalmol 121: 519-526.
van rens gh, chmielowski rJ and lemmens wa (1991): results obtained with low vision aids. a retrospective study. doc ophthalmol 78: 205-210.
vannewkirk mr, nanjan mB, wang JJ, mitchell p, taylor hr and mccarty ca (2000a): the prevalence of age-related maculopathy – the visual impairment project. ophthalmology 107: 1593-1600.
vannewkirk mr, weih l, mccarty ca, stanislavsky yl, Keeffe Je and taylor hr (2000b): visual impairment and eye diseases in elderly institutionalized australians. ophthalmology 107: 2203-2208.
VanNewkirk MR, Weih L, McCarty CA and Taylor HR (2001): Cause-specific prevalence of bilateral visual impairment in victoria, australia: the visual impairment project. ophthalmology 108: 960-967.
verbrugge lm and Jette am (1994): the disablement process. soc sci med 38: 1-14.
verbrugge lm, lepkowski Jm and imanaka y (1989): comorbidity and its impact on disability. milbank Q 67: 450-484.
vinding t (1989): age-related macular degeneration. macular changes, prevalence and sex ratio. an epidemiological study of 1000 aged individuals. acta ophthalmol (copenh) 67: 609-616.
vingerling Jr, dielemans i, hofman a, grobbee de, hijmering m, Kramer cf and de Jong pt (1995): the prevalence of age-related maculopathy in the rotterdam study. ophthalmology 102: 205-210.

109
virtanen p and laatikainen l (1991): primary success with low vision aids in age-related macular degeneration. acta ophthalmol (copenh) 69: 484-490.
wallhagen mi, strawbridge wJ, shema sJ, Kurata J and Kaplan ga (2001): comparative impact of hearing and vision impairment on subsequent functioning. J am geriatr soc 49: 1086-1092.
wang f, ford d, tielsch Jm, Quigley ha and whelton pK (1994): undetected eye disease in a primary care clinic population. arch intern med 154: 1821-1828.
Wang JJ, Foran S and Mitchell P (2000): Age-specific prevalence and causes of bilateral and unilateral visual impairment in older australians: the Blue mountains eye study. clin experiment ophthalmol 28: 268-273.
wang JJ, foran s, smith w and mitchell p (2003a): risk of age-related macular degeneration in eyes with macular drusen or hyperpigmentation: the Blue mountains eye study cohort. arch ophthalmol 121: 658-663.
wang JJ, mitchell p, cumming rg and smith w (2003b): visual impairment and nursing home placement in older australians: the Blue mountains eye study. ophthalmic epidemiol 10: 3-13.
wang JJ, mitchell p and smith w (1999a): use of eye care services by older australians: the Blue mountains eye study. aust n Z J ophthalmol 27: 294-300.
wang JJ, mitchell p, smith w, cumming rg and attebo K (1999b): impact of visual impairment on use of community support services by elderly persons: the Blue mountains eye study. invest ophthalmol vis sci 40: 12-19.
wang JJ, mitchell p, smith w, cumming rg and leeder sr (2001): incidence of nursing home placement in a defined community. Med J Aust 174: 271-275.
wang JJ, mitchell p, smith w and leeder sr (1999c): factors associated with use of community support services in an older australian population. aust n Z J public health 23: 147-153.
wang JJ, rochtchina e, lee aJ, chia em, smith w, cumming rg and mitchell p (2007): ten-year incidence and progression of age-related maculopathy: the blue mountains eye study. ophthalmology 114: 92-98.
wang l, van Belle g, Kukull wB and larson eB (2002): predictors of functional change: a longitudinal study of nondemented people aged 65 and older. J am geriatr soc 50: 1525-1534.
watson gr, de l’aune w, long s, maino J and stelmack J (1997a): veterans’ use of low vision devices for reading. optom vis sci 74: 260-265.
watson gr, de l’aune w, stelmack J, maino J and long s (1997b): national survey of the impact of low vision device use among veterans. optom vis sci 74: 249-259.
weih lm, nanjan m, mccarty ca and taylor hr (2001): prevalence and predictors of open-angle glaucoma: results from the visual impairment project. ophthalmology 108: 1966-1972.
110
Weih LM, VanNewkirk MR, McCarty CA and Taylor HR (2000): Age-specific causes of bilateral visual impairment. arch ophthalmol 118: 264-269.
wensor md, mccarty ca, stanislavsky yl, livingston pm and taylor hr (1998): the prevalence of glaucoma in the melbourne visual impairment project. ophthalmology 105: 733-739.
west cg, gildengorin g, haegerstrom-portnoy g, schneck me, lott l and Brabyn Ja (2002a): is vision function related to physical functional ability in older adults? J am geriatr soc 50: 136-145.
west sK, friedman d, munoz B, roche KB, park w, deremeik J, massof r, frick Kd, Broman a, mcgill w, gilbert d and german p (2003): a randomized trial of visual impairment interventions for nursing home residents: study design, baseline characteristics and visual loss. ophthalmic epidemiol 10: 193-209.
west sK, munoz B, rubin gs, Bandeen-roche K, Broman at and turano Ka (2005): Compensatory strategy use identifies risk of incident disability for the visually impaired. arch ophthalmol 123: 1242-1247.
west sK, munoz B, rubin gs, schein od, Bandeen-roche K, Zeger s, german s and fried lp (1997): function and visual impairment in a population-based study of older adults. the see project. salisbury eye evaluation. invest ophthalmol vis sci 38: 72-82.
west sK, rubin gs, Broman at, munoz B, Bandeen-roche K and turano K (2002b): how does visual impairment affect performance on tasks of everyday life? the see project. salisbury eye evaluation. arch ophthalmol 120: 774-780.
whitson he, cousins sw, Burchett Bm, hybels cf, pieper cf and cohen hJ (2007): the combined effect of visual impairment and cognitive impairment on disability in older people. J am geriatr soc 55: 885-891.
williams gp, pathak-ray v, austin mw, lloyd ap, millington im and Bennett a (2007): Quality of life and visual rehabilitation: an observational study of low vision in three general practices in west glamorgan. eye 21: 522-527.
wolfs rc, Borger ph, ramrattan rs, Klaver cc, hulsman ca, hofman a, vingerling Jr, hitchings ra and de Jong pt (2000): changing views on open-angle glaucoma: definitions and prevalences--The Rotterdam Study. Invest Ophthalmol Vis Sci 41: 3309-3321.
world health organization (1973): the prevention of blindness. report of a who study group. world health organ tech rep ser 518: 1-18.
World Health Organization (1980): International Classification of Impairments, Disabilities, and handicaps. geneva.
world health organization (1991): grades of hearing impairment. hearing network news 1.
World Health Organization (2001): International classification of functioning, disability and health icf. world health organization, geneva.

111
wormald rp, wright la, courtney p, Beaumont B and haines ap (1992): visual problems in the elderly population and implications for services. BmJ 304: 1226-1229.
Åström s and linden c (2007): incidence and prevalence of pseudoexfoliation and open-angle glaucoma in northern sweden: i. Baseline report. acta ophthalmol scand 85: 828-831.
Åström s, stenlund h and linden c (2007): incidence and prevalence of pseudoexfoliations and open-angle glaucoma in northern sweden: ii. results after 21 years of follow-up. acta ophthalmol scand 85: 832-837.
Östberg A, Loth A, Gustafson D and Lindblom B (2006): Skovde cataract study: I. Prevalence of lens opacities in a swedish community. ophthalmology 113: 970-975.


![The Impact of Supplemental Antioxidants on Visual Function ... · wavelength [blue] light-filtering) properties make these com- ... with coantioxidants on visual function in patients](https://static.documents.pub/doc/80x56/5afd67737f8b9a994d8d6f5a/the-impact-of-supplemental-antioxidants-on-visual-function-blue-light-ltering.jpg)


