1 Guidelines # 07--2012 Reducing Commercial/Industrial Janitorial Water Use Background/Rationale: Janitorial functions for commercial/industrial (manufacturing plant, office building, hotel, restaurant, institution) cleaning often include a good deal of water use, an increasingly valuable global resource. Janitorial water use typically involves the use of specifically designed equipment for cleaning floors and surfaces in production/service areas, and production equipment/tools. Examples in this guideline include low flow spray nozzles, water brooms and microfiber mops, use of cold water washes and water reclaim systems. It may also involve an unnecessary and expensive amount of energy use (electricity or natural gas) for heating water. Any person/business seeking to make operations more sustainable should take steps to fully understand the janitorial water use and implement strategies to conserve water and energy resources. Optimizing water use and reducing energy consumption will, in turn, indirectly help reduce greenhouse gas emissions and any adverse environmental impact associated with excess emissions. Some improvements may be relatively simple and inexpensive to implement, while others may be more complex and require assistance from experienced professionals. The material contained in these guidelines is intended for use by persons who have a basic level of technical training/competence and familiarity with source reduction concepts and strategies. Step 1: Assess the Current Situation/Define the Scope of the Situation 1.1. Collect and analyze information about current operations, including but not limited to: identify key/relevant sources of information (see Appendix 1, all examples): o the environmental cause champion, o maintenance and/or facility supervisor(s), o purchasing or accounts payable personnel, o key suppliers/vendors, o business representative at local water utility o municipal building code or plumbing inspectors o local health department sanitarian (if situation involves food handling, human sanitation, or public health) collect pertinent documents and information (see Appendix 1, all examples): o policies/procedures related to water use: formal/informal guidelines/expectations regarding use o formal/informal guidelines/expectations for routine equipment maintenance o maintenance records, equipment specifications o utility bills identifying billing rates and water/energy usage keep track of, document and distinguish between key assumptions, known or reported values, and information which is calculated (see Appendix 1, all examples) identify number/location/type of equipment in question (see Appendix 1, all examples):
Transcript
1
Guidelines # 07--2012
Reducing Commercial/Industrial Janitorial Water Use
Background/Rationale: Janitorial functions for commercial/industrial (manufacturing plant, office
building, hotel, restaurant, institution) cleaning often include a good deal of water use, an increasingly
valuable global resource. Janitorial water use typically involves the use of specifically designed
equipment for cleaning floors and surfaces in production/service areas, and production equipment/tools.
Examples in this guideline include low flow spray nozzles, water brooms and microfiber mops, use of
cold water washes and water reclaim systems. It may also involve an unnecessary and expensive amount
of energy use (electricity or natural gas) for heating water. Any person/business seeking to make
operations more sustainable should take steps to fully understand the janitorial water use and implement
strategies to conserve water and energy resources. Optimizing water use and reducing energy
consumption will, in turn, indirectly help reduce greenhouse gas emissions and any adverse
environmental impact associated with excess emissions.
Some improvements may be relatively simple and inexpensive to implement, while others may be more
complex and require assistance from experienced professionals. The material contained in these
guidelines is intended for use by persons who have a basic level of technical training/competence and
familiarity with source reduction concepts and strategies.
Step 1: Assess the Current Situation/Define the Scope of the Situation 1.1. Collect and analyze information about current operations, including but not limited to:
identify key/relevant sources of information (see Appendix 1, all examples):
o the environmental cause champion,
o maintenance and/or facility supervisor(s),
o purchasing or accounts payable personnel,
o key suppliers/vendors,
o business representative at local water utility
o municipal building code or plumbing inspectors
o local health department sanitarian (if situation involves food handling, human sanitation,
or public health)
collect pertinent documents and information (see Appendix 1, all examples):
o policies/procedures related to water use:
formal/informal guidelines/expectations regarding use
o formal/informal guidelines/expectations for routine equipment maintenance
o maintenance records, equipment specifications
o utility bills identifying billing rates and water/energy usage
keep track of, document and distinguish between key assumptions, known or reported values,
and information which is calculated (see Appendix 1, all examples)
identify number/location/type of equipment in question (see Appendix 1, all examples):
2
o develop map using existing blueprints or new diagram to represent system being analyzed
so that everyone involved understands the scope and details of what is being analyzed
o may require expert consultation for some aspects (e.g. how much pressure required from
spray nozzles to complete the task satisfactorily)
conduct use analysis (see Appendix 1, all examples):
o identify type and number of uses per day/week/year per piece of equipment
o identify the temperature of the water being used
o identify routine and special uses through interviews, direct observation or using testing
equipment:
per area/unit
identify current and optimal water use requirements taking into account industry
standards, employee preferences, and tasks involved
o identify unnecessary uses by direct observation or interviews with key personnel
o identify maintenance schedule
identify tasks performed, frequency
identify reports, documentation related to maintenance
calculate amount/cost of water for entire facility and amount/cost associated with janitorial water
use to compare the impact on the overall water use at the facility (Note: Identifying flow rates or
water used for specific activities may require estimates, bucket/stopwatch testing, or other
assumptions. This may be the most difficult part of the project.) (see Appendix 1, all examples):
o calculate full water costs, i.e. water supplied + water disposed (sewer)
o verify utility rates per gallon from evaluation of the water bills
o estimate the annual gallons used/calculate cost for water by area/unit
o measure volume of water lost to identified leaks/drips
o consider preparing full water balance map of facility to categorize janitorial uses
o tag and possibly photograph areas needing adjustment (leaks/replacement), and plot on
diagram or map of facility.
o prioritize equipment for adjustment—fixing largest water uses first
calculate amount/cost of electricity for entire facility and amount/cost associated with hot water
use to compare the impact on the overall water use at the facility (see Appendix 1, Example 3):
o verify utility rate per kWh from evaluation of the electric bills
o estimate the annual gallons used/calculate cost for heating water by area/unit
calculate life cycle impact on greenhouse gas emissions from the water use reductions (see
Appendix 3 for examples)
1.2. Conduct necessary research and calculations using the following useful material:
The following references are used to help calculate water waste and to identify potential strategies for
improving efficiency of domestic water use and the water/energy nexus related to hot water use:
1. WaterSense, an EPA Partnership Program with suggestions/resources for water conservation,
available online at: http://www.epa.gov/watersense/pubs/indoor.html
2. American Water Works Association Water Wiser Drip Calculator available online at:
4. The “Save Water” section of the Food Service Technology Center Website available online at: http://www.fishnick.com/savewater/bestpractices/Water_Conservation_in_CFS.pdf
5. Watergy: A Water and Energy Conservation Model for Federal Facilities, Sharon deMonsabert
and Barry L. Liner, 1996, available online at: http://www.mendeley.com/research/watergy-a-
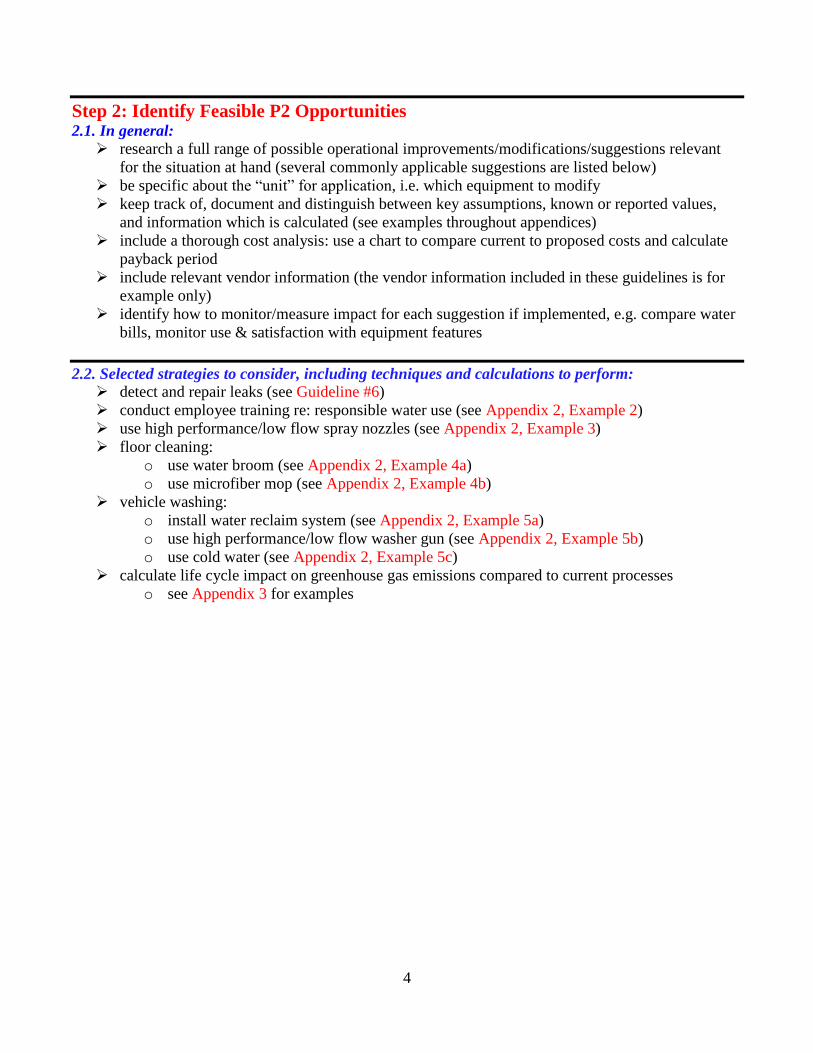
Step 2: Identify Feasible P2 Opportunities 2.1. In general:
research a full range of possible operational improvements/modifications/suggestions relevant
for the situation at hand (several commonly applicable suggestions are listed below)
be specific about the “unit” for application, i.e. which equipment to modify
keep track of, document and distinguish between key assumptions, known or reported values,
and information which is calculated (see examples throughout appendices)
include a thorough cost analysis: use a chart to compare current to proposed costs and calculate
payback period
include relevant vendor information (the vendor information included in these guidelines is for
example only)
identify how to monitor/measure impact for each suggestion if implemented, e.g. compare water
bills, monitor use & satisfaction with equipment features
2.2. Selected strategies to consider, including techniques and calculations to perform:
detect and repair leaks (see Guideline #6)
conduct employee training re: responsible water use (see Appendix 2, Example 2)
use high performance/low flow spray nozzles (see Appendix 2, Example 3)
floor cleaning:
o use water broom (see Appendix 2, Example 4a)
o use microfiber mop (see Appendix 2, Example 4b)
vehicle washing:
o install water reclaim system (see Appendix 2, Example 5a)
o use high performance/low flow washer gun (see Appendix 2, Example 5b)
o use cold water (see Appendix 2, Example 5c)
calculate life cycle impact on greenhouse gas emissions compared to current processes
o see Appendix 3 for examples
5
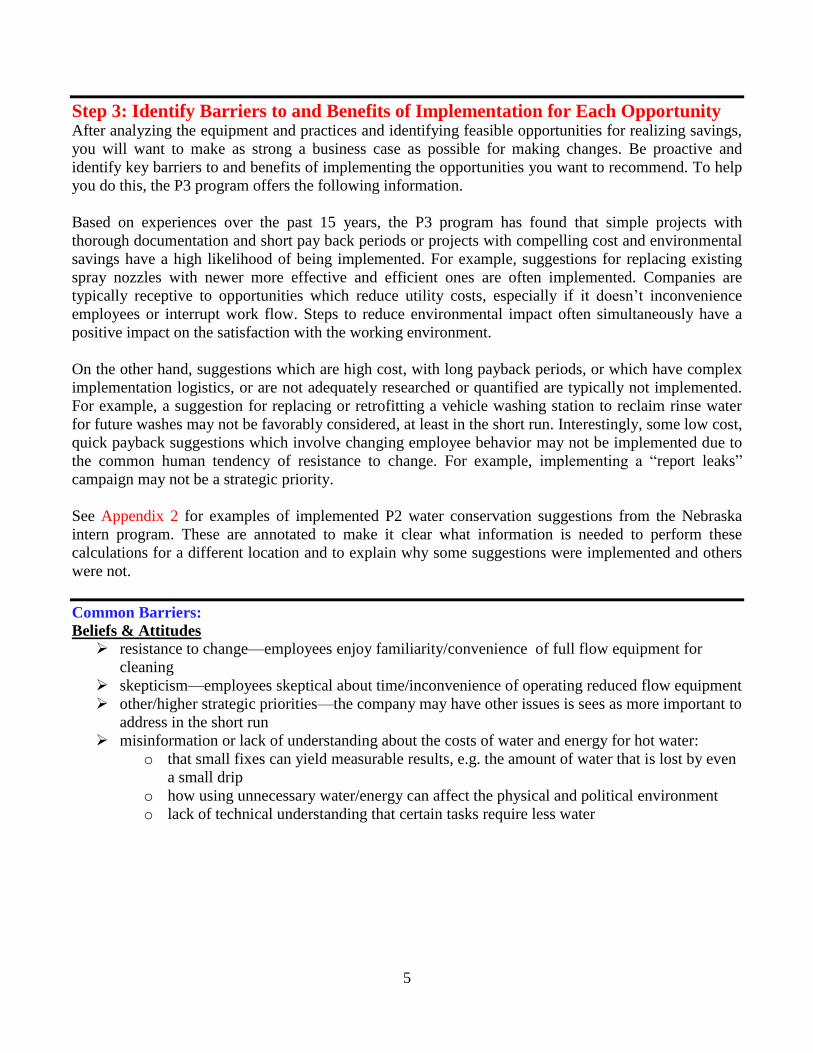
Step 3: Identify Barriers to and Benefits of Implementation for Each Opportunity After analyzing the equipment and practices and identifying feasible opportunities for realizing savings,
you will want to make as strong a business case as possible for making changes. Be proactive and
identify key barriers to and benefits of implementing the opportunities you want to recommend. To help
you do this, the P3 program offers the following information.
Based on experiences over the past 15 years, the P3 program has found that simple projects with
thorough documentation and short pay back periods or projects with compelling cost and environmental
savings have a high likelihood of being implemented. For example, suggestions for replacing existing
spray nozzles with newer more effective and efficient ones are often implemented. Companies are
typically receptive to opportunities which reduce utility costs, especially if it doesn’t inconvenience
employees or interrupt work flow. Steps to reduce environmental impact often simultaneously have a
positive impact on the satisfaction with the working environment.
On the other hand, suggestions which are high cost, with long payback periods, or which have complex
implementation logistics, or are not adequately researched or quantified are typically not implemented.
For example, a suggestion for replacing or retrofitting a vehicle washing station to reclaim rinse water
for future washes may not be favorably considered, at least in the short run. Interestingly, some low cost,
quick payback suggestions which involve changing employee behavior may not be implemented due to
the common human tendency of resistance to change. For example, implementing a “report leaks”
campaign may not be a strategic priority.
See Appendix 2 for examples of implemented P2 water conservation suggestions from the Nebraska
intern program. These are annotated to make it clear what information is needed to perform these
calculations for a different location and to explain why some suggestions were implemented and others
were not.
Common Barriers:
Beliefs & Attitudes
resistance to change—employees enjoy familiarity/convenience of full flow equipment for
cleaning
skepticism—employees skeptical about time/inconvenience of operating reduced flow equipment
other/higher strategic priorities—the company may have other issues is sees as more important to
address in the short run
misinformation or lack of understanding about the costs of water and energy for hot water:
o that small fixes can yield measurable results, e.g. the amount of water that is lost by even
a small drip
o how using unnecessary water/energy can affect the physical and political environment
o lack of technical understanding that certain tasks require less water
6
Costs and Investments
cost (time, effort and money) of implementing suggestions
o capital investment-“up-front costs”
o operating constraints: interrupting operations to implement changes
o time/costs of retrofitting equipment
timeline for return on investment (ROI)—length of payback period
perception of cheap and available water
overall low cost of water relative to entire bottom line
o the cost of disposal via the sanitary sewer usually doubles the cost of water
Technical Issues: What to Do and How
lack of knowledge/skills re: what needs to be done/how to implement strategies
o access to equipment for analyzing/adapting equipment
o access to plumber for modifications
concern re: managing logistics and process changes, including down time
Common Direct and Indirect Benefits:
Cost Savings
reduces costs and improves efficiency of operations by using less water to accomplish same tasks
reduces costs and improves efficiency of operations by using less energy to heat water to
accomplish tasks
potential opportunity for grant $$/utility incentives to pay for projects
Environmental Impact
reduces impact of water use on the environment:
o reduces use of natural resources/raw materials to produce water/energy
o reduces greenhouse gas emissions related to water/energy production
o conserves/preserves/provides clean environment/quality of life for future generations
Education
educates employees and general public in efficiency and responsibility when information is
posted about the change and why it was made
Company Image
demonstrates social responsibility and best management practices
positions company in good stead in community concerned about scarce water resources
7
Step 4: Make the Business Case for Change
4.1. Develop a written report for submission to decision makers.
include a thorough assessment of the system, with process descriptions, flow charts and use/cost
information.
outline specific P2 Opportunities/Suggestions with the following information:
o recommended action
o brief summary of current operations
o cost of implementing recommendation
include labor costs/savings in your economic analyses.
o summary of benefits (acknowledge barriers but discuss how benefits outweigh):
potential cost savings ($)
water/electricity use reduction(s)
simple payback
indirect benefits: safety, risk/liability reduction, GHG reductions, etc.
always identify how to monitor/measure impact for future analysis: e.g. install water meter,
monitor employee satisfaction
incentives to change: conclude the report with a summary of the benefits to be realized from
implementing the recommendations made. Stress environmental stewardship. Call for action!
o you may want to reference previous successes in similar businesses as a selling point
o see Appendix 2 for example projects implemented and their results
4.2. Make an oral presentation to summarize your findings and call to action:
focus on pertinent details of system assessment and P2 opportunities
make it interesting yet include sufficient technical detail to be convincing and make the business
case for change— include a picture of the product/change in action
develop a final “impact” slide with table of metrics—call for action/change
allow time for question/answer period
4.3. Advocate for change based on metrics/facts and environmental ethic:
use informal interactions to establish trust in your abilities and to build a foundation for change
use written report and formal presentation to communicate your findings and provide the formal
information/rationale for implementing recommendations
emphasize sustainability (triple bottom line) and preserving resources for future generations
o water/energy conservation and the relationship to greenhouse gas emissions is
particularly important for hot water applications
use examples of implemented suggestions from past projects (see Appendix 2)
4.4. Report potential Greenhouse Gas (GHG) emission reductions as an important indirect benefit:
include in written report and oral presentation
include explanation of why GHG emissions are relevant/of concern to all businesses
calculate potential carbon dioxide equivalent (CO2e) emission reductions for each
recommendation
include an appendix in written report documenting calculations (see Appendix 3 for details and
example calculations for domestic/commercial indoor water use)
see Appendix 4 for additional tips for making the business case for change.
8
Appendix 1
Example Assessments of Janitorial Water Use Note: Several examples of janitorial water use assessments are included below. Each of these addresses
one or more of the steps needed to accomplish a thorough assessment. In these examples, we have
attempted to clarify for the reader what information is known or reported, what is logically assumed,
and what has been calculated. This is embodied within the narrative for easy reference. In an actual
report, these details would likely be in attached appendices so as not to interrupt the flow of the report.
Example #1: Assessment of Water Waste Due to Drips and Leaks (adapted from report by Andrew
Anderson, 2009--also included in Guideline #6)
Leaky faucets and showerheads can contribute to substantial water loss over extended periods of time if
left unrepaired. Four fixtures were observed to have continuous drip leaks while assessing the facility.
Using an online calculator that translates drips per minute into annual water usage, an estimated 15,768
gallons could be lost annually from these four observed fixtures (see calculations below). This doesn't
include the fixtures not observed to be dripping or future drips, which would waste even more water.
Not included in this analysis was a hard-to-measure continuous leak from the wall observed at the base
of a showerhead in one of the upper story dressing rooms, which contributes even more wasted water to
the sewer. This leaky water not only costs money (both for using municipal water and the sewer
charges), but affects the image of the facilities by employees, venue artists, and event goers.
Calculations for Dripping Fixtures Using the drip calculator from the American Water Works Association website: www.awwa.org/awwa/waterwiser/dripcalc.cfm
Fixture 1: Fixture 3:
Fixture 2: Fixture 4: TOTAL = 300 drips/minute
Yearly waste for 300 drips/min = 15,768 gallons/year
After evaluation of the water and sewer bills it was determined that a unit of water used costs $1.65, while a unit of water sent to the sewer costs $1.62. The public water utility uses a unit of water which is 748 gallons for calculation purposes. The calculation indicated the cost of the drips is approximately $70/year.
Example #2: Total Facility Water Material Balance to Determine Total Janitorial Water Use (adapted from report by Lindsay Grim, 2009)
A material balance/water flow analysis was conducted for a food processing plant. Most of the water
used is for the cleaning process, as shown in Figure 1 below. The following information and
assumptions were used to create the diagram. Information obtained from company personnel/observed:
Approximately 18,824,000 gallons of water used annually in the plant’s two facilities
16 hoses used 4 to 6 hours/day during the night shift cleaning process
o equipped with nozzles that have a flow rate of 7 gallons per minute (gpm)
1 hose in Facility #2 washroom used 12-14 hours/day
o Used 8 hours during the day shift and 4-6 hours during night shift for cleaning
o equipped with a nozzle that has a flow rate of 15 gpm (based on bucket test)
2 hoses in Facility #1 washrooms used 7-8 hour/day each
o Used 2 hour each during the day shift and 5-6 hours each during the night shift for
cleaning
o equipped with nozzles that have a flow rate of 15 gpm (based on bucket test)
5 hoses in knife cleaning room used 15 minutes/day for cleaning
o equipped with nozzles that have a flow rate of 7 gpm
Assumptions:
About 70% of total water use is for cleaning process
20% of total water use is in the cooling process (including evaporation)
About 10% of total water use is for domestic and landscaping purposes
22 production days/month
The cost of 1 gallon of water is approximately $0.00125; the cost of disposal of 1 gallon of water
is approximately $0.00118; therefore the total cost for 1 gallon water (water + sewer costs) used
is $.00243, based on data supplied by company.
Calculations:
16 hoses x 4 hrs/day (300 min/day) x 7 gpm = 26,880 gal/day for night shift
1 hose x 8 hrs/day (480 min/day) x 15 gpm = 7,200 gal/day for day shift
1 hose x 4 hrs/day (300 min/day) x 15 gpm = 3,600 gal/day for night shift
2 hoses x 2 hr/day (120 min/day) x 15 gpm = 3,600 gal/day for day shift
2 hoses x 5 hrs/day (360 min/day) x 15 gpm = 9,000/gal day for night shift
5 hoses x 15 min/day x 7 gpm = 525/gal day for day shift
Total = 50,800 gal/day x 22 days x 12 months = 13,400,000 gal/yr
10
Figure 1. Water Usage at Plant’s Facilities
The material balance/ water flow analysis has shown that approximately 70% of total water use is for
cleaning process or approximately 13,400,000 gallons/year. Based on the cost of water and sewerage at
the facility this used costs $32,560/year.
Water in Facilities 1 and 2
Accumulation = 0
Incoming
water
~18,824,000
gal/yr
Water sent
to
wastewater
treatment
plant or lost
to
evaporation
~18,824,000
Water for
cooling
~3,614,000
gal/yr
Water for
cleaning
~13,400,000
gal/yr
Water for
domestic and
landscape use
~1,810,000
gal/yr
11
Example #3: Assessment of Water and Energy Use for Cold and Hot Water Use (adapted from
report by Lindsay Grim, 2009)
Vehicles in the company fleet are washed routinely with heated water and kept clean to foster a positive
public image for the company. The following information was gathered from maintenance staff, utility
invoices, and through observation in order to determine the environmental impacts of the vehicle
washing process as shown in the calculations below:
Calculations for Water/Energy Use Known Values: --wash water heated to 200°F by natural gas --boiler runs at 85.7 boiler horsepower (Bhp) --Conversation from BHp to BTU/hr is 1 BHp to 33,475 BTU/hr--wash spray valve flow rate: 17 gallons per minutes (gpm) --345 working days per year --natural gas cost- average of $0.895/therm --cost of water is $0.00129/gallon Assumptions: --6-7 vehicles washed/day --20 minute wash/vehicle Calculations:
Annual Water Use:
Annual Cold Water Cost:
Annual Hot Water Energy Use:
Annual Hot Water Cost:
To wash vehicles with hot water on a routine basis costs the company $20,580/year in natural gas in
addition to the $1,060 cost of the water.
12
Appendix 2
Example P2 Opportunities for Reducing Janitorial Water Use Note: Several examples of opportunities for reducing janitorial water use are included below (see
separate Guideline # 006 for Domestic Water Use). Each of the examples below addresses a different
way to improve practices and achieve direct and/or indirect savings and each uses different techniques
for encouraging implementation. In these examples, calculations are embodied within the narrative for
easy reference, although in an actual report, these would likely be in appendices at the end so as not to
interrupt the flow of the report.
Example #1: Detect and repair leaks (adapted from report by Michael McKinney, 2009—also
included in Guideline #6: Domestic Water Use)
It was observed that water continuously leaked from the nozzle connected to the flex hose for washing..
The hose appeared to be mounted to the wall properly, but was leaking from within the nozzle at a rate
of 250 drops per minute. Using the water waste calculator available online at
www.awwa.org/awwa/waterwiser/dripcalc.cfm , it is estimated that the dripping nozzle wastes
approximately 13,000 gal/year water.
Assuming that the cost of a unit (750 gallons) of water in Lincoln, NE is $3.84, the cost for 13,000
gallons water/year is approximately $70:
A replacement nozzle costs approximately $26. The payback period for replacing the nozzle is 4.5
months ($26/$70 x 12 months = 4.5 months).
Implementation Status: Not yet reassessed to determine impact
Example #2: Conduct employee training (adapted from report by Lindsay Grim, 2009)
Create an employee training program on responsible water use and efficient cleaning.
Inform employees that it is not necessary to wash equipment that has not been used during the
day
Train employees on accurate hosing of equipment and how to check for water leaks in pipes and
hoses
Encourage employees to use the minimal amount of water necessary to properly clean equipment
Explain that conserving water is important to assure a continuing abundance of water to use for
ourselves and for future generations
Explain the importance of water conservation, highlighting these potential savings (calculations
are shown below):
o Annual water savings: 3,388,000 gallons
o Annual cost savings: $8,200
o Based on goal to reduce water usage in the cleaning process by 30%
The payback period would be immediate, as costs for training are negligible. After training, monitor the
water usage compared to the baseline (pre-training) level and reward employees for conserving water
and efficient cleaning.
Calculations for Reducing Water Use
Known Values: --Annual water used for cleaning: 11,294,390 gallons/year (as explained in the report’s waste assessment section – not included in this guideline) --Total water cost $0.00243 per gallon based on bills reviewed Assume reduce water use 30% as a result of employee training/monitoring: --.30 X 11,294,390 = 3,388,317 gallons/year saved --3,388 X $0.00243/gal = $8,233/year saved
Implementation Status: Not yet reassessed to determine impact.
Example #3: Install high performance/low-flow spray valves (adapted from report by Lindsay Grim,
2009)
Across the country, water and sewer rates are rising. It is important that the plant reduce its water
consumption in order to contain costs and to demonstrate a corporate commitment to water conservation
and sustainability.
Currently, eight hoses are used for varying amounts of time during the day-shift for cleaning small
equipment. These hoses use high-flow nozzles that spray large volumes of water at low pressure, which
is an inefficient use of water for cleaning small equipment. According to calculations using current flow
rates, 2,989,800 gallons/water/year are consumed. At a cost of $.00243/gallon, that results in almost
$7300/year. The installation of low-flow spray valves will decrease the amount of water used each day
and the cost of buying and disposing of water. A high performance, low-flow spray valve’s cleaning
performance may be as good as or better than the high-flow units. This means that productivity may be
improved as well.
Spray valves were researched and the following alternatives were found (see detailed product
information below):
Fisher Manufacturing pre-rinse spray valve
o Flow rate of 1.15 gpm at 60 psi
o Test proven to clean fast with less splash back and mist
o Even and consistent spray pattern cleans a larger surface area
o Comfortable grip
o Cost: $45.95/ea
T&S Brass B-0108
o Flow rate of 1.48 gpm at 60 psi
o Chrome plated brass spray valve with a stainless steel trigger
o Innovative ergonomic design to reduce hand fatigue
o Cost: $88.90/ea
14
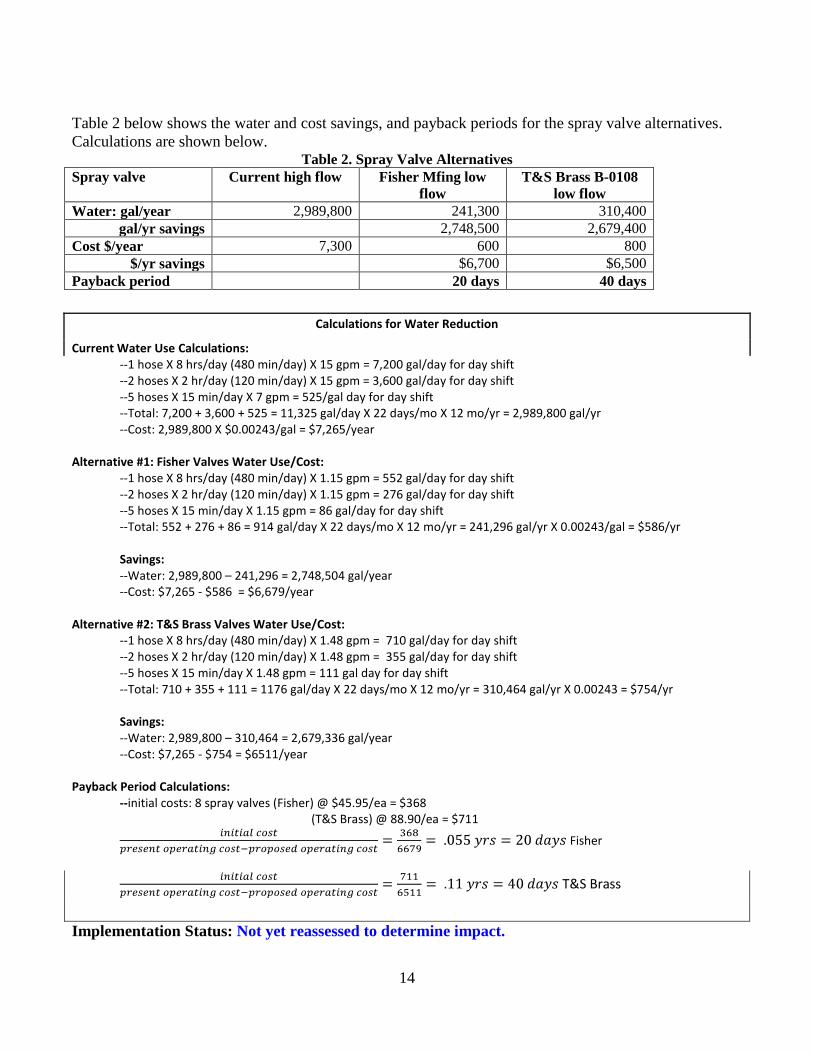
Table 2 below shows the water and cost savings, and payback periods for the spray valve alternatives.
Calculations are shown below. Table 2. Spray Valve Alternatives
Spray valve Current high flow Fisher Mfing low
flow
T&S Brass B-0108
low flow
Water: gal/year 2,989,800 241,300 310,400
gal/yr savings 2,748,500 2,679,400
Cost $/year 7,300 600 800
$/yr savings $6,700 $6,500
Payback period 20 days 40 days
Calculations for Water Reduction
Current Water Use Calculations: --1 hose X 8 hrs/day (480 min/day) X 15 gpm = 7,200 gal/day for day shift --2 hoses X 2 hr/day (120 min/day) X 15 gpm = 3,600 gal/day for day shift --5 hoses X 15 min/day X 7 gpm = 525/gal day for day shift --Total: 7,200 + 3,600 + 525 = 11,325 gal/day X 22 days/mo X 12 mo/yr = 2,989,800 gal/yr
--Cost: 2,989,800 X $0.00243/gal = $7,265/year Alternative #1: Fisher Valves Water Use/Cost:
--1 hose X 8 hrs/day (480 min/day) X 1.15 gpm = 552 gal/day for day shift --2 hoses X 2 hr/day (120 min/day) X 1.15 gpm = 276 gal/day for day shift --5 hoses X 15 min/day X 1.15 gpm = 86 gal/day for day shift --Total: 552 + 276 + 86 = 914 gal/day X 22 days/mo X 12 mo/yr = 241,296 gal/yr X 0.00243/gal = $586/yr Savings: --Water: 2,989,800 – 241,296 = 2,748,504 gal/year --Cost: $7,265 - $586 = $6,679/year
Alternative #2: T&S Brass Valves Water Use/Cost: --1 hose X 8 hrs/day (480 min/day) X 1.48 gpm = 710 gal/day for day shift --2 hoses X 2 hr/day (120 min/day) X 1.48 gpm = 355 gal/day for day shift --5 hoses X 15 min/day X 1.48 gpm = 111 gal day for day shift --Total: 710 + 355 + 111 = 1176 gal/day X 22 days/mo X 12 mo/yr = 310,464 gal/yr X 0.00243 = $754/yr Savings: --Water: 2,989,800 – 310,464 = 2,679,336 gal/year --Cost: $7,265 - $754 = $6511/year
Table 2. Water Use and Cost for Cleaning with Water Broom
High Pressure hose = 5 gpm
Cost of water = $.001734/gallon
Area Cleaning
Frequency
Time Spent on
Floor (min)
Water Used (gallons per week)
20% (est) Reduction in
Water Use (gallons per week)
Reduction in Water Costs
Line 1 Daily 30 750 150 $0.26
Line 2 Daily 30 750 150 $0.26
Line 3 Daily 30 750 150 $0.26
Line 4 Daily 30 750 150 $0.26
Line 5 Daily 30 750 150 $0.26
East Loading Dock Daily 30 750 150 $0.26
South Loading Dock Daily 30 750 150 $0.26
West Loading Dock Weekly 30 150 30 $0.05
TOTAL (nightly avg) 1,080 216 $0.38
TOTAL (weekly) 1080 5,400 1,080 $1.89
TOTAL (annual) 56,160 280,800 56,160 $98.05
Implementation Status: Not yet reassessed to determine impact.
Example #4b: Use microfiber mopping (adapted from report by Tanner Augustin, 2005)
A hospital requested assistance from the P3 program to analyze its wastewater discharge and to identify
areas, processes or wastes that could be reduced, eliminated or better managed. While the hospital had
already undertaken initiatives to reduce and manage other waste in environmentally ethical ways (e.g.,
eliminated mercury, recycled batteries and electronics, used green-tip light bulbs, reverse distributed
pharmaceuticals), additional opportunities were identified. Hospital employees provided information on
the types and volumes of wastes discharged to the sanitary sewer.
One of those opportunities to reduce water use involved implementing the 3M Easy Scrub mopping
system that uses microfiber as opposed to the standard string mop to reduce the amount of chemicals
and water needed for mopping floors. The microfiber is blended from polyester and nylon and split into
a fiber that is a fraction of the diameter of a hair. The microscopic size of the fibers permits these mops
to clean better since they can reach into the tiny pockets of flooring surfaces and “grab” the dirt. The
spaces around the microfibers provide more surface areas for trapping dirt and bacteria. The
conventional string mops tend to “push” the dirt around as opposed to picking it up.
A clean mop pad is used in every room so the potential risk of cross contamination from the mop is
virtually eliminated. The microfiber mop applies less chemical to the floor so the floor dries faster,
reducing the potential hazard to employees, patients, and visitors of slip, trip, and fall incidents. The
17
microfiber mop weighs only two pounds when wet, compared to eight pounds for the standard string
mop, reducing the potential for employee injury to wrists and backs from use. Using a microfiber mop
saves an average of six minutes of labor per room and makes it easier to reach easily under beds and
tables. The annual savings of the 3M System is approximately $4,870, based on reduced mop and
chemical costs as shown in the calculations below. The savings is predominately in chemical costs but
the amount of water conserved annually is over 23,000 gallons/year. The cost to implement the system
is approximately $4,200, with a payback period of 0.9 years.
Calculations for Microfiber vs. Traditional Mopping Standard mop Microfiber mop Savings
Mop Heads
# mop heads used daily 34 102
Cost per mop head $10.70 $7.40
Cost per day for mops $363.80 $754.80
Avg # laundering before replacement 70 350
# time mops replaced per year 5.21 1.04
Total Mops Cost/Yr $1897 $787 $1110
Water/Chemical Use
# times water changed/day 34 34
# gallons water used/time 2 0.117
Daily usage (gallons) 68 3.978
Total Water Used Gal/Yr 24,820 1452 23,368
Total Cost of water/yr($0.005/gallon) $124.10 $7.26 $117
# gallons chemical used/yr 194 11
cost per gallon $19.95 $19.95
Total Chemical Cost/Yr $3868 $226 $3642
Total Annual Cost Savings $4870
Area #5: Vehicle Washing
Example #5a: Install water reclaim/recycle system for washing vehicles (adapted from report by
Brent Hanson, 2009)
The company’s current wash bay plans do not include a water recycle system but planning has begun to
construct new vehicle washing facilities. With the construction phase not started yet, this
recommendation could easily be incorporated into the design. Current plans have the company using
fresh water for both the soap application and the rinse of the vehicle. Instead, the company could
capture the rinse water following the final rinse step of the washing process and use this for the
application of soap on the next vehicle. This would reduce the amount of water used and wastewater
produced. Savings from this process are detailed in Table 3 below. Estimates are based on the
assumption that the company will use only 50% of the amount of water/year as it currently does once a
reclaim/recycle system is installed. Detailed calculations are shown below.
18
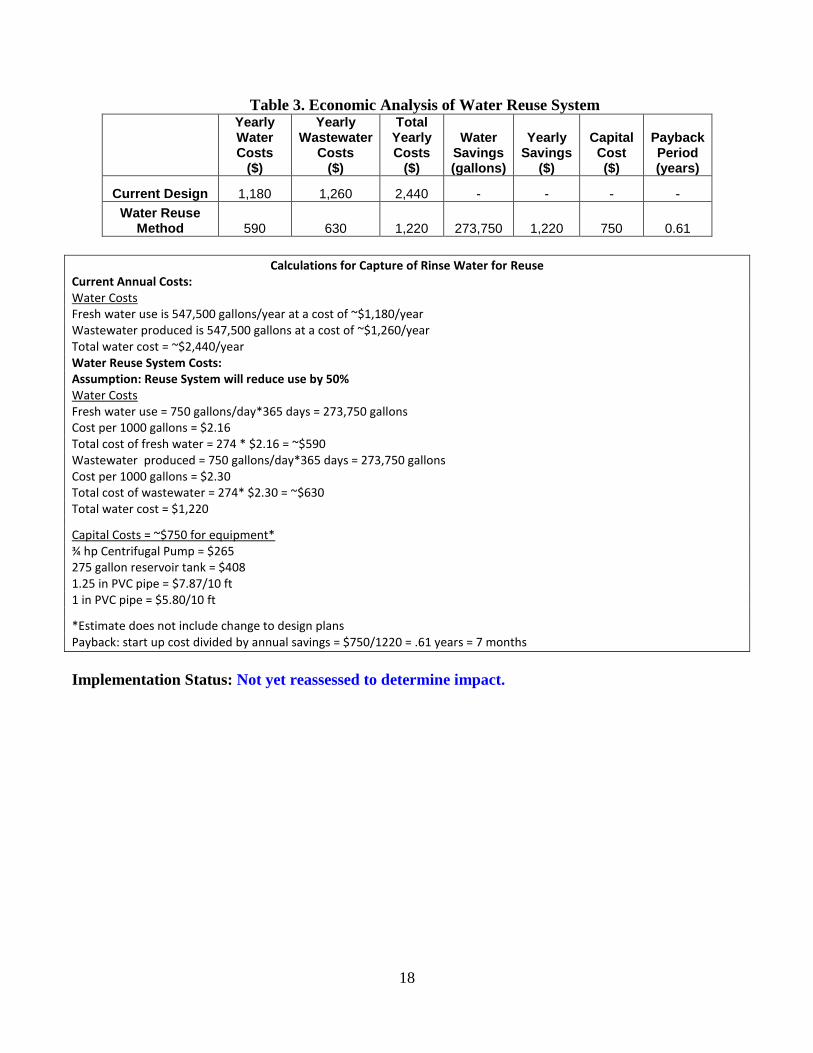
Table 3. Economic Analysis of Water Reuse System
Yearly Water Costs
($)
Yearly Wastewater
Costs ($)
Total Yearly Costs
($)
Water Savings (gallons)
Yearly Savings
($)
Capital Cost ($)
Payback Period (years)
Current Design 1,180 1,260 2,440 - - - -
Water Reuse Method 590 630 1,220 273,750 1,220 750 0.61
Calculations for Capture of Rinse Water for Reuse Current Annual Costs: Water Costs Fresh water use is 547,500 gallons/year at a cost of ~$1,180/year Wastewater produced is 547,500 gallons at a cost of ~$1,260/year Total water cost = ~$2,440/year Water Reuse System Costs: Assumption: Reuse System will reduce use by 50% Water Costs Fresh water use = 750 gallons/day*365 days = 273,750 gallons Cost per 1000 gallons = $2.16 Total cost of fresh water = 274 * $2.16 = ~$590 Wastewater produced = 750 gallons/day*365 days = 273,750 gallons Cost per 1000 gallons = $2.30 Total cost of wastewater = 274* $2.30 = ~$630 Total water cost = $1,220
Capital Costs = ~$750 for equipment* ¾ hp Centrifugal Pump = $265 275 gallon reservoir tank = $408 1.25 in PVC pipe = $7.87/10 ft 1 in PVC pipe = $5.80/10 ft
*Estimate does not include change to design plans Payback: start up cost divided by annual savings = $750/1220 = .61 years = 7 months
Implementation Status: Not yet reassessed to determine impact.
19
Example #5b: Use high performance, low-flow washer gun (Appendix 2, Example #3 above shows
the details for calculation and presentation of this suggestion.)
Example #5c: Use cold water for washing vehicles (adapted from report by Lindsay Grim, 2009)
Currently, vehicle washing water is heated to 200°F by natural gas. Because vehicle washing does not
require hot water, company should consider not using hot water for vehicle washing. This would save a
significant amount of energy and money each year as shown below in Table 5.
Table 5. Savings from Eliminating Water Heat in Vehicle Washing
Hours of
Washing/
year
Energy
Use/
year
Energy
Savings/
year
Cost/
year
Cost
Savings/
year
Payback
Period
Heating of
water
805 23,000
therm - $20,600
No heating
of water
805 0 therm 23,000
therm
$0 $20,600 Instantaneous
(Note to Reader: Calculations of these values are shown in Appendix 1, Example 3 of this
Guideline.)
Implementing this opportunity would generate other benefits as well. Employee safety would improve
due to the reduction in temperature of the water. According to the EPA Greenhouse Gas Equivalencies
Calculator, saving 23,000 therm of natural gas is equivalent to saving 122 metric tons of CO2e from
being emitted. See Appendix 3 for details.
Implementation Status: Not yet reassessed to determine impact.
20
Appendix 3
Greenhouse Gas Reductions Explanation and Calculations
Relevance of Greenhouse Gas Emission Estimates
This issue is an increasingly important one for business decision makers as it relates to regulations,
stakeholder interests and day-to-day business operations and energy use. There are several important
dimensions of analysis for any pollution prevention opportunity. One is certainly direct environmental
impact (e.g. reductions in solid or hazardous waste, water use, air pollution, or energy use). Another
important dimension is cost. Yet another is the intangible (not quantifiable) impact, such as reduced
liability, increased worker safety/satisfaction, or improved corporate image. A final important dimension
is indirectly estimating the impact on greenhouse gas (GHG) emissions that can be achieved by
implementing any given pollution prevention opportunity.
GHGs include a number of different gases such as carbon dioxide, methane, nitrous oxide, ozone,
chlorofluorocarbons and water vapor. These gases contribute to the “greenhouse effect” in the Earth’s
atmosphere. While GHGs make the planet warm enough to be habitable, an excessive amount of these
gases is believed to be building up in the atmosphere and causing the average global temperature to rise,
leading to climate change and instability. A significant spike in GHG concentrations in the atmosphere
has occurred since the industrial revolution, pointing to the man-made nature of this change. This is why
a new emphasis, and discussion of possible regulations, has been placed on reducing GHG emissions in
all parts of our society, including government, business and industry.
The most widely recognized unit for measuring GHG emissions is carbon dioxide equivalent (CO2e).
Each of the GHGs has a different capacity to heat the earth’s atmosphere, called its global warming
potential (GWP). Carbon dioxide (CO2) has a GWP of 1, so in order to standardize reporting, when
GHG emissions are calculated, they are reported as equivalent to a given volume of CO2.
Array of Calculation Tools
Reductions in GHG emissions can be estimated using a variety of calculation tools and computer
models. The direct environmental/cost benefits estimated or realized are used as quantified input for
these calculations, therefore the resulting GHG emission reduction estimates are considered indirect
benefits. Some commonly used tools are listed below:
--Nationally recognized conversion factors from the U.S. Department of Energy and the
American Water Works Association: these are used to estimate GHG emissions for electricity, natural
gas, and water use. For example, kilowatt-hours (kWh) of electricity used can be converted to GHG
emissions using a factor of 1.404 pounds CO2 e per kWh.
--EPA’s WAste Reduction Model (WARM): this tool is used to determine GHG emissions
related to solid waste. This online calculator uses a life-cycle approach to determine the change in GHG
emissions caused by alternative end-of-life waste management decisions or disposal methods for a
number of different kinds of wastes. For example, using the weight of a solid waste diverted from a
landfill and recycled, an approximate reduction in GHG can be calculated. WARM is periodically
updated and new material types are added by the EPA as new information from climate change research
becomes available.
--Economic Input Output Life Cycle Assessment (EIO-LCA): this model used to estimate GHG
reductions has been developed by researchers at Carnegie Mellon University. This model provides a
useful approximation of GHG reductions through the full life-cycle production of a material or
21
chemical, based on the cost savings from reductions in use. For example, if a business reduces its
lubricating oil purchases by $50,000, the EIO-LCA estimates the GHG emissions to produce that oil
through the mining, extracting, refining, packaging and delivery (to list a few) steps in the process of
getting that oil to the end user.
--Recycled Content (ReCon) Tool: EPA created the ReCon Tool to help companies and
individuals estimate life-cycle greenhouse gas (GHG) emissions and energy impacts from purchasing
and/or manufacturing materials with varying degrees of post-consumer recycled content.
--Pollution Prevention (P2) Greenhouse Gas (GHG) Calculator: designed by U.S. EPA in
conjunction with a panel of professionals from the P2 community with state and local governments,
business facilities, grantees, and project managers in mind. The tool was reviewed in national webinars
and conferences reaching over 600 participants and reworked to be more robust and user friendly. The
tool is available in an Excel format and finalized as of November 2011. U.S. EPA will periodically
update the tool as new information and data sources become available. It is designed to help calculate
GHG emissions reductions in metric tons of carbon dioxide equivalent (MTCO2e) from electricity
conservation, green energy, fuel and chemical substitutions, water conservation, and improved materials
and process management in the chemical manufacturing sector.
Selecting the Most Appropriate Tool(s):
When using one of these models to estimate GHG emission reductions for a client, always provide an
explanation of which model was used, why it is most relevant for the issue at hand, what assumptions
were applied, and the importance of reducing GHG emissions as a business and global sustainability
strategy.
A summary sentence stating the amount of GHG reduction should be included with each
recommendation, e.g. “Using cold water for vehicle washing will approximately 23,000 therms of
energy (natural gas) and reduce GHG emissions by approximately 122 MTCO2e/year. A detailed
appendix should be developed which shows how the GHG emission reductions were calculated. An
example of an appendix documenting such follows.
Example Appendix of Greenhouse Gas Calculations Opportunity #1 – Use cold water for washing vehicles GHG calculated using EPA’s P2 GHG Calculator Savings: --23,000 therms reduction in natural gas usage per year Assumptions: --GHG conversion based on Nebraska conversion factor --11.728 lb CO2e (Metric Ton of Carbon Dioxide Equivalent) per therm based on the EPA GHG Calculator --1 MTCO2e is equal to 2204.6 lb
Opportunity #2 – Use high performance, low-flow spray valves for cleaning GHG calculated using EPA’s P2 GHG Calculator Savings: --2,748,500 gallons water per year = 8.160 MTCO2e Assumptions: --GHG conversion based on regional conversion factor Calculations: MTCO2e = Water Conserved (gal.) * (3,300 kwh / 1,000,000 gal. water used)* [either National or Regional emissions factor] Regional Conversion factor: (0.000498 to 0.00090 MTCO2e/kwh)
Sources: (a) Source 10: Water and Sustainability: U.S. Electricity Consumption for Water Supply & Treatment—The Next Half Century, EPRI, Palo Alto, CA: 2000. 1006787. (b) Source 1: U.S. EPA, Clean Energy. "eGRID 2010 Version 1.1." May 2011. (c) Source 2: US EPA, Downloadable Document: "Unit Conversions, Emissions Factors, and Other Reference Data, 2004." Table I, Page 1.