1 1 TCS Confidential TCS Confidential Reducing Cycle Time of End to End Telecom Network Design Process Sector – Telecom Project Methodology – DMAIC 2 TCS Confidential TCS Confidential TCS Growth Story-2016-17 TCS over the years TCS Service Spectrum PEOPLE • Rural Services • Domain University • Academic Interfaces • Only Women Business Centre TECHNOLOGY • Robotic Process Automation • Solution Accelerators • Governance Enablers • Mobile / Smart Devices BUSINESS MODELS • ValueBPS™ • GNDM™ • Utility & BPaaS (Platform) • Outcome & Gain-Share Pricing
Transcript
1
1TCS ConfidentialTCS Confidential
Reducing Cycle Time of End to End Telecom Network
Design Process
Sector – Telecom Project Methodology – DMAIC
2TCS ConfidentialTCS Confidential
TCS Growth Story-2016-17
TCS over the years TCS Service Spectrum
PEOPLE
• Rural Services• Domain University• Academic Interfaces• Only Women Business Centre
TECHNOLOGY
• Robotic Process Automation• Solution Accelerators• Governance Enablers• Mobile / Smart Devices
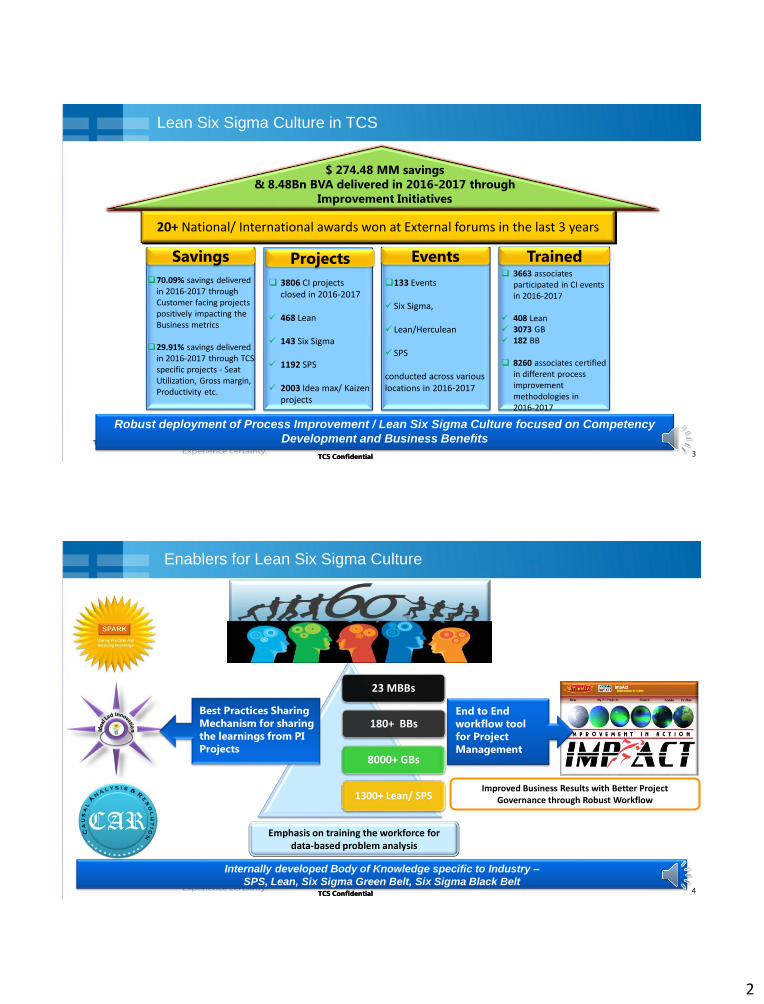
20+ National/ International awards won at External forums in the last 3 years
$ 274.48 MM savings
& 8.48Bn BVA delivered in 2016-2017 through
Improvement Initiatives
70.09% savings delivered in 2016-2017 through Customer facing projects positively impacting the Business metrics
29.91% savings delivered in 2016-2017 through TCS specific projects - Seat Utilization, Gross margin, Productivity etc.
3806 CI projects closed in 2016-2017
✓ 468 Lean
✓ 143 Six Sigma
✓ 1192 SPS
✓ 2003 Idea max/ Kaizen projects
133 Events
✓Six Sigma,
✓ Lean/Herculean
✓SPS
conducted across various locations in 2016-2017
3663 associates participated in CI events in 2016-2017
✓ 408 Lean ✓ 3073 GB✓ 182 BB
8260 associates certified in different process improvement methodologies in 2016-2017
Savings Projects Events Trained
Robust deployment of Process Improvement / Lean Six Sigma Culture focused on Competency
Development and Business Benefits
4TCS ConfidentialTCS Confidential
Enablers for Lean Six Sigma Culture
Emphasis on training the workforce for data-based problem analysis
23 MBBs
180+ BBs
8000+ GBs
1300+ Lean/ SPSImproved Business Results with Better Project
Governance through Robust Workflow
Internally developed Body of Knowledge specific to Industry –
SPS, Lean, Six Sigma Green Belt, Six Sigma Black Belt
End to End
workflow tool
for Project
Management
Best Practices Sharing
Mechanism for sharing
the learnings from PI
Projects
Enablers for Lean Six Sigma Culture
3
5TCS ConfidentialTCS Confidential
Project & Team Selection
Section 1
6TCS Confidential
1.1.1 Who was responsible for selecting the project?
1.1.0 Understanding the Context for Project Selection
Internal
Domain delivery leader & Account Manager
(Need to scale up the design deliveries to client)
Onshore & Offshore Delivery Teams
(Steering Committee to drive project to reduce
cycle time)
External
Scale up “Ready for Services” premises from 1.2 Mn
in 2011 to 11.9 Mn by 2020
Task given by Client’s BPE (Business Process
Excellence) Team to reduce cycle time of design
with higher quality levels of design
TCS Onshore & Senior Management Client
4
7TCS Confidential
1.1.2 What background information on the company or those who selected the project was provided to better understand the context of the project?
1.1.0 Understanding the Context for Project Selection
Key Strategic Objective: 12 Million Happy Homes by 2020
FY15 FY16 FY17 FY18 FY19 FY20
1
3
6
8
10
2.9
5.4
9.1
11.2
11.9
1.2
142%
86%
69%
23%
Act
ive
Serv
ice
(m
illio
n)
Ramp up to meet the target of 12 Million premises
Service Guarantee 85%+ Quality to deliver High speed network
Greenfield operation set-up with Geographical complexity
Cycle time of 42 Weeks against the client’s expectations of 26 Weeks
Remote Design with High dependencies and Hand-overs
High Level
Design &
Planning
Field*
Survey
Activities
Regulatory
Clearances &
Approvals
Detailed
Design &
Planning
Field
Constructi
on & Build
Helpdesk
for Client/
Construction
Partner
Planning & Design of Network TCS was awarded the Plan and Design of Multi Technology Mix (FTTP, FTTN, FTTB) Fiber Network (approx. 30% of the total volumes) comprising of the following key activities:Scope of work Receive Plan and high level requirement from Client Create Remote Design at high level which contains drawing and route information. Perform Field Validation for network route, Obtain required legal & statutory permissions from Govt. and Council(s) Create Final Network Design based on field outcomes and receive sign-off from client
Pro
ject
Sco
pe
Sca
lab
ilit
y
TCS’ Scope Non TCS’ ScopeLegend
Our client is an Australian commonwealth company
into wholesale business of broadband network
8TCS Confidential
1.2.1 How was the gap or opportunity brought to the attention of the project identification group?
1.2.0 Project Selection Process
KANO Model Survey
Design delivered & approved <=26 Weeks
Design delivered between >26 & <47 Weeks
Design delivered at 85% RFT
(Right First Time)
CTQ (Critical To Quality) Identification
Client’s Objective Scale up the premises built “Ready for Services” from 1.2 Mn in 2011 to 11.9 Mn by 2020
TCS Business Metric Time taken to deliver the design to client
Project Metric Cycle Time of design process
5
9TCS Confidential
1.2.2 What was the gap (problem solving)? What was the opportunity (process improvement)?
1.2.0 Project Selection Process
Voice of Business
TCS must submit quality network design within 26 weeks with
an RFT (Right First Time) of 85%
Voice of Customer Voice of Stakeholder
Client TCS Leadership Project Team
Improvement opportunity identified with the help of Voice of Customer, Business & Stakeholders
10TCS Confidential
1.2.3 What area of the organization had the gap or opportunity?
Gap identified : High Cycle Time from Milestone 1 to Milestone 3. End to end average cycle time is ~49 Weeks
6
11TCS Confidential
1.2.4 What data was generated to help select the project?
1.2.0 Project Selection Process
Project has to be taken up to reduce the cycle time to 26 Weeksfrom 42 Weeks
Average Cycle time :
• Remote Design is 102 Days (15 Weeks)
• Field Validation is 170 Days (24 Weeks)
• Final Design is 69 Days (10 Weeks)
The cycle time for each milestone
between May’15 to Mar’16 found to be
non normal
Leading to a conclusion to consider
median as central tendency and
baseline of 42 Weeks
Post stratification, measure of central tendency is Median
12TCS Confidential
1.2.5 What methods and/or tools were used to assess or prioritize the need for the project?
1.2.6 Why were these methods and/or tools used to select the project?
1.2.8 What was the relationship between the stated measures and perceived gap in 1.2.1?
1.2.0 Project Selection Process
Remote Design
Field Validation
Final Design
Cycle Time DPU RFT%
12
23
7
6.77
20.51
18.32
50%
25%
14%
Right First Time score as
on 5th Aug’16Baseline Score between
24th Jun to 5th Aug’16
End to end cycle time of
each stage
High Cycle Time
Manual
Activities /
NVA
Rework
Multiple Iterations
High Defects
High Defects per
design
• With the help of VSM, CT was broken up into Ist time activities and rework
activities
• We adopted the Lean & VSM approach to understand the Ist time activities
• For rework, we sported quality & DPU cap
Critical metric – Cycle Time
VSM led approach
Field Validation
DPU reduction
approach was
taken up on
priority
Defects Per Unit (Design)
11 Days
50 Days
14 Days
NVA
Activities
&
Iterations
Right First Time %No. of Weeks
7
13TCS Confidential
1.2.7 What goals (organizational and/or local), performance measures, and/or strategies were the project expected to impact?
1.2.0 Project Selection Process
Key Indicator Operational Definition Calculation Methodology Impact on
Cycle Time of Remote Design
milestone (M1)
No. of Weeks since the receipt of the
design package from client to approval
by the client
(Date of approval – Date of
initiation ) / 7
Overall Cycle Time of Design
Submission to Client
Cycle Time of Field Validation
milestone (M2)
No. of Weeks since the receipt of the
design package from client to approval
by the client
(Date of approval – Date of
M1 approval) / 7
Overall Cycle Time of Design
Submission to Client
Cycle Time of Final Design
milestone (M3)
No. of Weeks since the receipt of the
design package from client to approval
by the client
(Date of approval – Date of
M2 approval ) / 7
Overall Cycle Time of Design
Submission to Client
Weekly Design RFT % (Right First
Time) for each milestone
No. of RFT Designs accepted by client out
of total Designs reviewed by the client in
a week
RFT Designs (having 0
Critical and <=4 Major
errors) / Total Designs
reviewed
Milestone wise Design RFT%
Weekly DPU (Defects per Design)
for each milestone
No. of Critical & Major errors out of total
Designs reviewed by the client in a week
(Critical + Major Errors) /
No. of Designs reviewedMilestone wise DPU
14TCS Confidential
1.2.9 What was the problem/project objective statement that expresses where the organization wanted to be at the end of the project?
1.2.0 Project Selection Process
PROBLEM STATEMENT
GOAL STATEMENT
The cycle time for a network design from designing to approval is ~42 Weeks forthe period May’15 to Mar’16 against the target of 26 weeks
To reduce the cycle time for design process from 42 Weeks to 26 Week by Jan’17
Remote Design
8
15TCS Confidential
1.3.1 How were the stakeholder groups identified?
1.3.0 Team Selection & Preparation
Level of Influence in Business Metrics
Level o
f In
tere
st in
Bu
sin
ess
Metr
ics
Low
High
High
• Power & LASA Teams
• Regional Delivery Managers• Client
• Program Sponsor, Offshore
Leader & Domain Leader
• Process Owners – Regional
Leaders
• Domain Master Black Belt
• Account Black Belt
Med
ium
Medium
• Onshore Designers• Client’s Design Team
• Field Partner/Vendor
• Local Council
• Government Bodies –
Onshore
• Environmental Organizations
- Onshore
Set of key stakeholders
identified for the
project & driving results
16TCS Confidential
1.3.0.2 What or who were the stakeholder groups?
1.3.0 Team Selection & Preparation
Client
• Interested in project
progress
• Enabling things
from client’s end
Project Sponsor
• Approval
committee
• Enablement
Project Champion
• Toll gate reviews
• SPOC for Client’s
related issues &
resolutions
Process Owners
• Ensure project goal
is achieved
• Review the progress
of project internally
Project Team
• Execute the project
as expected
• Identifying key
drivers and
designing feasible
solutions
• Making control plan
• Getting the project
reviewed by
stakeholders in a
timely manner
Project
Facilitator/Mentor
• Ensure the team is
trained on project
management and
methodologies
• Observe team
performance & take
timely corrective
actions
• Review projects
with stakeholders
9
17TCS Confidential
1.3.3 What knowledge or skill sets were determined to be necessary for successful completion of the project?
1.3.4 To what extent did the existing stakeholder groups have the required knowledge or skills?
1.3.5 What additional knowledge and skills were brought in to make the project successful?
1.3.0 Team Selection & Preparation
Name Role Competency Development Benefit Derived
Rajendra AV Project Sponsor Executive Scaling program at Onshore Sensitization wrt the project sponsor’s role & responsibilities
Rahul B Project Sponsor Basic Six Sigma project management & tool’s awareness Importance of DMAIC & usage in business performance
Greg T Project Champion Executive Scaling program at Onshore Sensitization wrt the project sponsor’s role & responsibilities
Steve B Project Champion Executive Scaling program at Onshore Sensitization wrt the project sponsor’s role & responsibilities
Robert H Project Champion Executive Scaling program at Onshore Sensitization wrt the project sponsor’s role & responsibilities
Mark H Project Champion Executive Scaling program at Onshore Sensitization wrt the project sponsor’s role & responsibilities
Vikas M Project LeadersExecutive Scaling program at Onshore
Master Black Belt
Sensitization wrt the project sponsor’s role & responsibilities
Six Sigma Master Black Belt & project management
Nikhil K Process Owner Basic Six Sigma Training – DMAIC & Lean Tools & Techniques Importance of data which helps in business decisions
Gaurav G Process Owner Executive Green Belt Training DMAIC & Lean Six Sigma awareness & analytical skills
Rajesh A Process Owner Executive Green Belt Training DMAIC & Lean Six Sigma awareness & analytical skills
Vivek K Process Owner Executive Green Belt Training DMAIC & Lean Six Sigma awareness & analytical skills
Dhananjay H Master Black Belt Master Black Belt Skills wrt the roles & responsibilities of Master Black Belt
Vipul K Black BeltBlack Belt
Telecom Network Designing Training
Skills wrt the roles & responsibilities of Black Belt
Basic understanding of telecom network designing process
Tarun T Black BeltBlack Belt
Telecom Network Designing Training
Skills wrt the roles & responsibilities of Black Belt
Basic understanding of telecom network designing process
Sahil B Black BeltBlack Belt
Telecom Network Designing Training
Skills wrt the roles & responsibilities of Black Belt
Basic understanding of telecom network designing process
18TCS Confidential
1.3.6 Before the project started, what specific training was done?
1.3.7 Before the project started, what was done to prepare the team to work together as a team?
1.3.0 Team Selection & Preparation
Quick Wins Identification (7 types of Wastes) ▪ Impact: Low▪ Training Duration: 01 Hr on floor activity▪ Target Audience- All process associates (100% associates covered)
Understanding Root Causes (5 Why & Fish Bone techniques)▪ Impact: Low▪ Training Duration: 04 Hr training on Causal Analysis▪ Target Audience- All Process Associates (100% associates covered)
Problem Solving at Operational Levels (7 QC Tools)▪ Impact: Low▪ Training Duration: 1 Day Training & 1 Day Workshop on Quality Tools▪ Target Audience- All process Associates (>250 associates covered)
Waste Elimination at process levels (VSM)▪ Impact: High▪ Training Duration: 2 Days Training & 2 Days Workshop on Lean Six Sigma▪ Target Audience- Team leader and above (>25 associates trained on Lean Six Sigma)
Solving problems in a complex process environment▪ Impact: High▪ Training Duration: Green Belt - 3 Days, Black Belt – 6 Days▪ Target Audience- Team Leader and above (40 Green Belts & 4 Black Belts)
Co
mp
lex
ity o
f P
rob
lem
Note : RCA – Root Cause Analysis | SPS – Structured Problem Solving | DEIS – Define, Explore, Improve & Sustain | IDEAS – Identify, Define, Explore, Analyze & Sustain | DMAIC – Define, Measure, Analyze, Improve & Control
DM
AIC
IDEA
S5
Wh
y
DEIS
Kaiz
en
GB
/BB
Lean
RC
AS
PS
Kaiz
en
Pro
cess
Au
tom
ati
on
Im
pro
vem
en
ts
10
19TCS Confidential
1.3.8 What roles and expectations were determined ahead of the project?
1.3.0 Team Selection & Preparation
Name Define Measure Analyze Improve Control
Project Sponsor A, I I I I A
Project Champion A, I A, I A, I A, I A, I
Process Owners A,I, R A,I, R A,I, R A,I, R A,I, R
Project Leader M M M M M
Project Members R R R R R
ARMI Matrix – Approver | Resource | Member | Interested Party
20TCS Confidential
1.3.9 What deadlines and deliverables did the team have to consider ahead of actually starting the project?
1.3.0 Team Selection & Preparation
State Target Date End Date
Define 1st May 2016 30th May 2016
Measure 19th June 216 30th Jun 2016
Analyze 20th July 2016 12th Aug 2016
Improve 16th Sep 2016 30th Sep 2016
Control 13th Nov 2016 02nd Dec 2016
11
21TCS Confidential
1.3.10 Before the project started, what team routines, including communication, were established?
1.3.0 Team Selection & Preparation
Head Purpose Attendees Frequency Meeting Host
Project Meetings
Ensure that the team is
working towards objective/
goal
Project Team Weekly Project Leader
Project Working
Sessions
Live working sessions to
complete project related
documents and files
Project Team Every alternate day Black Belt
Project Review
Meeting
• Moving in right direction
• Timely issue resolution
Process Owners &
Project TeamMonthly Project Leader
Tollgate ReviewTo get formal go ahead on
completion of every tollgateProject Champion
As per the project
milestonesBlack Belt
22TCS ConfidentialTCS Confidential
Current Situation and Root Cause/Improvement
Opportunity Analysis
Section 2
12
23TCS Confidential
2.1.1 What specific goals and/or measures was the team trying to achieve with the project?
2.1.2 What additional potential benefits, other than the specific goals and/or measures, was the project expected to impact?
2.1.0 Key Measures Expected of the Project
PROJECT SCOPE INCLUDES
BUSINESS CASE
PROBLEM STATEMENT
GOAL STATEMENT
PROJECT SCOPE EXCLUDES
• Our client is strategically ramping up to deliver Ready for Service (RFS) from 1.2 mn in FY 15 to 11.9 mn inFY 20 which is 10 fold growth in next 5 years (2015 to 2020)
• For 11.9 mn RFS to be ready by 2020, Delivery Partner must deliver the design by at least mid 2018 so thatthe construction phase is completed
• This warrants TCS to emulate the no .of deliveries at a faster rate which can matchup to the nos. expectedin another 3 years without compromising quality of deliveries
The cycle time for a network design from designing to approval is ~42 Weeks for the period May’15 toMar’16 against the target of 26 weeks
3 Milestones – Remote Design, Field Validation & Final Design
• Technological Changes in design process from client• Construction phase of the design
To reduce the cycle time for design process from 42 Weeks to 26 Week by Jan’17
EXPECTED BENEFIT
• Reduction in Cycle Time of delivery of design (Tangible)• Reduction in efforts spent in reworks (Tangible)• Customer Satisfaction (Intangible)• Connecting the whole of country through Fiber Network
(Socio economic)• No negative Impact on vegetation & environment
through the council’s approved design across the country (Environment)
24TCS Confidential
2.2.1 What methods and/or tools were used to identify possible root causes/improvement opportunities?
2.2.0 Possible Root Causes/Improvement Opportunities
HT HT
FB
SL
P
VSM
RCA
CIG
HT
P
VSM
Hypothesis Testing
Swim Lane Chart
Pareto Chart
Control Impact Grid
Root Cause Analysis
Value Stream Map
Fishbone Analysis
CIG
FB
RCA
13
25TCS Confidential
2.2.2 Why were these methods and/or tools selected [to identify possible root causes/improvement opportunities]?
2.2.0 Possible Root Causes/Improvement Opportunities
Tool Used Why was the tool selected?
VOC/VOSTo capture client’s verbose and interactions and counter verification from internal
stakeholders
SIPOC Broad level process map for the stakeholders and teams
Project Charter Capture what, why, who, when, where & how attributes of the project
ARMI Model Identified and defined the roles of each member in the project
Normality Testing Testing data to be considered for further analysis – measure of central tendency
Box Plot To analyze variation in cycle time trend month over month
Fishbone AnalysisKey causes contributing to cycle time & top defects in each milestone was captured &
analyzed
Control Impact Grid Prioritized the solutions arrived at
Swim Lane Charts Problem & Issues were captured rightly at each step to devise countermeasure
Pareto Chart Top defect categories were arrived at to focus improvement solutions
RCA (Root Cause Analysis) Formed base for generating corrective & preventive measures
Chi Square TestTo ensure statistical approach by validating the facts (regional defects, tenureship of
designers & type of design – defective/non defective)
26TCS Confidential
2.2.3 How was the team prepared to use these methods and/or tools [to identify possible root causes/improvement opportunities]?
2.2.0 Possible Root Causes/Improvement Opportunities
Project
Sponsor
Project
Champion
Project
Leader
Project
MembersStakeholders MBB*/BB^
SL
HT
P
VSM
Hypothesis Testing
Swim Lane Chart
Pareto Chart
Control Impact Grid
Root Cause Analysis
Value Stream Map
Fishbone Analysis
CIG
FB
RCA
RCA
CIG
SL
FB
RCA
CIG
SL
FB
SL
HT
P
CIG
VSM
FB
RCA SL
P
CIG
VSM
FB
RCA CIG
VSMFB
RCA
SL
HT
P
CIG
VSM
FB
RCA
The above matrix shows the involvement & trainings
conducted for the different roles in this project
TCS has internal system of training & certification program for Green
Belt, Black Belt & Master Black Belt
*Master Black Belt ^Black Belt
14
27TCS Confidential
2.2.4 What data was generated and how was the data analyzed to identify the possible root cause/improvement opportunities?
2.3.1 What methods and/or tools were used to identify the final root cause(s)/improvement opportunity(ies)?
2.2.0 Possible Root Causes/Improvement Opportunities
Overall
Cycle Time
of
milestones
Centralized
project
tracker
Each
milestone’s
Cycle time
was tracked
Activity
wise Cycle
Time
Designers
wise
project
tracker for
activities
Activity
wise cycle
time was
calculated
for VSMs
Defects per
Design
Each design
was
analyzed
for no. of
defects in it
No. of
defects per
design for
the week
was
calculated
Design
RFT%
Metric of
right first
time
designs
Milestones
wise RFT%
of designs
was
calculated
Defects
Categories
Different
categories
of defects
in different
areas of
designs
Level 1 to
Level 4
breakdown
of defects
in design
Regional
Defects
Region
wise
defects in
design
Client’s
report was
used to
generate
regionwise
defects
Designers
wise defects
&
tenureship
Designer
performanc
e report
through
RCA tracker
Designers
wise
defects
with
respective
tenureship
Root Cause
Analysis
5 Why
Analysis of
L4 defect(s)
Discussions
held with
designers,
SMEs and
RCA team
for each
defect
Data
generation –
What?
Data
Analysis –
How?
P CIGVSM FB RCAHT HTHT HTVSM
Data
Head
28TCS Confidential
2.3.2 Why were these methods and/or tools selected [to identify the final root cause(s)/improvement opportunity(ies)]?
2.3.0 Final Root Cause(s)/Improvement Opportunity(ies)
Tool Used Area of Study Objective
Hypothesis Testing – Chi Square TestRelationship between defects and tenureship of
associates
To check whether there is direct relationship
between defects & tenureship of designers
Hypothesis Testing – Chi Square TestRelationship between regions (Geographical areas)
and Defective/Non Defective Designs
To check if there is regional difference in the
design being QCed by the client as defective or
non defective
Swim Lane ChartAll Design milestones viz. Remote design, Field
Validation & Final design
To identify the problems & issues in the
process amongst various process activities
Fishbone Analysis Overall high cycle time of design submission To identify key issues via 5M approach
Fishbone AnalysisMilestone wise top defects like Pit, FIR, CCU, SLD, CP
etc.
To identify sub factors contributing towards top
defects in each milestone
Root Cause Analysis Client’s feedbackTo identify root cause of the feedback to
develop CAPA (Corrective/Preventive Actions)
Pareto Chart Client’s feedbackTo breakdown client’s feedback into defect
categories – Level 1 to Level 4 before RCA
Control Impact Grid Process solutions identified/discussed To prioritize solutions for the deployment plan
15
29TCS Confidential
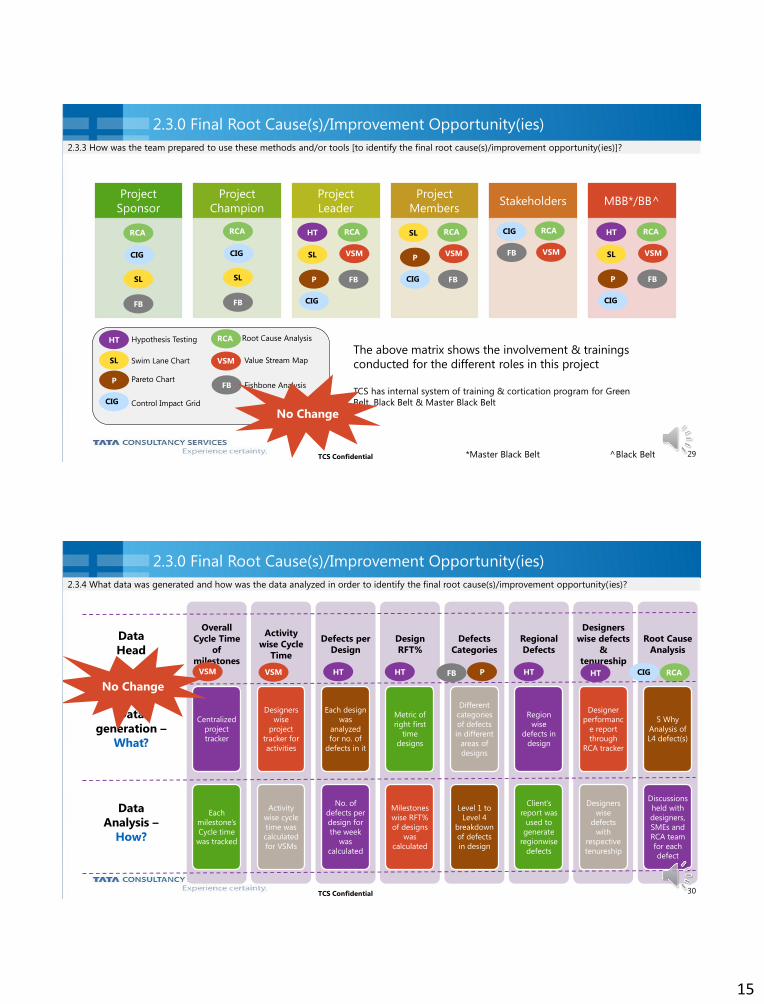
2.3.3 How was the team prepared to use these methods and/or tools [to identify the final root cause(s)/improvement opportunity(ies)]?
2.3.0 Final Root Cause(s)/Improvement Opportunity(ies)
Project
Sponsor
Project
Champion
Project
Leader
Project
MembersStakeholders MBB*/BB^
SL
HT
P
VSM
Hypothesis Testing
Swim Lane Chart
Pareto Chart
Control Impact Grid
Root Cause Analysis
Value Stream Map
Fishbone Analysis
CIG
FB
RCA
RCA
CIG
SL
FB
RCA
CIG
SL
FB
SL
HT
P
CIG
VSM
FB
RCA SL
P
CIG
VSM
FB
RCA CIG
VSMFB
RCA
SL
HT
P
CIG
VSM
FB
RCA
The above matrix shows the involvement & trainings
conducted for the different roles in this project
TCS has internal system of training & cortication program for Green
Belt, Black Belt & Master Black Belt
*Master Black Belt ^Black Belt
No Change
30TCS Confidential
2.3.4 What data was generated and how was the data analyzed in order to identify the final root cause(s)/improvement opportunity(ies)?
2.3.0 Final Root Cause(s)/Improvement Opportunity(ies)
Overall
Cycle Time
of
milestones
Centralized
project
tracker
Each
milestone’s
Cycle time
was tracked
Activity
wise Cycle
Time
Designers
wise
project
tracker for
activities
Activity
wise cycle
time was
calculated
for VSMs
Defects per
Design
Each design
was
analyzed
for no. of
defects in it
No. of
defects per
design for
the week
was
calculated
Design
RFT%
Metric of
right first
time
designs
Milestones
wise RFT%
of designs
was
calculated
Defects
Categories
Different
categories
of defects
in different
areas of
designs
Level 1 to
Level 4
breakdown
of defects
in design
Regional
Defects
Region
wise
defects in
design
Client’s
report was
used to
generate
regionwise
defects
Designers
wise defects
&
tenureship
Designer
performanc
e report
through
RCA tracker
Designers
wise
defects
with
respective
tenureship
Root Cause
Analysis
5 Why
Analysis of
L4 defect(s)
Discussions
held with
designers,
SMEs and
RCA team
for each
defect
Data
generation –
What?
Data
Analysis –
How?
P CIGVSM FB RCAHT HTHT HTVSM
Data
Head
No Change
16
31TCS Confidential
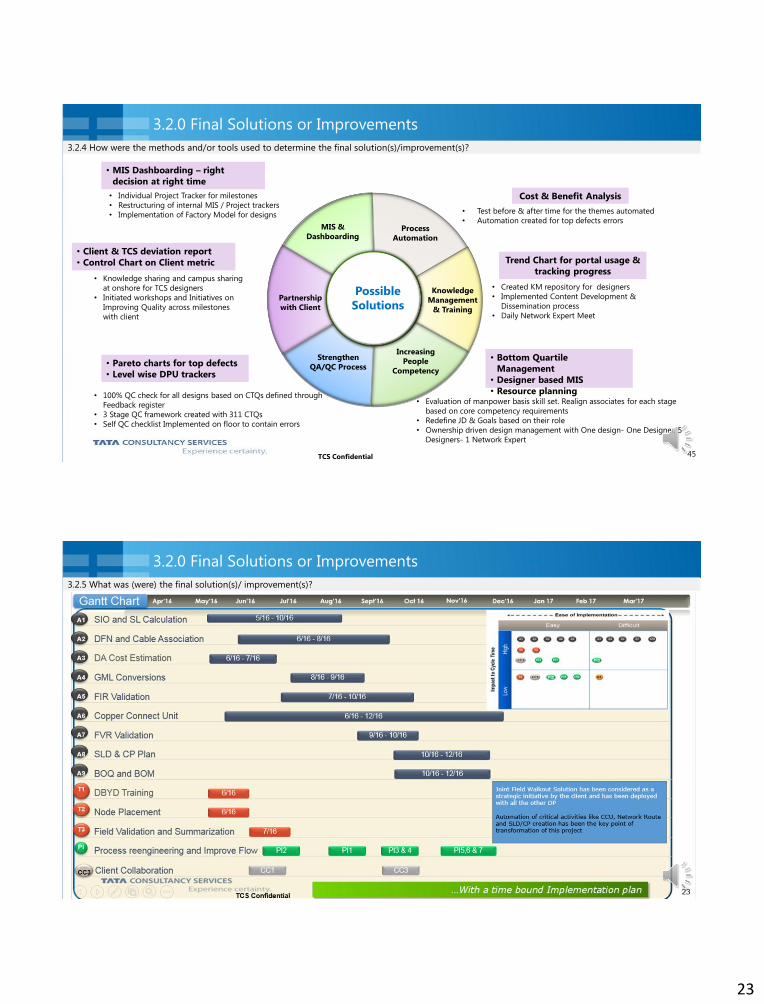
2.3.5 What are specific examples of data analysis that led to the final root cause?
2.3.0 Final Root Cause(s)/Improvement Opportunity(ies)
Defect Mitigation plan was developed
NVAs & Manual activities led were identified
Level 4 defects for effective countermeasure Variables dependency were validated
RCA for effective countermeasures
32TCS Confidential
2.3.6 What was (were) the final root cause(s)/improvement opportunity(ies)?
2.3.7 How was (were) the final root cause(s)/improvement opportunity(ies) validated?
2.3.0 Final Root Cause(s)/Improvement Opportunity(ies)
Causes
IdentifiedManual Work in
rule based design
Query Resolution
cycle time
Multiple hands off
during QC & QA
process
Lack of standard
process
Lack of effective
monitoring
Lack of Knowledge
update
management
Sol. Code Cause Summary
Q1 Data & dash boarding mechanism
Q2 RCA Process & Management
CC1 Calibration between TCS & client designers
PI1 Balance Score Card
PI2 Miscalculation of design due date
PI3 Best Practice Sharing
PI4 Trouble shooting of automation tools
PI5 Different version of the automation tools
PI6 Template management/correct version
P1 Lack of ownership
P2 Lower participation in UAT
T1 Refresher Training
T2 Motivational activities & workshops
T3 Manual activities despite tools
A1 Documentation & updates
A2 Tools updated
PI Process Improvement P People Management TrainingT A Automation Client Collaboration Q QualityCC
17
33TCS Confidential
2.3.8 What evidence showed that the final root cause(s)/improvement opportunity(ies) were validated prior to solution development?
2.3.0 Final Root Cause(s)/Improvement Opportunity(ies)
Defect Mitigation plan was developed
NVAs & Manual activities led were identified
Level 4 defects for effective countermeasure Variables dependency were validated
RCA for effective countermeasures
No Change
34TCS Confidential
2.4.1 How was the correctness of the initial project scope, deliverables, and timing confirmed (or, what changes were made)?
2.4.0 Project Management Update
PROJECT SCOPE INCLUDES
BUSINESS CASE
PROBLEM STATEMENT
GOAL STATEMENT
PROJECT SCOPE EXCLUDES
• Our client is strategically ramping up to deliver Ready for Service (RFS) from 1.2 mn in FY 15 to 11.9 mn inFY 20 which is 10 fold growth in next 5 years (2015 to 2020)
• For 11.9 mn RFS to be ready by 2020, Delivery Partner must deliver the design by at least mid 2018 so thatthe construction phase is completed
• This warrants TCS to emulate the no .of deliveries at a faster rate which can matchup to the nos. expectedin another 3 years without compromising quality of deliveries
The cycle time for a network design from designing to approval is ~42 Weeks for the period May’15 toMar’16 against the target of 26 weeks
3 Milestones – Remote Design, Field Validation & Final Design
• Technological Changes in design process from client• Construction phase of the design
To reduce the cycle time for design process from 42 Weeks to 26 Week by Jan’17
EXPECTED BENEFIT
• Reduction in Cycle Time of delivery of design (Tangible)• Reduction in efforts spent in reworks (Tangible)• Customer Satisfaction (Intangible)• Connecting the whole of country through Fiber Network
(Socio economic)• No negative Impact on vegetation & environment
through the council’s approved design across the country (Environment)
No Change
18
35TCS Confidential
2.4.2 How were stakeholders involved and/or communicated with during the root cause/improvement opportunity phase of the project?
2.4.0 Project Management Update
Name Define Measure Analyze Improve Control Communication through:
Client I I I I I • Informed on project progress
Project Sponsor A, I I I I A• Informed on issues• Update on key activities being carried out
Project Champion A, I A, I A, I A, I A, I• Seek support on roadblocks & challenges• Involvement in key brainstorming session• Toll Gate review
Process Owners A,I, R A,I, R A,I, R A,I, R A,I, R• Training & meeting participation• Validating ops hypothesis with data
Project Leader M M M M M• Project update• Escalate & engage team towards project objective