Reducing Diesel x NO and PM Emissions of Diesel Buses and Trucks FINAL REPORT Hamid R. Rahai, Ph.D. Bei Lu, Ph.D. Center for Energy and Environmental Research and Services (CEERS) Department of Mechanical and Aerospace Engineering California State University Long Beach METRANS contract number 06-04 July 22, 2008
Transcript
Reducing Diesel xNO and PM Emissions of Diesel Buses and Trucks
FINAL REPORT Hamid R. Rahai, Ph.D. Bei Lu, Ph.D. Center for Energy and Environmental Research and Services (CEERS) Department of Mechanical and Aerospace Engineering California State University Long Beach METRANS contract number 06-04 July 22, 2008
2
Disclaimer
The contents of this report reflect the views of the authors, who are responsible for the facts and the accuracy of the information presented herein. This document is disseminated under the sponsorship of the Department of Transportation, University Transportation Centers Program, and California Department of Transportation in the interest of information exchange. The U.S. Government and California Department of Transportation assume no liability for the contents or use thereof. The contents do not necessarily reflect the official views or policies of the State of California or the Department of Transportation. This report does not constitute a standard, specification, or regulation.
3
Abstract
The objective of the present investigation was development of a high efficiency
selective catalytic reduction (SCR) system for reducing diesel nitrogen oxides (NOx) and particulate matters of diesel trucks. The investigation was divided into two parts. First the flow characteristics of a coil-shaped injector were investigated using a turbulent jet facility at the Center for Energy and Environmental Research and Services (CEERS) laboratory. For this part of the investigation, air was used as both injection and exhaust gases. Results indicate that the coil injector enhances mixing process between the axial flow and the injecting flow. However, due to the asymmetry of the injection process, the mixing is not uniform and may results in ammonia slippage during the exhaust after treatment process. In part two of the investigations, an SCR system with a separate injector and mixer was developed and the system was tested on the exhaust of a 3-cylinder diesel engine under a moderate load condition, using 36% by weight urea as the reducing agent. Results show 81% reduction in NOx emissions. The present investigation provides information on a coil-shaped injector-mixer device as part of a SCR system that can be scaled for different size diesel engines for significant reductions in NOx emissions.
4
Table of Contents
DISCLAIMER 2 ABSTRACT 3 TABLE OF CONTENTS 4 LIST OF FIGURES 5 DISCLOSURE 7 ACKNOWLEDGEMENT 8 INTRODUCTION 9 BACKGROUND 9 MEASUREMENTS PROCEDURE AND TECHNIQUES 12 RESULTS AND DISCUSSIONS 15 CONCLUSIONS AND RECOMMENDATIONS 25 REFERENCES 27
5
LIST OF FIGURES Figures Page
1. Diesel Exhaust DeNOx Efficiency using Urea-SCR, Ammonia-SCR, and LNT..11
17. Diesel Engine and the SCR system…………………………………………..23
18. Exhaust NOx without Urea Injection…………………………………………24
19. NOx Conversion with Urea Injection………………………………………...24
20. NOx Conversion at Idling Condition with Urea Injection……………………25
7
Disclosure Project was funded in entirety under this contract to California Department of Transportation.
8
Acknowledgments This study was supported with a grant from METRANS research program. The authors would like to thank METRANS executive committee for their support. The supports of CSULB graduate assistants, Ayaz Alware, Eyass Khansa, CEERS technical support staff, and Mr. Mike Fritz, CSULB Mechanical and Aerospace Engineering technician, are gratefully acknowledged. Part one of the present investigation has been presented at the 2006 International Mechanical Engineering Congress and Exposition in Chicago, Illinois in November 2006 (Paper no. IMECE 2006-13728).
9
1.0. INTRODUCTION
According to the California Air Resources Board (CARB) in 2010, on road heavy duty diesel trucks are estimated to account for up to 28% or 559 tons per day of oxides of nitrogen (NOx) and up to 12 % of particulate matter (PM) emissions inventory statewide. Truck idling contributes significantly to these emissions. Idling emissions are significant at the port terminals and distribution centers where long waiting periods are required for loading and unloading operations, and at rest areas and traffic stops, among others. CARB has proposed regulation to reduce idling emissions from new trucks starting with the 2008 model year. The regulation requires manufacturers to either meet an emissions standard or have a timer system that automatically shut off the engine after five minutes of continuous idling.
Coarse and fine particles from diesel exhaust emission have adverse health
impacts. More than 30 years of studies (Vedal [1]) have shown significant adverse effects of ambient PM on respiratory systems, especially in high risk population such as infants, young children and elderly. Coarse and fine particles have aerodynamic diameters of less than 10 and 2.5 microns, respectively, and ultra-fine particles have aerodynamic diameters of less than 0.1 micron. Fine and Ultra-fine particles constitute more than 80% of the PM numbers in an urban area (Morawska et al [2]) and they typically contain soot, acid condensates, sulphates and nitrates and other toxins and traces of metals.
Diesel emissions are significant at the two major ports of Los Angeles and Long
Beach. Together they handle more than 43% of the total seaborne cargo and are responsible for nearly a quarter of diesel emissions in the region. Big rig trucks, diesel locomotives and mammoth container ships contribute significantly to the region’s air pollution with severe impact on local communities. Many schools are very close to the port traffic lines and railroad and are significantly affected by these emissions as well.
The goals of the proposed project were to reduce NOx by more than 90% and PM
emissions by more than 30% from a diesel truck engine during idling. The study was focused on development of an enhanced mixing device and a dosing mechanism for a selective catalytic reduction (SCR) system to meet its objectives. 2.0. BACKGROUND
It has been well established that if oxides of nitrogen (NOx) and air are irradiated
with ultra violet light, the net effect is a dynamic equilibrium with ozone being one of its products. However, if a hydrocarbon is also present, the reduction is unbalanced and the net effect is the production of nitrogen dioxide and ozone. The effects of ozone on the environment are well known and every effort should be made to reduce ozone’s formation in the earth’s atmosphere.
Diesel trucks contribute significantly to the statewide emissions from ports and
goods movement. According to CARB [3], in 2005, the estimated emissions of NOx and PM from diesel trucks were more than 680 and 30 tons per day respectively. These
10
emissions have resulted in major health impacts which include increased heart disease, respiratory illnesses, cancer risk and premature death. A recent study by Gauderman et al [4] on the effects of pollution on children’s health in Los Angles has shown that pollution stunts lung growth in children and can cause premature death or lifelong health problems. In response to these challenges, CARB has proposed strategies with implementation dates between 2006-2020 that can significantly reduce emissions from ports and goods movement activities.
Technologies for reducing emissions from diesel trucks include three-way
catalytic converter, exhaust gas recirculation (EGR), and selective catalytic reduction (SCR) systems. To reduce the overall exhaust pollution, three-way catalytic converters (Kummer [5]) have been used in vehicle exhaust systems to oxidize or burn the Hydrocarbons (HC) and Carbon Monoxide (CO) gases after they leave the engine. The function of a three-way catalyst depends on the combustion process. For the catalyst to work properly, the combustion process should be nearly stoichometric. If the exhaust is too lean, NOx are not destroyed and if it is too rich HC and CO are not removed. For a diesel engine, reduction of NOx is very limited due to the fact that diesel engines run lean. Thus, reduction of NOx emissions is accomplished through the design of the combustion process and/or the choice of operating conditions.
To further reduce these emissions, new methods such as EGR are being tested by
diesel engine manufacturers. In the EGR approach, the exhaust gas acts as a diluent in the air-fuel mixture to lower the combustion rate and temperature, increasing its efficiency and reducing NOx emissions. The maximum EGR fraction is 15-20% of the fuel-air flow rate which limits its capacity to greatly reduce emissions. Thus, multiple methods should be implemented to drastically reduce diesel exhaust emissions.
The introduction of SCR systems using urea as the removing agent has shown to
be effective in reducing NOx emissions in diesel engines. Urea is produced by combining ammonia and carbon dioxide at high pressure. It is easy to transport and is a stable solution within normal climatic conditions. When it is injected into the exhaust of a diesel engine, it is first hydrolyzed to produce ammonia, which reacts with the exhaust gases to produce nitrogen and water.
OHNONHNOOHNONHNO
2223
2223
63426444
+→+++→++
To minimize ammonia slippage, the ratio of the injected ammonia to the exhaust NOx should be close to one. Figure 1 shows the DeNOx process using Urea, Ammonia, and Lean NOx Trap (LNT) [6].
11
Figure 1. Diesel Exhaust DeNOx Efficiency using UREA-SCR, Ammonia-SCR,
and LNT.
For most operation, at idling condition, the exhaust temperature is below the optimum range for NOx conversion, which makes direct ammonia injection an attractive option. However, Ammonia is toxic and at the present state, storage and transport of the ammonia aboard a truck is costly and economically not viable. Amminex A/S of Denmark has developed an ammonia storage and delivery system that allows the SCR aftertreatment system to work with direct ammonia gas injection. Here ammonia is stored by absorption in a dense solid called AdAmmine, consisting of an inorganic salt and ammonia. According to their report (Johannessen et al [7]), it has the same capacity as the liquid ammonia and more than three time capacity as the urea-based adBlue. The system is still in the development stage for adaptation to passenger cars and trucks.
Fable et al [8] provide a comprehensive study of the urea infrastructure required for SCR technology to meet the current and future federal emissions standards for heavy duty diesel on-road engines.
Reduction of NOx emissions can also be accomplished with a SCR system with hydrocarbons as the reducing agent. The system can use the on-board fuel tank as its reservoir and a control system to time the injection process to the engine timing to optimize the NOx reduction process. Sumiya et al [9] have shown a 30% increase in NOx conversion at a 450 degree C exhaust temperature with diesel fuel sprayed ahead of the catalyst bed.
The objective of the present investigation was to develop a high efficiency SCR system for reducing NOx and PM emissions of diesel engines. A recent exploratory research by Rahai [10] has shown that a coil-shaped mixer can increase the mixing process between the injecting agent and the exhaust and has the potential to improve the efficiency of the SCR system significantly. The coil-shaped mixed with specific geometry induces turbulence and vortices on the exhaust gas which enhances the mixing process. The coil-shaped mixer can be placed downstream of the injector or the coil could have imbedded injecting holes along its surface (mixer-injector) for the enhanced mixing process. Initially the flow characteristics of the mixer-injector was investigated and based
12
on the results of the investigations, it was decided that a better approach would be to separate the injecting and the mixing process and all emission measurements were performed with placing the mixer downstream of the injector for maximum NOx and PM reductions.
3.0. MEASUREENTS PROCEDURE AND TECHNIQUES
The first part of the study was focused on development of a mixing-injector device for increased mixing between the injected fluid and the exhaust for significant reduction in xNO and PM emissions. Compressed air was used for both injection and exhaust to find the optimized geometry that can increase the mixing process and to reduce slippage which could enhance the emission reduction process. Part two of the study was focused on laboratory testing of the device and development of the dosing system for a high efficiency SCR system.
Part I:
In part I, near-field characteristics of a jet with a coil-insert injector was investigated. The experiments were carried out using a subsonic jet facility at the CEERS
laboratories. Figure 2 shows the jet configuration.
Figure 2. Experimental Set-up.
Filtered regulated compressed air of 400 SCFH enters a round settling chamber of 30.5 cm diameter and impinges on a small flat plate to fill the chamber. The settling chamber is 132 cm in length and has various screens with different solidity for flow conditioning. The settling chamber is followed by an 11.75:1 contraction, which is 26.7 cm long. A second axi-symmetric contraction with an area ratio of 5.45:1 and length of 10.16 cm followed the first contraction with a round exit inside diameter D of 3.81 cm. This contraction is connected to a 15 cm long smooth round aluminum tube of the same
13
diameter. The coil insert injector is placed inside aluminum tube at the exit. The ratio of the coil tube diameter, pitch spacing and coil length to the jet inside diameter were 0.1, 1.0, and 1.5 respectively. The coil tube had 3 holes of 0.2 diameter spaced evenly on its surface pointing perpendicular to the jet flow. The coil tube was closed at one end and the other end was connected to another regulated compressed air supply through a nozzle on the surface of the aluminum tube. For the present investigations, the effects of various cross flow injections on the near filed development of the round jet were investigated. The ratios of the injected air volume to the volume of the jet flow (m) were 0.0 (no cross injection), 0.075, 0.1, 0.125, and 0.15.
Simultaneous time resolved measurements of two components of turbulent velocity
and their cross moments were carried out at five streamwise locations of x/D = 0.1, 1.0, 3.0, 5.0, and 8, and various radial locations across the jet using a TSI double sensor hot wire probe model 1243-T1.5 connected to two channels of TSI IFA-100 intelligent flow analyzer. Measurements were carried out twice to obtain all three components of the turbulent velocity. At each measurement location 10 records where each record contains 2048 samples of data were digitized at a sample rate of 6000 samples/sec., using a Metra-Byte DAS-20 Analog to digital converter. Digitized data were analyzed using software supplied by Data Ready, Inc.
Part II:
An air-assisted SCR system with a coil-insert mixer was developed for injecting urea into the exhaust. Figure 3 shows the SCR system. The main components of the SCR system include an air compressor, a stainless steel tank with a liquid flow meter which holds the emission reducing agent, a solenoid valve that controls the injection, the injector and the coil mixer. Two T-type thermocouples were used to monitor exhaust temperature before and after injection. The system allows injection of the agent into the exhaust when the exhaust temperature is within an acceptable range for maximum NOx reduction efficiency.
14
Figure 3. Air-Assisted Injection System.
The emission data was obtained via a portable ENERAC micro-emissions analyzer model 500 which is capable of measuring accurately the ambient temperature, stack temperature, oxygen, nitric oxide (0-2000 PPM), nitrogen dioxide (0-1000 PPM), carbon monoxide (0-2000 PPM), sulfur dioxide (0-2000 PPM) and stack draft. Other parameters calculated were combustion efficiency, percent carbon dioxide, excess air, oxides of nitrogen, emissions of CO, NO, NO2, NOx, and SO2 in LBS/Million BTU or in GRAMS/BHH. The unit was connected to a Dell Laptop and data was recorded automatically at 1 minute interval for at least 30 minutes for each operating conditions. Initially the SCR system was installed on the exhaust of a Komatsu 6 cylinder 207 horsepower fuel injected diesel engine at idling condition. The engine has similar characteristics as those used on diesel trucks.The engine is part of a portable electric generator. With no load condition at the shaft, the maximum temperature of the exhaust was at approximately 170 ºC which was not sufficient enough for reducing diesel emissions with the SCR system. In order to increase the exhaust temperature, this diesel engine requires load resistors which are being purchased and will be used in the future experiments. Instead, a Vanguard 3-cylinder liquid-cooled fuel-injected diesel engine with maximum power output of 20 bhp at 3600 rpm was used for the experiments. The engine was run on a water-cooled dynamometer with 5 ft-lbs at the output. The engine rpm was at 1800 during all experiments and the exhaust temperature was between 290-310 ºC during the injection process. Aqueous urea (CO(NH2)2) with 36% concentration (by weight) was used as the emission reducing agent. Exhaust NOx measurement was
15
performed at three different injection rates of 0.25 liter/hr, 0.3 liter/hr, and 0.4 liter/hr, which correspond to approximate fuel to urea ratios of 18, 22, and 29.
4.0. RESULTS AND DISCUSSION Part I:
Figures 4 and 5 show the cross-sectional contours of the normalized mean
streamwise vorticity, oU
Dzy
)vw(∂∂
−∂∂ , for the smooth and coil-inserted jet at x/D = 0.1 and
1 from the numerical investigations of Hoang and Rahai (2002b). Here, v and w are the components of the mean velocity in vertical (y) and spanwise (z) directions, and D and
0U are the jet inside diameter and maximum velocity at the jet outlet respectively. Results for the coil-inserted tube show the presence of streamwise vortices at both locations. At both locations the contours are asymmetric, which are related to the coil’s geometry and the way the streamwise vortices are generated off the coil.
For the smooth tube, results only show the presence of a pair of the opposite-signed streamwise vorticity near the jet centerline in the region of Z/D = ±0.5 and Y/D = ± 0.5, at x/D = 1.0.
The role of the streamwise vortices is to increase the rate of entrainment, and thus increase the mixing process. These results indicate that the coil insert can be used as a mixer for an enhanced diffusion and mixing process in a round jet.
Z/D
Y/D
-3 -2 -1 0 1 2 3-3
-2
-1
0
1
2
3
0.1000.0860.0710.0570.0430.0290.0140.000
-0.014-0.029-0.043-0.057-0.071-0.086-0.100
smooth jetX/D=0.1
vorticity
Z/D
Y/D
-2 0 2-3
-2
-1
0
1
2
3
0.1000.0860.0710.0570.0430.0290.0140.000
-0.014-0.029-0.043-0.057-0.071-0.086-0.100
vorticity
coil-inserted jet with d/D = 0.11X/D = 0.1
Figure 4. Cross sectional contours of normalized mean streamwise vorticity at x/D =
0.1.
16
Z/D
Y/D
-3 -2 -1 0 1 2 3-3
-2
-1
0
1
2
3
0.1000.0860.0710.0570.0430.0290.0140.000
-0.014-0.029-0.043-0.057-0.071-0.086-0.100
smooth jetX/D = 1
vorticity
Z/D
Y/D
-3 -2 -1 0 1 2 3-3
-2
-1
0
1
2
3
0.1000.0860.0710.0570.0430.0290.0140.000
-0.014-0.029-0.043-0.057-0.071-0.086-0.100
vorticity
coil-inserted jet with d/D = 0.11X/D = 1
Figure 5. Cross sectional contours of normalized mean streamwise vorticity at x/D =
1.
Figure 6-9 show experimental results of variations of normalized axial mean
velocity, axial and vertical turbulence intensities, and turbulent shear stress of the jet with coil-insert injector at x/D = 0.1, and 1.0, with different injection ratios. At x/D =0.1, when there is no injection, the mean velocity profile is asymmetric with the maximum velocity near the centerline. For low injection ratio, m=0.075, there are two maxima away from the centerline toward the edge of the jet. However, as m increases, there is shift in the axial mean momentum toward the positive y values.
At x/D = 1.0, the asymmetry in the mean velocity is reduced for the jet with no
radial blowing. With increases in the radial blowing, the asymmetry is also reduced and at m=0.15, the increase in the axial mean velocity on the negative y values results in more uniform distribution across the jet. At higher x/D locations, results (not shown here) show that initially the mean velocity profiles approach a normal distribution, and then they decay significantly at the downstream locations.
-0.6 -0.4 -0.2 0.0 0.2 0.4 0.60.0
0.2
0.4
0.6
0.8
1.0
U/U
0
y/D
m 0.0 0.075 0.10 0.125 0.15
(a)
-0.8 -0.6 -0.4 -0.2 0.0 0.2 0.4 0.6 0.80.0
0.2
0.4
0.6
0.8
1.0
U/U
0
y/D
m 0.0 0.075 0.10 0.125 0.15
(b)
Figure 6. Variation of normalized axial mean velocity along the mid-section for different
injection ratios. (a) x/D = 0.1, (b) x/D = 1.
17
-0.6 -0.4 -0.2 0.0 0.2 0.4 0.60.0
0.2
u'/U
0
y/D
m 0.0 0.075 0.10 0.125 0.15
(a)
-0.8 -0.6 -0.4 -0.2 0.0 0.2 0.4 0.6 0.80.0
0.2
u'/U
0
y/D
m 0.0 0.075 0.10 0.125 0.15
(b)
Figure 7. Variation of axial turbulence intensity along the mid-section for different
injection ratios. (a) x/D = 0.1, (b) x/D = 1.
-0.6 -0.4 -0.2 0.0 0.2 0.4 0.60.0
0.2
v'/U
0
y/D
m 0.0 0.075 0.10 0.125 0.15
(a)
-0.8 -0.6 -0.4 -0.2 0.0 0.2 0.4 0.6 0.80.0
0.2
v'/U
0
y/D
m 0.0 0.075 0.10 0.125 0.15
(b)
Figure 8. Variation of vertical turbulence intensity along the mid-section for different
injection ratios. (a) x/D = 0.1, (b) x/D = 1.
-0.6 -0.4 -0.2 0.0 0.2 0.4 0.6
0.0
0.2
0.4
0.6
0.8
1.0
1.2
1.4
uv*1
00/U
0^2
y/D
m 0.0 0.075 0.10 0.125 0.15
(a)
-0.8 -0.6 -0.4 -0.2 0.0 0.2 0.4 0.6 0.8
0.0
0.2
0.4
0.6
0.8
1.0
1.2
1.4
uv*1
00/U
0^2
y/D
m 0.0 0.075 0.10 0.125 0.15
(b)
18
Figure 9. Variation of turbulent shear stress along the mid-section for different injection ratios. (a) x/D = 0.1, (b) x/D = 1.
At x/D=0.1, when m=0., There are uneven distribution of axial turbulence
intensity across the jet with the highest increase on the negative y values. When m=0.075, there are increases in the axial turbulence intensity across the jet which is an indication of higher mixing process. With increasing m values, the added momentum results in higher intensities near the jet boundary.
At x/D = 1.0, the turbulence intensities are reduced and more evenly distributed
for high m values. Similar variations are seen for the vertical turbulence intensity, but with values nearly half of the axial turbulence intensity.
At x/D=0.1, when m=0, variation of the turbulent shear stress show a maxima
near the centerline. With m=0.075, the turbulent shear stress is very small and more uniform across the jet. However, with increasing m values, the turbulent shear stress increases significantly with pick values near the jet boundary. At x/D=1, the maximum turbulent shear stress values have moved toward the positive y values, near the edge of the jet boundary.
Figure 10 shows axial variations of the jet-half width and the maximum mean velocity. The jet half-width is the positive location where the axial mean velocity half of its maximum. Since the mean velocity profiles were asymmetric, the jet-half widths are not accurate representations of the jets growth rate but for approximate estimates, the values on the positive y values are taken. These results indicate that due to the intermittent nature of the jets at x/D = 0.1, the jet-half widths decrease initially and then increase until x/D=5 and decrease afterward. For m=0.125 and 0.15, from x/D=1 to 5, the jets’ growth rates are nearly uniform and identical. The highest decay of the maximum mean velocity is for the jets with m≥ 0.1. The increased decay of the maximum mean velocity is an indication of a high mixing between the axial and the injected fluids.
0 2 4 6 8 100.0
0.2
0.4
0.6
0.8
1.0
1.2
Y 0.5/D
x/D
m 0.0 0.075 0.10 0.125 0.150
0 2 4 6 8 100.0
0.2
0.4
0.6
0.8
1.0
1.2
Um
ax/U
o
x/D
m 0.0 0.075 0.10 0.125 0.150
Figure 10. Axial variation of the jet half width and maximum mean velocity for coil-
inserted jet with different injection ratios.
19
Figures 11-13 show contours of the axial mean velocity, axial, vertical and spanwise turbulence intensities, primary and secondary turbulent shear stresses and secondary flow vectors for coil-insert injector with m=0.15 at x/D=0.1. Figures 14-16 show similar results at x/D=1.0. At x/D=0.1, results show increased axial momentum and secondary flow vectors for z≥ 0. Previous results for the coil-insert injector with m=0 have shown the existence of two counter rotating streamwise vortices which enhanced mixing in the near field region. For the present results, the secondary flow vectors and contours of the axial mean velocity indicate that the injecting jets dominate the flow files in the near field region, and since two of the jets inject in the positive z direction, thus the high momentum regions are in the positive z direction. Turbulence is enhanced in the positive z direction near the jet boundary. There are small regions of high axial turbulence intensities, but for vertical and spanwise directions, regions of high turbulence intensities are more distributed indicating larger secondary flow variation (as shown by the secondary flow vectors) due to the injecting jets.
The primary turbulent shear stress show small region of high stresses near the jet
boundary on the negative z direction, while the secondary turbulent shear stress show high stress regions opposite to each other near the jet boundary on both positive and negative z values. These results are in accordance with the results obtained for the turbulence intensities.
At x/D=1.0, results show increased regions of high turbulence intensities and axial momentum along the positive z axis and reduced secondary flow. There are expanded regions of elevated primary and secondary turbulent shear stresses, along the positive z axis which is more pronounced for the secondary turbulent shear stress. These
21
results indicate that at x/D=1, the increased mixing between the axial flow and the injecting jets results in expanded regions of high turbulence intensities and shear stresses along the positive z direction.
Results of part I investigations indicate that the mixer-injector enhances mixing between the injected fluid and the axial flow significantly, however, the mixing enhancement is not uniform due to uneven injection rates along the coil. Thus a better approach could take advantage of the mixing coil by injecting the fluid upsteam and allowing the coil to mix the fluids with increased vorticity generations. This approach was used for development of a new SCR system, used in part II of the investigation.
Part II: Part II of the investigation was focused on development of an air assisted SCR system with coil-mixer and field test it with a fuel-injection diesel engine. The following figure shows the experimental set up.
23
Figure 17. Diesel Engine and the SCR system.
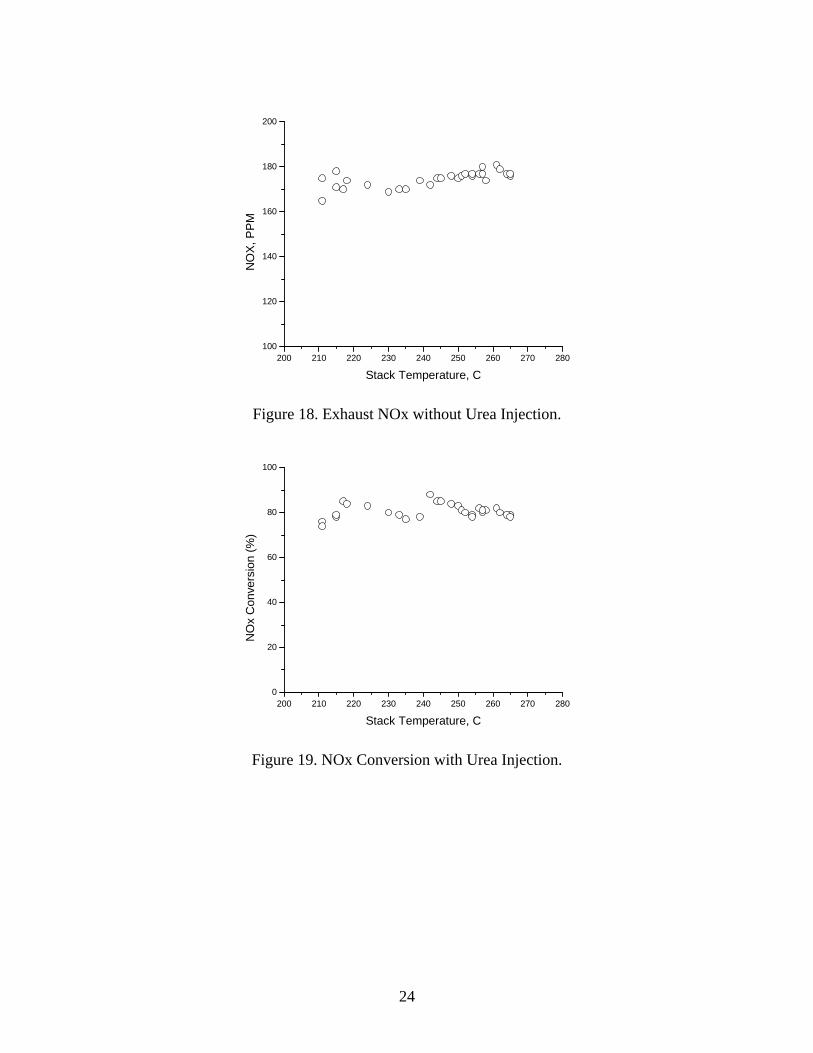
The exhaust emissions measurements were performed under 5 ft-lbs load condition at approximately 1200 rpm with a specific fuel consumption of 0.48 lbs/bhp-hr. The exhaust temperatures were between 290-320 ºC. The urea injection was at approximately 18:1 ratio with respect to the diesel fuel consumed. Figures 18 and 19 show variation of oxides of nitrogen (NOx) in PPM without the urea injection and percent NOx reduction with the urea injection. The average reduction in NOx emissions with this system is slightly higher than 80%. The test was also performed for idling condition with exhaust temperature slightly higher than 200C. Figure 20 shows the percent NOx reduction under the idling condition. As it can be seen, due to reduced exhaust temperature, the reduction in NOx is now slightly higher than 60%.
24
200 210 220 230 240 250 260 270 280100
120
140
160
180
200
NO
X, P
PM
Stack Temperature, C
Figure 18. Exhaust NOx without Urea Injection.
200 210 220 230 240 250 260 270 2800
20
40
60
80
100
NO
x C
onve
rsio
n (%
)
Stack Temperature, C
Figure 19. NOx Conversion with Urea Injection.
25
100 110 120 130 140 150 160 170 180 190 2000
20
40
60
80
100
NO
x C
onve
rsio
n (%
)
Stack Temperature, C
Figure 20. NOx Conversion at Idling Condition with Urea Injection
5.0. CONCLUSIONS AND RECOMMENDATIONS
The present investigation was divided into two parts. In part one the mixing
effectiveness of a coil injector with different injection ratio was investigated using air as both exhaust and injecting fluid. The experiments were carried out in an air-jet facility and mixing effectiveness was investigated using a double hot wire sensor in X formation in conjunction with a dual channel TSI IFA-100 intelligent flow analyzer. Simultaneous time resolved measurements of two components of turbulent velocity and their cross moments were made at the exit and downstream of an axisymmetric jet with a coil-insert injector. The coil-insert injector was a coil shaped tube with ratios of coil diameter, pitch spacing and length to the jet inside diameter of 0.1, 1.0, and 1.5 respectively. The coil had three round holes of 0.2 mm diameter at the middle of each pitch for radial injection. The volume flow ratios of the radial blowing to the axial flow were 0.075, 0.10, 0.125, and 0.15. Results indicate that the radial blowing enhances asymmetry and increased generation of turbulence intensities at the jet outlet. However, increased entrainment and mixing between the injected flow and the axial flow reduces the asymmetry downstream, resulting in relatively constant intensities in the region with high axial momentum.
In part two of the investigation, an SCR system with an injector-mixer was
developed. The injector was a small stainless tube placed perpendicular to the exhaust direction with an injecting nozzle aligned with the exhaust flow. The mixer was a coil with ratios of wire diameter, pitch spacing and length to the inside exhaust tube diameter of 0.1, 1.0, and 6. Aqueous urea with 36% solution by weight was used as the reducing agent. The urea was injected into the exhaust of a three-cylinder fuel injected partially loaded diesel engine. Measurements of NOx emissions were made downstream of the mixer using a portable ENERAC micro-emissions analyzer model 500. Experiments were performed with and without the urea injection. Results indicate more than 80% reduction
26
in NOx emissions with this injector mixer configuration. Higher injection is possible with better mixing process. For small diesel engines, the injected urea is small and regulating urea supply with exhaust NOx emissions is difficult. However, in large diesel engines such as diesel truck, the urea supply is higher and accurate urea injection will improve the system further to achieve higher NOx reduction. This aspect will be investigated further with a loaded diesel generator with engines similar to a diesel truck engines. In addition, further experimentation is also underway with direct ammonia injection. With the new emerging technology of adAmmine from Amminex, direct ammonia injection can be an effective alternative to the Urea injection.
27
REFERENCES
1. Vedal, S., 1997, “Ambient particles and health: lines that divide,” J. Air & Waste
Manage. Assoc., 47, pp. 551-581. 2. Morawaska, L., Thomas, S., Bofinger, N.D., Wainwright, D., and Neale, D.,
1998, “Comprehensive characterization of aerosols in a subtropical urban atmosphere: particle size distribution and correlation with gaseous pollutants,” Atmospheric Environment, 32, 14/15, pp. 2461-2478.
3. California Air Resources Board (CARB), “Proposed Emission Reduction Plan for Ports and Goods Movements in California,” Released March 21, 2006.
4. Guderman, et al, “ The effect of Air Pollution on Lung Development from 10 to
18 Years of Age,” The new England Journal of Medicine, Vol. 351, No. 11, September 2004.
5. Kummer, J., 1981, “Catalysts for Automobile Emission Contro,” Prog. Energy
Combust. Sci., Vol. 6, pp. 177-199.
6. Lambert, C., Cavataio, G., Cheng, Y., Dobson, D., Girard, J., Laing, P., Patterson, J., and Williams, S., 2006, “ Urea SCR and DPF System for Tier 2 Diesel Light-Duty Trucks,” DEER Conference, Detroit, Michigan. From: http://www1.eere.energy.gov/vehiclesandfuels/pdfs/deer_2006/session5/2006_deer_lambert.pdf
7. Johannessen, T., Schmidt, H., Svagin, J., and Oechsle, J., “Ammonia Storage and Delivery Systems for NOx Aftertreatment,” 13th Diesel Engine-Efficiency and Emissions Research (DEER) Conference, Detroit, Michigan, August 13-16, 2007.
8. Fable, S., Kamakate, F., and Venkatesh, S., 2002, “Selective Catalytic Reduction Urea Inferastructure Study,” National Renewable Energy Laboratory, NREL/SR-540-32689.
9. Sumiya, S., Muramatsu, G., Matsumura, N., and Yoshida, K., 1992, “Catalytic
Reduction of NOx and Diesel Exhaust,” SAE paper No. 920853.
10. Rahai, H.R., 2003, “Reducing Pollutants from Mobile Sources,” METRANS final Report, Contract FR65A0047.