31
Reducing Emissions from Deforestation in Developing Countries UNFCCC Vienna Climate Change Talks Vienna, Austria 29 August 2007 www.RainforestCoalition.org

Reducing Emissionsfrom Deforestation in Developing Countries
UNFCCC Vienna Climate Change TalksVienna, Austria29 August 2007
www.RainforestCoalition.org

Key MessagesDeforestation: Reducing emissions from deforestation is possible and urgently needed.
Sustainable Development: Catalyze gains toward climate stability, poverty reduction, biodiversity conservation, and rural development.
Positive Incentives: Leading drivers are identifiable. In most cases, higher carbon ‘incentives’ will drive greater emissions reductions from deforestation.
Methodologies: IPCC methodologies are approved and already in use. Minor refinements for DC’s.
Funding Available (20/20): 20% of problem: 20% of solution. 20% of ‘carbon’ market resources would provide revenues at necessary scale: $5 - $25 billion / year.

Deforestation Drivers
Foods: Soya, Coffee, Cocoa, Sugar, Gardens, Ranching, etc.
Logging: Low value exports, unsustainable practices.
Energy: Fuel-wood in rural areas.
Development: Roads, Mining, Power-Lines, etc.
Population: Growth drives above.
Perverse Incentives!
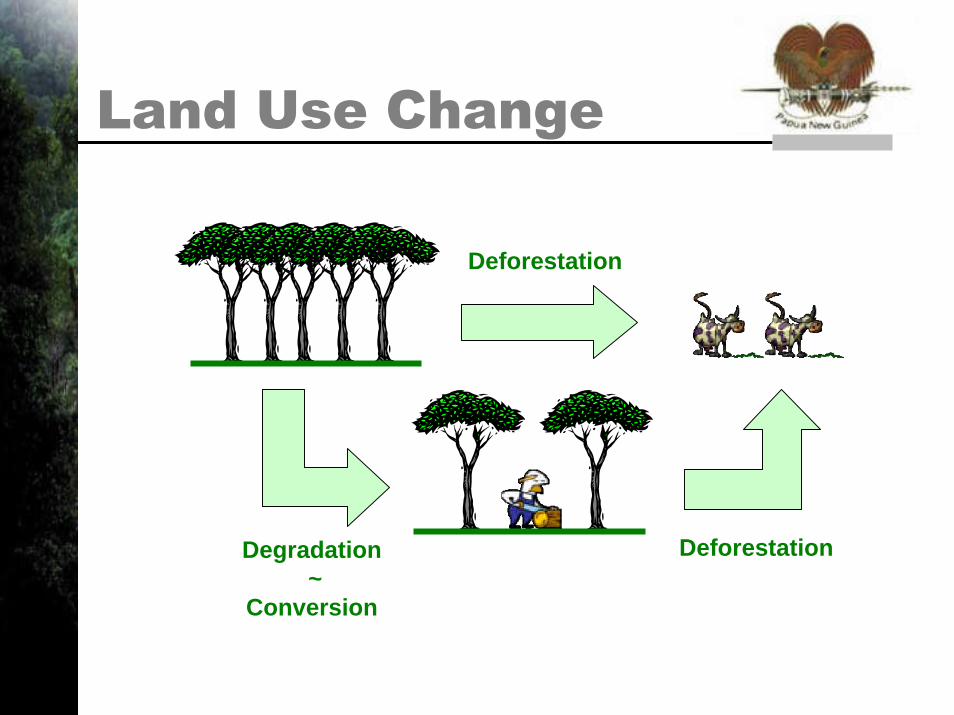
Deforestation
DeforestationDegradation ~
Conversion
Land Use Change

Emission Sources
IPCC: Emissions from deforestation approx. 20% of total GHG’s

Emission Sources

The Kyoto Dilemma
KP Exclusion: Kyoto excludes developing nations that reduce deforestation emissions. Kyoto unfairly discriminates against these nations in the world carbon markets. How can we ignore 20% of GHG?
Market Access: Tropical rainforest nations deserve to be treated equally. If we reduce deforestation, fair compensation for reductions.A ton is a ton is a ton.
Forests:Critical role in
Long Term Solution

Rainforest Coalition
Cross Regional Partnership(30+ Nations)
• Africa• South Asia• Caribbean• Central America• Oceania• South America

Rainforest Coalition
Policy Development & ConsensusOperate within G77 & China
Central America
Caribbean
South AmericaAfrica
Asia
CfRN

Conditions
DEEPER cuts within rich nations
Real Benefits – climate and development
Voluntary Initiatives
State Sovereignty & Approaches
Differentiated Responsibilities
Flexible Basket of Positive Incentives
Equitable & Fair

Forest Cover Change

Forest Cover Change

One billion acres of tropical forest lost
Achard et al., 2002 Science 297:999
Global Impacts
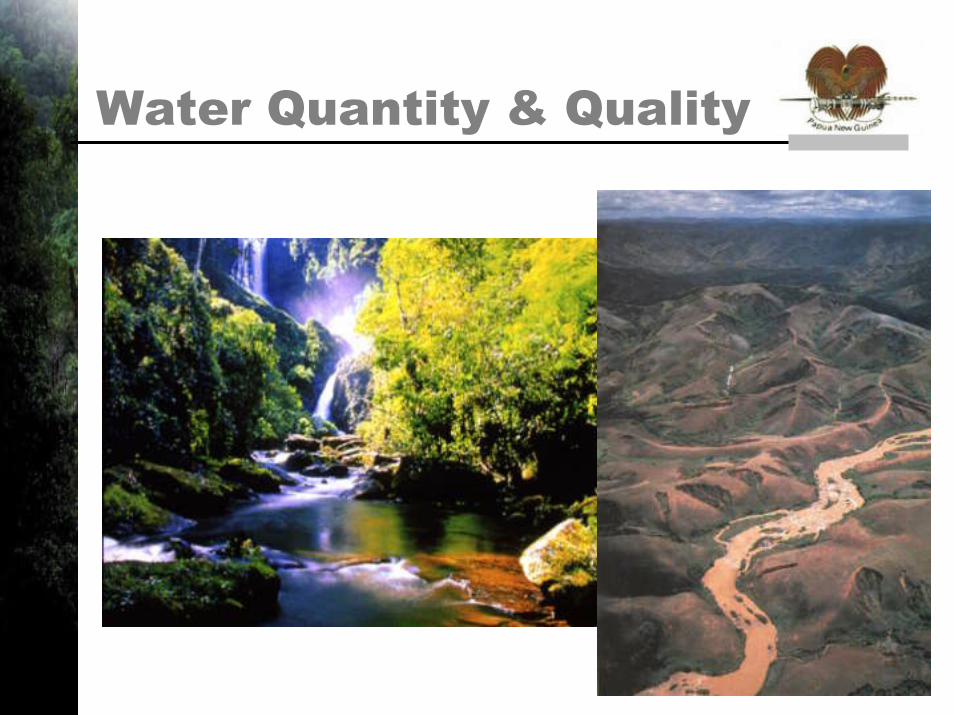
Water Quantity & Quality

Extreme Weather Events
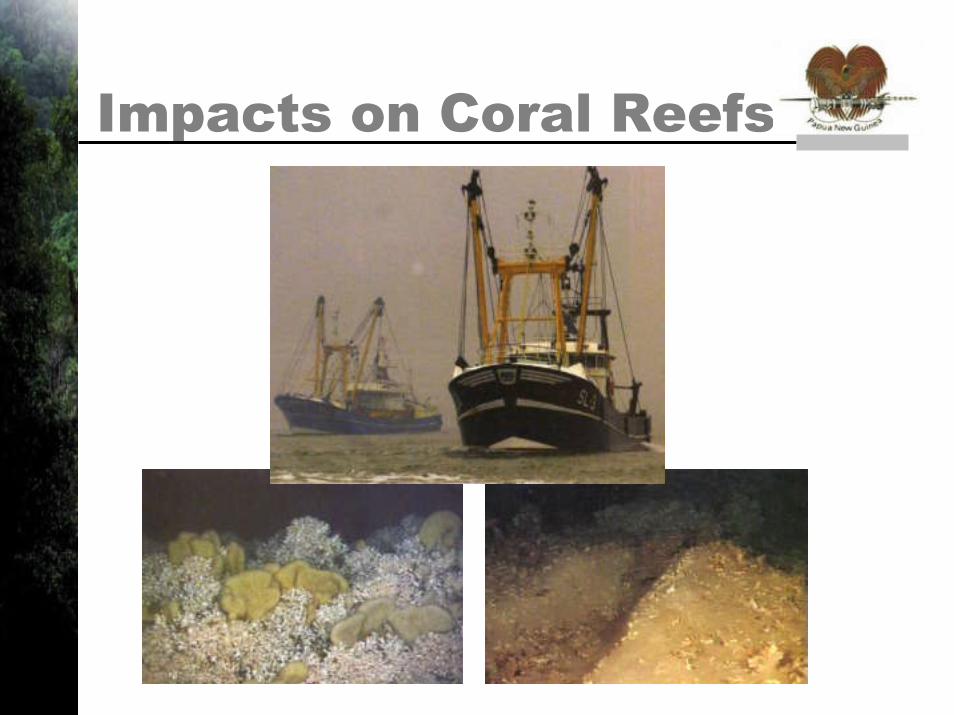
Impacts on Coral Reefs

Local & Global Fisheries

Species and Populations
Vertebrates• 56,586 spp.• 21% threatened
Invertebrates • 1,190,200 spp.•58% threatened
Plants• 287,655 spp.• 69% threatened
Total• 1,534,441 spp.• 59% threatened

Ecosystem Services
Pest Control
Pollination
Disease Buffering

Infectious Diseases
Cholera
E. coli non-O157
Multidrug-resistant SalmonellaE. coli O157BSEnvCJD
Cholera 0139
Legionellosis
Yellow fever
Hantaviruspulmonarysyndrome
Venezuelanequineencephalitis
West Nile fever
Cryptosporidiosis
Lyme borreliosis
LegionellosisLassa fever
Ebolahaemhorragic feverCholera
Human monkeypox
O’nyong-nyong fever
Rift Valley fever
EchinococcosisWest Nile fever
Malaria
Typhoid
Denguehaemhorragic fever
DiphtheriaNipah virus encephali
Influenza A (H5N1)
E. coli O157
Hendra virus infection
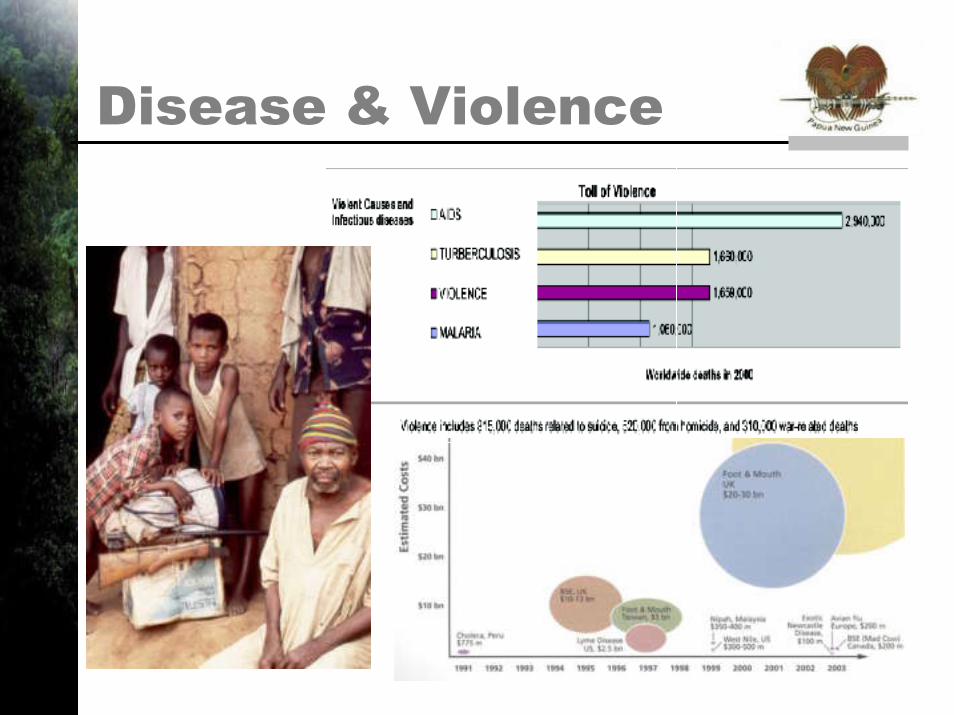
Disease & Violence

Rural Landscapes

Carbon + : Social Benefit
Climate: Capture a significant source of carbon emissions currently outside frameworks.
Rural Development: Significant new revenue streams to addresses poverty in rural areas with clear metrics to access effectiveness.
MDGs: Underpins MDG objectives related to environment, poverty, gender equality, health, etc.
Ecosystems: Great effect on marine resources, species diversity, pest control, disease buffering, pollination, etc.
Biodiversity: Major biodiversity conservation benefits.
Soils: Supports efforts against desertification and soil erosion.
Water: Watershed protection and potable water supply.

Forest Cover Trends
ForestCover
Time
PNGBoliviaIndonesiaCameroon Costa Rica
China
SurinameGabon
IndiaBangladesh
100%
0%
REDD
Conservation
CDM-AR

Economic ContextStern Review: Estimates $5 - $15 billion/year to reduce global deforestation by 50% (likely underestimated.)
GEF: $100 million/year in forestEcosystems: $80 million/yearCertified Forest Products: $120 million/yearBio-prospecting: $14 million/yearODA Protected Areas: $800 million/yearMajor NGO’s: $1.2 billion/yearCDM (Energy): $1 - $5 billion/year (est. for 1st CP)
Total ODA: $80 billion/year
Carbon Market Growth:$100 billion/year?

REDD(National)
Basket of Instruments
REDD Conservation(Conservation over
Displacement)
Reforest(Project)
Non – MarketOptions
A / R
REDD
Non
Market
Conserve
2008 2012
Market
Non Market
Blend
REDDReadiness Activities
COP-13
Marrakesh Compliant

Additional: Deeper Cuts
AAU - JI KP1(- 6%)
KP2(- 20%?)
REDD10%
+
Additional
New Total -30%?
NOT CDMNEW CREDITS = DEEPER CUTS
AAU --- JI CDM10%?
CDM10%

Bali: Global Response
2008 2010 2012+
Readiness Early Action Post - 2012
Capacity
Analyze Past, present, future
EvaluateDrivers, Opp. Costs., Data and Methods.
InstitutionsPolicies & Instruments
Pilot InitiativesTest Policies & Instruments vs. drivers
US$ 250 - $500 mil.
Scale Up Funding
National / Reg. MarketsIPCC Standards Early Action: Credits Transferable to future.
Linking SectorsAirlines / ShippingTax: $15/ton = $6-$12 B/Y
TaxOil: $0.39/b ($10 B/Y)AAU: $0.90/u ($10 B/Y)Energy Subs: ($250 B/Y)
US$ 2 – US$ 5 B/Y
Future Regimes
Voluntary & FairPositive IncentivesCut Process Hurdles
Proportional20% of Resources
FungibleEqual Value for Credits
BalancedSupply = Demand
US$ 10–US$ 25 B/Y
Phase 1 Phase 2 Phase 3

Scaling Up
0
2,000
4,000
6,000
8,000
10,000
2008 2009 2010 2011 2012 2013 2014 2015
mill
ion
$
Pilots Early Action CRED Mechanism

Bali: Key MessagesMethodologies: Immediately refine application of IPCC GPG’s (Experts Group), consider conservation, expand and simplify A/R.
Readiness (2008-2009): Build capacity. Assess drivers of deforestation – past, present, future. Evaluate policy tools. “Pilot” policies and instruments.
Early Action (2009-2012): Scale Up. Facilitate funding flows. Standardize methods. Harness Voluntary Markets.
Sustainable Development Post-2012: Traditional monies not sustained, not adequate. Countries need certainty – at scale, predictable, sustainable.
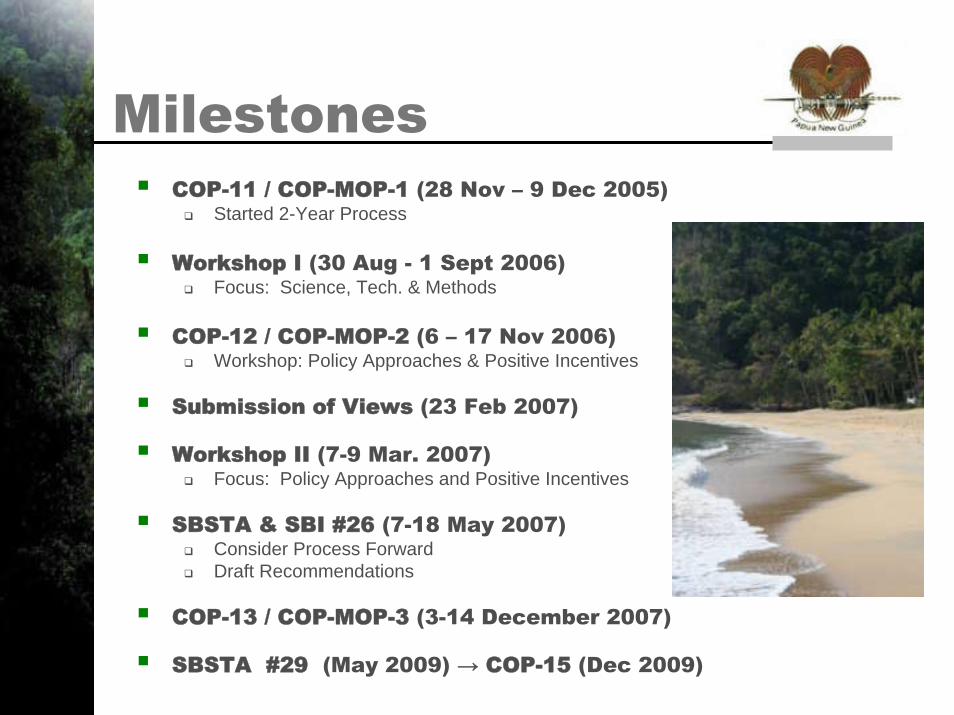
COP-11 / COP-MOP-1 (28 Nov – 9 Dec 2005)Started 2-Year Process
Workshop I (30 Aug - 1 Sept 2006)Focus: Science, Tech. & Methods
COP-12 / COP-MOP-2 (6 – 17 Nov 2006)Workshop: Policy Approaches & Positive Incentives
Submission of Views (23 Feb 2007)
Workshop II (7-9 Mar. 2007)Focus: Policy Approaches and Positive Incentives
SBSTA & SBI #26 (7-18 May 2007)Consider Process ForwardDraft Recommendations
COP-13 / COP-MOP-3 (3-14 December 2007)
SBSTA #29 (May 2009) → COP-15 (Dec 2009)
Milestones


