Reducing Road Danger in Reducing Road Danger in Southwark – Southwark – Effectiveness of Current Effectiveness of Current Strategies. Strategies. Southwark Living Streets, Southwark Cyclists & Roadpeace Southwark Living Streets, Southwark Cyclists & Roadpeace 7th March 2012 7th March 2012
Transcript
Reducing Road Danger in Reducing Road Danger in Southwark – Southwark –
Effectiveness of Current Strategies.Effectiveness of Current Strategies.
Southwark Living Streets, Southwark Cyclists & RoadpeaceSouthwark Living Streets, Southwark Cyclists & Roadpeace
7th March 20127th March 2012
Reducing Road Danger in Reducing Road Danger in Southwark – Southwark –
Effectiveness of Current Strategies.Effectiveness of Current Strategies.
Southwark Living Streets, Southwark Cyclists & RoadpeaceSouthwark Living Streets, Southwark Cyclists & Roadpeace
7th March 20127th March 2012
2
Introduction.
• A number of Southwark groups have concerns about the effectiveness of current road safety strategies in
Southwark. These concerns arise from issues related to the following areas:
- Road Casualty Levels. A now long established halt to the decline in the levels of serious and fatal
casualties on Southwark’s roads that occurred in the 1990s.
- 20mph Borough. The low priority currently being given to implementing the 20mph borough policy
that Southwark is currently committed to.
- LIP Projects. The relative inability of major LIP projects to deliver significant change to our roads.
• This short report outlines these concerns and makes proposals for how to address them.
• We see this as an issue of collaboration between local groups and Southwark Council and very much want
to be partners with it in attempting to bring about a more successful approach to reducing road danger in
Southwark.
• Casualty data comes from the TfL managed London Road Safety website - www.londonroadsafety.co.uk or
the DfT (www.assets.dft.gov.uk/statistics/tables/ras30031.xls).
3
Road Casualty Levels - 1. The Overall Picture.
239.2 249 201 196 121 132 138 139 165 127 165
1,543 1,544
1,245 1,220
984 1,016 1,050911
1,025981 984
2 5 8
1994-1998 Average
2001 2002 2003 2004 2005 2006 2007 2008 2009 2010
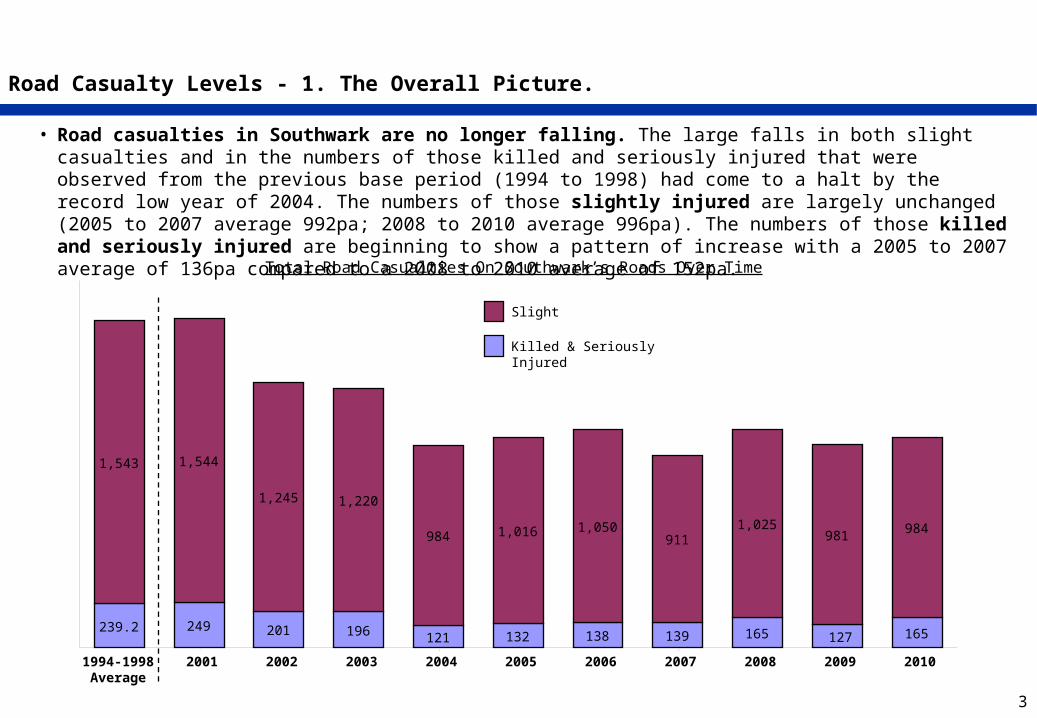
Total Road Casualties On Southwark’s Roads Over Time
Slight
Killed & Seriously Injured
• Road casualties in Southwark are no longer falling. The large falls in both slight casualties and in the numbers of those killed and seriously injured that were observed from the previous base period (1994 to 1998) had come to a halt by the record low year of 2004. The numbers of those slightly injured are largely unchanged (2005 to 2007 average 992pa; 2008 to 2010 average 996pa). The numbers of those killed and seriously injured are beginning to show a pattern of increase with a 2005 to 2007 average of 136pa compared to a 2008 to 2010 average of 152pa.
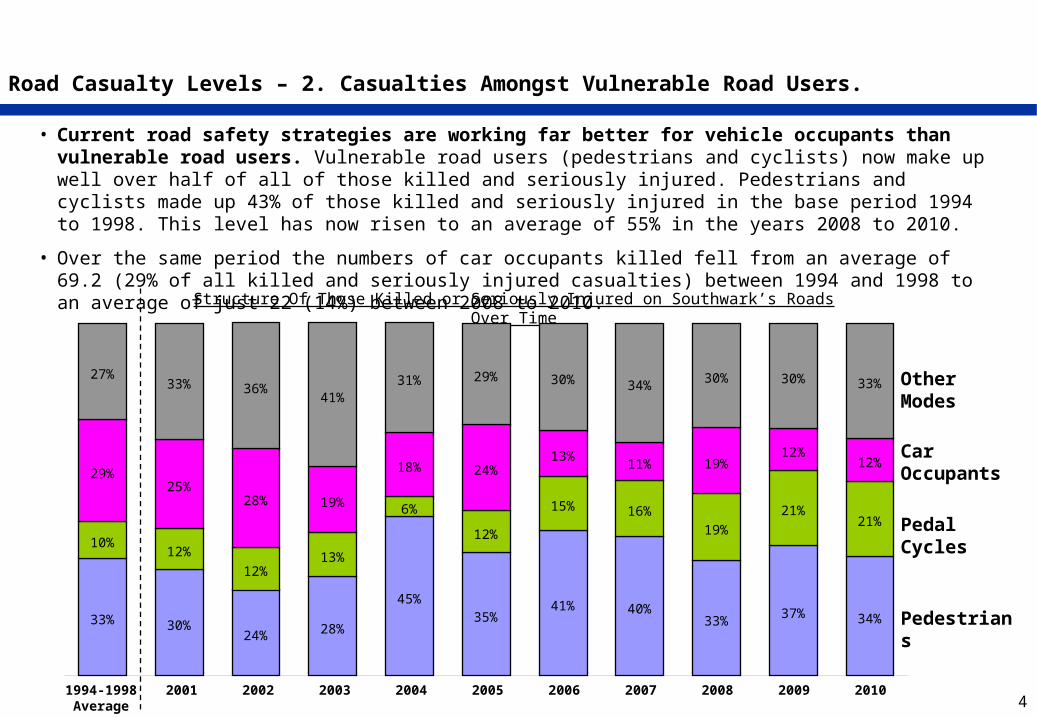
• Current road safety strategies are working far better for vehicle occupants than vulnerable road users. Vulnerable road users (pedestrians and cyclists) now make up well over half of all of those killed and seriously injured. Pedestrians and cyclists made up 43% of those killed and seriously injured in the base period 1994 to 1998. This level has now risen to an average of 55% in the years 2008 to 2010.
• Over the same period the numbers of car occupants killed fell from an average of 69.2 (29% of all killed and seriously injured casualties) between 1994 and 1998 to an average of just 22 (14%) between 2008 to 2010.
Structure Of Those Killed or Seriously Injured on Southwark’s Roads Over Time
• The numbers of pedestrians killed of seriously injured is no longer falling. As the chart below shows, there were dramatic declines in the numbers of serious and fatal collisions involving pedestrians in the years between the base years for comparison of the early 1990s and 2002. Since that time there has no persistent decline in these levels in Southwark.
• DfT data shows just how high these levels are in Southwark. The UK average in 2010 for the number of pedestrians killed and seriously was 9.3 per 100,000 population. The Greater London average was 11.7; the level in Southwark was 19.5.
79.875
54 56 57
46
57 55 54
47
56
1994-1998 Average
2001 2002 2003 2004 2005 2006 2007 2008 2009 2010
Numbers of Pedestrians Killed or Seriously Injured on Southwark’s Roads Over Time
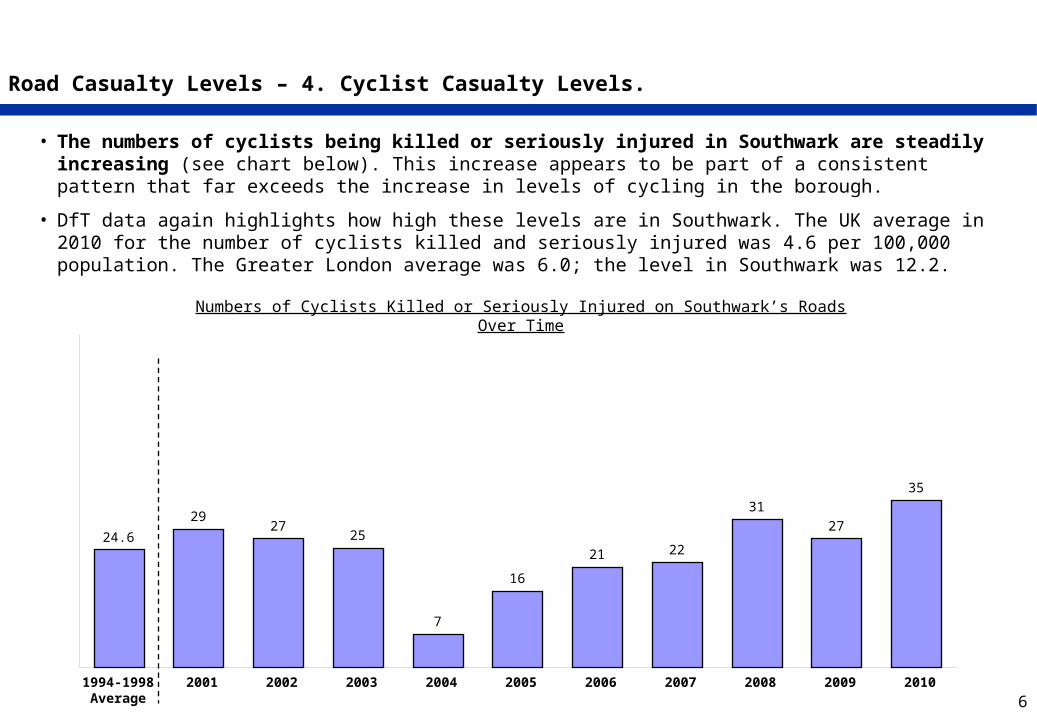
• The numbers of cyclists being killed or seriously injured in Southwark are steadily increasing (see chart below). This increase appears to be part of a consistent pattern that far exceeds the increase in levels of cycling in the borough.
• DfT data again highlights how high these levels are in Southwark. The UK average in 2010 for the number of cyclists killed and seriously injured was 4.6 per 100,000 population. The Greater London average was 6.0; the level in Southwark was 12.2.
Numbers of Cyclists Killed or Seriously Injured on Southwark’s Roads Over Time
24.6
2927
25
7
16
21 22
31
27
35
1994-1998 Average
2001 2002 2003 2004 2005 2006 2007 2008 2009 2010
7
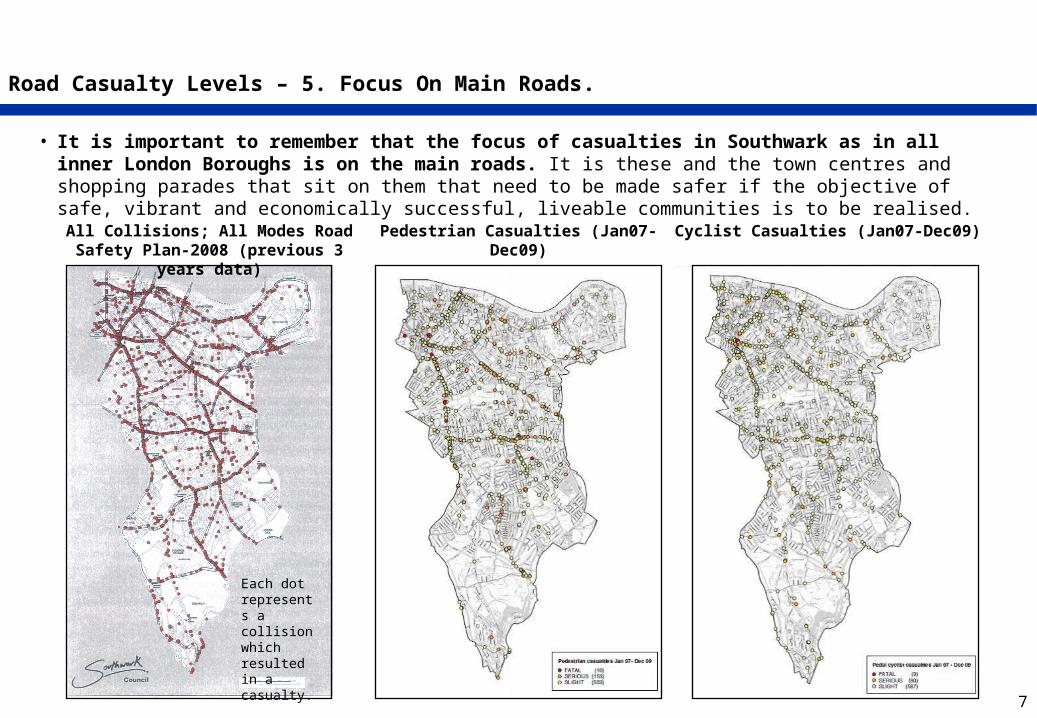
Road Casualty Levels – 5. Focus On Main Roads.
• It is important to remember that the focus of casualties in Southwark as in all inner London Boroughs is on the main roads. It is these and the town centres and shopping parades that sit on them that need to be made safer if the objective of safe, vibrant and economically successful, liveable communities is to be realised.
All Collisions; All Modes Road Safety Plan-2008 (previous 3 years data)
Each dot represents a collision which resulted in a casualty.
8
A 20mph Borough.
• In the Annual Monitoring Report, Objective 5 states that there is an aim to “ensure the transport network is safe and secure for all and to improve perceptions of safety”.
• (Page 32) Policy 5.5 – states that “We will make Southwark a 20mph borough”. Table 32 shows that:
2007/08 2008/09 2009/10 2010/11
% km included in 20mph restriction 44 49 65 65
Number 20 mph zones/limit areas 21 25 29 29
• The picture is currently one where there appears to be very little investment now going into 20mph in Southwark. We understand very well the difficulties of introducing 20mph when TfL are making this so difficult by strongly discouraging schemes that include vertical deflections and are so vehemently set against enforcement even if it is through average speed cameras.
• Other boroughs such as Hackney and Islington are, however, vigorously pursuing this 20mph Borough agenda. Islington is now implementing a policy of 20mph limits on all roads (including main roads) under borough control and Hackney has recently designated all residential roads to have a 20mph speed limit.
• …AND 20mph speed limits do make a difference as the table (from TfL) below illustrates. Looking at the collisions (involving personal injury) that occurred in London and in Southwark in 2009, almost none of these occurred in areas covered by 20mph speed limits.
Collisions in the Greater London area in 2009 tabulated by speed limit and borough
20mph 30mph 40mph 50mph/+
Greater London 52 21,749 713 725
Southwark 0 974 0 0
9
LIP Projects – The Effectiveness Of Spending.
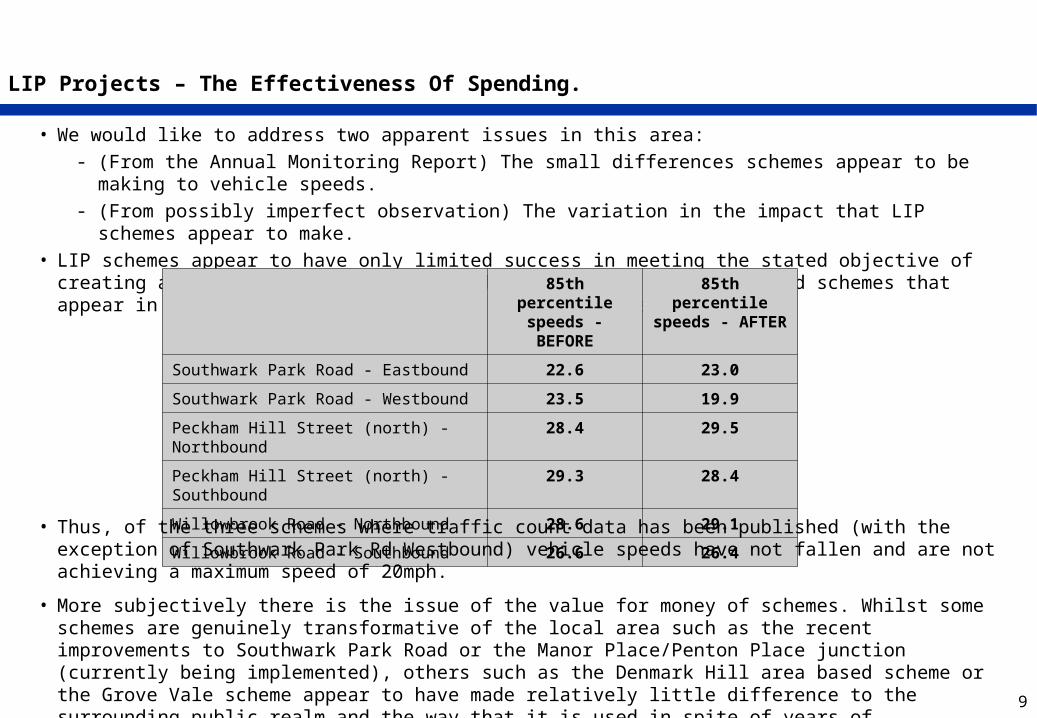
• We would like to address two apparent issues in this area:- (From the Annual Monitoring Report) The small differences schemes appear to be making to vehicle speeds.- (From possibly imperfect observation) The variation in the impact that LIP schemes appear to make.
• LIP schemes appear to have only limited success in meeting the stated objective of creating a 20mph borough. Before and after speeds of the LIP funded schemes that appear in the Annual Monitoring Report are as follows:
85th percentilespeeds - BEFORE
85th percentilespeeds - AFTER
Southwark Park Road - Eastbound 22.6 23.0
Southwark Park Road - Westbound 23.5 19.9
Peckham Hill Street (north) - Northbound 28.4 29.5
Peckham Hill Street (north) - Southbound 29.3 28.4
Willowbrook Road - Northbound 28.6 29.1
Willowbrook Road - Southbound 26.6 26.4
• Thus, of the three schemes where traffic count data has been published (with the exception of Southwark Park Rd Westbound) vehicle speeds have not fallen and are not achieving a maximum speed of 20mph.
• More subjectively there is the issue of the value for money of schemes. Whilst some schemes are genuinely transformative of the local area such as the recent improvements to Southwark Park Road or the Manor Place/Penton Place junction (currently being implemented), others such as the Denmark Hill area based scheme or the Grove Vale scheme appear to have made relatively little difference to the surrounding public realm and the way that it is used in spite of years of consultation, planning and the large sums that have been spent.
10
Conclusions & Action Plan.
20mph Borough
• We strongly believe that borough wide 20mph speed limits should be aggressively pursued. When properly enforced (either by physical measures in 20mph zones, or cameras or work by the police for 20mph limits), casualty numbers fall dramatically.
High Casualty Main
Borough Roads
• Whilst we understand the problems of influencing TfL concerning their roads, of the 975 collisions (which involved personal injury) that appear in the TfL statistics as having occurred in 2009 in Southwark, 420 (43%) occurred on the TLRN and 555 (57%) occurred on Borough managed roads. We need to tackle danger on these borough main roads more successfully.
• LIP schemes need to focus on the high casualty borough roads (especially those in town centres/shopping areas) and to be designed to reduce vehicle speeds to 20mph and reduce excessive carriageway capacity (eg Camberwell Rd).
• We suggest urgent attention is needed for the following high danger roads:
• The 2011 Transport Plan sets ambitious targets for casualty reduction with a long term target of :- 93 people killed or seriously injured by 2018/20 and an interim target of 121 average for the 3 years 2011/13. - 687 people slightly injured by 2018/20 and an interim target of 887 average for the 3 years 2011/13.
• At present, the figures that we have outlined on page 3 in particular indicate that there is little or no chance of this occurring with a continuation of current policies.
• We propose changes to current policies and a process to review how Southwark will meet these targets.
Transport for London
• Successive Southwark road safety strategies have emphasised the need for TfL to play its part in making the roads it controls and influences (TLRN & SRN) in Southwark safer. We need to understand what role they are currently playing in this and influence them more effectively to make road safety and especially that of vulnerable road users more of a priority.
south of Fielding St)- Camberwell Rd - Lordship Lane
TLRN• New Kent Rd• Old Kent Rd• A202 – Camberwell & Peckham
11
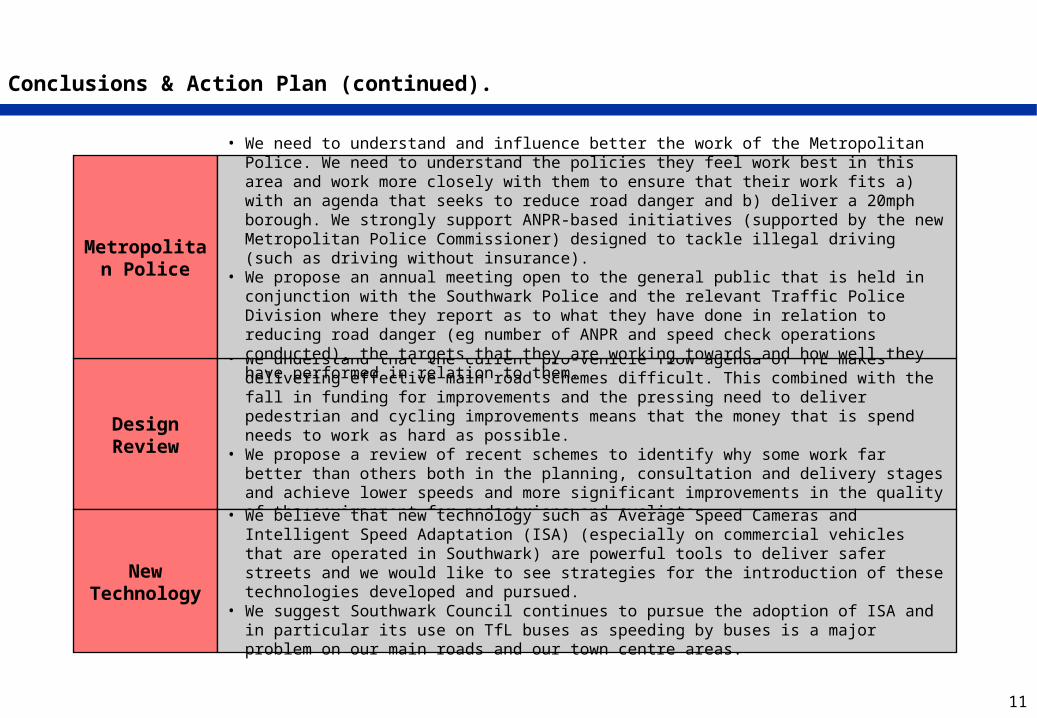
Conclusions & Action Plan (continued).
Design Review
• We understand that the current pro-vehicle flow agenda of TfL makes delivering effective main road schemes difficult. This combined with the fall in funding for improvements and the pressing need to deliver pedestrian and cycling improvements means that the money that is spend needs to work as hard as possible.
• We propose a review of recent schemes to identify why some work far better than others both in the planning, consultation and delivery stages and achieve lower speeds and more significant improvements in the quality of the environment for pedestrians and cyclists.
New Technology
• We believe that new technology such as Average Speed Cameras and Intelligent Speed Adaptation (ISA) (especially on commercial vehicles that are operated in Southwark) are powerful tools to deliver safer streets and we would like to see strategies for the introduction of these technologies developed and pursued.
• We suggest Southwark Council continues to pursue the adoption of ISA and in particular its use on TfL buses as speeding by buses is a major problem on our main roads and our town centre areas.
Metropolitan Police
• We need to understand and influence better the work of the Metropolitan Police. We need to understand the policies they feel work best in this area and work more closely with them to ensure that their work fits a) with an agenda that seeks to reduce road danger and b) deliver a 20mph borough. We strongly support ANPR-based initiatives (supported by the new Metropolitan Police Commissioner) designed to tackle illegal driving (such as driving without insurance).
• We propose an annual meeting open to the general public that is held in conjunction with the Southwark Police and the relevant Traffic Police Division where they report as to what they have done in relation to reducing road danger (eg number of ANPR and speed check operations conducted), the targets that they are working towards and how well they have performed in relation to them.