NCHRP IDEA Program Reducing Stormwater Runoff and Pollutant Loading with Biochar Addition to Highway Greenways Final Report for NCHRP IDEA Project 182 Prepared by: Paul. T. Imhoff Seyyed Ali Akbar Nakhli University of Delaware October 2017
Transcript
NCHRP IDEA Program
Reducing Stormwater Runoff and Pollutant Loading with Biochar
Addition to Highway Greenways
Final Report for NCHRP IDEA Project 182
Prepared by: Paul. T. Imhoff Seyyed Ali Akbar Nakhli University of Delaware
October 2017
Innovations Deserving Exploratory Analysis (IDEA) Programs Managed by the Transportation Research Board
This IDEA project was funded by the NCHRP IDEA Program.
The TRB currently manages the following three IDEA programs:
• The NCHRP IDEA Program, which focuses on advances in the design, construction, and maintenance of highway systems, is funded by American Association of State Highway and Transportation Officials (AASHTO) as part of the National Cooperative Highway Research Program (NCHRP).
• The Safety IDEA Program currently focuses on innovative approaches for improving railroad safety or performance. The program is currently funded by the Federal Railroad Administration (FRA). The program was previously jointly funded by the Federal Motor Carrier Safety Administration (FMCSA) and the FRA.
• The Transit IDEA Program, which supports development and testing of innovative concepts and methods for advancing transit practice, is funded by the Federal Transit Administration (FTA) as part of the Transit Cooperative Research Program (TCRP).
Management of the three IDEA programs is coordinated to promote the development and testing of innovative concepts, methods, and technologies.
For information on the IDEA programs, check the IDEA website (www.trb.org/idea). For questions, contact the IDEA programs office by telephone at (202) 334-3310.
IDEA Programs Transportation Research Board 500 Fifth Street, NW Washington, DC 20001
The project that is the subject of this contractor-authored report was a part of the Innovations Deserving Exploratory Analysis (IDEA) Programs, which are managed by the Transportation Research Board (TRB) with the approval of the National Academies of Sciences, Engineering, and Medicine. The members of the oversight committee that monitored the project and reviewed the report were chosen for their special competencies and with regard for appropriate balance. The views expressed in this report are those of the contractor who conducted the investigation documented in this report and do not necessarily reflect those of the Transportation Research Board; the National Academies of Sciences, Engineering, and Medicine; or the sponsors of the IDEA Programs.
The Transportation Research Board; the National Academies of Sciences, Engineering, and Medicine; and the organizations that sponsor the IDEA Programs do not endorse products or manufacturers. Trade or manufacturers’ names appear herein solely because they are considered essential to the object of the investigation.
IDEA PROGRAMS STAFF CHRISTOPHER HEDGES Director, Cooperative Research Programs Lori Sundstrom
Deputy Director, Cooperative Research Programs
INAM JAWED
Senior Program Officer
DEMISHA WILLIAMS
Senior Program Assistant EXPERT REVIEW PANEL
WILLIAM VAN PEETERS, FHWA
MARCEL TCHAOU, FHWA
PETER MATTEJAT, MTA
CHARLES HEGBERG, reGENSIS
Acknowledgements
This work was funded by the Transportation Research Board of the National Academies under the TRB-IDEA
Program (NCHRP-184). A special thanks is extended to the TRB Project Director, Inam Jawed, and the
Advisory Panel: William van Peeters, Federal Highway Administration; Marcel Tchaou, Federal Highway
Administration Office of Project Development & Environmental Review; Peter Mattejat, Maryland
Transportation Authority; and Charles Hegberg, reGENESIS Consulting Services, LLC.
Thank you also to Seyyed Ali Akbar Nakhli and Joseph Brown, graduate students at the University of
Delaware who conducted most of the experimental work reported.
Appreciation also goes to the Delaware Department of Transportation and the Maryland Transportation
Authority for their support, guidance, and many suggestions that helped focus the work. Assistance from Larry
Trout of Rummel Klepper & Kahl (RK&K) on engineering aspects of this work is also appreciated.
2
TABLE OF CONTENTS EXECUTIVE SUMMARY ................................................................................................................................................. 4 1. IDEA PRODUCT ........................................................................................................................................................ 6 2. CONCEPT AND INNOVATION ............................................................................................................................... 6 3. INVESTIGATION ....................................................................................................................................................... 7
3.1. INFLUENCE OF BIOCHAR ON STORMWATER RETENTION AND INFILTRATION – LAB SCALE . 7 3.1.1. Biochar and Soil Samples .................................................................................................................................. 7 3.1.2. Particle Size Distribution .................................................................................................................................. 8 3.1.3. Particle Density, Bulk Density, Porosity and Surface Area ........................................................................... 9 3.1.4. Water Retention – Dry Region ................................................................................................................... 12 3.1.5. Water Retention – Wet and Dry Regions .................................................................................................. 16 3.1.6. Unsaturated Hydraulic Conductivity ......................................................................................................... 20 3.1.7. Saturated Hydraulic Conductivity ............................................................................................................. 22
3.2. INFLUENCE OF BIOCHAR AMENDMENT ON STORMWATER RETENTION AND INFILTRATION – PILOT SCALE ............................................................................................................................. 24
3.3. INFLUENCE OF BIOCHAR AMENDMENT ON STORMWATER RETENTION AND INFILTRATION – FIELD SCALE ............................................................................................................................. 31
3.3.1. Field Site Description ................................................................................................................................... 32 3.3.2. Stormwater Runoff Results ......................................................................................................................... 33 3.3.3. Field-Scale Saturated Hydraulic Conductivity ......................................................................................... 34
3.4. ENGINEERING AND CONSTRUCTION COST ANALYSIS ................................................................... 36 3.5. REGULATORY ANALYSIS .......................................................................................................................... 37
GLOSSARY AND REFERENCES .................................................................................................................................. 42
3
EXECUTIVE SUMMARY
CONCEPT
To operate existing roadways and construct new ones, Departments of Transportation (DOTs) and other transportation
agencies must meet increasingly stringent regulations for stormwater runoff. For example, to satisfy Chesapeake Bay
water quality standards for nutrients and sediment, Maryland State Highway Administration must reduce their emission
of nitrogen, phosphorus, and sediment by 75% by 2020. Achieving this milestone is estimated to cost in excess of $720
million using standard technologies, assuming $144k to treat one impervious acre and > 5000 acres to treat. Other states
with roadways contributing to the Chesapeake Bay (DE, DC, NY, PA, VA, and WVA) must meet similar reduction
goals. In other regions of the country, DOTs must satisfy increasingly stringent stormwater regulations for metals,
bacteria, and other pollutants.
In this study the reduction of nutrient loading and stormwater runoff volume by biochar amendment to the soils of
highway greenways was examined. Biochar is a charcoal-like material formed by combusting waste organic matter in an
oxygen-limited environment and has high internal porosity and low particle density. Therefore, amending biochar to
highways soils is expected to increase total porosity and water retention. Because biochar particles are often large and
may enhance soil aggregation, biochar amendment may also increase soil hydraulic conductivity. Finally, based on other
recently published findings, biochar amendment is expected to enhance sorption and transformation of nitrogen
compounds. The objective of this Type 1 project was to test these hypotheses in controlled lab and pilot-scale
experiments. While the focus of this work is on treatment of nitrogen and sediments in stormwater runoff, because
biochar amendment reduces volume of stormwater runoff, it will also reduce loadings of other pollutants found in
stormwater to surface water bodies.
METHODOLOGY AND FINDINGS
Lab-Scale Experiments After screening several commercially available biochars, Soil Reef™ biochar (The Biochar
Company, Berwyn, PA, USA) was selected. This biochar was amended to three representative soils in the MidAtlantic
region: silt loam, sandy loam, and loamy sand. Biochar amended at 2 or 6% mass fraction to these soils increased
available water content, a measure of a soil’s ability to retain water, by 20-70% depending on the soil. Lab-scale tests
also demonstrated that biochar amendment almost always increased unsaturated hydraulic conductivity, up to 500% for
loamy sand. However, the impact of biochar amendment on saturated hydraulic conductivity was less significant, with
conductivity only increasing by 20% with biochar amendment to loamy sand. These changes in soil hydraulic properties
suggest that biochar amendment to a roadway soil may result in reductions in stormwater runoff, but will depend on the
roadway soil and amount of biochar added.
Pilot-Scale Experiments To evaluate if biochar-induced changes in soil hydraulic properties determined in lab-scale
experiments might reduce stormwater runoff, four 0.6 × 0.3 × 0.3 m (length × width × depth) greenways were
constructed in the laboratory: two filled with sandy loam soil and two filled with the mixture of sandy loam and 4%
biochar by mass. These experiments captured the three-dimensional water flow that will occur in the field with biochar-
amended roadway soils, but allow more controlled evaluation of stormwater flow and nutrient transformation. Consistent
4
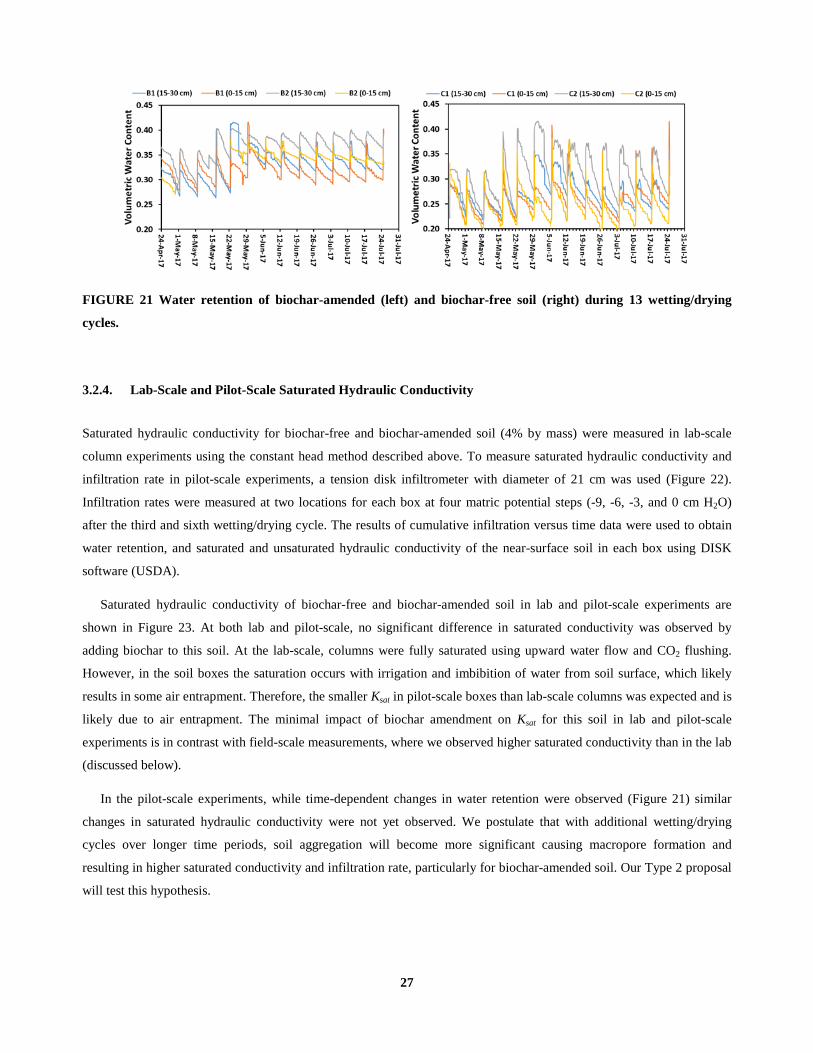
with lab-scale experiments, biochar amendment increased water retention and saturated hydraulic conductivity. These
effects reduced stormwater runoff by 13% with respect to biochar-free soil, consistent with what was expected from lab-
scale experiments. While data for stormwater runoff reduction were limited to one storm event, data collected over
multiple wetting and drying cycles showed gradually increasing soil water retention, particularly in biochar-amended test
cells. These data suggest time-dependent formation of soil aggregates that will enhance the soil’s ability to retain and
treat stormwater as biochar and soil age.
Field-Scale Experiments With support from the National Fish and Wildlife Foundation (NFWF), Delaware
Department of Transportation, Maryland Transportation Authority, and City of Charlottesville, VA, biochar was
amended at 4% to a sandy loam in a roadway filter strip along a four-lane divided highway in Delaware. Support from
this Type 1 IDEA project was used to conduct lab and field measurements in support of the NFWF project. Over 74
storm events in 2016/2017, biochar amendment reduced average stormwater runoff volume and peak flow rate by 84 and
77%, respectively. In comparison, tillage alone of biochar-free soil reduced average stormwater runoff volume and peak
flow rate by 54 and 51%, respectively. Thus, biochar amendment increased the ability of the tilled roadway soil to
reduce stormwater runoff and peak flow rate by ~ 50%. This effect was 2 to 3 times more significant than what might be
expected from lab and pilot-scale experiments in this soil/biochar mixture. The reason for the greater stormwater
treatment in the field was macropores. Soil macropores in biochar-amended soils accounted for 84% of the flow under
saturated conditions. Time-dependent formation of soil aggregates by microbial processes is believed to be the cause of
macropore formation, which was enhanced by biochar.
In summary, biochar amendment to three representative roadway soils indicated that biochar amendment will improve
soil hydraulic properties. Experiments at the pilot and field scale demonstrate that these effects enhance stormwater
treatment, resulting in reductions in stormwater runoff volume and peak flow rate. Somewhat surprisingly, the benefits of
biochar amendment were most pronounced at the field scale, which was attributed to time-dependent formation of soil
aggregates that was not yet a significant process at the pilot scale. Future measurements in the pilot-scale experimental
devices are expected to document this. Future work should evaluate performance of other commercially available
biochars.
Cost Analysis Using costs determined from field-scale implementation, 0.12 acres of biochar-amendment is needed to
treat 1-acre impervious with approximately 83% removal of nutrients and sediments at a cost of ~ $31,700 per
impervious acre treated, a standard metric for assessing BMP performance. A cost analysis comparing biochar-
amendment to 23 BMPs, indicated that biochar is less expensive than 20 other BMPs – up to 10 times less. Biochar-
amendment is more expensive than only three BMPs: erosion and sediment control, street sweeping, and urban grass
buffers. However, utilization of these BMPs may be limited, for example, because of area of land needed and other
constraints like existing slope and buffer width available for urban grass buffers. While biochar costs are similar to an
urban grass buffer ($26,600 per impervious acre), biochar-amendment requires a dramatically smaller footprint: 0.12
versus 3.7 acre per impervious acre for biochar and urban grass buffer, respectively. Thus, while these less expensive
BMPs should be used where applicable, they are often insufficient to achieve necessary control of sediment and nutrients,
in which case biochar-amendment could be used.
5
Future work should examine the longevity of biochar amendment; the utility of using less biochar, e.g., 2%
application rate, to achieve the same benefit; and development of models to predict the effects of biochar amendment on
stormwater treatment for a wide range of applications.
1. IDEA PRODUCT
Stormwater discharge from roadways is a source of pollution for waterways that must be treated and controlled.
Increasing stormwater regulations on nutrient loads are compelling state DOTs to undertake stormwater restoration to
reduce nutrient loads and where possible stormwater volume. While existing stormwater technologies such as detention
ponds and new Low Impact Development features can remove nutrients, the required increase in load removal and runoff
volume reduction will be costly on a watershed-scale since more real estate is required for increased treatment using
current technologies. We propose an entirely new approach that has the potential to dramatically increase nutrient
removal efficiency and simultaneously reduce stormwater volume while avoiding new infrastructure – the addition of
engineered biochar to highway greenways. Rather than capture stormwater for treatment in new treatments systems,
existing highway greenways can be “enhanced” thus providing stormwater treatment without the cost of new
infrastructure or purchase of additional right-of-way. Further, this stormwater treatment is achieved using a waste
material, as biochars are often created from waste organic matter, e.g., sawdust.
2. CONCEPT AND INNOVATION
Biochar is a charcoal-like material formed by combusting waste organic matter in an oxygen-limited environment.
Biochars produced from almost all feedstocks have high internal porosity and low particle density. Therefore, adding
biochar to roadway soils would result in increased total porosity that promotes increased capture of stormwater, and
smaller soil bulk density that promotes deeper plant root growth and greater stormwater infiltration. Biochar amendment
also promotes soil aggregation and the formation of soil macropores, which will increase infiltration and stormwater
capture. In addition to these benefits to soil hydrology that should result in stormwater volume reduction, biochar has
high surface area, significant cation exchange and adsorption capacity, and a stable carbon structure consisting of
electroactive quinoid functional groups that serve as an efficient medium for electron transfer (wood biochars). These
properties we believe important for increasing nutrient sorption and denitrification rate. Thus, a properly selected biochar
amended to roadway soil is expected to increase stormwater capture, reduce stormwater runoff, and enhance retention
and transformation of nutrients. These properties may prove a critical benefit for highway greenways: holding nutrient-
laden water in the soil zone provides time for evapotranspiration, plant uptake, and microbial degradation of nutrients,
while simultaneously reducing stormwater runoff volume.
It is also important to note that biochar amendment is expected to enhance the removal of other pollutants from
stormwater runoff, including bacteria and metals, because of two factors: reduction in stormwater runoff volume that is
reported in this study, and pollutant sorption. Thus, while the focus in this study was reduction of stormwater nutrient
loads, biochar amendment will be beneficial to treatment of other stormwater pollutants.
6
3. INVESTIGATION
This project developed and demonstrated the application of a wood biochar (Soil ReefTM) to roadway soils for increasing
stormwater retention and infiltration, and reducing stormwater runoff at three experimental scales: lab, pilot, and field.
The influence of scale on biochar amendment was assessed by comparing data from these different scales.
3.1. INFLUENCE OF BIOCHAR ON STORMWATER RETENTION AND INFILTRATION – LAB SCALE
3.1.1. Biochar and Soil Samples
Commercially available Soil Reef™ biochar (The Biochar Company, Berwyn, PA, USA) was selected in this study based
upon preliminary screening of commercially available biochars. Future work should examine other biochars and provide
guidance for biochar selection based upon readily-measured biochar properties.
Soil Reef™ biochar is produced from carbonized Southern Yellow Pine by continuous pyrolysis at 550 °C for 10 min.
This biochar has high specific surface area (350 ± 30 m2 g-1) and internal porosity (0.83 ± 0.01 mL g-1), and thus should
have a significant effect on water retention and hydraulic conductivity. Because biochar properties may change after soil
amendment due to leaching of readily soluble compounds, biochar was pre-rinsed before use in laboratory experiments.
Biochar was added to de-ionized (DI) water at 1:50 ratio by mass (biochar to DI water), and the solution agitated at 50
rpm for 1 day. The rinsate was replaced with fresh DI water and the process repeated at least three times until the
electrical conductivity of the rinsate was less than 100 µS cm-1. Rinsing biochar removed hydrophobic coatings on
biochar surfaces that influence soil wettability (1) and aged the biochar, making it more representative for field
conditions. The rinsed biochar was oven-dried at 105 °C for 24 h and then cooled to room temperature.
Natural soils were selected based on the United States Department of Agriculture (USDA) soil classification to have
soil textures that span those found in the MidAtlantic region: silt loam, sandy loam, and loamy sand. These soil types are
typical for many vegetated filter strips in the Coastal Plain region of the east coast (2). The loamy sand and silt loam were
collected from 0 to 10 cm depth at the University of Delaware Farm Land at Newark, DE: 39°40'20.2"N 75°44'32.5"W
and 39°40'11.5"N 75°45'07.9"W for loamy sand and silt loam, respectively. In order to have more diverse range of
particle sizes between soil samples, small amounts of silt and clay were removed from the loamy sand sample using a
sieve with 0.075 mm opening. The sandy loam was collected from 0 to 30 cm depth along Delaware State Route 896
located at Middletown, DE (39°31'52.0"N 75°44'12.8"W), which is the location of the field site where biochar was
amended to a roadway soil (discussed below). All soils were oven-dried, crushed using a mortar and rubber-tipped pestle,
sieved to less than 2 mm size, and stored at room temperature before use. In addition to these three natural soils, a
uniform engineered sand (30/40 Accusand, Unimin Co., Le Sueur, MN, USA) was also used. This Accusand was further
7
sieved to a more uniform particle size (0.5-0.59 mm) using #30 and #35 sieves, then rinsed with DI water and finally
oven-dried at 105 °C for 24 h.
Rinsed and unsieved biochar was added to natural soils at 2% and 6% (by mass). These application rates were
selected based on minimum and maximum possible large-scale application rates. In addition, in order to better understand
the mechanisms by which biochar alters soil hydraulic properties, biochar was sieved to different particle sizes: large (2-
4.75 mm), medium (0.5-0.59 mm), and small (<0.075 mm). These biochar sizes were rinsed following the above-
mentioned procedure, oven dried, and re-sieved. These different biochar sizes along with unsieved biochar were added to
the uniform Accusand at 6% by mass. Photographs of soil and biochar samples are presented in Figure 1.
FIGURE 1 Photograph of soil and biochar samples used in experiments: (A) Accusand, (B) silt loam, (C) sandy
loam, (D) loamy sand, (E) small biochar, (F) medium biochar, (G) large biochar, and (H) unsieved biochar.
3.1.2. Particle Size Distribution
Sieve and hydrometer analyses were used to determine particle size distributions (PSD) of soil and biochar samples. The
distribution of particles larger than 0.075 mm was determined by sieving, while the distribution of particles smaller than
0.075 mm was determined by a sedimentation using a hydrometer (3). All samples were oven-dried at 105 °C for 24 h
before testing. A 500 g subsample of soils and a 200 g subsample of biochar were used for sieve analyses. Samples were
wet sieved through 0.075 mm sieve. The coarse fraction retained on the 0.075 mm sieve was then oven-dried at 105 °C
for 24 h, weighed, and then dry sieved using a wide range of sieve sizes. For hydrometer tests, 50-100 g of sample (either
biochar or soil) were used. Hydrometer tests were performed according to ASTM D422-63, using 152-H hydrometer (3).
Data from sieve analyses and hydrometer tests for each sample were combined to produce a single PSD.
8
The PSDs quantify the impact of biochar amendment on soil texture. PSD’s of the three soil types and biochar (before
and after rinsing) are shown in Figure 2. Rinsing the biochar in DI water changed the PSD of biochar: particles were
weathered and stabilized, resulting in the breakup of very large particles. Because biochar particles can physically
disintegrate, biochar particle size is not a static property and can change over time and as a function of environmental
conditions (4). Soil Reef™ biochar has larger particle sizes than the three natural soils. This suggests that biochar-
amended soil will create larger pores than the unamended soil, resulting in increased hydraulic conductivity.
FIGURE 2 Particle size distribution of (A) natural soil and unsieved biochar (before and after rinsing), and (B)
Accusand and different sieved biochar particle sizes.
3.1.3. Particle Density, Bulk Density, Porosity and Surface Area
The particle density for all soils was measured using the pycnometer method (5). Biochar is a very porous material with
internal pores ranging from nanometer to micrometer (6). To characterize these pores and biochar density, mercury
intrusion porosimetry (Micrometrics Analytical Services, Norcross, GA, USA) and N2 and CO2 sorption measurements
were performed on unsieved biochar to determine internal biochar pore size distribution and specific surface area (7, 8).
These data were used to determine biochar envelope and skeletal density. Biochar envelope density is mass of solid
divided by the sum of solid and internal biochar pore volume, and biochar skeletal density is the mass of solid divided by
the solid or skeletal volume. These parameters are needed to estimate the influence of biochar amendment on porosity
and water retention of biochar/soil mixtures. Using these measurements, the average particle density of any biochar/soil
mixture was calculated
𝝆𝝆𝒑𝒑 = 𝟏𝟏𝟏𝟏𝟏𝟏% 𝒃𝒃𝒃𝒃𝒃𝒃𝒃𝒃𝒃𝒃𝒃𝒃𝒃𝒃𝒃𝒃𝒃𝒃𝒃𝒃𝒃𝒃𝒃𝒃𝒃𝒃𝒃𝒃 𝝆𝝆𝒑𝒑
+% 𝒔𝒔𝒃𝒃𝒃𝒃𝒔𝒔𝒔𝒔𝒃𝒃𝒃𝒃𝒔𝒔 𝝆𝝆𝒑𝒑
(1)
where % biochar and % soil are mass percentages, and ρp is particle density (soil) or skeletal density (biochar) (g cm-3).
To determine dry bulk density, the oven dried soils or soil mixtures were gently repacked into a soil column (250 mL,
inner diameter 80 mm, height 50 mm). To eliminate any voids and gaps, the cores were lightly tapped 50 times on the
table during the packing. Excess particles were carefully removed using a margin trowel, and samples were weighed to 9
obtain dry solid mass. The dry bulk density is calculated by dividing total solid mass by total volume. The average
particle density and the dry bulk density of all mixtures were used to obtain the total porosity (n) of the sample mixtures.
𝒏𝒏 = 𝟏𝟏 − 𝝆𝝆𝒃𝒃𝝆𝝆𝒑𝒑
(2)
where ρb is dry bulk density density (g cm-3). If instead the biochar envelope density is used in equation (2), the porosity
is the inter porosity (pores between individual biochar particles). The difference between total and inter porosity is intra
porosity (pores inside biochar particles).
Soil Reef Biochar’s specific surface area, envelope and skeletal density were determined to be 438.6 ± 1.1 m2 g-1,
0.524 ± 0.009 and 1.23 ± 0.12 g cm-3, respectively. The internal pores of this biochar range from 0.83 nm to 4.13 μm
(Figure 3), and the total internal pore volume is 1.092 ± 0.010 cm3 g-1. The biochar is less dense than natural soil (~2.65 g
cm-3). Therefore, according to equation (1) adding biochar to soil will decrease the average particle density of soil-
biochar mixtures. Furthermore, the incorporation of biochar will lower the dry bulk density, due to increasing total soil
pore volume and/or lowering average particle density (9).
FIGURE 3 Internal pore size distribution of Soil ReefTM biochar determined from mercury porosimetry.
The dry bulk density and porosity of soil and soil/biochar mixtures tested in this work are shown in Figures 4 and 5,
respectively. Amending the three soils with biochar at 2 or 6% decreased dry bulk density for all soils, which enhances
plant root growth. Total porosities of each soil also increased, which should result in increased stormwater retention. For
silt loam, for example, dry bulk density decreased by 5.9 and 16.9% and the total porosity increased by 4.6 and 13.7%,
respectively, when 2 or 6% biochar was amended. Similar changes were found for sandy loam and loamy sand (see
Figures 4 and 5). The increase in total porosity with biochar amendment is due primarily to the additional pore volume
inside biochar particles – intra porosity (Figure 5).
10
FIGURE 4 Bulk density of natural soils and their mixture with unsieved biochar (% values are biochar mass
fraction in the samples).
FIGURE 5 Total porosity, inter porosity, and intra porosity (pore volume within particles) of natural soils and
their mixture with unsieved biochar (% values are biochar mass fraction in the samples).
11
3.1.4. Water Retention – Dry Region
Retention of water for matric potentials between -104 to -107 cm H2O was measured for soil/biochar mixtures using a
WP4C water potential meter (Decagon Pullman, WA, USA, Figure 6). Samples were packed into small cups, and then DI
water added to the cups to saturate samples. These saturated samples were placed in an oven for different periods to
achieve a range of water contents. Then, samples were inserted into the WP4C where the total water potential was
measured based on the chilled mirror dew point technique. Finally, the matric potential for each sample water content
was determined by subtracting the osmotic potential, which was measured separately, from the total potential determined
with the WP4C.
FIGURE 6 Schematic of WP4C water potential meter for measuring water retention in dry region (taken from
Decagon, Inc., WP4C operation manual).
The gravimetric water content (mass of water/ dry mass of solid) is shown in Figure 7 as a function of matric potential
for all biochars tested. Significant water is retained by biochar even when matric potentials are small, which is attributed
to the water held in small micro and nano pores and/or sorption to biochar surface (10). Because data for different size
fractions of biochar overlap, the internal micro and nano pore space as well as biochar surface area are independent of
particle size. Similar water retention data for the three natural soils and Accusand are shown in Figure 8. Biochar holds
significantly more water than natural soil and Accusand at high matric potentials, which corresponds to the data range
shown in Figure 8. Soils with smaller particle size distribution and therefore higher surface area (e.g., silt loam versus
loamy sand) exhibited higher water retention.
12
FIGURE 7 Water retention of different biochar particle sizes in the dry region (h = -104 to -107 cm H2O).
FIGURE 8 Comparison of water retention for biochar, natural soils, and Accusand in the dry region (h = -104 to -
107 cm H2O).
The data shown in Figure 8 suggest that if biochar is mixed with soil, biochar-amended soil will retain significantly
more water than soil without biochar. Water retained in soil amended with 2 or 6% biochar for all three natural soils
tested is shown in Figure 9. Biochar amendment increased water retention for all soils, with the most dramatic increase
shown for 6% biochar amendment to loamy sand.
While it is possible to experimentally measure the increase in water retention for any particular soil/biochar mixture,
if models can predict this behavior then engineers and policy makers can screen different soil/biochar mixtures and
13
estimate how much biochar is required to achieve a desired increase in water retention. For water retention in the dry
region, a simple model based upon the water retention behavior of the biochar and soil measured independently can be
used to estimate the water retained in a soil/biochar mixture of specified biochar content:
Cost data doe (1) taken from Costs of Stormwater Management Practices in Maryland Counties (King and Hogan, 2011) and corrected for inflation to 2017 dollarsSource of information for (2) and (3) - US Inflation Calculator. http://www.usinflationcalculator.com/
Summary Unit Planning Level Stormwater Cost Estimates Per Impervious Acre Treated (Revised 2017) (1)
37
For many communities throughout the nation, the NPDES Municipal Separate Storm Sewer System (MS4) permit and
TMDL program have become major operational programs with additional tax burden. For many older communities that
are already dealing with crumbling and aging infrastructure, the additional cost of meeting new and unfinanced
stormwater treatment regulations is quite significant. Under the NPDES and TMDL programs, many communities seek
BMPs that are cost effective and provide low operational and maintenance costs. Within the NPDES program, depending
on permit conditions communities must reduce runoff from their impervious areas anywhere from 10% to 20%, either
through runoff infiltration or storage (quantity control). For other communities like those in the Chesapeake Bay
watershed, they also have the added burden on achieving water quality targets through a variety of specialized BMPs
focused on treating water (quality control) from all sources, including urban and agriculture.
The potential economic impact and financial cost for NPDES/TMDL implementation, operation and maintenance has
not been lost on businesses, the general tax paying public, and many levels of government, including transportation
agenices. For transportation departments and authorities, the challenges to achieve greater quantity and quality treatment
of stormwater runoff are complex and pronounced. These challenges include
• confined and limited right-of-way;
• high percentage of impervious surface to treat;
• older legacy systems lacking stormwater management and requiring retrofitting to meet new standards;
• complex engineering to balance between safety and long term environmental requirements;
• property acquisition for new stormwater treatment technologies, which may be complex and expensive;
• complex and time consuming environmental studies (NEPA), compliance and permitting; and
• influences of land use and drainage beyond right-of-way.
To meet NPDES regulations for stormwater and the TMDL regulations for nutrients, sediment, bacteria and in some
cases heavy metals, cost effective, innovative and simple-to-implement-and-maintain designs are necessary. More
importantly, a solution that can be completed within most transportation agencies limited right-of-ways while having
limited impact on traffic and minimal to no permitting is critical.
Current technologies involve the development of “green” infrastructure and Environmental Site Design (ESD). The
objective of these systems is to mimic natural hydrologic runoff characteristics (groundwater recharge and surface flow)
as closely as possible while simultaneously maximizing disconnected impervious areas. It is generally envisioned that
much of this would be accomplished by using numerous small-scale, nonstructural stormwater best management
practices (BMPs) to reduce nutrient loading and runoff control.
While current “green” technologies are a step in the right direction and may be applicable in many situations, the
findings of the research presented in this report demonstrates that an enormous opportunity is being overlooked – the
modification of existing highway greenways using biochar. Based on the research results, implementation using a broad-
scale soil restoration BMP method would significantly improve infiltration, water retention and nutrient removal through
the inclusion of recalcitrant carbon (biochar). This approach would take advantage of the under-utilized “green” real
estate often owned and maintained by most transportation agencies. It is possible that NPDES/TMDL permit
38
requirements could be met using this method thereby considerably reducing design, installation and operation and
maintenance costs, both present and future.
Demonstrating the significance of the research presented here is the December 2016 report by the Chesapeake Bay
Program, “Recommendations of the Expert Panel to Define Removal Rates for Disconnecting Runoff from Impervious
Areas onto Amended Soils or Treatment in the Stormwater Conveyance System”. The purpose of the modified/enhanced
soils protocol developed by this expert panel is to direct stormwater runoff from impervious cover of existing
development to an acceptable area of pervious cover where it may be effectively infiltrated and stored. The protocols
represent an entirely new set of practices for treating urban runoff that involves changing the existing hydrologic
properties (Hydrologic Soil Group (HSG) shifting) of the soils receiving and generating runoff. The panel sees soil
modifications as needed because most urban soils have likely lost their original capacity to infiltrate runoff due to the
mass grading and engineered soil compaction that has historically accompanied land development.
While the NPDES/MS4 and TMDL implementation programs nationwide are complex and expensive, there is nothing
preventing the use of broad-scale soil restoration techniques or the utilization of biochar as an amendment or in
combination with other amendments. Soil restoration is considered an acceptable BMP for the NPDES program. For the
TMDL program in the Chesapeake Bay region, soil restoration using compost has been accepted as a BMP measure as
outlined in the December 2016 expert panel document mentioned above. Biochar use and crediting in place of or in
combination with compost has not been directly approved. However, biochar has entered the conversation of many
agencies including the US EPA for its potential for soil restoration and as an amendment in engineered soil media for use
in other approved BMPs. It is highly likely that detailed lab and field measurements of the biochar-amended roadway
soils would be accepted by the regulatory agencies for crediting to the TMDL or NPDES program. For the rest of the
nation outside of the Chesapeake Bay watershed, there are no road blocks to begin to apply the findings of this research
to highway greenways as part of any NPDES program.
4. PLANS FOR IMPLEMENTATION
As described above, through support from the National Fish and Wildlife Foundation (NFWF), Delaware Department of
Transportation, Maryland Transportation Authority, and City of Charlottesville, VA, the project team initiated a field-
scale test site of biochar amendment of roadway soil along Rt. 896 in Delaware in December/January 2016. While not a
large implementation, this site is of sufficient size to evaluate the performance of biochar amendent on reduction of
stormwater runoff in the field. The results from 1.5 years of testing are presented above and demonstrate that biochar
amendment at 4% (mass content) may reduce stormwater runoff by 83% - using a treatment area 8.3 times smaller than
the contributing impervious roadway. Cost of biochar application is approximately $31,700 per impervious acre treated, a
standard metric for assessing BMP performance, making it one of most cost effective BMP options that has the additional
benefit of using existing transportation agency right-of-way. Purchase of additional land for stormwater treatment with
this BMP is not needed.
39
Given our results both in the lab and from this field site, the following steps are planned to advance implementation of
biochar amendment to roadway soils:
• Publish results in peer-reviewed journals and present them to USEPA and other governmental bodies. We have
started this process, and in 2016 and 2017 have made technical presentations to USEPA Region 3, Delaware
Department of Transportation, Delaware Department of Natural Resources and Environmental Control,
Maryland Transportation Authority, and at the 8th Annual Chesapeake Bay Stormwater Retreat (invited
presentation). We were recently invited to present our results at the 2018 Annual TRB Annual Meeting. Results
should also be presented at webinars for transportation agencies.
• Continue field-scale study. We are seeking additional financial support to continue the study at our existing field
site for at least 2-3 years. Such data will allow us to answer the question, “How frequently must biochar be
replaced?” We postulate that biochar will last for long periods and that this BMP will require minimal
maintenance. This new field work will address questions about required maintenance and service life of biochar
amendment, as well as quantify biochar impact on first-flush of pollutants.
• Because formation of macropores appears to be key with biochar amendment, additional lab and field
measurements should be made to understand and quantify this process.
• Since there are many commercial bicohars produced locally across the US, it is important to quantify the actual
biochar properties that cause the increased water retention, macropore formation, and water infiltration. Once
these properties are determined, different biochars can be tested based upon these readily-measured properties.
This task will require careful laboratory experiments with a number of different biochars.
• Conduct side-by-side tests with competing soil amendments, e.g., compost, which also has been suggested as an
amendment that would improve soil hydrology.
• Scale-up field test 10-fold and apply biochar to other, more challenging locations. We are seeking additional
financial support for work at a new field sites that will include sections of roadway on the I-95 corridor.
Demonstrating that biochar amendment will be beneficial in other roadway soils at the field scale is important.
These new tests should also quantify the effect of soil fertilization and plant residues from roadway maintenance
activities on biochar performance.
• Conduct field tests for conditions with brackish water and freeze/thaw cycles.
• After successful completion of field trials, develop specifications, guidelines, and marketing plans for biochar
amendment.
• Engage the regulatory community and other stake holders, presenting data from our work and advocating for
any additional work needed to allow full-scale implementation. We will meet with Chesapeake Stormwater
Network in August 2017, and will continue to seek audience with stake holders and regulators.
• The project team will host the US Biochar Initiative's 2018 Symposium in Wilmington, DE, August 20-23,
2018. This national conference will bring together 300-400 attendees including engineers, remediation
specialists, restoration scientists, DOTs, biochar producers and users, entrepreneurs, research and development
scientists, students, policy and regulatory agencies, investors, waste managers, and biomass and renewable
energy industry professionals.
40
5. CONCLUSIONS
Biochar amendment to roadway soils and its ability to treat stormwater runoff was studied. Commercially available Soil
Reef™ biochar (The Biochar Company in Berwyn, PA, USA) was selected because of its expected beneficial properties
on soil hydraulics and nutrient retention and transformation, and this biochar was amended to three representative soils in
lab-scale experiments. These experiments demonstrated that biochar amendment (2-6% mass fraction) increased
available water content, a measure of a soil’s ability to retain water, by 20-70%, depending on soil. Thus, biochar
amendment is expected to enhance retention of stormwater in soil, reducing stormwater runoff. Further, lab-scale tests
showed that biochar amendment almost always increased unsaturated hydraulic conductivity, up to 500% for loamy sand.
However, the impact on saturated hydraulic conductivity was less significant, with biochar amendment only increasing
conductivity when amended to loamy sand and there by ~ 20%.
Biochar was amended to sandy loam in pilot-scale experiments at 4% application rate. Consistent with lab-scale
experiments, biochar amendment did not cause a significant increase in saturated hydraulic conductivity. However,
biochar increased water retention which when coupled with other effects reduced stormwater runoff by 13% with respect
to biochar-free soil, consistent with what might be expected from lab-scale measurements. Pilot-scale data indicated slow
changes in soil structure, which gradually increased soil water retention through wetting/drying periods. These data
suggest time-dependent formation of soil aggregates that will enhance the soil’s ability to retain and treat stormwater as
biochar and soil age.
With support from the National Fish and Wildlife Foundation (NFWF), biochar was amended at 4% to a sandy loam
in a roadway filter strip along a four-lane divided highway in Delaware. Over 74 storm events in 2016/2017, biochar
amendment resulted in an average reduction of stormwater runoff volume and peak flow rate by 84 and 77%,
respectively. In comparison, tillage alone without biochar amendment reduced stormwater runoff volume by an average
of 54% and peak runoff flow rate by 51%. Thus, biochar amendment increased the ability of the tilled roadway soil to
reduce stormwater runoff volume and peak flow rate by ~ 50%. This is 2 to 3 times more significant than what might be
expected from lab and pilot-scale experiments. Field measurements of soil hydraulic properties indicated that the reason
for the greater stormwater treatment in biochar-amended soils in the field was the formation of soil macropores. Time-
dependent formation of soil aggregates by microbial processes is believed to be the cause of soil macropore formation.
In summary, biochar amendment to three representative roadway soils indicated that biochar amendment will have
beneficial effects on soil hydraulic properties. Experiments at the pilot and field scale demonstrate that these effects
enhance stormwater treatment, resulting in reductions in stormwater runoff volume and peak flow rate. Somewhat
surprisingly, the benefits of biochar amendment were most pronounced at the field scale, which was attributed to time-
dependent formation of soil aggregates that was not yet a significant process at the pilot scale. Using costs determined
from field-scale implementation, 0.12 acres of biochar-amendment is needed to treat 1-acre impervious with
approximately 83% removal of nutrients and sediments at a cost of ~ $31,700 per impervious acre treated. While these
costs are similar to an urban grass buffer ($26,600 per impervious acre), biochar-amendment requires a dramatically
smaller footprint: 0.12 versus 3.7 acre per impervious acre for biochar and urban grass buffer, respectively. Thus, biochar
amendment is possible in many roadway soils and open spaces where urban grass buffers are not. Future work should
41
examine the longevity of biochar amendment; the utility of using less biochar, e.g., 2% application rate, to achieve the
same benefit; and development of models to predict the effects of biochar amendment on stormwater treatment for a wide
range of applications.
6. INVESTIGATOR PROFILE
Dr. Paul Imhoff is a Professor in the Department of Civil and Environmental Engineering at the University of Delaware,
Newark, DE, USA. Dr. Imhoff has BS, MS, and PhD degrees in Civil and Environmental Engineering, from the Univ. of
Cincinnati, Univ. of Wisconsin-Madison, and Princeton Univ., respectively. Dr. Imhoff is a recipient of the National
Science Foundation Career Award. Dr. Imhoff’s teaching and research interests focus on the movement of fluids and
mass transfer processes in porous media, with a particular emphasis on model development and application. In the last
five years he has employed laboratory and field techniques to understand the influence of biochar soil amendment on soil
hydraulic properties, phosphorus leaching, and the retention and transformation of nitrogen compounds. Dr. Imhoff's
research is supported by the National Science Foundation (NSF), National Fish and Wildlife Foundation
(NFWF/USEPA), Department of Energy (DOE), California Department of Resources Recycling and Recovery,
Environmental Research and Education Foundation (EREF), and the Delaware Department of Transportation (DelDOT).
Mr. Hegberg, from the inception Chesapeake Bay Restoration Program in 1987, has been involved in a breadth of
ecological restoration and water resources related projects. His experience has given him the opportunity to participate on
projects that have spanned the entire life cycle (planning/design/construction/monitoring) using various delivery methods
(traditional, design/build, full delivery). Over the years, Mr. Hegberg has developed a strong reputation for being a
visionary entrepreneurial leader working to bring innovative market-based solutions to some of the most complex
environmental and community redevelopment projects. Part of this vision has been in real world applications of broad
scale soil restoration techniques that more naturally mimic natural hydrologic process through subsoiling, microbial
inoculation, biochar and other soil amendments. Currently, he is actively involved in the development of the next
generation of smart enhanced BMPs through a number pilot projects and Research & Development BMPs studies using
recalcitrant carbon (biochar) as an enhanced media and/or soil amendment to improve BMP efficiencies and restoration
of disturbed restoration in partnership with the University of Delaware. Mr. Hegberg is also involved in the development
of Waste2Energy gasification projects in the United States and Internationally with a goal of producing commercial
volumes of biochar for restoration and remediation.
GLOSSARY AND REFERENCES
(1) Yi, Susan, Brandon Witt, Pei Chiu, Mingxin Guo, and Paul Imhoff. "The origin and reversible nature of poultry
(18) King, Dennis, and Patrick Hagan. "Costs of stormwater management practices in Maryland counties." Prepared
for Maryland Department of the Environment Science Services Administration. Reference Number UMCES CBL (2011):
11-043.
44
APPENDIX
45
NCHRP Program Committee: William van Peeters, Federal Highway Administration; Marcel Tchaou, Federal Highway Administration Office of Project Development & Environmental Review; Peter Mattejat, Maryland Transportation Authority; and Charles Hegberg, reGENESIS Consulting Services, LLC August, 2017 Project Number: NCHRP-182 Start Date: August 6, 2015 Completion Date: August 5, 2017 Product Category: NCHRP Highway IDEA Principal Investigator: Paul T. Imhoff, Professor Department of Civil and Environmental Engineering E-Mail: [email protected] Phone: 302-831-0541 TITLE: Reducing Stormwater Runoff and Pollutants with Biochar Biochar was amended to roadway soils and evaluated for its ability to reduce stormwater and pollutant runoff. WHAT WAS THE NEED? To operate existing roadways and construct new ones, Departments of Transportation (DOTs) and other transportation agencies must meet increasingly stringent regulations for stormwater runoff. While existing stormwater best management practices (BMPs) are effective for removing many pollutants, they are costly and usually require the purchase of additional real estate. DOTs might achieve significant treatment by altering the properties of roadway soils, which would reduce costs and the need to purchase additional land for stormwater treatment. WHAT WAS THE GOAL? The objective was to reduce nutrient loading and stormwater runoff volume by biochar amendment to roadway soils. Biochar is a charcoal-like material formed by combusting waste organic matter in an oxygen-limited environment and has high internal porosity and low particle density. Therefore, amending biochar to highways soils is expected to increase total porosity and water retention. Because biochar particles are often large and may enhance soil aggregation, biochar amendment may also increase soil hydraulic conductivity. Biochar amendment is also expected to enhance sorption and transformation of nitrogen compounds. These hypotheses were tested in controlled experiments. While the focus of this work was on treatment of nitrogen and sediments in stormwater runoff, because biochar amendment reduces volume of stormwater runoff, it will also reduce loadings of other stormwater pollutants to surface water bodies. WHAT DID WE DO? • Lab-scale experiments evaluated the influence of biochar amendment on the hydraulic properties
of three representative soils from the MidAtlantic region: silt loam, sandy loam, and loamy sand. Porosity, dry bulk density, water retention, and unsaturated and saturated hydraulic conductivity were measured for biochar amendment of 2 and 6% by mass.
• Pilot-scale experiments were completed in four, 0.6 × 0.3 × 0.3 m (length × width × depth) greenways conducted in the laboratory: two filled with sandy loam soil and two filled with the mixture of sandy loam and 4% biochar by mass. Experiments captured the three-dimensional water flow that will occur in the field with biochar-amended roadway soils, but allowed more controlled evaluation of stormwater flow and nutrient transformation.
• Field-scale experiments were conducted with support from the National Fish and Wildlife Foundation, Delaware Department of Transportation, Maryland Transportation Authority, and City of Charlottesville, VA. Biochar was amended at 4% mass fraction to a sandy loam in a roadway filter strip along a four-lane divided highway in Delaware, and reductions in stormwater runoff were quantified for 74 storm events in 2016/2017.
• Using data from the field-scale implementation, costs for biochar amendment to achieve specified stormwater treatment objectives were estimated and compared to other traditional BMPs.
WHAT WAS THE OUTCOME? Biochar amendment improved hydraulic properties of all amended soils. Because of biochar’s influence on soil hydraulics, biochar amendment reduced stormwater runoff volume and peak flow rate by 84 and 77%, respectively, over 74 storm events in 2016/2017. At this field site, 0.12 acres of biochar-amendment was needed to treat 1-acre impervious with approximately 83% removal of nutrients and sediments at a cost of ~ $31,700 per impervious acre treated. While these costs are similar to an urban grass buffer, biochar-amendment required a dramatically smaller footprint: 0.12 versus 3.7 acre per impervious acre for biochar and urban grass buffer, respectively. Results were disseminated to state agencies in Delaware and Maryland, Chesapeake Bay stormwater practitioners, and USEPA Region 3. New support is sought for longer duration field tests (2-3 years) and applications with smaller quantities of biochar, which would reduce implementation costs. WHAT WAS THE BENEFIT? Bicohar amendment of roadway soils dramatically reduced stormwater runoff volume and peak flow rate, requiring only 0.12 acres of biochar-amended soil to treat 1-acre impervious roadway at ~$31,700 per impervious acre treated. Data suggest similar benefits might be achieved for different roadway soils in other locations. LEARN MORE Additional information can be found from the final report (insert link) or by contacting Paul T. Imhoff ([email protected]). IMAGES
Field site with biochar amendment Pilot-scale experimental cells