24
REDUCING TRANSPORT GHG EMISSIONS Opportunities and Costs PRELIMINARY FINDINGS
REDUCING TRANSPORT GHG
EMISSIONSOpportunities and Costs
Preliminary
Findings

The Cost and Efficiency of Reducing Transport GHG Emissions — Preliminary Findings — © OECD/ITF 2009 3
Preliminary Findings of the OECD/ITF Working Group on Transport GHG Emissions Reduction Strategies – Report to be released in 2010
Overview
Climate change poses two fundamental challenges for the transport sector: transport will have to significantly reduce greenhouse gas (GHG) emissions and it will require investment in order to adapt to impacts of climate change.
The scale and scope of emission reductions sought by policy makers are daunting but there is much that can still be achieved within the transport sector at low cost – especially against a background of high energy prices. Governments will deploy many policies simultaneously and can avoid unnecessary costs if transport sector GHG mitigation is planned on the basis of marginal abatement costs and focuses on the most cost‐effective actions. Success will depend on action across several fronts encompassing technology, fuels, and travel behaviour – regional circumstances will play an important role in determining the allocation of effort.
Industry will require clear, consistent and durable signals to guide low‐carbon innovation and households will require similar guidance regarding purchase decisions, travel and settlement patterns. Technological innovation has the potential to deliver larger emission reductions on a much faster track than changes in travel and settlement patterns.
Key Messages
1. Quantifying the benefits of GHG abatement is extremely difficult, given the uncertainty on the consequences of climate change, in particular where low‐probability catastrophic outcomes are concerned.
2. This makes setting the test for selecting options, in terms of a rate of return or a shadow price for carbon, problematic. There may be no better guide than contribution to a political economy‐wide mitigation target (e.g. a trajectory leading to 450 ppm CO2 in the atmosphere by 2100) but ranking mitigation measures according to cost‐effectiveness remains essential if resources are not to be wasted.
3. Although the largest overall cuts in GHG emissions are to be expected in the energy, residential and commercial buildings sectors, many mitigation measures in the transport sector are relatively low cost. Some of these save money in the long run, through fuel savings. Nevertheless the capital costs of many transport sector technological innovations are likely to be high and this is a barrier to commercialisation given the evidence that upfront costs have a disproportional impact on decisions regarding energy‐efficiency.
4. Fuel efficiency standards accompanied by appropriate fuel taxes are a key instrument for addressing this barrier. Long‐term targets can create the certainty that vehicle manufacturers need to make investments in new technologies, compensating for consumer risk aversion to paying for improved fuel economy as well as producer uncertainty on drivers’ willingness to pay for energy efficiency. The resulting changes in vehicle production and purchases have the potential to deliver the largest share of CO2 mitigation in the transport sector.
5. Fuel taxes have a fundamental impact on CO2 emissions, affecting both travel demand and the technologies deployed by vehicle manufacturers. Fuel excise duty rates therefore need to be

4 The Cost and Efficiency of Reducing Transport GHG Emissions — Preliminary Findings — © OECD/ITF 2009
consistent with climate change policy and coherent with measures introduced to mitigate emissions. This applies in particular to fuel economy standards, e.g. the shadow price for carbon implied by fuel taxes and standards should be broadly similar. Inconsistency makes it more difficult for manufacturers to meet standards and distorts their response.
6. Differentiated vehicle registration or purchase taxes and feebate schemes can further guide consumer demand for fuel efficient vehicles. Care must be taken to ensure that these schemes evolve as the composition of the vehicle fleet changes and that they are applied in such a way as to avoid fragmentation of vehicle markets, which would increase costs and weaken their impact. They also need to be coherent with other incentives differentiated according to vehicle emissions, such as consumer labelling schemes.
7. Low carbon fuels will make a contribution to GHG emissions mitigation, albeit modest. Volumetric biofuel production quotas are an inefficient way to promote low‐carbon‐fuel switching and may not even deliver CO2 savings unless they are linked to effective sustainability criteria and fuel carbon standards. The use of fuel carbon standards can also help ensure that oil substitutes result in less, not more, lifecycle CO2 emissions.
8. Improvements in traditional and hybridised internal combustion engine technology will continue to deliver the greatest source of GHG reduction from vehicles in the short‐ to medium‐term. Electrification of mobility will play a growing role over the longer term though hurdles relating to battery costs, vehicle range and energy distribution will need to be overcome. Ultimately, the GHG impact of electric mobility will depend on the carbon intensity of electricity generation. Where coal intensive electricity production dominates, electric mobility will not reduce overall GHG emissions without commercial‐scale carbon capture and storage technology.
9. Better traffic management has the potential to deliver significant CO2 reductions, reducing the incidence of stop‐go traffic and discouraging excessive speed. Freeing capacity through traffic management will induce additional traffic in many circumstances but even when overall travel increases emissions may still be less than before if operating speeds are more efficient. A key point is to manage newly available capacity to lock‐in benefits from reduced congestion, through congestion pricing for example.
10. Mobility management initiatives, land‐use planning and promotion of high quality public transport can all help to reduce GHG emissions. These measures will deliver relatively less CO2 reduction over time as per‐kilometre CO2 emission rates decrease due to technical efficiency improvements. Nonetheless, many of these measures deliver important co‐benefits (e.g. air quality, noise, congestion) that should not be overlooked by transport authorities.
11. Fuels for international air and maritime transport are not taxed and international conventions have so far been seen as an obstacle to making carbon taxes or trading part of the approach to mitigating GHG emissions from these modes. ICAO and IMO were allocated responsibility for policies to reduce emissions from international aviation and shipping under the Kyoto Protocol. Action is still required but it is not clear that measures currently being proposed will deliver rapid or significant emission reductions – market‐based instruments such as a fuel levy or emissions trading are likely to be required though there is no consensus on this within either international body. Research indicates that emissions trading systems (or a fuel tax) are more cost effective than departure or ticket taxes so long as they are integrated with trading in other sectors.
12. In order to effectively tackle transport GHG emissions, governments need a robust evaluation and monitoring framework to guide their action. Evaluation and monitoring relies on adequate data: data collection and analysis merits additional resources in many administrations.

The Cost and Efficiency of Reducing Transport GHG Emissions — Preliminary Findings — © OECD/ITF 2009 5
Transport and Climate Change
Man‐made emissions of greenhouse gases – principally carbon dioxide (CO2) – have risen 70% from 29 Gt CO2eq in 1970 to 49 Gt CO2eq in 2004 – 25.8 Gt of which came from CO2 emissions from fossil fuel combustion. Atmospheric CO2 concentrations have increased from a pre‐industrial value of 280 parts per million (ppm) to 385 ppm in 2008 and are growing at an accelerated pace. The current level of CO2 concentration in the atmosphere significantly exceeds the natural range for the past 650 000 years (180‐300 ppm). The IPCC in its 4th Assessment Report finds that the accelerating warming trend observed since the mid‐20th century is very likely due to the increase in man‐made greenhouse gas concentrations.
Emissions are on track to double the concentration of GHG in the atmosphere by the end of the century (~660‐790 ppm CO2). The IPCC expects this to lead to a rise in average temperature of up to 6˚C resulting in significantly adverse impacts on water supply, eco‐systems, food production, land use in coastal areas and human health. Additionally, there is a possibility that such a change in GHG concentrations could trigger irreversible tipping points that would magnify the impact. Acting earlier to reduce emissions, rather than later, is expected to reduce the overall costs associated with climate change.
The IPCC recommends stabilisation of CO2 concentrations at ~450 ppm on the basis that this would have a good chance of limiting temperature rise to 2˚C, which would greatly limit impacts and damage. Current trends are far from this trajectory. In order to meet such an objective, the IPCC has suggested that a 50% reduction of GHG emissions from present levels by 2050 will be necessary.
Current pledges and actions proposed by both developed and developing countries are not sufficient to lead GHG emissions onto a 450 ppm stabilisation trajectory. Considering low and high estimates of the impact of these pledges as of August 2009, total emission reductions will fall 62% to 35% short of reaching a 450 ppm trajectory by 2020.
The cumulative impacts of the 2008 oil price spike and the 2008‐2009 recession have led to decreased GHG emissions as is illustrated in the by the figure below for the United States. Overall, global GHG emissions are forecast to drop by up to 10% year‐on‐year in 2010. If economic growth rates converge towards their previous levels and economic patterns of activity remain unchanged, this would translate into an 5%‐8% drop from business‐as‐usual emissions in 2020. However, there is speculation that long term structural patterns of trade may be impacted leading to a slightly lower GHG growth trajectory, especially for international maritime and air freight.

6 The Cost and Efficiency of Reducing Transport GHG Emissions — Preliminary Findings — © OECD/ITF 2009
Oil price, GDP and CO2 emissions in the USA 1990‐2010 (2009‐2010 data provisional)
0
50
100
150
200
250
300
350
400
45019
90
1991
1992
1993
1994
1995
1996
1997
1998
1999
2000
2001
2002
2003
2004
2005
2006
2007
2008
2009
2010
‐1,0%
2,0%2,1%1,5%
1,0%
3,5%
1,5%0,7%
1,1%
3,2%
‐1,7%
1,1%0,8%1,7%
0,2%
‐1,2%
1,4%
‐3,2%
‐5,9%
1,1%
Index 1990=100
Year‐on‐year change in CO2 emissions
GDP
Oil price
CO2 from fossil fuels
Source: US Energy Information Agency, 2009
Transport sector challenges
1. Transport is a significant and growing contributor to GHG emissions – emission reductions are required.
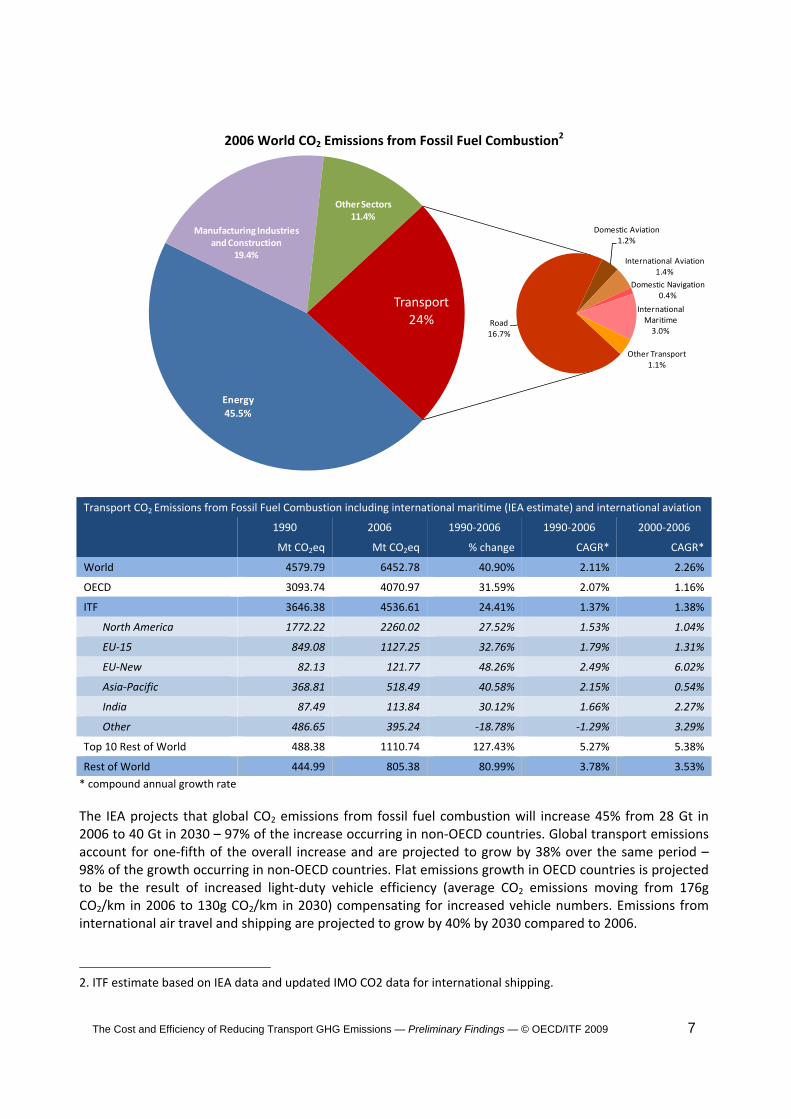
Transport is a significant contributor to overall GHG emissions. The sector as a whole accounted for approximately 13% of overall GHG emissions and 24% of CO2 emissions from fossil fuel combustion in 20061. On a well‐to‐wheel basis, the IEA estimates that transport accounts for nearly 27% of total CO2 emissions from fossil fuel combustion. Transport is the second largest CO2‐emitting sector after electricity production. In OECD and ITF countries, the shares of transport CO2 emissions are 30% and 26% respectively in 2006 – although some countries display very different shares. Road transport emissions account for two thirds of transport CO2 emissions. Much of the growth in emissions has been in step with GDP growth and the resultant increase in numbers of vehicles and international travel. The rate of transport emissions growth has accelerated globally from an annual average growth of 2.11% from 1990‐2000 to an annual average growth rate of 2.26% from 2000‐2006. This has largely been driven by non‐OECD countries as OECD transport CO2 emission growth rates have fallen in the past 6 years (1.16%) as compared to the period 1990‐2000 (2.07%).
1. ITF estimate based on IEA data and updated IMO CO2 data for international shipping.
The Cost and Efficiency of Reducing Transport GHG Emissions — Preliminary Findings — © OECD/ITF 2009 7
2006 World CO2 Emissions from Fossil Fuel Combustion2
Energy45.5%
Manufacturing Industries and Construction
19.4%
Other Sectors 11.4%
Road16.7%
Domestic Aviation1.2%
International Aviation1.4%
Domestic Navigation 0.4%
International Maritime3.0%
Other Transport1.1%
Transport24%
Transport CO2 Emissions from Fossil Fuel Combustion including international maritime (IEA estimate) and international aviation
1990 2006 1990‐2006 1990‐2006 2000‐2006
Mt CO2eq Mt CO2eq % change CAGR* CAGR*
World 4579.79 6452.78 40.90% 2.11% 2.26%
OECD 3093.74 4070.97 31.59% 2.07% 1.16%
ITF 3646.38 4536.61 24.41% 1.37% 1.38%
North America 1772.22 2260.02 27.52% 1.53% 1.04%
EU‐15 849.08 1127.25 32.76% 1.79% 1.31%
EU‐New 82.13 121.77 48.26% 2.49% 6.02%
Asia‐Pacific 368.81 518.49 40.58% 2.15% 0.54%
India 87.49 113.84 30.12% 1.66% 2.27%
Other 486.65 395.24 ‐18.78% ‐1.29% 3.29%
Top 10 Rest of World 488.38 1110.74 127.43% 5.27% 5.38%
Rest of World 444.99 805.38 80.99% 3.78% 3.53%
* compound annual growth rate
The IEA projects that global CO2 emissions from fossil fuel combustion will increase 45% from 28 Gt in 2006 to 40 Gt in 2030 – 97% of the increase occurring in non‐OECD countries. Global transport emissions account for one‐fifth of the overall increase and are projected to grow by 38% over the same period – 98% of the growth occurring in non‐OECD countries. Flat emissions growth in OECD countries is projected to be the result of increased light‐duty vehicle efficiency (average CO2 emissions moving from 176g CO2/km in 2006 to 130g CO2/km in 2030) compensating for increased vehicle numbers. Emissions from international air travel and shipping are projected to grow by 40% by 2030 compared to 2006.
2. ITF estimate based on IEA data and updated IMO CO2 data for international shipping.

8 The Cost and Efficiency of Reducing Transport GHG Emissions — Preliminary Findings — © OECD/ITF 2009
The projections clash with the ambitious climate stabilisation objectives outlined by the IPCC, which most likely cannot be met without significant emission cuts from the transport sector. Reducing overall emissions by 50% by 2050 will also be impossible without significant action on the part of non‐OECD countries. The key challenge is for transport to contribute to increases in general welfare more efficiently and with fewer emissions.
2. Transport is almost entirely dependent on carbon‐intensive fossil fuels – reducing transport GHG emissions will entail fundamental changes in long‐term energy sources.
Transport used 2 231 Mtoe of energy worldwide in 2006 ‐‐ 95% from carbon‐intensive fossil fuels. These fuels are uniquely suited to the needs of the sector but they are the principal source of transport’s GHG emissions. Furthermore, they are available in finite quantities and though sufficient resources remain to cover projected growth in demand, they will come from increasingly expensive sources – some of which may be more carbon‐intensive than current fossil fuels. Reducing emissions in the transport sector will eventually require decarbonising transport energy. In the meantime, transport will remain vulnerable to short‐term price spikes of fuels.
Increasing the efficiency of fossil fuel use and early decarbonisation has the potential to alleviate the impacts of these disruptions on households and industry. At the same time, rising fossil fuel prices make investments in efficiency and alternative energy sources more attractive. There is scope for government action to facilitate early decarbonisation.
3. Transport is vulnerable to the impacts of climate change – significant investment in adaptation will be necessary.
Transport infrastructure and operations are vulnerable to a changing climate, especially insofar as this concerns changes in sea level, temperature, precipitation, wind strength and storm frequency. Engineering design standards and infrastructure operating practices may need to be modified to account for this and preserve infrastructure adequately from expected weather‐induced degradation.
The ultimate scope of potential climate change impacts on transport is highly sensitive to regional and local variables but adaptation to climate change may compete for funds with emissions mitigation. Early emissions reduction from transport can contribute to reduced adaptation costs.
What can be done? At what Cost?
Much can still be done to reduce transport CO2 emissions at negative or relatively low net societal costs.
This study has analysed all major published assessments of marginal abatement costs of greenhouse gas emissions. These assessments have examined costs and contribution to CO2 reduction for a number of technology and fuel‐based measures based on a range of assumptions regarding energy prices and baseline conditions. Despite these differences, a consistent finding of these assessments is that many technology and fuel‐related GHG reduction measures in the transport sector are relatively low cost or may even save money over time. This is because many measures have the potential to reduce fuel consumption. These savings increase as fuel prices increase – a likely development over the mid‐ to long‐term. However, the studies also generally find that the absolute contribution of low‐cost CO2 abatement from transport will generally be less than that of other sectors – although this varies by region and country.

The Cost and Efficiency of Reducing Transport GHG Emissions — Preliminary Findings — © OECD/ITF 2009 9
Crucially, abatement cost studies tend to find that while the net average social costs may be low, implied capital costs (the costs faced by investors and consumers) will be high in the transport sector compared to low‐cost abatement measures in other sectors. The imbalance between low net abatement costs and high capital investment costs provides a potential rationale for government intervention.
One of the most recent of these studies published by McKinsey in February 2009 finds that a global economy‐wide abatement potential of 38 Gt CO2eq per year for technical measures exists at a cost less than €60 (2005) per tonne CO2eq abated (assuming a societal discount rate of 4% and an average oil price of $60 per barrel) – this would result in 35% and 70% reductions in emissions from 2005 levels and projected 2030 levels, respectively. If realised, this abatement would put emissions on track to more‐or‐less meet a trajectory to 450 ppm atmospheric CO2 concentrations and keep temperature rise to ~2˚C by 2100. The IEA finds that for 2050, economy‐wide measures costing less than €40 ($50) per tonne CO2eq abated might only stabilise emissions while measures costing up to €160 ($200) might halve emissions from the 2005 baseline. This is a less optimistic outlook than McKinsey but, unlike IEA, McKinsey accounts for emission reductions from forestry, agriculture and land‐use changes.
McKinsey Marginal Abatement Cost Curve for Road Transport in 2030
Source: (McKinsey & Company, 2009).
Of the 38 Gt CO2eq abatement potential in 2030 cited by McKinsey, only 3.2 Gt (8%) occur in the transport sector mostly from road transport. However, the average cost of these reductions are negative

10 The Cost and Efficiency of Reducing Transport GHG Emissions — Preliminary Findings — © OECD/ITF 2009
(ranging from ‐€17 to ‐€3 per tonne CO2eq abated). For road transport, ~60% of the abatement potential at less than 100€/tonne CO2eq comes at a net negative societal cost and most of these measures concern efficiency improvements to existing internal combustion engine vehicles.
Much of the economy‐wide abatement potential arises in countries with high projected absolute levels of business‐as‐usual emissions – e.g. the United States and China. Much of the low‐cost global abatement potential from transport arises in the developing world – international cooperation might facilitate their realisation.
The IEA finds that of its overall 2050 abatement potential of 35 Gt CO2eq at a cost of less than €40 ($50) per tonne CO2eq, 8.9 Gt CO2eq (23%) is accounted for by the transport sector. Looking at measures costing up to €160 ($200) per tonne of CO2eq abated, the contribution from the transport sector might increase to 12.5 Gt CO2eq (26%). Again, much of the reduction potential comes from improvements to traditional ICE efficiency with the more aggressive scenario requiring greater penetration of more expensive alternative drivetrains such as hybrids and electric vehicles.
Beyond technology‐related measures, there is evidence that many demand management measures may also entail low social marginal abatement costs, especially when co‐benefits such as mitigating congestion are accounted for. Measuring the costs of these measures is, however, challenging.
Some countries have been able to reduce transport CO2 emissions even as their economies grew.
The current economic recession will mean that many countries are experiencing declining rates of CO2 emissions in many sectors, including transport. However, prior to the down‐turn, some countries had been able to stabilise or even reduce their transport‐related CO2 emissions against a backdrop of economic growth.
For example, in Germany, transport CO2 emissions have been declining since the late 1990s due to the combined action of several measures that include vehicle fuel economy improvements, biofuels tax exemption and quota system, increased fuel taxes on conventional fuels, heavy duty vehicle road pricing, differentiated vehicle excise taxes linked to engine displacement and new vehicle labelling. France has seen emissions stabilise with improved vehicle efficiency, reduced travel speeds and stabilised travel volume (vkt).
In Japan, transport CO2 emissions have also decreased since 2001 as the economy grew slightly. This is due to improved load factors in road freight transport, improved vehicle fuel economy triggered by increasingly stringent standards as well as an increased share of fuel efficient micro‐cars and increasing numbers of hybrid cars. Reduced traffic congestion also played an important role.
An Evaluation Framework is Essential
If transport is to contribute effectively to achieving ambitious GHG emission reduction objectives, GHG abatement will have to be given the same weight as other key objectives of national transport policies such as road safety improvement and infrastructure development. Many synergies exist between GHG reduction and other transport objectives: e.g. decreasing congestion can lead to a significant drop in GHG emissions, reduced speeds tends to reduce the severity of crashes. On the other hand, unmanaged transport growth and GHG reduction are not easily compatible.

The Cost and Efficiency of Reducing Transport GHG Emissions — Preliminary Findings — © OECD/ITF 2009 11
Sound transport data and analysis can shed light and provide crucial feedback on the impacts of different policy choices. In order to achieve ambitious transport GHG emission reduction objectives, transport authorities need a robust evaluation and monitoring framework to guide their action.
GHG emission vectors can be grouped into four broad categories; transport demand, transport mode, fuel type and fuel efficiency with the latter being decomposed into both vehicle fuel efficiency and traffic flow efficiency. These four categories should serve as the analytical base for assessing whether government policies have adequately addressed the sources of transport GHG emissions. Data required to assess progress in these four areas include fleet composition and characteristics, activity data, mode share, fuel consumption and emission rates for each mode. This assessment should be carried out on a well‐to‐wheel basis for fossil fuels and on a field‐to‐wheel basis for biofuels.
Evaluation Framework for Addressing Transport CO2 Emissions
People’s livesImprovement of Welfare
Economic ActivitiesEconomic Growth
Freight transport
Passenger transport
Fuel, EnergyVehicle
Mode share
Infrastructure
Traffic(Market)
CO2 Emissions
Supply Demand
CO2 Emissions = Mode ShareActivitypassenger
freight
Efficiencytank to wheel
traffic efficiency
Fuel carbon contentwell/field to tank
x x x
The potential for catastrophic or irreversible outcomes and uncertainty of the impacts of GHG reduction implies that standard cost‐benefit assessment may not be suitable to evaluate GHG reduction policies. Assessing measures according to their cost effectiveness in contributing to GHG mitigation objectives (e.g. a trajectory leading to 450 ppm CO2 in the atmosphere by 2100) may more effectively guide policy and some countries have adopted such target‐consistent appraisal.
Ideally, governments should not be paying more to reduce GHG emissions when there are less costly abatement measures still available to them – unless there are clear and compelling reasons to do so. Cost effectiveness analysis and computation of abatement costs provides a basis for decisions which might avoid unnecessary expense. Marginal abatement cost calculation has the benefit of being able to help

12 The Cost and Efficiency of Reducing Transport GHG Emissions — Preliminary Findings — © OECD/ITF 2009
governments equalise costs across sectors, or within sectors, although it may be difficult to compare technical and non‐technical measures under this framework.
Given the large variance in abatement costs across regions, some form of a global emissions trading regime would go far to diminish overall GHG emissions reduction costs. According to recent estimates, the cost of achieving a 450 ppm stabilisation trajectory without trading would be 4 to 13 times greater than if trading were in place.
A key policy challenge will be to balance efforts between low‐cost but exhaustible technology options and higher‐cost measures that pave the way for a shift to alternative low‐carbon propulsion. Investment now in support of higher‐cost alternative propulsion technologies can serve to ease the transition to these in the future and may reduce their costs in the long term. Policy‐makers and manufacturers will be faced with a need to balance current low‐cost GHG‐reducing technology with higher‐cost investments. Developing clear and consistent criteria to accompany these investment decisions can reduce uncertainty and allow for a smoother transition.
In addition to robust life‐cycle emissions and cost‐effectiveness assessment (including co‐benefits and potential side‐effects), evaluation frameworks must also account for a number of additional factors such as the public acceptability of transport‐sector GHG reduction policies (including distributive impacts), implementation barriers, compatibility with current policies and issues related to measurement.
Areas for Action: Surface Transport
This report investigates GHG emission reduction strategies in 5 key areas; fuels, vehicle efficiency, traffic management, demand management policies ‐‐ including land use ‐‐ and mode shift, and presents a framework with which to evaluate emissions reduction potentials and guide policy‐making.
This policy evaluation framework considers emission vectors and areas where policy action may be taken along the lines of the matrix below. This approach is useful for evaluating the effectiveness of policies by emissions vector and for guiding policy accordingly. Countries may use this approach to characterise and assess their transport‐related GHG emissions and target priority areas for action.
Travel demand Mode share
Fuels and energy
Vehicle efficiency
Traffic efficiency
Land use planning
Public transport
Freight transport
Passenger vehicles
Road network
Fiscal and economic measures
Technological research and development
Information and education
The Cost and Efficiency of Reducing Transport GHG Emissions — Preliminary Findings — © OECD/ITF 2009 13
Fuels
There is limited fuel de‐carbonisation potential in the short‐term though this will change and more alternative fuel sources will come on line as oil prices rise.
Fossil fuels will remain the main source of transport energy over the mid‐term, though prices are expected to rise making alternatives, such as biofuels, more affordable. Only a few alternative fuels are likely to be cost‐competitive with gasoline or diesel over the short‐ to long‐term – essentially sugar cane ethanol and very large coal‐to‐liquid plants. The latter, without yet‐to‐be‐developed carbon capture and storage technology (CCS), would lead to more CO2 emissions than the fuels it would replace.
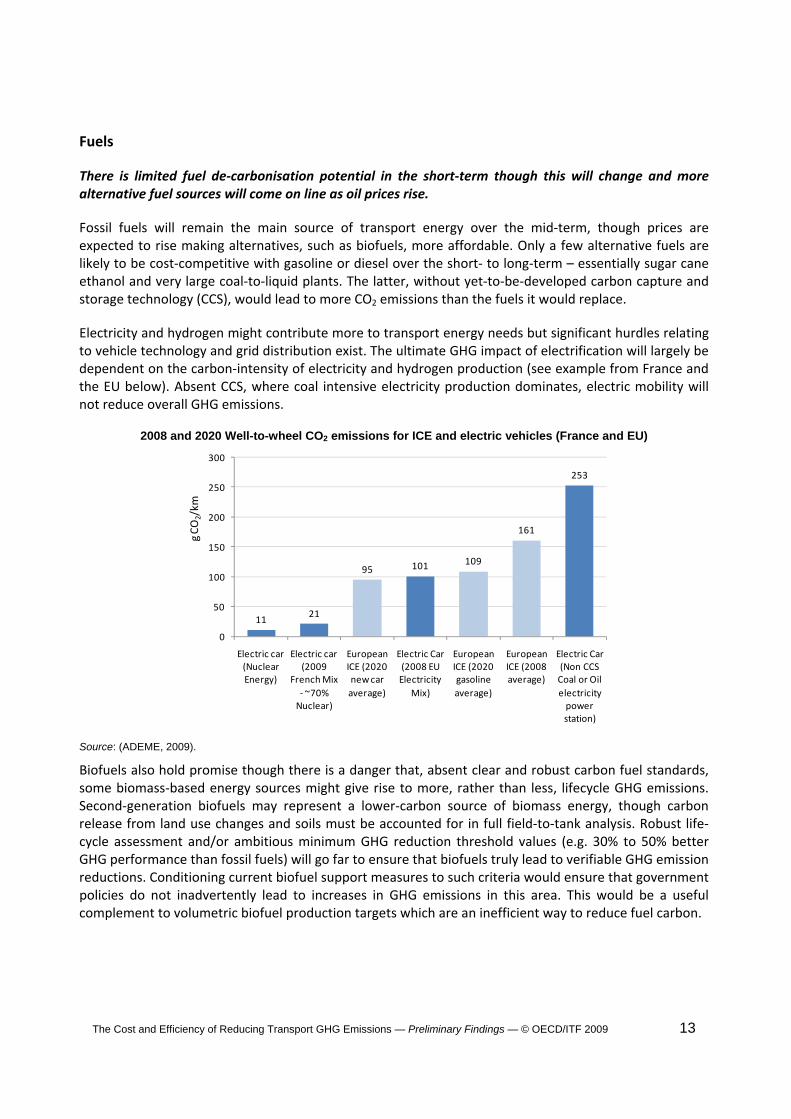
Electricity and hydrogen might contribute more to transport energy needs but significant hurdles relating to vehicle technology and grid distribution exist. The ultimate GHG impact of electrification will largely be dependent on the carbon‐intensity of electricity and hydrogen production (see example from France and the EU below). Absent CCS, where coal intensive electricity production dominates, electric mobility will not reduce overall GHG emissions.
2008 and 2020 Well-to-wheel CO2 emissions for ICE and electric vehicles (France and EU)
1121
95 101 109
161
253
0
50
100
150
200
250
300
Electric car (Nuclear Energy)
Electric car (2009
French Mix ‐ ~70% Nuclear)
European ICE (2020 new car average)
Electric Car (2008 EU Electricity
Mix)
European ICE (2020 gasoline average)
European ICE (2008 average)
Electric Car (Non CCS Coal or Oil electricity power station)
g CO
2/km
Source: (ADEME, 2009).
Biofuels also hold promise though there is a danger that, absent clear and robust carbon fuel standards, some biomass‐based energy sources might give rise to more, rather than less, lifecycle GHG emissions. Second‐generation biofuels may represent a lower‐carbon source of biomass energy, though carbon release from land use changes and soils must be accounted for in full field‐to‐tank analysis. Robust life‐cycle assessment and/or ambitious minimum GHG reduction threshold values (e.g. 30% to 50% better GHG performance than fossil fuels) will go far to ensure that biofuels truly lead to verifiable GHG emission reductions. Conditioning current biofuel support measures to such criteria would ensure that government policies do not inadvertently lead to increases in GHG emissions in this area. This would be a useful complement to volumetric biofuel production targets which are an inefficient way to reduce fuel carbon.

14 The Cost and Efficiency of Reducing Transport GHG Emissions — Preliminary Findings — © OECD/ITF 2009
Vehicle Fuel Economy
Improving traditional internal combustion engine vehicle fuel economy is a key low‐cost transport GHG reduction strategy ‐‐ there is a clear opportunity to improve new car fuel economy 30% or more by 2020 and 50% by 2030 at low costs taking into account lifetime fuel savings.
The world vehicle fleet is currently dominated by internal combustion engines (ICE’s). It is likely that over the next 10‐25 years this domination will continue as both gasoline‐powered spark ignition and diesel‐powered compression ignition engines are further improved for energy efficiency. There is a clear opportunity to improve new car fuel economy 30% or more by 2020 and 50% by 2030 worldwide, in a cost‐effective manner (e.g. low or negative cost per tonne of CO2). Improving the efficiency of new cars at this rate would make possible a 50% improvement in the average fuel economy of all cars on the road by 2050 despite projected growth in car stocks as illustrated in the figure below. Hybridised drivetrains will be a key technology but many fuel economy gains are also available from engine down‐sizing and turbo‐charging, weight reduction and new engine configurations and combustion regimes.
Stabilisation of world CO2 emissions from light‐duty vehicles as a result of a 50% improvement in new vehicle fuel economy by 2030 vs. “Business as Usual” (ITF and IEA scenario)
0
1,000
2,000
3,000
4,000
5,000
6,000
7,000
8,000
2000 2010 2020 2030 2040 2050
LDV CO2 Mid‐range BAU
LDV CO2 Stabilization
Over the longer term, vehicle drivetrains will migrate to non‐combustion‐based technologies. The speed with which these vehicles penetrate the fleet is linked to the costs of batteries and the availability of adequate recharging infrastructure.
At mid‐ to long‐term horizons (25‐50 years), other propulsion systems using grid‐based electricity or electro‐chemical energy transformation (plug‐in hybrids, fuel‐cell and full electric vehicles) will likely increase their share of new vehicle sales although there remain important technological and market barriers to overcome before these vehicles dominate.
Two major constraints to the wider penetration of plug‐in hybrids and pure battery electric vehicles are range considerations linked to battery costs and recharging infrastructure. For range‐worthy plug‐in hybrids and battery electric vehicles to become commercially viable, battery costs will have to descend from ~$1000‐$500/kWh to less than $350/kWh. This appears possible with current battery technology

The Cost and Efficiency of Reducing Transport GHG Emissions — Preliminary Findings — © OECD/ITF 2009 15
but only at much greater volumes of production (~100,000 units). Reaching these production volumes will require vehicle manufacturers to commit to large scale production of battery‐powered vehicles – something they are hesitant to do given uncertain consumer response.
Consumer hesitancy towards battery‐powered vehicles relates to range considerations and costs, as well as the availability of adequate recharging infrastructure. Recharging speed is also a consideration. These concerns will have to be addressed via innovative partnerships amongst vehicle and battery manufacturers, electric utilities and local governments. Novel arrangements regarding battery replacement and leasing may be important.
Hydrogen fuel cell vehicles represent an interesting long‐term drivetrain technology but costs are currently projected to be several orders of magnitude greater than plug‐in hybrids and battery electric vehicles and will likely remain so until the technology further matures.
A key issue to consider will be the life‐cycle CO2 emissions of electricity and hydrogen production. Carbon intensive electricity and hydrogen may significantly erode any in‐use CO2 emission gains from battery‐powered and fuel‐cell vehicles as noted earlier.
The CO2 reduction potential for vehicle‐related technology measures is large but it will not be fully realised unless policies account for key factors such as consumer and manufacturer aversion to risk, the gap between “official” and “real” fuel economy figures, manufacturers’ production cycles, and regional differences.
There are indications of imperfections in private vehicle purchase decisions, which arguably lead to underinvestment in fuel economy, even when fuel prices are high. The underinvestment problem stems from consumers’ reluctance to pay up front for uncertain reductions in fuel expenditures. In part because of this uncertainty, consumers require short pay‐back periods (2‐4 years) for investments in fuel economy – payback expectations that do not reflect the life‐time fuel savings potential of these technologies. Low willingness to pay for fuel economy by consumers translates into strategies on manufacturers’ part that steer vehicle design towards more marketable attributes, like power and comfort. A manufacturer will be disinclined to use technology to provide better fuel economy if there is large uncertainty on whether consumers will want to buy it and on how competitors will respond to the same problem. A fuel economy standard can counter this tendancy, as it provides clarity on what performance level needs to be reached, by a manufacturer and by its competitors.
There is a noticeable, consistent and, some say, growing gap between the official fuel economy ratings of vehicles and the real fuel economy as experienced by the driver of the vehicle on the road which can be as high as 20%. This gap may erode consumer trust in “official” fuel economy ratings and thus lead them to be much less likely to account for future fuel savings in their purchase decisions. The gap also means that the effectiveness of policies seeking to reduce GHG emissions from light duty vehicles by targeting fuel efficiency will almost certainly fall short of expectations. Reducing this gap will involve accounting for “real” driving patterns as well as the impact of accessories such as air conditioning, tyres and lights – either through labelling or standards.
Manufacturers require a fair amount of lead time for designing, planning and adapting or developing manufacturing capacity for vehicles incorporating the technologies discussed above. While this may be more straightforward for many of the technologies delivering incremental improvements in fuel economy for conventional ICEs, this is much less the case for entirely new drivetrains and propulsion systems. Similarly, the simultaneous introduction of several new technologies entail added lead time for planning
16 The Cost and Efficiency of Reducing Transport GHG Emissions — Preliminary Findings — © OECD/ITF 2009
reliable integrated vehicle systems. Manufacturers must clear sufficient operating margins in order to have the funds necessary to research, develop and deploy new fuel efficiency‐enhancing technologies – this capacity has been sorely buffeted in the current economic climate.
Individual countries will have to consider their own geographic situation and specific fleet composition in determining the overall potential for fleet‐wide fuel economy improvement.
Transport CO2 reduction policies will have to account for the impact of improved fuel efficiency on travel costs and the impact of travel costs on travel demand.
The impact of fuel economy improvements on motoring costs and the impact of the latter on overall travel demand is complex and will differ by region. Recent research in the United States on the rebound effect (the elasticity of driving with respect to the fuel cost per mile) estimated an average effect of 21.1% (i.e. a 10% reduction in fuel costs results in just over a 2% increase in driving) for the period 1966‐2004. However this falls to only 7.9% in 2004(Hymel, Small, & Van Dender). The main reasons for the decline of this elasticity over time are that in 2004 incomes are higher and fuel prices are lower than at the sample average. The study also suggests that the presence of congestion dampens the rebound effect: better fuel economy does lead to more driving, but less so when there is congestion, because congestion itself is a deterrent to driving. This means that a fuel economy improvement of 10% translates into a reduction of overall fuel consumption by 9.21% if the determining variables remain at 2004 values.
Conversely, there is broad evidence that the impact of rising fuel prices (and thus travel costs) leads to a short‐term reduction of travel demand (as seen during the oil price spike of 2008) which grows over the long‐run, though its extent is limited by long‐term income growth. In recent years however, a larger part of the long‐run impact of fuel price increases has manifested itself through a greater investment in fuel economy rather than through travel demand reduction.
Taxes and Pricing
Incorporating the external costs of transport – including those related to climate change – into price signals is important to ensure consistent and convergent action to reduce transport GHG emissions.
Fuel taxation is an important tool in this respect though establishing a shadow price for carbon in a context of uncertainty regarding the scale, scope and timing of climate change impacts remains challenging as indicated earlier. Care should be made to ensure that fuel and other taxes work in concert with other GHG reduction measures such as standards in order to ensure consistent GHG reduction outcomes. For example, a combination of challenging standards and low fuel taxes in North America created a large gap between consumer demands and legal requirements on vehicle manufacturers.
Differentiated vehicle purchase and registration taxes and feebate systems can help to guide consumers to lower CO2‐emitting vehicles and have been shown to stimulate the offer of low‐carbon vehicles. These instruments have the advantage of providing clear and immediate feedback to households regarding fuel economy performance. Congestion and parking pricing are important instruments to consider deploying in urban areas as they can lead to reduced travel volumes and CO2 emissions at relatively low net costs. Distance‐based charging, especially for road freight, has been shown to have a large impact on consolidating loads and improving logistics efficiency in road freight, reducing vehicle kilometres travelled and thus CO2 emissions.

The Cost and Efficiency of Reducing Transport GHG Emissions — Preliminary Findings — © OECD/ITF 2009 17
Road Traffic Management
Better traffic and congestion management can reduce CO2 emissions from road transport.
Congestion can be abated through enlarging traffic capacity at bottlenecks, adding new capacity more generally and managing existing capacity better, for example through the application of information and communications technologies. These strategies have the potential to deliver important CO2 reductions if care is taken to avoid induced traffic effects. Even in some cases where overall travel increases, emissions may still be less than before due to more efficient operating speeds. Below is an example from Japan where selected road infrastructure modifications have led to reduced CO2 emissions in urban areas and some rural areas despite increased vehicle travel. This reduction is largely due to improved traffic flow. A key point is to manage new capacity or newly available capacity in such a way as to lock‐in benefits derived from congestion reduction. Congestion pricing can provide a durable approach to congestion management.
CO2 and VKT impacts of selected Road Infrastructure Modifications in Japan
Source: Japanese Ministry of Land Infrastructure and Transport.
Eco‐driving initiatives can deliver important low and negative cost emission reductions.
Reducing CO2 emissions through the promotion of smoother driving styles can reduce emissions by up to 15% at very low cost though the impact of these measures decrease over time without additional training. Promoting eco‐driving through new driver training and on‐board gear‐shift and fuel economy metering can help. Commercial drivers are a particularly important group since eco‐driving related fuel economy gains can readily be incentivised.
0.85
0.90
0.95
1.00
1.05
1.10
New bypass Lane increase Intersection treatment
CO 2 emissions Traffic volume (vkm)
Rural Area Metropolitan Area
Inde
xed
to a
vera
ge le
vel p
rior t
o m
odifi
catio
n

18 The Cost and Efficiency of Reducing Transport GHG Emissions — Preliminary Findings — © OECD/ITF 2009
Demand Management
Improving the efficiency of vehicles and traffic will not be sufficient to reach ambitious CO2 reduction objectives from transport. Demand will have to be better managed in the future to reduce growth in CO2‐intensive travel. Demand management, however, will deliver smaller and smaller relative gains in GHG emissions reduction as vehicle efficiency improves throughout the fleet.
There is considerable scope for responding to mobility needs less carbon‐intensively than has been the case in the past. However, demand management policies targeting travel volumes, therefore, will see gradually diminishing returns in terms of per‐kilometre GHG reduction as per‐kilometre vehicle efficiency increases.
Nonetheless, demand management measures remain an essential part of the mix since increased fuel efficiency, in the absence of congestion or demand management policies, will lead to more overall travel and increases in GHG emissions. Furthermore, there are many valid reasons to limit travel volumes, especially in dense urban areas (e.g. congestion, noise, non‐road user safety, etc.).
Mobility management policies have, at the local and regional levels, considerable scope to contribute to changes in travel behaviour and reducing CO2 emissions.
Mobility management policies, such as the facilitation of company mobility management plans and providing mobility advisory services to the public, have the potential to modify travel behaviour in certain circumstances. These tend to be relatively cost effective actions. However, they may not be scalable beyond certain niches – at least in the short‐run. Another important source of behaviour‐related CO2 reduction is through increased load factors for passenger (through high‐occupancy lanes or toll lanes, car‐pooling, etc.) and, especially, freight transport.
Land use changes – densification in particular ‐‐ can help reduce travel‐related CO2 emissions. However, land use and transport interactions are complex and promoting one land use model may not be suitable for all urban areas.
Most of population lives in cities and a significant portion of car and van travel takes place within large urban areas. Our cities are changing though – no longer does population growth take place solely within dense urban cores. In many countries, the areas experiencing the fastest growth rates in both jobs and population are located in less dense suburbs. Lower property prices and larger living space has been a major factor in this trend – but transport infrastructure development has also helped since road construction has facilitated high levels of car mobility required to access these areas. Travel times have remained roughly constant, trip speeds have increased and car mobility has increased significantly.
Against this backdrop, there is some potential for strengthening land use policies – and zoning policy in particular – to account for CO2 impacts of spread‐out cities. Sprawl confers not just costs ‐‐ clearly households have also reaped some benefits. At a minimum, better accounting for the CO2 implications of urban growth can help to understand where action can best be taken. There is also scope for promoting greater density and mixed use in certain urban environments – although this may not be suitable in all urban areas across International Transport Forum countries. Land‐value taxation that incentivises infill development and contributes to increased density may help in this respect. Fundamentally, coordination amongst land use planning, transport planning and public transport operators is necessary for less CO2‐intensive urban growth. It is also important to bear in mind that land‐use changes may only be effective over a longer time scale on the order of one to two generations.

The Cost and Efficiency of Reducing Transport GHG Emissions — Preliminary Findings — © OECD/ITF 2009 19
Mode Shift
Improving the quality and coverage of public transport and improving cycling and walking opportunities helps to reduce CO2 emissions in some cities depending on local and national circumstances.
The emphasis to be placed on public transport provision to help combat climate change will vary from region to region, city to city and even within cities depending on urban development patterns and the existing quality of public transport. It may make better sense to place more emphasis on fuel efficiency standards for cars where low density urban development patterns prevail rendering high‐quality public transport services uneconomic. The converse would hold in countries with more densely populated urban regions are suited to public transport.
Where high quality public transport services already exist, efforts to maintain or increase public transport mode share will be easier. In areas, where rapid urban growth is taking place, it may be helpful to seek to channel it around public transport nodes. Allowing public transport operators to recapture some of the value they create for landowners adjacent to public transport nodes can help finance the extension of networks. The development of innovative low‐carbon urban transport systems based on public transport is important in large and rapidly growing urban areas – particularly in developing countries where transport networks are just being established as cities grow at an accelerated rate. Creating new synergies amongst car‐ and bike‐sharing, car‐hire, regional rail, parking providers and new alternative forms of public transport like on‐call vans and public taxis may all go far to lower the costs of providing new travel choices for low‐density neighbourhoods.
Facilitating non‐motorised transport, walking and cycling in particular, can also help citizens reduce the CO2 emissions from their travel. Successful promotion of these modes depends largely on having a long‐term policy commitment to their development. Furthermore, cycling and walking are also access modes for public transport and thus their promotion may lead to increased public transport use. The potential for these modes, alone, to reduce overall CO2 emissions may, however, be limited by the relatively small contribution of short car trips (which these modes replace) to overall car CO2 emissions (see UK graph below). Nonetheless, promotion of these modes can deliver important co‐benefits such as noise and pollution reduction and increased health.

20 The Cost and Efficiency of Reducing Transport GHG Emissions — Preliminary Findings — © OECD/ITF 2009
Cumulative trips, passenger distance and CO2 emissions from household car journeys by trip length in Great Britain, 2002/2006 average: Small CO2 impact of short car trips
Source: UK Department for Transport.
Reducing Emissions from International Aviation and Maritime Transport
CO2 Emissions from international maritime and air transport have grown rapidly and are not covered by international GHG reduction agreements. Effective action at IMO and at ICAO is essential to avert the proliferation of regional regulations that could undermine the effectiveness of GHG reduction in these sectors.
The Kyoto Protocol of the UNFCCC excludes international aviation and maritime transport from the GHG inventories and targets of signatory countries. In the Protocol, the UNFCCC recognizes the lead roles played by the International Civil Aviation Organization (ICAO) and the International Maritime Organization (IMO) in addressing international emissions by directing Annex 1 states to pursue limitation or reduction of GHGs through these U.N. organizations. ICAO and IMO are developing global approaches for the sectors.
International Maritime Transport
International maritime activity accounted for approximately 843 Mt of CO2 or 2.7% of global CO2 emissions from fuel combustion in 2007. IMO projects that CO2 emissions from international maritime activity are expected to rise by 10‐26% by 2020 and by 126‐218% by 2050 – largely driven by growth in emissions from larger and faster container vessels. Whether or not the 2008‐2009 recession changes the long‐term forecast is unclear and will depend on the extent to which structural readjustments in trading patterns occur during and following the recovery. There is some speculation that this is the case meaning
93%
78%
57%
23%
7%
30%
56%
14%
3%0.4%
62%
37%
19%
4% 0.9%
0%
10%
20%
30%
40%
50%
60%
70%
80%
90%
100%
0 1 2 3 4 5 6 7 8 9 10 11 12 13 14 15 16 17 18 19 20 21 22 23 24 25Distance (miles)
% of total car trips - Cumulative % of total passenger distance - Cumulative % of total car CO2 - Cumulative
85%
99%88%
0%
10%
20%
30%
40%
50%
60%
70%
80%
90%
100%
0 10 20 30 40 50 60 70 80 90 100Distance (miles)
23% of all car trips areless than 2 miles butonly account for 4% of CO2 emissions

The Cost and Efficiency of Reducing Transport GHG Emissions — Preliminary Findings — © OECD/ITF 2009 21
that future growth may be less dependent on long‐distance international trade than in the recent past leading to relatively less GHG emissions from maritime and air transport than had previously been forecast.
The overall potential CO2 emission reductions from current vessel design strategies for newbuilds can be estimated to be in the range of 5‐30%. Further technical retrofit and maintenance strategies can potentially reduce an additional 4‐20% while operational strategies might potentially reduce fuel use and CO2 emissions by as much as 40%. Combined technical and operational measures have been estimated to potentially reduce CO2 emissions by up to 43% per tonne‐kilometre by 2020 and by up to 63% per tonne kilometre by 2050. Speed reduction represents an important source of fuel savings but operators face commercial constraints that may prevent them from fully exploiting this potential. When demand for shipping is high and exceeds the capacity of ships in service the price for shipping services drives higher speeds despite the additional costs of fuel. Conversely when demand is weak there is no premium on speed.
Experience has shown that while potential fuel savings may be important, the reality is that ships are designed and operated according to many criteria – of which fuel savings (and CO2 emissions by proxy) are but one. Other criteria include market reactivity, capital constraints, duty cycles and environmental awareness ‐‐‐ all of these act on the uptake of fuel efficiency technologies and operational practices. Another factor to consider is the rate of turn‐over in the world fleet. As of 2006, the average age of vessels being withdrawn from commercial service for recycling had risen to 32 years – up from 27 years in the early 1990s. Long vessel life means that only a small share of the overall fleet will have been replaced by 2020 – this means that operational and maintenance‐related efficiency gains will likely dominate over the short‐ to medium‐term with new vessel and propulsion technology‐related gains slowly becoming more important out to the 2050 horizon.
The IMO is developing a regulatory framework to reduce GHG emissions from ships, to be presented to COP 15 in December 2009, under work by the Marine Environmental Protection Committee. Key elements under discussion include vessel design and operation efficiency indices, best management practices and energy efficiency management plans, and potentially either a global fuel levy or an emissions trading scheme.
International Aviation
Aircraft emit CO2 and shorter‐lived greenhouse gases and particles directly into the upper troposphere and lower stratospheres, where they have an impact on atmospheric composition. The short‐term warming impact of the sum of these emissions can be as high as twice the long term CO2 impact alone. IEA estimates that international aviation emitted 397 Mt of CO2 in 2006, (with another 332 Mt CO2 for domestic aviation. From 1990 to 2006, emissions from international air travel and freight have increased 55% or at an average yearly rate of 2.8%. This rate of growth has accelerated in recent years (4.1%/year from 2002).
ICAO estimated that from 2005–2025, world economic growth (GDP) will increase at an average annual rate of 3.5 % in real terms. Airline yields are expected to remain unchanged in real terms for the forecast horizon. World scheduled traffic measured in terms of passenger‐kilometres performed (PKPs) is forecast to increase at a “most likely” average annual rate of 4.6% per annum for the period 2005–2025. International traffic is expected to increase at 5.3 %, while domestic traffic is expected to increase at an average annual rate of 3.4 %. The current economic recession has led to important declines in air traffic
22 The Cost and Efficiency of Reducing Transport GHG Emissions — Preliminary Findings — © OECD/ITF 2009
but there is no evidence yet that 2025 traffic levels will fundamentally be impacted by the current crisis although arrival at projected 2025 traffic levels might be somewhat delayed from the initial forecast.
Growth in CO2 emissions will be somewhat lower since a number of fuel efficiency improvements will be made over that time frame. These will include aircraft‐related measures (weight reduction, aerodynamic and engine performance improvements, and alternative fuels), improved air traffic management (more direct routings, optimised altitude and speed) and operational measures (aircraft ground‐level and in‐flight operations, ground service equipment, and auxiliary power units).
At its 2007 Assembly, ICAO created the high‐level Group on International Aviation and Climate Change (GIACC) to develop a global framework to address international aviation emissions. The framework will include aspirational goals and an action plan of measures to be implemented by states, based on fuel efficiency, over the short, medium and long terms. Categories of measures include: aircraft‐related technology and alternative fuels; improved air traffic management; more efficient operations, and economic and market‐based measures. The framework will also include considerations related to special needs of developing states. The GIACC will build on work by the ICAO Committee on Aviation Environmental Protection on reducing aviation emissions through market‐based measures (e.g. an emissions trading scheme or a global fuel levy) and technological improvements. The GIACC intends to conclude its work in time to inform COP 15.
The EU has unilaterally decided that emissions from aircraft arriving or departing from EU airports be included in the European emissions trading scheme. EU States are in the process of developing legislation and full implementation is set for 2011 for intra‐EU flights and 2012 for all international flights arriving or departing from the EU.
Policies and Policy Packages
A number of policies have the potential to reduce transport GHG emissions – those targeting fuel economy and fuels arguably can act quickest but will not be sufficient to reach ambitious GHG reductions over the longer term.
De‐carbonising fuels will require carefully targeted fuel carbon and sustainability standards as well as support for research into alternative fuels.
Governments have three routes to delivering on the fuel economy potential:
1. Overcoming consumer and manufacturer risk aversion regarding fuel economy investments – principally through the use of standards, although labelling, voluntary norms and better information are also helpful. Long term fuel economy standards create the stability car manufacturers need to invest in new technologies.
2. Ensuring that manufacturers and consumers face stable long‐term incentives to increase fuel efficiency – e.g. through fuel and differentiated vehicle taxes and feebates or through fuel carbon pricing where fuel excise duty is currently below the shadow price for CO2.
3. Where necessary, reducing the cost of new technology development and deployment – e.g. through early investment in low‐carbon research and public procurement policies.
Authorities also have scope to assess how their decisions impact current loading factors or might increase loading factors for future freight and passenger transport.

The Cost and Efficiency of Reducing Transport GHG Emissions — Preliminary Findings — © OECD/ITF 2009 23
Integrated and coordinated planning frameworks that account for the CO2 impacts of different policy options can help authorities at all levels reduce the GHG impact of zoning decisions and infrastructure investment.
Land‐value taxation or transferring property rights to companies developing fixed‐route public transport infrastructure (e.g. metros, light rail, tram and bus rapid transit), can help ensure adequate revenue streams in support of public transport expansion.
Coordinating the deployment of a large range of mobility options covering traditional public transport provision, bus rapid‐transport, car‐sharing schemes, city‐bikes, etc. can help provide options for less and lower CO2 intensive travel in urban areas.
Focused information and communication campaigns can help change attitudes and lead to lower carbon travel on the part of some households, especially when they are designed to reach individuals who are especially receptive to changing their travel patterns due to changing life circumstances (e.g. newcomers to a city or a neighbourhood, youth and young adults and the newly retired, people who have just switched jobs, etc…).
The success of efforts to manage travel demand will ultimately depend on the ability for individuals to effectively change their travel patterns and behaviour. There are many indirect ways in which government decisions impact this behaviour. These include decisions that impact the timing of urban activities (opening and closing hours) and major traffic flows (major holiday periods).
An often ignored but fundamentally important policy is simply to collect comprehensive and timely data addressing fleet composition and characteristics, travel activity, mode share, fuel consumption and emission rates for each mode. Investing in data collection can save money in the long run by avoiding mis‐directed or failed GHG reduction policies. Accurate GHG emission data collection should make use of both top‐down and bottom‐up complementary estimation approaches.
International cooperation helps make meaningful comparisons in order to adopt appropriate measures tested elsewhere – it will also be necessary when considering the application of instruments such as a carbon tax or cap and trade systems that are most efficiently applied at the international level.
The International Transport Forum is the leading global platform and meeting place for transport, logistics and mobility. It attracts key figures from government and politics, business and industry, research and civil society, coming together to discuss a transport topic of worldwide strategic importance. The involvement of more than 50 Ministers of Transport offers many direct links to policy-making and business at both national and international levels.
www.internationaltransportforum.org Contact Information: International Transport Forum Postal address: OECD/ITF, 2 rue André Pascal, F-75775 Paris Cedex 16 Offices: 5th floor, 2-4 rue Louis David, 75016 Paris, France Tel + 33(0)1 45 24 94 35 – Fax. + 33(0)1 45 24 13 22 [email protected] www.internationaltransportforum.org


