Copyright 2011 Right Care Reducing unwarranted variation to increase value and improve quality Philip DaSilva Joint National Lead OECD: Medical Practice Variations 2-3 rd April 2012 Commissioning for Value
Transcript
Copyright 2011 Right Care
Reducing unwarranted variation to
increase value and improve quality
Philip DaSilva
Joint National Lead
OECD: Medical Practice Variations 2-3rd April 2012
Commissioning for Value
2
The NHS in England – a
fresh opportunity for
Reform
3
The QIPP challenge to the NHS is to improve quality whilst making
efficiency savings. David Nicholson has set the challenge of saving
£15-20 billion through efficiency savings from 2011 to 2014. The
challenge to the NHS is how to make these savings whilst keeping
quality as its organising principle
Investment in the NHS in England in 2010/11 will be £102 billion.
The NHS Operating Framework, which sets out the priorities for
the year ahead, confirms that in the 2010/11 financial year
healthcare spending will increase by 5.5% – but after that financial
growth will be limited for the foreseeable future.
(*)The Financial Times this week reported that senior managers have been briefed that the NHS will face a further
£20 billion productivity and efficiency gain challenge beyond 2015 ://www.ft.com/cms/s/0/94115a5e-71f7-11e1-90b5-
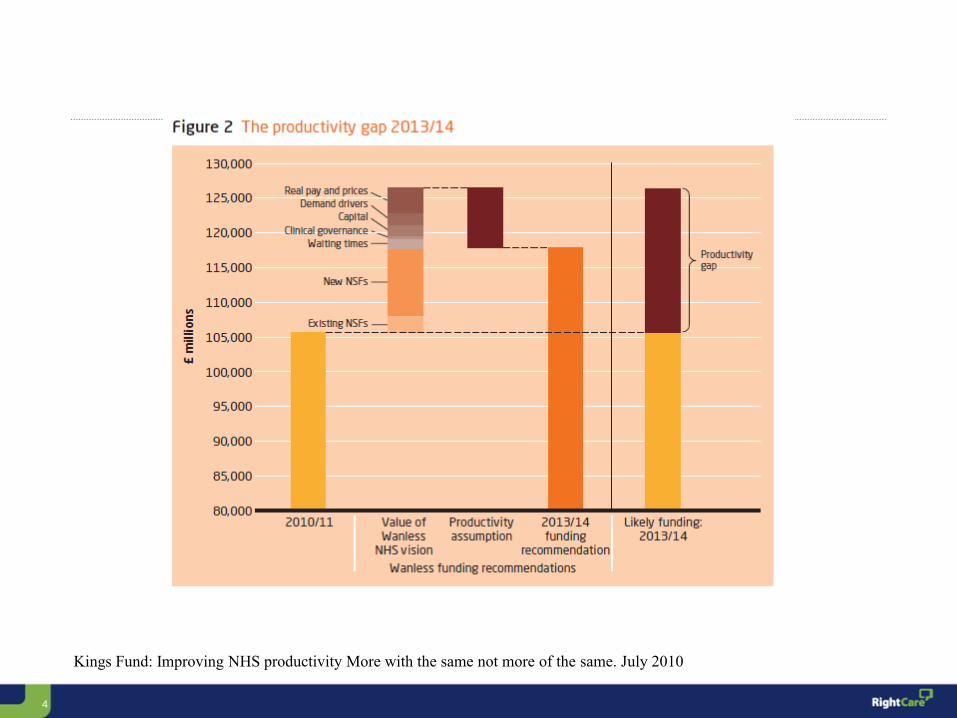
Kings Fund: Improving NHS productivity More with the same not more of the same. July 2010
5
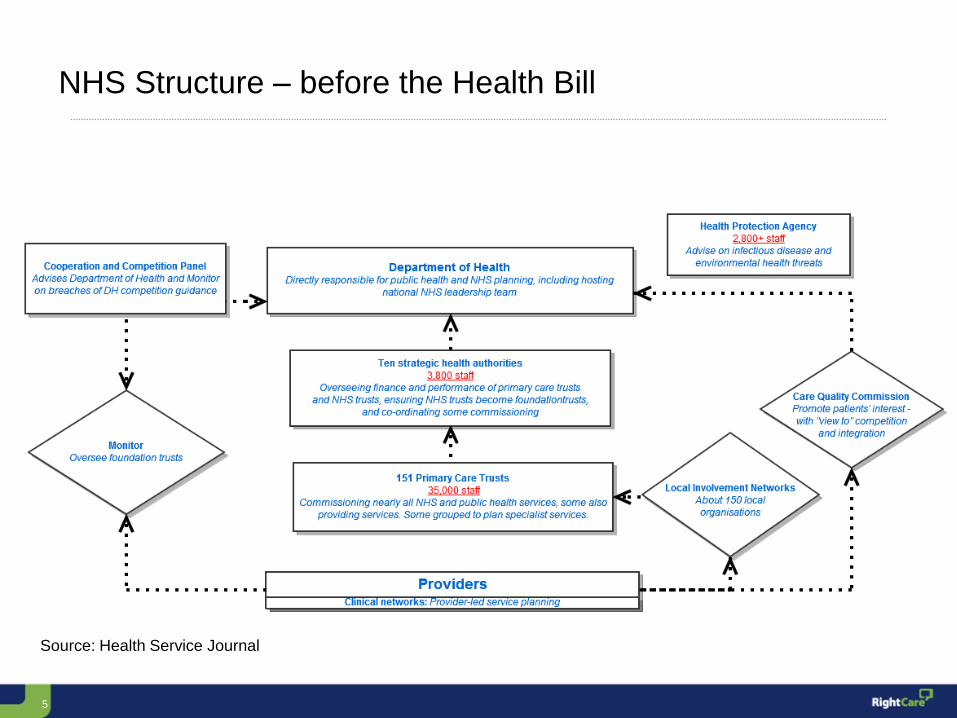
NHS Structure – before the Health Bill
Source: Health Service Journal
6
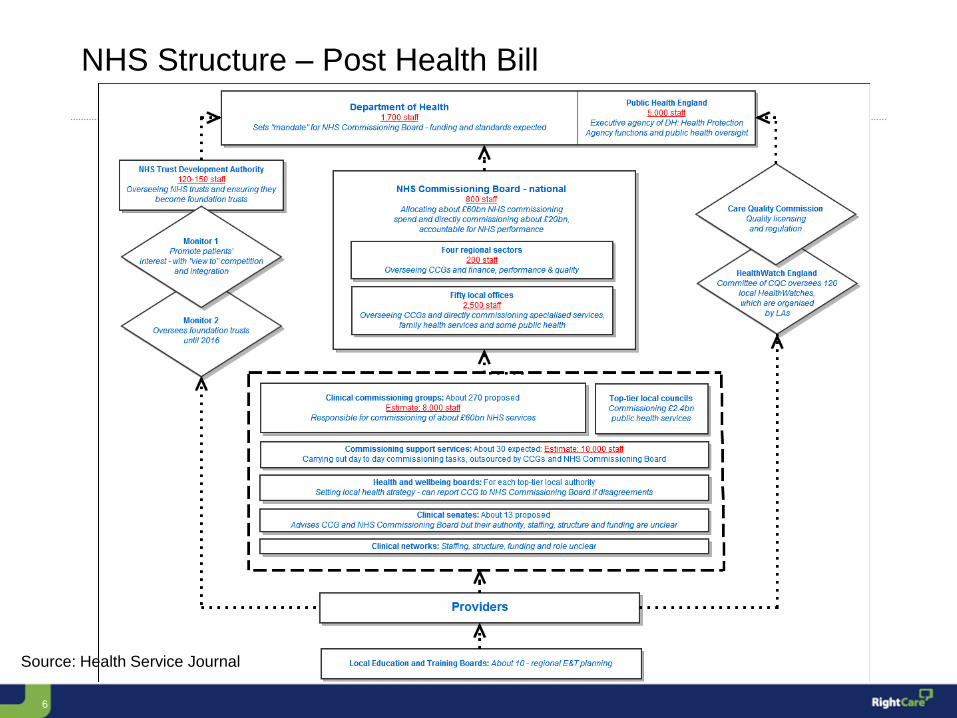
NHS Structure – Post Health Bill
Source: Health Service Journal
7
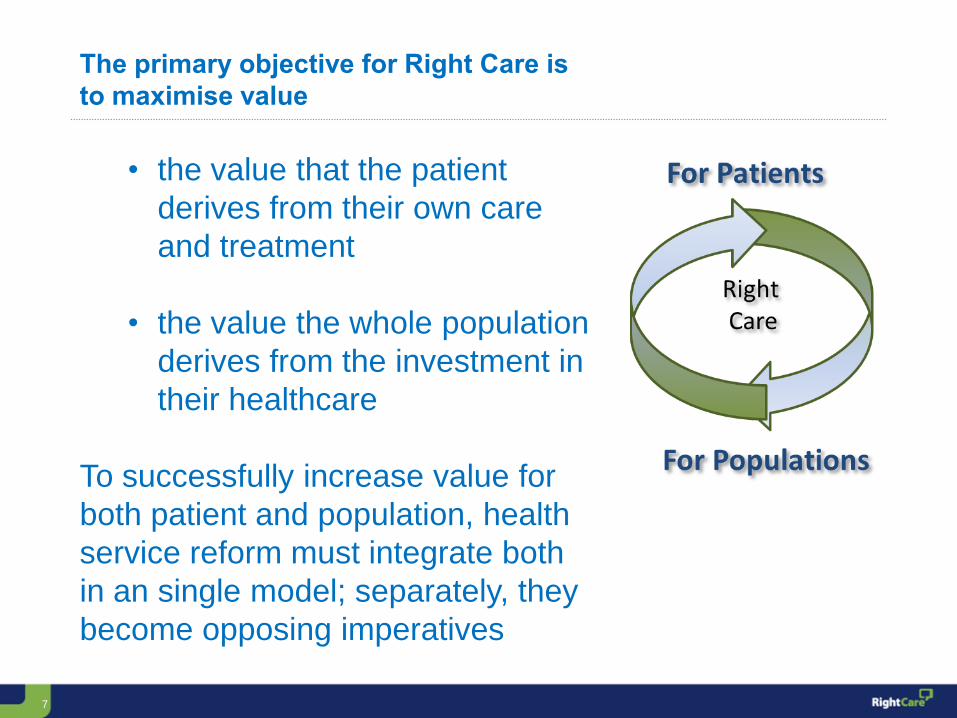
The primary objective for Right Care is
to maximise value
• the value that the patient
derives from their own care
and treatment
• the value the whole population
derives from the investment in
their healthcare
To successfully increase value for
both patient and population, health
service reform must integrate both
in an single model; separately, they
become opposing imperatives
8
For Patients For Populations
Better Value
Healthcare
Accountable
Integrated
Systems
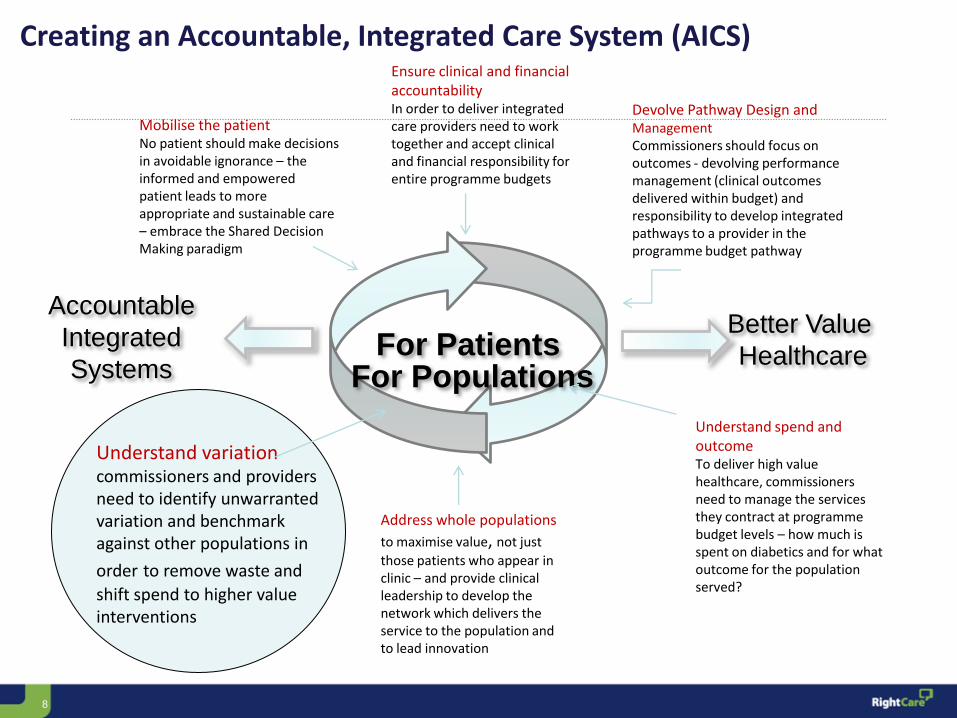
Mobilise the patient No patient should make decisions in avoidable ignorance – the informed and empowered patient leads to more appropriate and sustainable care – embrace the Shared Decision Making paradigm
Understand spend and outcome To deliver high value healthcare, commissioners need to manage the services they contract at programme budget levels – how much is spent on diabetics and for what outcome for the population served?
Understand variation commissioners and providers need to identify unwarranted variation and benchmark against other populations in
order to remove waste and
shift spend to higher value interventions
Ensure clinical and financial accountability In order to deliver integrated care providers need to work together and accept clinical and financial responsibility for entire programme budgets
Creating an Accountable, Integrated Care System (AICS)
Devolve Pathway Design and Management Commissioners should focus on outcomes - devolving performance management (clinical outcomes delivered within budget) and responsibility to develop integrated pathways to a provider in the programme budget pathway
Address whole populations
to maximise value, not just
those patients who appear in clinic – and provide clinical leadership to develop the network which delivers the service to the population and to lead innovation
9 9
England gross expenditure (£000s) – 2009/10
10
Glover AJ (1938). ‘The incidence of tonsillectomy in schoolchildren’. Proceedings of the Royal Society of Medicine, vol 31, no 10, pp 1219–36.
11
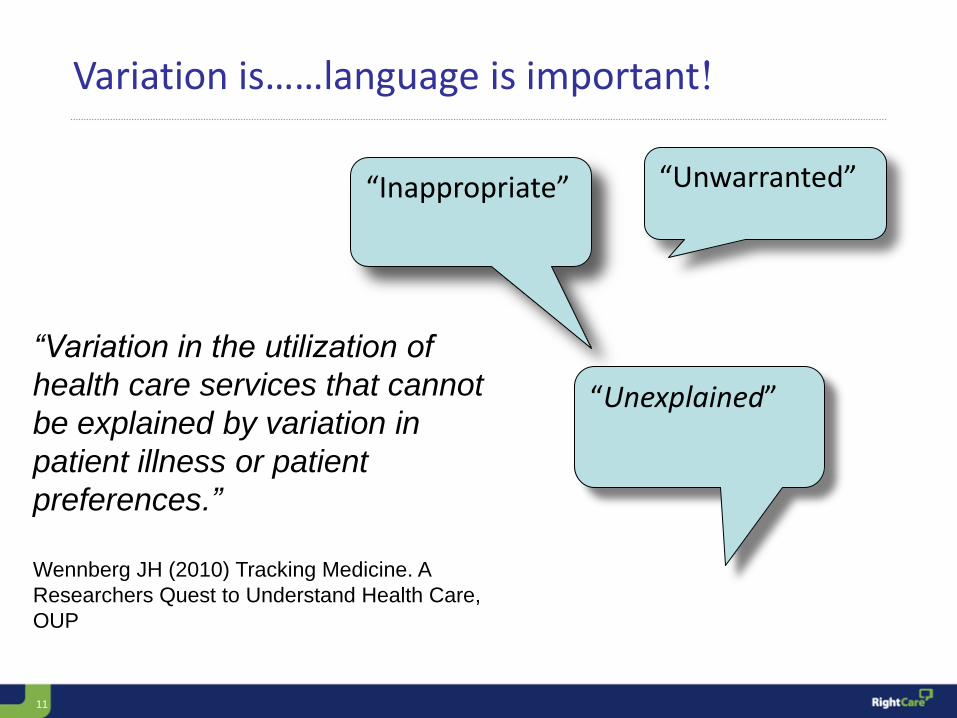
Variation is……language is important!
“Unwarranted” “Inappropriate”
“Unexplained”
“Variation in the utilization of
health care services that cannot
be explained by variation in
patient illness or patient
preferences.”
Wennberg JH (2010) Tracking Medicine. A
Researchers Quest to Understand Health Care,
OUP
12
70 years of scholarship into variations and more than 20 years
since The King’s Fund published a review of variations in health
care (Ham 1988).
That report set out some of the history of variations in health care
and policies since the 1970s designed to address differences in
resource allocation, variations in local health organisations’
performance and geographical variations in local populations’
access to, and utilisation of, health services.
Yet more variations are being observed!
13
“If all variation were bad, solutions would be
easy. The difficulty is in reducing the bad
variation, which reflects the limits of
professional knowledge and failures in its
application, while preserving the good variation
that makes care patient centred. When we fail,
we provide services to patients who don’t need
or wouldn’t choose them while we withhold the
same services from people who do or would,
generally making far more costly errors of
overuse than of underuse.”
Mulley, AJ. Improving productivity in the NHS BMJ 2010. 341:c3965
doi: 10.1136/bmj.c3965 (Published 27 July 2010)
14
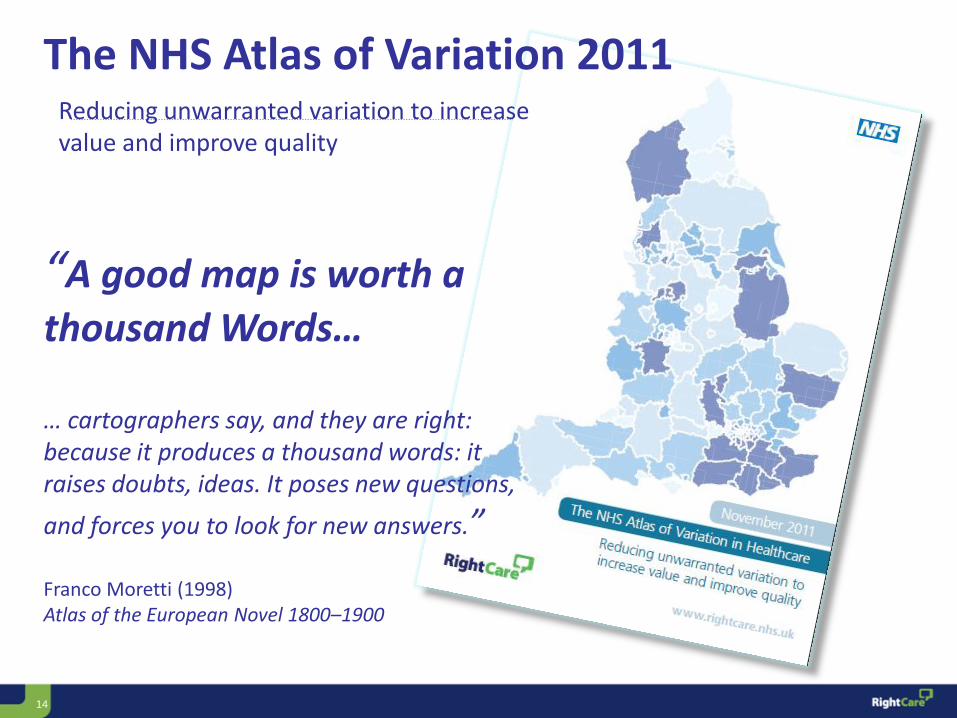
Reducing unwarranted variation to increase value and improve quality
“A good map is worth a
thousand Words… … cartographers say, and they are right: because it produces a thousand words: it raises doubts, ideas. It poses new questions,
and forces you to look for new answers.” Franco Moretti (1998) Atlas of the European Novel 1800–1900
The NHS Atlas of Variation 2011
15
Responding to variation
“The data are wrong.”
“Our population is
different.”
Even if the data are not completely
accurate, the variations that can be
observed in quality, outcome, activity,
expenditure, and value are too great to be
explained only by differences in the
recording and analysis of the data.
It is possible to take these two factors into
account when comparing the health of two
populations by “standardising” the data.
This means using a formula to adjust the
data from each population such that they
are presented as if each population has the
same age and social class distribution as
the national average
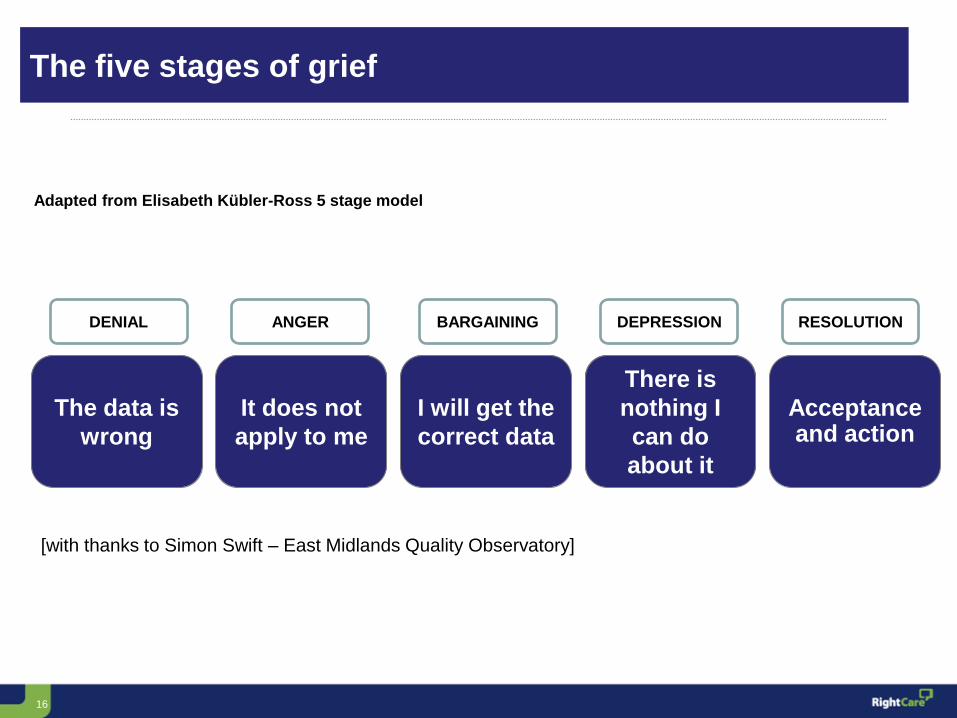
16
The data is
wrong
DENIAL
It does not
apply to me
ANGER
I will get the
correct data
BARGAINING
There is
nothing I
can do
about it
DEPRESSION
Acceptance and action
RESOLUTION
Adapted from Elisabeth Kübler-Ross 5 stage model
The five stages of grief
[with thanks to Simon Swift – East Midlands Quality Observatory]
17
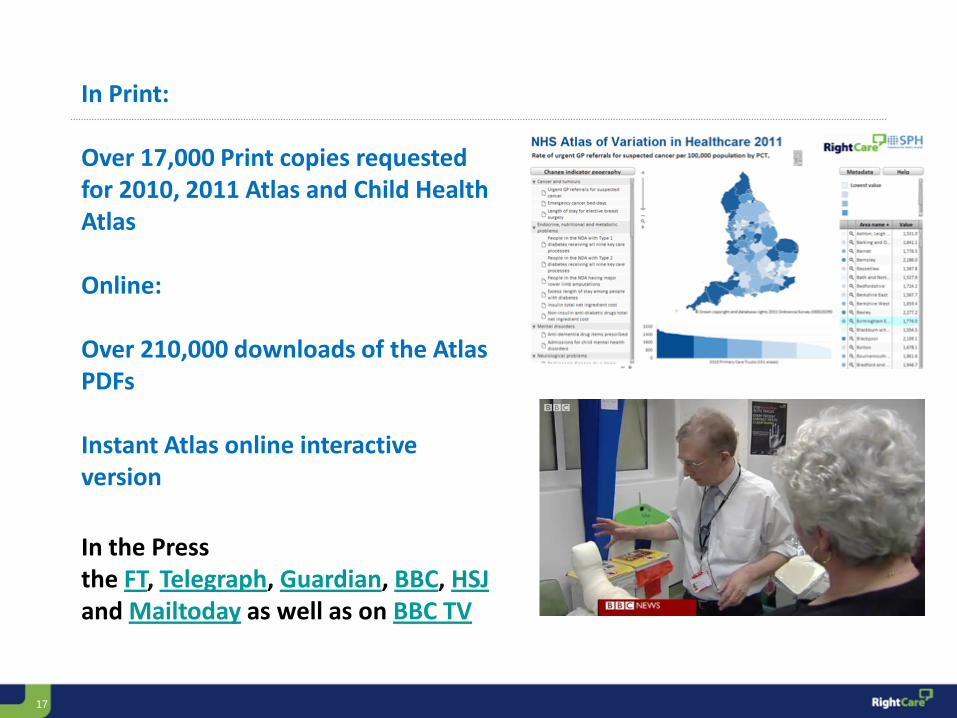
In Print: Over 17,000 Print copies requested for 2010, 2011 Atlas and Child Health Atlas Online: Over 210,000 downloads of the Atlas PDFs Instant Atlas online interactive version
In the Press the FT, Telegraph, Guardian, BBC, HSJ and Mailtoday as well as on BBC TV
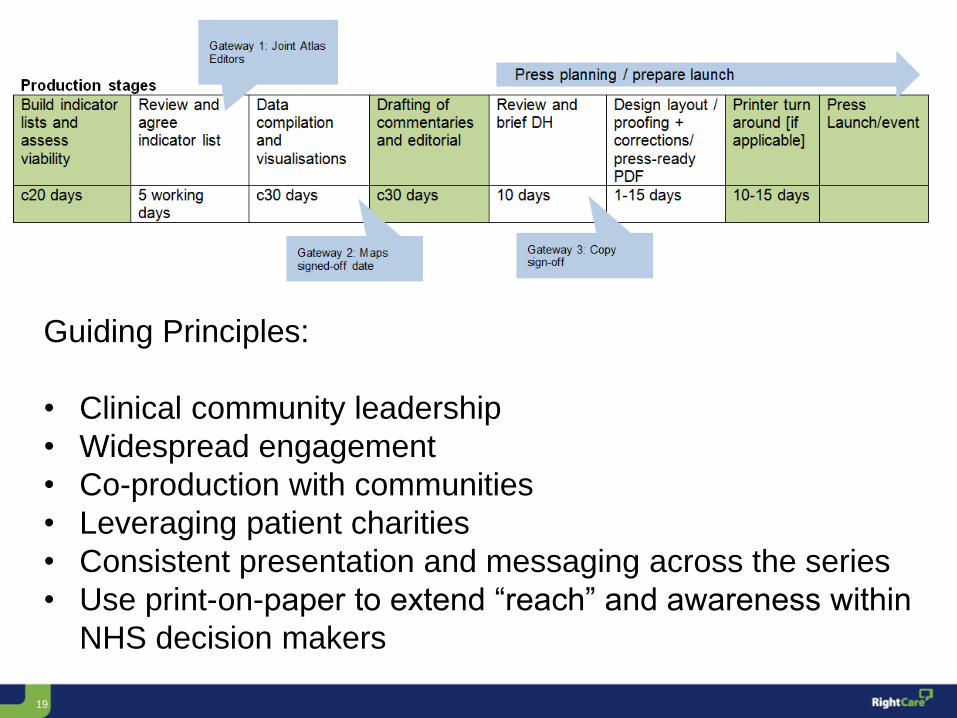
• Consistent presentation and messaging across the series
• Use print-on-paper to extend “reach” and awareness within
NHS decision makers
20
The National Atlas of Variation
21
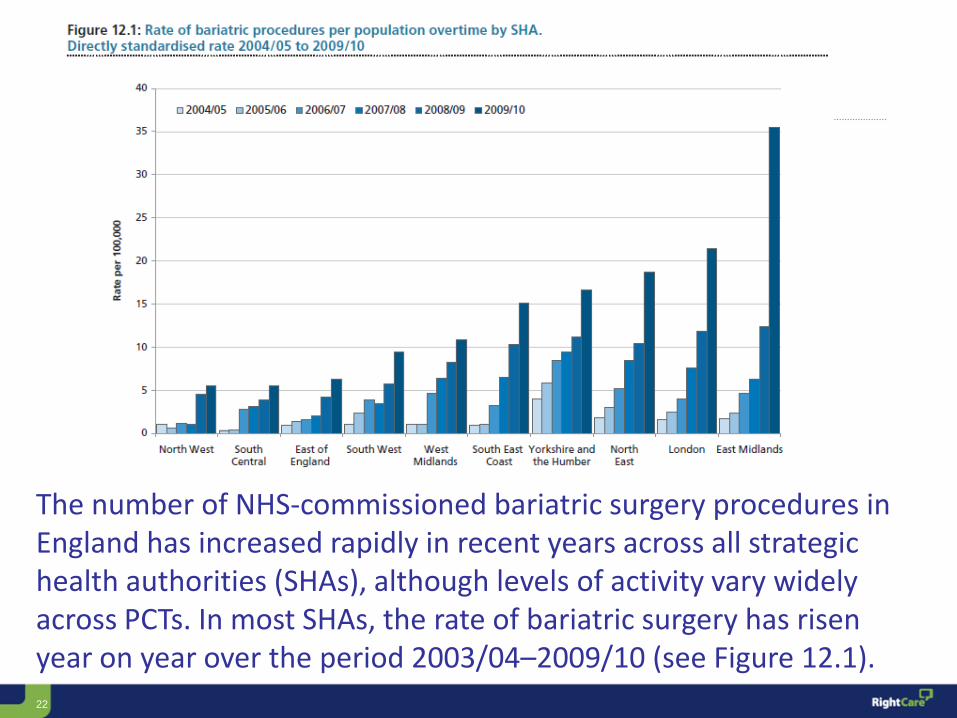
For PCTs in England, the rate of bariatric procedures in hospital per 100,000 ranged from 0.4 to 41.3 (93-fold variation). When the five PCTs with the highest rates and the five PCTs with the lowest rates are excluded, the range is 1.3–24.9 per 100,000, and the variation is 19-fold.
22
The number of NHS-commissioned bariatric surgery procedures in England has increased rapidly in recent years across all strategic health authorities (SHAs), although levels of activity vary widely across PCTs. In most SHAs, the rate of bariatric surgery has risen year on year over the period 2003/04–2009/10 (see Figure 12.1).
Copyright 2011 Right Care
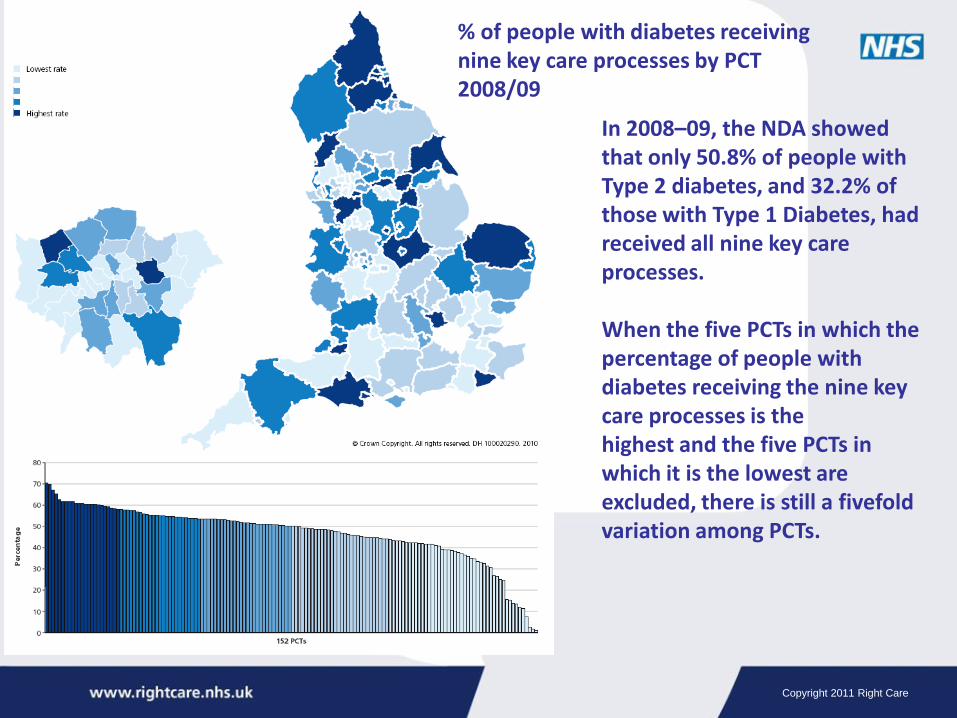
% of people with diabetes receiving nine key care processes by PCT 2008/09
In 2008–09, the NDA showed that only 50.8% of people with Type 2 diabetes, and 32.2% of those with Type 1 Diabetes, had received all nine key care processes. When the five PCTs in which the percentage of people with diabetes receiving the nine key care processes is the highest and the five PCTs in which it is the lowest are excluded, there is still a fivefold variation among PCTs.
24
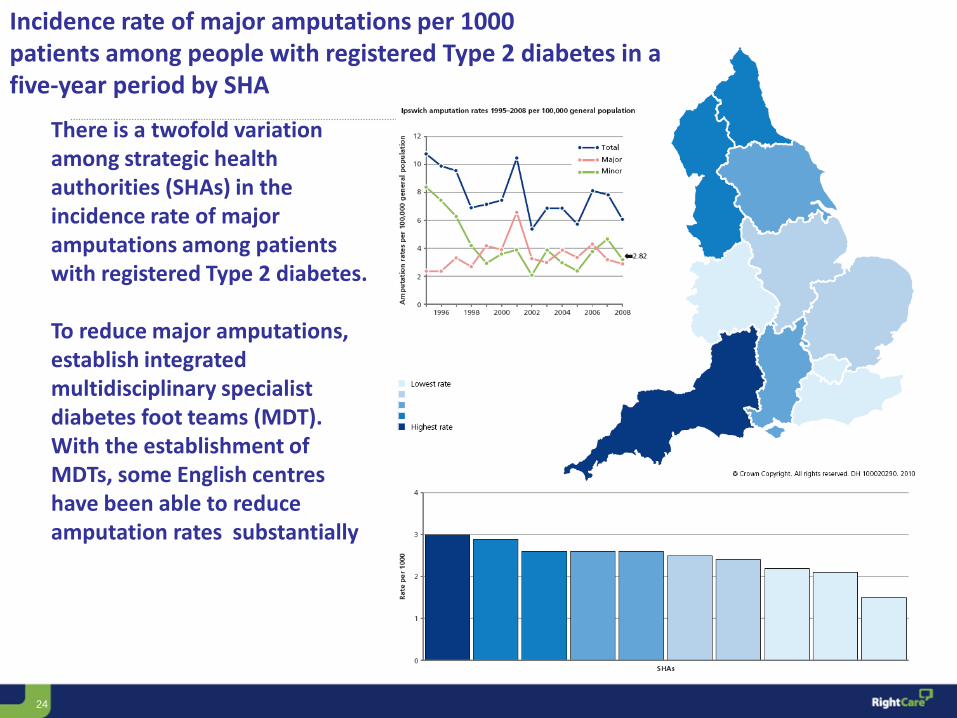
Incidence rate of major amputations per 1000 patients among people with registered Type 2 diabetes in a five-year period by SHA
There is a twofold variation among strategic health authorities (SHAs) in the incidence rate of major amputations among patients with registered Type 2 diabetes. To reduce major amputations, establish integrated multidisciplinary specialist diabetes foot teams (MDT). With the establishment of MDTs, some English centres have been able to reduce amputation rates substantially
25
When analysed by local authority boundary, the variation in rate of provision of hip replacement per 1000 people is almost 14-fold (see map and London inset). When the 10 local authorities with the highest rates and the 10 local authorities with the lowest rates are excluded, there is a greater than fourfold variation. When analysed by PCT boundary, the variation in rates of expenditure for cemented primary hip replacement per 1000 population is 16-fold. When the five PCTs with the highest rates and the five PCTs with the lowest rates are excluded, there is a sixfold variation (see bar chart 1).
26
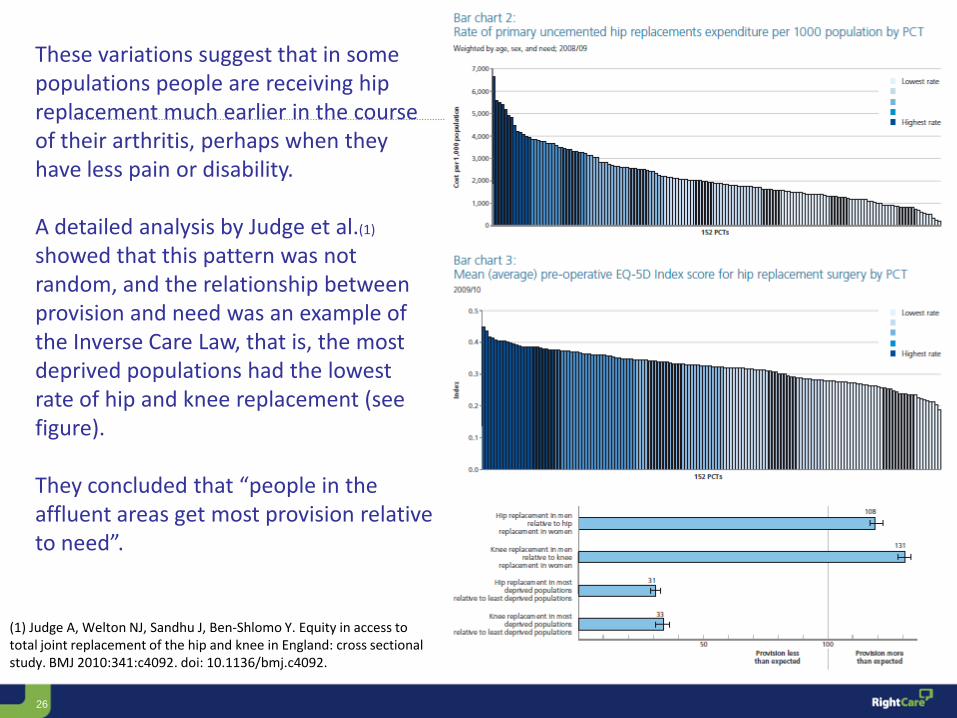
These variations suggest that in some populations people are receiving hip replacement much earlier in the course of their arthritis, perhaps when they have less pain or disability. A detailed analysis by Judge et al.(1) showed that this pattern was not random, and the relationship between provision and need was an example of the Inverse Care Law, that is, the most deprived populations had the lowest rate of hip and knee replacement (see figure). They concluded that “people in the affluent areas get most provision relative to need”.
(1) Judge A, Welton NJ, Sandhu J, Ben-Shlomo Y. Equity in access to total joint replacement of the hip and knee in England: cross sectional study. BMJ 2010:341:c4092. doi: 10.1136/bmj.c4092.
27
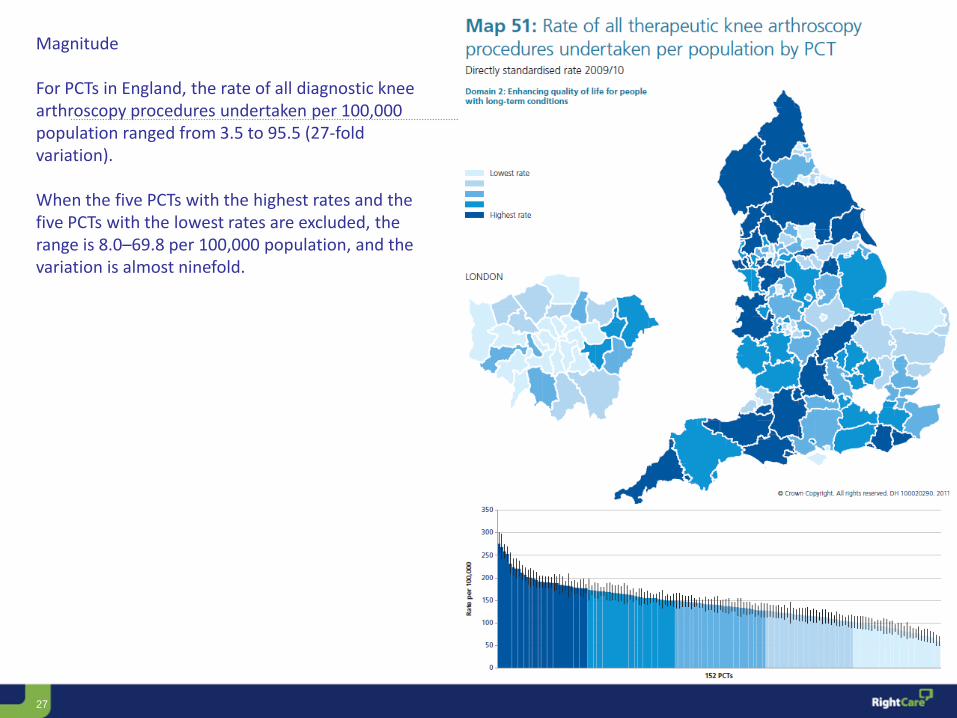
Magnitude For PCTs in England, the rate of all diagnostic knee arthroscopy procedures undertaken per 100,000 population ranged from 3.5 to 95.5 (27-fold variation). When the five PCTs with the highest rates and the five PCTs with the lowest rates are excluded, the range is 8.0–69.8 per 100,000 population, and the variation is almost ninefold.
28
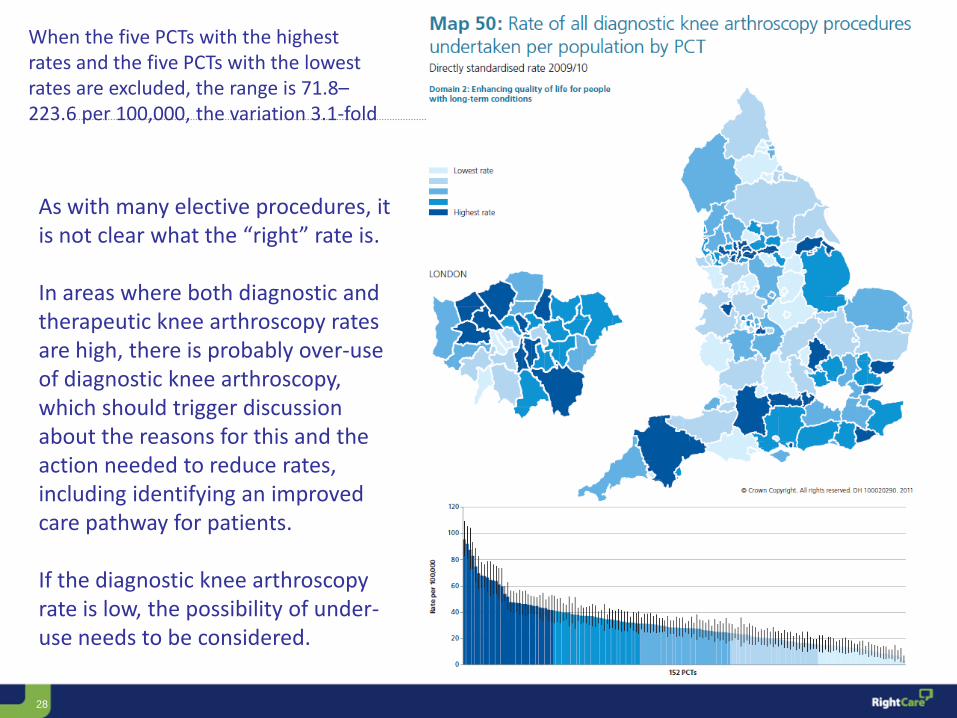
As with many elective procedures, it is not clear what the “right” rate is. In areas where both diagnostic and therapeutic knee arthroscopy rates are high, there is probably over-use of diagnostic knee arthroscopy, which should trigger discussion about the reasons for this and the action needed to reduce rates, including identifying an improved care pathway for patients. If the diagnostic knee arthroscopy rate is low, the possibility of under-use needs to be considered.
When the five PCTs with the highest rates and the five PCTs with the lowest rates are excluded, the range is 71.8–223.6 per 100,000, the variation 3.1-fold
29
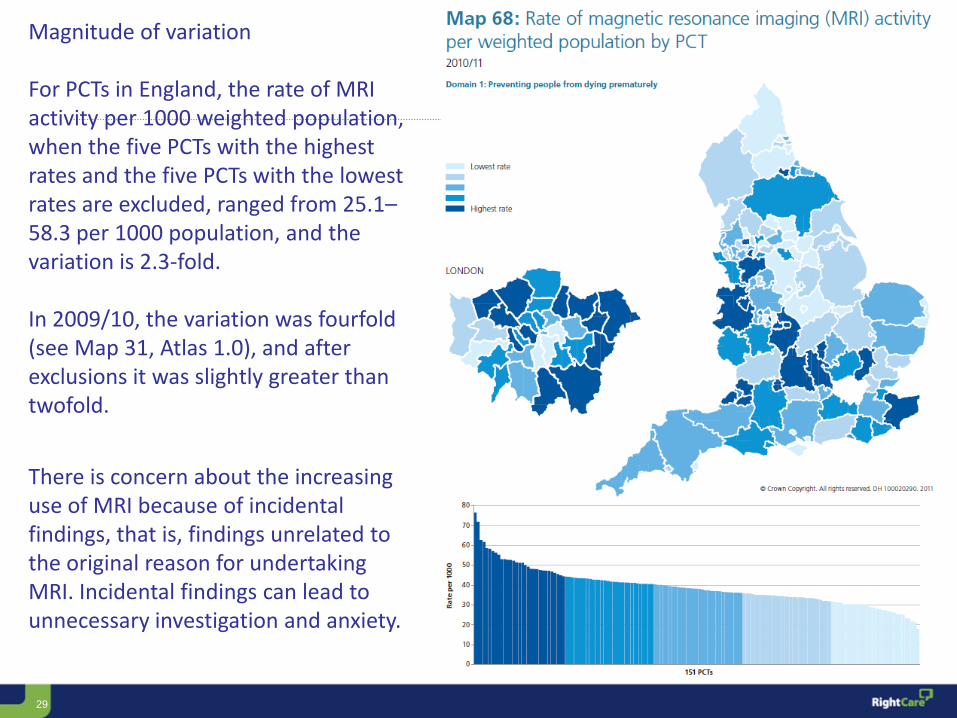
Magnitude of variation For PCTs in England, the rate of MRI activity per 1000 weighted population, when the five PCTs with the highest rates and the five PCTs with the lowest rates are excluded, ranged from 25.1–58.3 per 1000 population, and the variation is 2.3-fold. In 2009/10, the variation was fourfold (see Map 31, Atlas 1.0), and after exclusions it was slightly greater than twofold.
There is concern about the increasing use of MRI because of incidental findings, that is, findings unrelated to the original reason for undertaking MRI. Incidental findings can lead to unnecessary investigation and anxiety.
30
Does it Need to be at a National Level?
Tackling Variation at the Local level
31
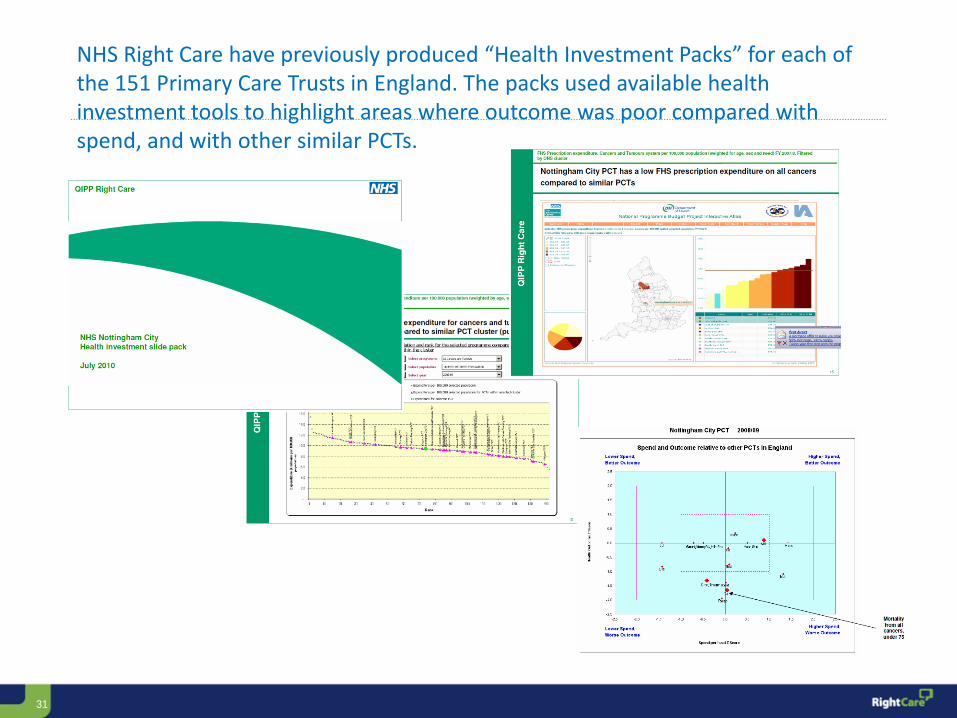
NHS Right Care have previously produced “Health Investment Packs” for each of the 151 Primary Care Trusts in England. The packs used available health investment tools to highlight areas where outcome was poor compared with spend, and with other similar PCTs.