Vol-2 Issue-6 2016 IJARIIE-ISSN(O)-2395-4396 3315 www.ijariie.com 419 Reduction of power oscillation damping using modified recursive least square algorithm and STATCOM with energy storage P. Ganesh Kumar reddy 1 , M . Purishotham 2 1 PG STUDENT, DEPARTMENT OF ELECTRICAL &ELECTRONICS ENGINEERIG(PE), SHREE INSTITUTE OF TECHNICAL EDUCATION,THIRUPATHI A.P ,INDIA 2 ASSISTANT PROFISER , DEPARTMENT OF ELECTRICAL &ELECTRONICS ENGINEERIG(PE), SHREE INSTITUTE OF TECHNICAL EDUCATION,THIRUPATHI A.P ,INDIA ABSTRACT STATIC synchronous compensator (STATCOM) is a key device for reinforcement of the stability in an ac power system. This device has been applied both at distribution level to mitigate power quality phenomena and at transmission leve l for voltage control and power oscillation damping (POD) [1] –[3]. Although typically used for reactive power injection only, by equipping the STATCOM with an energy storage connected to the dc-link of the converter,a more flexible control of the transmission system can be achieved [4], [5] The control of STATCOM with energy storage (named here after as E-STATCOM) for power system stability enhancement has been discussed in the literature[7]–[9].However, the impact of the location of the E- STATCOM on its dynamic performance is typically not treated. When active power injection is used for POD, the location of the E-STATCOM has a significant impact on its dynamic performance. Moreover, the typical control strategy of the device for POD available in the literature is similar to the one utilized for power system stabilizer(PSS)[6], where a series of wash-out and lead-lag filter links are used to generate the control input signals. This kind of control strategy is effective only at the operating point where the design of the filter links is optimized, and its speed of response is limited by the frequency of the electromechanical oscillations. In this project, a control strategy for the E-STATCOM when used for POD is proposed, the control strategy optimizes the injection of active and reactive power to provide uniform damping at various locations in the power system. It will be shown that the implemented control algorithm is robust against system parameter uncertainties The power arising out of the wind turbine when connected to a grid system concerning the power quality measurements, are: active power, reactive power, voltage sag, voltage swell, flicker, harmonics, and electrical behavior of switching operation. Fuzzy Logic has two different meanings. In a narrow sense, Fuzzy Logic is a logical system, which is an extension of multivalve logic. However, in a wider sense Fuzzy Logic is almost synonymous with the theory of Fuzzy sets, a theory which relates to classes of objects with un sharp boundaries in which membership is a matter of degree. In this paper fuzzy logic controller is used for controlling the DC capacitor voltage. Simulations using MATLAB / SIMULINK are carried out to verify the performance of the proposed controller. Keyword : Energy storage, low-frequency oscillation, power oscillation damping (POD), recursive least square (RLS), static synchronous compensator (STATCOM) with energy storge
Transcript
Vol-2 Issue-6 2016 IJARIIE-ISSN(O)-2395-4396
3315 www.ijariie.com 419
Reduction of power oscillation damping using
modified recursive least square algorithm and
STATCOM with energy storage
P. Ganesh Kumar reddy1, M . Purishotham
2
1 PG STUDENT, DEPARTMENT OF ELECTRICAL &ELECTRONICS ENGINEERIG(PE), SHREE
INSTITUTE OF TECHNICAL EDUCATION,THIRUPATHI A.P ,INDIA 2 ASSISTANT PROFISER , DEPARTMENT OF ELECTRICAL &ELECTRONICS ENGINEERIG(PE),
SHREE INSTITUTE OF TECHNICAL EDUCATION,THIRUPATHI A.P ,INDIA
ABSTRACT
STATIC synchronous compensator (STATCOM) is a key device for reinforcement of the stability in an ac
power system. This device has been applied both at distribution level to mitigate power quality phenomena and at
transmission leve l for voltage control and power oscillation damping (POD) [1]–[3]. Although typically used for
reactive power injection only, by equipping the STATCOM with an energy storage connected to the dc-link of the
converter,a more flexible control of the transmission system can be achieved [4], [5]
The control of STATCOM with energy storage (named here after as E-STATCOM) for power system
stability enhancement has been discussed in the literature[7]–[9].However, the impact of the location of the E-
STATCOM on its dynamic performance is typically not treated. When active power injection is used for POD, the
location of the E-STATCOM has a significant impact on its dynamic performance. Moreover, the typical control
strategy of the device for POD available in the literature is similar to the one utilized for power system
stabilizer(PSS)[6], where a series of wash-out and lead-lag filter links are used to generate the control input signals.
This kind of control strategy is effective only at the operating point where the design of the filter links is optimized,
and its speed of response is limited by the frequency of the electromechanical oscillations.
In this project, a control strategy for the E-STATCOM when used for POD is proposed, the control strategy
optimizes the injection of active and reactive power to provide uniform damping at various locations in the power
system. It will be shown that the implemented control algorithm is robust against system parameter uncertainties
The power arising out of the wind turbine when connected to a grid system concerning the power quality
measurements, are: active power, reactive power, voltage sag, voltage swell, flicker, harmonics, and electrical
behavior of switching operation. Fuzzy Logic has two different meanings. In a narrow sense, Fuzzy Logic is a
logical system, which is an extension of multivalve logic. However, in a wider sense Fuzzy Logic is almost
synonymous with the theory of Fuzzy sets, a theory which relates to classes of objects with un sharp boundaries in
which membership is a matter of degree. In this paper fuzzy logic controller is used for controlling the DC capacitor
voltage. Simulations using MATLAB / SIMULINK are carried out to verify the performance of the proposed
controller.
Keyword : Energy storage, low-frequency oscillation, power oscillation damping (POD), recursive least square
(RLS), static synchronous compensator (STATCOM) with energy storge
Vol-2 Issue-6 2016 IJARIIE-ISSN(O)-2395-4396
3315 www.ijariie.com 420
1.INTRODUCTION
1.1 Introduction:
In an ac power system static synchronous compensator (STATCOM) is a key device for reinforcement of
the stability. To mitigate power quality phenomena and at transmission level this device has been applied both at
distribution level for voltage control and power oscillation damping (POD). Although typically used for reactive
power injection only, a more flexible control of the transmission system can be achieved by equipping the
STATCOM with an energy storage connected to the dc-link of the converter. For power flow management and
voltage control An installation of a STATCOM with energy storage is already found in the U.K. From the energy
sources other distributed generation will pave the way into the power system and auxiliary stability enhancement
function is possible
During transient an injection of active power is used temporarily. In systems incorporating the stability
enhancement function where active power injection is primarily used for other purposes could be attractive. In the
power system low-frequency electromechanical oscillations (in the range of 0.2 to 2 Hz) are commonly used and
especially in a weak transmission system are a cause for concern regarding secure system operation. In this regard,
FACTS controllers, to enhance stability of the power system both in shunt and series configuration, have been
widely used. In the specific case at the point of common coupling (PCC) swing stability and POD can be achieved
with the shunt connected FACTS controllers [STATCOM and static var compensator (SVC)], For this kind of
applications one drawback of the shunt configuration is that the PCC voltage must be regulated within specific limits
(typically between 10% of the rated voltage) by modulating the voltage using reactive power injection, and also this
is reduces the amount of damping that can be provided by the compensator.
Moreover, to modulate the PCC voltage the amount of injected reactive power needed at the connection
point, it depends on the short circuit impedance of the grid seen. On the other hand it affects the PCC-voltage angle
(transmission lines are effectively reactive) the control of STATCOM with energy storage (named hereafter as E-
STATCOM) without varying the voltage magnitude significantly injection of active power. In the literature for
power system stability enhancement has been discussed. However, the impact of the location of the E-STATCOM
on its dynamic performance is typically not treated. For POD when active power injection is used, the location of the
E-STATCOM has a significant impact on its dynamic performance. Moreover, in the literature the typical control
strategy of the device for POD available is similar to the one utilized for power system stabilizer (PSS) [9], to
generate the control input signals where a series of wash-out and lead-lag filter links are used. At the operating point
this kind of control strategy is only effective and where the design of the filter links is optimized. By the frequency
of the electromechanical oscillations its speed of response is limited.
A control strategy for the E-STATCOM when used for POD will be investigated in this paper. In the
system thanks to the selected local signal quantities measured, to provide uniform damping at various locations in
the power system the control strategy optimizes the injection of active and reactive power. Against system parameter
uncertainties it will be shown that the implemented control algorithm is robust. To extract the required control
signals from locally measured signals a modified recursive least square (RLS) algorithm as described will be used.
Finally, by using simulation results the effectiveness of the proposed control strategy will be validated and verified.
1.2 Static Synchronous Compensator (STATCOM)
The STATCOM could be a solid-state-based power converter version of the SVC. Operative as a shunt-
connected SVC, its capacitive or inductive output currents is controlled severally from its terminal AC bus voltage.
Compared to the SVC STATCOM provides abundant faster response because of the fast-switching characteristic of
power converters. Additionally, within the event of a speedy modification in system voltage, the capacitance voltage
does not change instantaneously; thus, STATCOM effectively reacts for the specified responses. For instance, if the
system voltage drops for any reason, there is a bent for STATCOM to inject capacitive power to support the unfit
voltages. STATCOM is capable of high dynamic performance and on the common coupling voltage its
compensation does not rely. Therefore, STATCOM is incredibly effective during the ability system disturbances.
Moreover, much analysis confirms many blessings of STATCOM. These blessings compared to different
shunt compensators include:
Size, weight, and value reduction
Equality of leading lagging and output
Precise and continuous reactive power control with fast response
Possible active harmonic filter capability
Vol-2 Issue-6 2016 IJARIIE-ISSN(O)-2395-4396
3315 www.ijariie.com 421
This chapter describes the structure, basic operating principle and characteristics of STATCOM. In
addition, the concept of voltage source converters and the corresponding control techniques are illustrated.
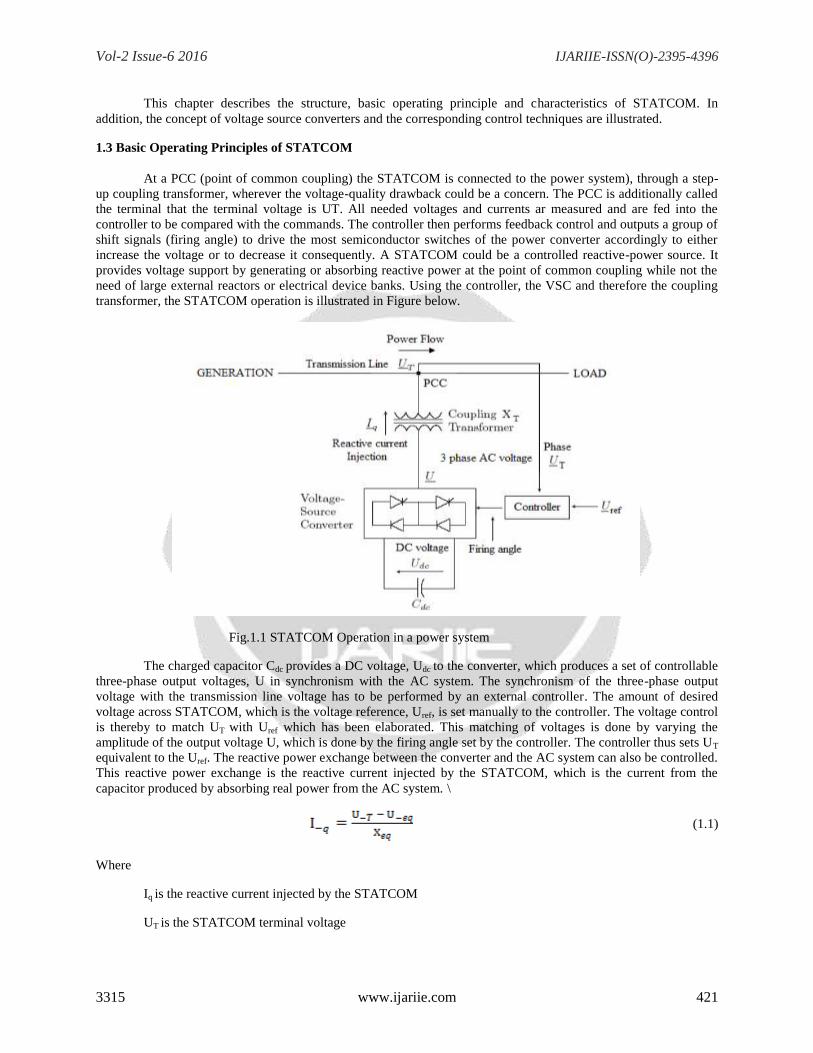
1.3 Basic Operating Principles of STATCOM
At a PCC (point of common coupling) the STATCOM is connected to the power system), through a step-
up coupling transformer, wherever the voltage-quality drawback could be a concern. The PCC is additionally called
the terminal that the terminal voltage is UT. All needed voltages and currents ar measured and are fed into the
controller to be compared with the commands. The controller then performs feedback control and outputs a group of
shift signals (firing angle) to drive the most semiconductor switches of the power converter accordingly to either
increase the voltage or to decrease it consequently. A STATCOM could be a controlled reactive-power source. It
provides voltage support by generating or absorbing reactive power at the point of common coupling while not the
need of large external reactors or electrical device banks. Using the controller, the VSC and therefore the coupling
transformer, the STATCOM operation is illustrated in Figure below.
Fig.1.1 STATCOM Operation in a power system
The charged capacitor Cdc provides a DC voltage, Udc to the converter, which produces a set of controllable
three-phase output voltages, U in synchronism with the AC system. The synchronism of the three-phase output
voltage with the transmission line voltage has to be performed by an external controller. The amount of desired
voltage across STATCOM, which is the voltage reference, Uref, is set manually to the controller. The voltage control
is thereby to match UT with Uref which has been elaborated. This matching of voltages is done by varying the
amplitude of the output voltage U, which is done by the firing angle set by the controller. The controller thus sets UT
equivalent to the Uref. The reactive power exchange between the converter and the AC system can also be controlled.
This reactive power exchange is the reactive current injected by the STATCOM, which is the current from the
capacitor produced by absorbing real power from the AC system. \
(1.1)
Where
Iq is the reactive current injected by the STATCOM
UT is the STATCOM terminal voltage
Vol-2 Issue-6 2016 IJARIIE-ISSN(O)-2395-4396
3315 www.ijariie.com 422
Ueq is the equivalent Thevenin Voltage seen by the STATCOM
Xeq is the equivalent Thevenin Reactance of the power system seen by the STATCOM
The AC system and reactive power is generated if the amplitude of the output voltage U is increased above
that of the AC system voltage, UT, the STATCOM is seen as a conductor when a leading current is produced, i.e.
The amplitude of the output voltage decreasing below that of the AC system a lagging current results and in this
case reactive power is absorbed the STATCOM is seen as an inductor. No power exchange takes place if the
amplitudes are equal.
In the case of the DC capacitor, by the internal losses of the converter the energy stored in this capacitor
would be consumed and a practical converter is not lossless. The output voltages of the converter lag the AC system
voltages by a small angle, δ, from the AC system the converter absorbs a small amount of active
2. RECURSIVE LEAST SQUARE ALGORITHM
2.1 Introduction:
"Least squares" means that the overall solution minimizes the sum of the squares of the errors made in the
results of every single equation .To the approximate solution of over determined systems in which there are more
equations than unknowns the method of least squares is a standard approach, i.e., sets of equations.
The most important application is in data fitting. In the least squares the best fit sense minimizes the sum
of squared residuals, by a model a residual being the difference between an observed value and the fitted value
provided then simple regression and least squares methods have problems for fitting errors-in-variables models may
be considered instead of that for least squares in such cases, the methodology required .When in the independent
variable the problem has substantial uncertainties.
2.2 Least Squares
Depending on whether or not the residuals are linear Least squares problems fall into two categories: linear
or ordinary least squares and non-linear least squares, in all unknowns. In statistical regression analysis the linear
least-squares problem occurs; it has a closed-form solution. A closed-form solution (or closed-form expression) is
any formula that can be evaluated in a finite number of standard operations. By iterative refinement the non-linear
problem has no closed-form solution and is usually solved; the system is approximated by a linear one, thus the core
calculation is similar in both cases at each iteration.
As a method of moments estimator if the experimental errors have a normal distribution and can also be
derived Least squares corresponds to the maximum likelihood criterion. In terms of linear functions the following
discussion is mostly presented but the use of least-squares is valid and practical for more general families of
functions. Also, the least-squares method may be used by iteratively applying local quadratic approximation to the
likelihood, to fit a generalized linear model.
Based on squared distances using an objective function for the topic of approximating a function by a sum
of others , see least squares (function approximation).
Vol-2 Issue-6 2016 IJARIIE-ISSN(O)-2395-4396
3315 www.ijariie.com 423
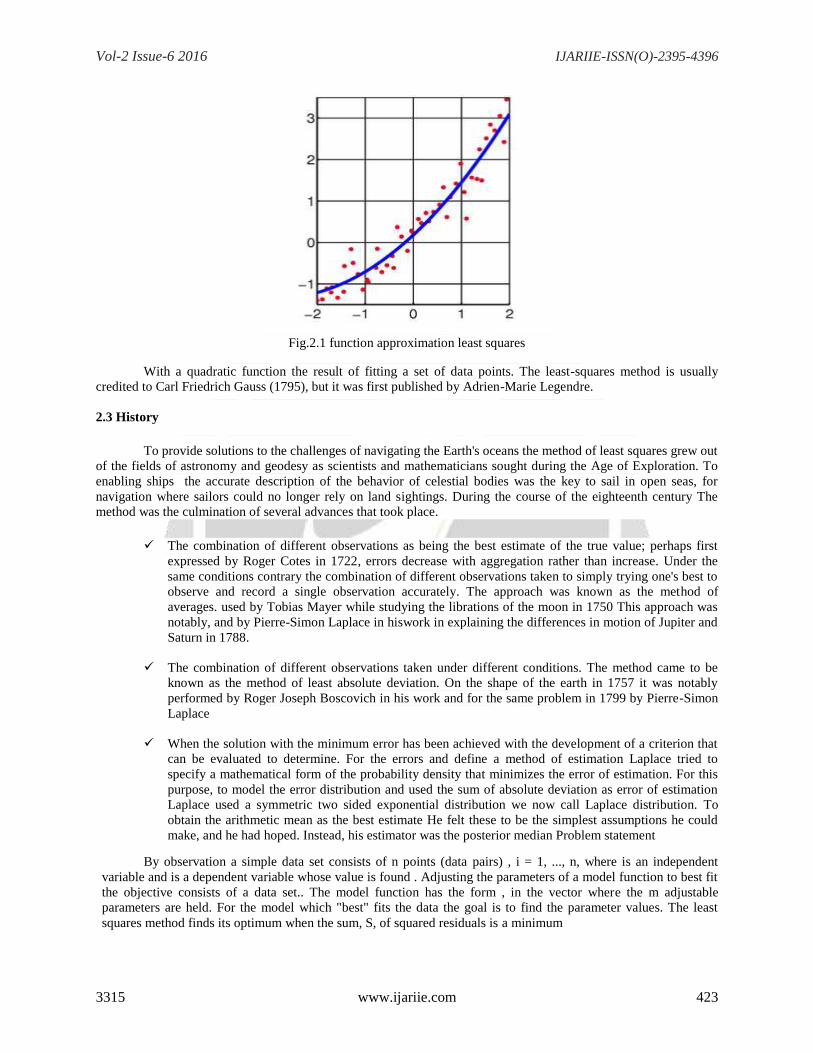
Fig.2.1 function approximation least squares
With a quadratic function the result of fitting a set of data points. The least-squares method is usually
credited to Carl Friedrich Gauss (1795), but it was first published by Adrien-Marie Legendre.
2.3 History
To provide solutions to the challenges of navigating the Earth's oceans the method of least squares grew out
of the fields of astronomy and geodesy as scientists and mathematicians sought during the Age of Exploration. To
enabling ships the accurate description of the behavior of celestial bodies was the key to sail in open seas, for
navigation where sailors could no longer rely on land sightings. During the course of the eighteenth century The
method was the culmination of several advances that took place.
The combination of different observations as being the best estimate of the true value; perhaps first
expressed by Roger Cotes in 1722, errors decrease with aggregation rather than increase. Under the
same conditions contrary the combination of different observations taken to simply trying one's best to
observe and record a single observation accurately. The approach was known as the method of
averages. used by Tobias Mayer while studying the librations of the moon in 1750 This approach was
notably, and by Pierre-Simon Laplace in hiswork in explaining the differences in motion of Jupiter and
Saturn in 1788.
The combination of different observations taken under different conditions. The method came to be
known as the method of least absolute deviation. On the shape of the earth in 1757 it was notably
performed by Roger Joseph Boscovich in his work and for the same problem in 1799 by Pierre-Simon
Laplace
When the solution with the minimum error has been achieved with the development of a criterion that
can be evaluated to determine. For the errors and define a method of estimation Laplace tried to
specify a mathematical form of the probability density that minimizes the error of estimation. For this
purpose, to model the error distribution and used the sum of absolute deviation as error of estimation
Laplace used a symmetric two sided exponential distribution we now call Laplace distribution. To
obtain the arithmetic mean as the best estimate He felt these to be the simplest assumptions he could
make, and he had hoped. Instead, his estimator was the posterior median Problem statement
By observation a simple data set consists of n points (data pairs) , i = 1, ..., n, where is an independent
variable and is a dependent variable whose value is found . Adjusting the parameters of a model function to best fit
the objective consists of a data set.. The model function has the form , in the vector where the m adjustable
parameters are held. For the model which "best" fits the data the goal is to find the parameter values. The least
squares method finds its optimum when the sum, S, of squared residuals is a minimum
Vol-2 Issue-6 2016 IJARIIE-ISSN(O)-2395-4396
3315 www.ijariie.com 424
3.CONTROLLERS
3.1 Introduction:
In order to get desired output we require controller, controller may be open loop or closed loop. They uses
control elements there are basically three control element proportional, integral, derivative elements. In this chapter
we will discuss about differ controls.
3.2 P-I Controller
To eliminate the steady state error P-I controller is mainly used resulting from P controller. However, in
terms of the speed of the response it has a negative impact and overall stability of the system. The speed of the
system is not an issue in areas this controller is mostly used. It cannot decrease the rise time and eliminate the
oscillations to predict the future errors of the system P-I controller has no ability. If applied, any amount of I
guarantees set point overshoot.
Fig.4.1. PID controller
In industrial control systemsa proportional–integral–derivative controller (PID controller) is a control
loop feedback mechanism(controller) commonly used. The difference between a measured processes a PID
controller continuously calculates an error value as variable and a desired set point. By adjustment of a control
variable the controller attempts to minimize the error over time, such as the position of a control valve, a damper, or
the power supplied to a heating element, to a new value determined by a weighted sum.
+ (4.1)
Where
Kp : proportional gain ,a tuning parameter
K i: integral gain ,a tuning parameter
Kd : derivative gain ,a tuning parameter
E : error =sp - pv
T : time (the present)
T : Variable of integration takes on values from time o to present time t
Equivalently, the transfer function in the Laplace Domain of the PID controller is
L(s)= + + (4.2)
where
: complex number frequency
3.3 Proportional Term:
The proportional term produces an output value that is proportional to the current error value. By
multiplying the error the proportional response can be adjusted by a constant Kp, called the proportional gain
As shown in Fig. 4.6, the control of the E-STATCOM consists of an outer control loop and an inner current
control loop. The outer control loop, which can be an ac voltage, for the inner current controller dc-link voltage or
POD controller, sets the reference current. Depends on the type of outer loop control the generic measured signal.
To track the grid-voltage angle from the grid-voltage vector the control algorithm is implemented in -reference
frame where a phase-locked loop (PLL) is used. By synchronizing the PLL with the grid-voltage vector, the -and -
components of the injected current ( and ) control the injected active and reactive power, respectively. The
superscript ―‖denotes the corresponding reference signals in the notation as shown in Fig.4.6.
Fig.4.6. Block diagram of the control of E-STATCOM
The outer control loop is assumed to be a POD controller, and the detail of the block will be described in
this paper. For this reason, in the steady state we assume that the injected active and reactive powers are zero. To
guarantee stability when designing a cascaded controller, the speed of outer control loop is typically selected to be
much slower than the inner one. This means that the current controller can be considered infinitely fast when
dsigning the parameters of the outer controller loop. Therefore, for analysis purpose the E-STATCOM can be
modeled as a controlled ideal current source, as depicted in the equivalent circuit in Fig.4.7.
Fig.4.7. Equivalent circuit for two-machine system with E-STATCOM
From the generators the level of power oscillation damping provided by the converter depends on how
much the active power output is modulated, as shown in Fig. 3. Due to injected active the change in active power
output from the generators and reactive power from the E-STATCOM is calculated as in
(4.7)
Vol-2 Issue-6 2016 IJARIIE-ISSN(O)-2395-4396
3315 www.ijariie.com 427
where and represent the change in active power from the corresponding generators due to injected active power and
reactive power ,respectively. ,and are given by
(4.8)
In idle mode where the converter is the initial steady-state PCC voltage magnitude and generator rotor
angles correspond to the operating point. In the appendix a derivation to the expressions in (2) is given. Depends on
the location of the converter as well as on the amount of injected active and reactive power it can be seen from (2)
and (3) that the change in active power output from the generators. Moreover, depends on the magnitude and
direction of transmitted. From the generators it can be understood from (2) that the effect of reactive power injection
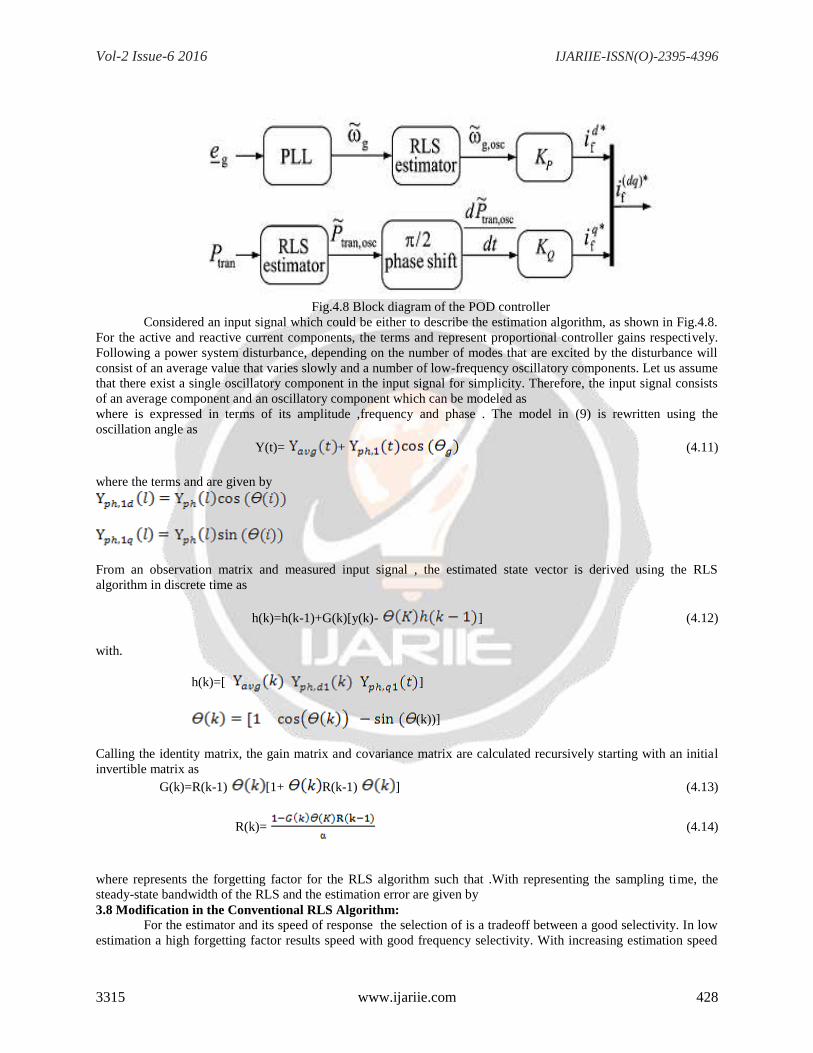
4.7 POD Controller Design:
The derivation of the POD controller from locally measured signals will be made in this section.
3.7.1 Derivation of Control Input Signals
From each generator the active power output should change in proportion to the change in its
speed to provide damping and also considering the simplified two-machine system in Fig.1. Depends on
the parameter , i.e., on t he location of the E-STATCOM it can be observed that the effect of the power
injected by the compensator on the generator active power output highly. Using the equivalent system in
Fig. 4.7, a control input signal that contains information on the speed variation of the generators can be
derived. The variation of the locally measured signals, when the E-STATCOM is not injecting any current,
and using the dynamic generator rotor angles at different E-STATCOM connection points and is given by
(4. 9)
Under the assumption from a small-signal point of view and that the PCC-voltage magnitude
along the line does not change significantly, from the PCC-voltage phase and transmitted active power the
required control input signals can be derived as
(4.10)
3.7.2 Estimation of Control Input Signals
For various power system effective power oscillation damping operating points and E-STATCOM
locations require accurate, fast and adaptive estimation of the critical power oscillation frequency component is
described in the Introduction. Based on a modified RLS algorithm this is achieved by the use of an estimation
method. In the previous subsection, for controlling the active and reactive power injection the derivative of the PCC-
voltage phase and the transmitted power should be estimated, respectively described. The aim of the algorithm is to
estimate the signal components that consist of only the low-frequency electromechanical oscillation in the measured
signals. Therefore by using a PLL with bandwidth much higher than the frequency of electromechanical oscillations,
from the change in frequency estimate of the PLL the derivative of the PCC-voltage phase can be obtained.
Therefore, from the frequency estimate of the PLL the low-frequency electromechanical oscillation
component can be extracted directly. On the other hand, by extracting the low-frequency electromechanical
oscillation component the derivative of transmitted power is estimated. From the measured signal, and then applying
a phase shift to the estimated oscillation frequency component. From the E-STATCOM the reference injected active
and reactive current components can be calculated to setup the POD controller as in Fig. which contain only a
particular oscillation frequency component, 4 from the estimated control input signals.
Vol-2 Issue-6 2016 IJARIIE-ISSN(O)-2395-4396
3315 www.ijariie.com 428
Fig.4.8 Block diagram of the POD controller
Considered an input signal which could be either to describe the estimation algorithm, as shown in Fig.4.8.
For the active and reactive current components, the terms and represent proportional controller gains respectively.
Following a power system disturbance, depending on the number of modes that are excited by the disturbance will
consist of an average value that varies slowly and a number of low-frequency oscillatory components. Let us assume
that there exist a single oscillatory component in the input signal for simplicity. Therefore, the input signal consists
of an average component and an oscillatory component which can be modeled as
where is expressed in terms of its amplitude ,frequency and phase . The model in (9) is rewritten using the
oscillation angle as
Y(t)= + (4.11)
where the terms and are given by
From an observation matrix and measured input signal , the estimated state vector is derived using the RLS
algorithm in discrete time as
h(k)=h(k-1)+G(k)[y(k)- ] (4.12)
with.
h(k)=[ ]
(k))]
Calling the identity matrix, the gain matrix and covariance matrix are calculated recursively starting with an initial
invertible matrix as
G(k)=R(k-1) [1+ R(k-1) ] (4.13)
R(k)= (4.14)
where represents the forgetting factor for the RLS algorithm such that .With representing the sampling time, the
steady-state bandwidth of the RLS and the estimation error are given by
3.8 Modification in the Conventional RLS Algorithm: For the estimator and its speed of response the selection of is a tradeoff between a good selectivity. In low
estimation a high forgetting factor results speed with good frequency selectivity. With increasing estimation speed
Vol-2 Issue-6 2016 IJARIIE-ISSN(O)-2395-4396
3315 www.ijariie.com 429
(decreasing ), the frequency selectivity of the algorithm reduces. For this reason, in order to achieve fast transient
estimation the conventional RLS algorithm must be modified without compromising its steady-state selectivity. In
this paper, with the use of variable forgetting factor this is achieved as described. In steady-state when the RLS
algorithm and its bandwidth is determined. If a rapid change is detected in the input (i.e., if the estimation error
magnitude, exceeds a predefined threshold), will be modified to a smaller transient forgetting factor.
Thus, by using a high-pass filter with time constant , will be slowly increased back to its steady-state value
. Besides , depends on accurate knowledge of the oscillating frequency, the performance of the estimation method
.This frequency is dependent on the system parameters and its operating conditions. If the frequency content of the
input changes in the estimated quantities, the estimator will give rise to a phase and amplitude error. Therefore, to
track the true oscillation frequency of the input is implemented from the estimate of the oscillatory component a
frequency adaptation mechanism as described
3.9 Modification for Multiple Oscillation Modes:
Under the assumption of a single oscillatory frequency component in the input signal the investigated
control method has been derived. For future reference a brief description of how the proposed algorithm can be
extended for multi-area system with multiple oscillation modes will be briefly presented. Assuming that the input
signal contains oscillatory components, (9) must be modified as
= (4.15)
where the th oscillation mode (with )is expressed in terms of its amplitude , frequency , and phase . Using
the model in (13), the RLS described in the previous sections (including variable forgetting factor and frequency
adaptation for each considered oscillation mode) can be modified as described in Fig. 5.
Thus, to control each mode independently the POD controller in Fig. 4 can be modified accordingly.
Depends on the investigated system and needs to be calculated observe that the phase-shift applied for calculation of
the reference currents for each oscillatory mode .
3.10 Stability Analysis of System Model:
Using active and reactive power injection the mathematical model of the system in Fig. 3 is developed in
this section Using the expressions to investigate the performance of the POD controller. , the injected currents are
controlled as
(4.16)
(4.17)
where the constant is as defined in (3). The small-signal dynamic model of the two-machine system
liberalizing around an initial steady-state operating point, with the E-STATCOM in per unit is developed as in
(4.18)
where represents the rotor angle difference between the two generators and other signals as defined
previously. Assuming no mechanical damping and the initial steady-state speed of the generators set to , the
constants are derived as in
Vol-2 Issue-6 2016 IJARIIE-ISSN(O)-2395-4396
3315 www.ijariie.com 430
4.SIMULATION RESULT
4.1 Introduction: Based on the Simplified two-area four machine power system we are develop simulation
Diagram, E-STACOM, control diagram for the pulse generation, different out out wave forms by injecting different
powers real, reactive powers
4.2 Simulation Diagram:
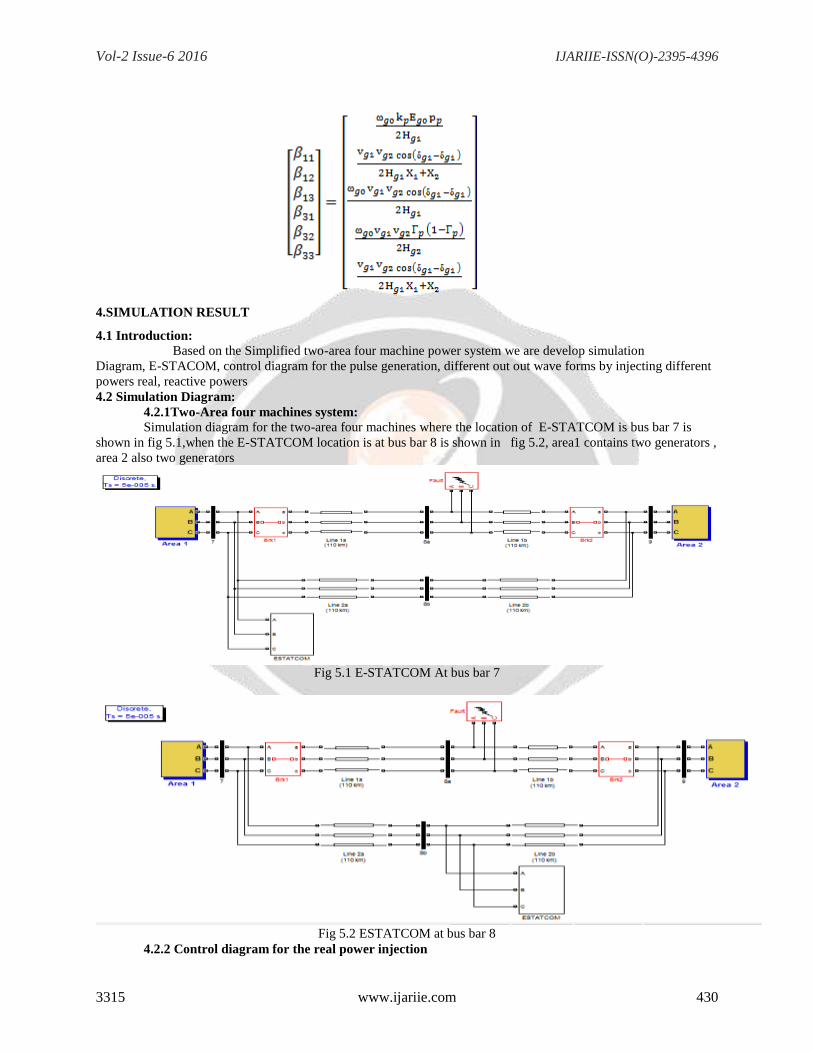
4.2.1Two-Area four machines system:
Simulation diagram for the two-area four machines where the location of E-STATCOM is bus bar 7 is
shown in fig 5.1,when the E-STATCOM location is at bus bar 8 is shown in fig 5.2, area1 contains two generators ,
area 2 also two generators
Fig 5.1 E-STATCOM At bus bar 7
Fig 5.2 ESTATCOM at bus bar 8
4.2.2 Control diagram for the real power injection
Vol-2 Issue-6 2016 IJARIIE-ISSN(O)-2395-4396
3315 www.ijariie.com 431
Fig.5.3. Real power injection
4.2.2 Control diagram for the injecting both real power and reactive powers
Fig.5.4. Both Real and Reactive power injection
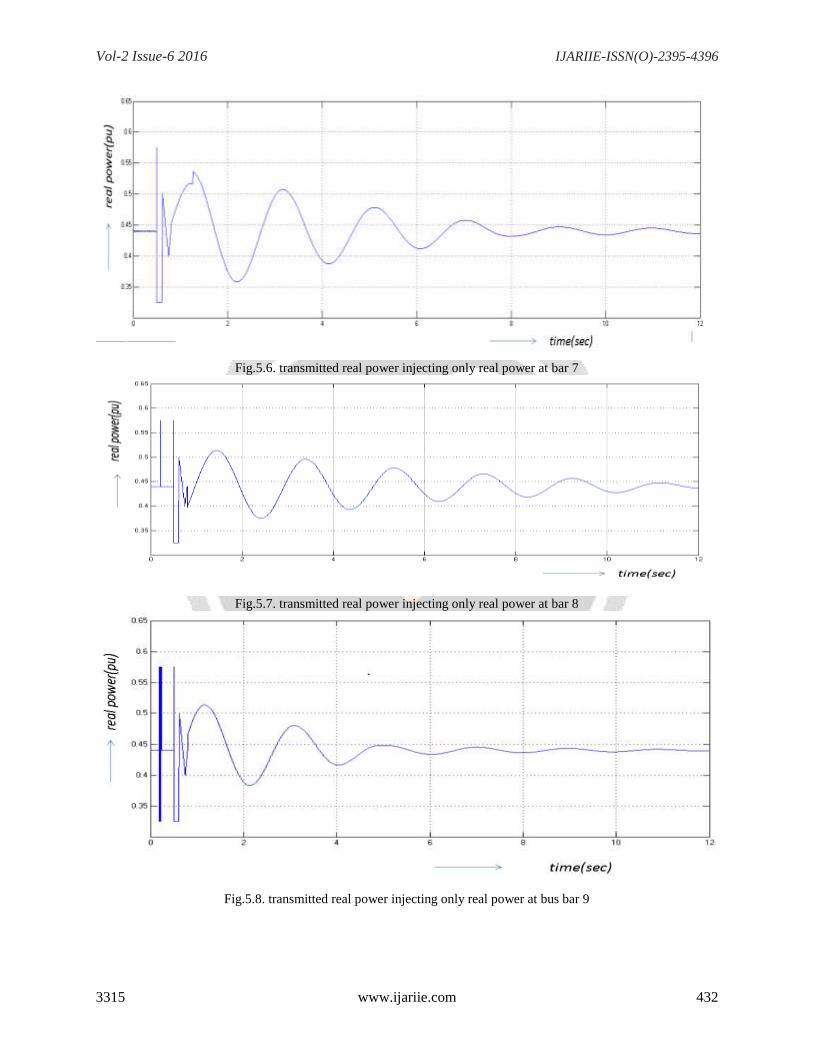
4.3 Simulation Results:
After simulation is done the output wave forms observed in the scope, by connecting ESTACOM at
different place means bus bar 7 , bus bar 8 , bus bar 9 and injecting real ,reactive powers output observed, with out
injecting real power on we plot graph between real power transmission ,time is shown infig5.5 , injecting real
power at bus bar7 the figer shown in fig5.6 , injecting real power at bus bar8 the shown in fig.5.7., injecting real
power at bus bar9 the shown in fig5.8
Fig.4.5. transmitted real power without RLS algorithm
Vol-2 Issue-6 2016 IJARIIE-ISSN(O)-2395-4396
3315 www.ijariie.com 432
Fig.5.6. transmitted real power injecting only real power at bar 7
Fig.5.7. transmitted real power injecting only real power at bar 8
Fig.5.8. transmitted real power injecting only real power at bus bar 9
Vol-2 Issue-6 2016 IJARIIE-ISSN(O)-2395-4396
3315 www.ijariie.com 433
Fig.5.9. transmitted real power injecting both real and reactive power at bus bar 9
5. Conclusion:
Two area four machine model of power system, an adaptive power oscillation damping controller by E-
STATCOM has been developed .for this development RLS algorithm has been used ,the dynamic performance of
the pod controller to provide effective damping at various connection points of E-STACOM has been validated
through simulation software
it has been shown that active power injection is minimized at various points in power system where its
impact on POD is negligible, by using RLS filter to the the pod controller power oscillation damping is minimized
,during fault period the transient stability of power system is improved with the E- STACOM,E- STACOM can
inject active or reactive or both real and reactive power.
6. Future Scope:
Power oscillation damping is reduced in power system with E STACOM using RLS algorithm, so, instant of
connecting non-conventional energy sources in to the grid they connect to the E -STACOM as a energy storage, so
that they provide real power compensation in the power system their by stability of the power system improvement
during the disturbances.
REFERENCES
[1] N. G. Hingorani and L. Gyugyi, Understanding FACTS. Concepts and Technology of Flexible AC Transmission
Systems.NewYork,NY, USA: IEEE, 2000.
[2] G.Cao,Z.Y.Dong,Y.Wang,P.Zhang,andY.T.Oh,―VSCbased STATCOM controller for damping multi-mode
oscillations,‖ inProc. IEEE Power and Energy Soc. General Meeting—Conversion and Delivery of Electrical Energy
in the 21st Century, Jul. 2008, pp. 1–8.
[3] M. Zarghami and M. L. Crow, ―Damping inter-area oscillations in power systems by STATCOMs,‖ inProc.
40th North Amer. Power Symp., Sep. 2008, pp. 1–6.
[4] Z. Yang, C. Shen, L. Zhang, M. L. Crow, and S. Atcitty, ―Integration of a statcom and battery energy
storage,‖IEEE Trans. Power Syst., vol. 16, no. 2, pp. 254–260, May 2001.
[5] A. Arulampalam, J. B. Ekanayake, and N. Jenkins, ―Application study of a STATCOM with energy
storage,‖Proc. Inst. Electr. Eng.—Gener., Transm. and Distrib., vol. 150, pp. 373–384, July 2003.
[6] N. Wade, P. Taylor, P. Lang, and J. Svensson, ―Energy storage for powerflow management and voltage control
on an 11 kV UK distribution network,‖ Prague, Czech Republic, CIRED paper 0824, Jun. 2009.
[7] A. Adamczyk, R. Teodorescu, and P. Rodriguez, ―Control of full-scale converter based wind power plants for
damping of low frequency system oscillations,‖ inProc. IEEE PowerTech, Trondheim, Norway, Jun. 2011, pp. 1–7.
Vol-2 Issue-6 2016 IJARIIE-ISSN(O)-2395-4396
3315 www.ijariie.com 434
[8] H.Xie,―Onpower-systembenefits, main-circuit design, control of Statcoms with energy storage,‖ Ph.D.
dissertation, Dept. Electr. Energy Conversion, Royal Inst. Technol., Stockholm, Sweden, 2009.
[9] P. Kundur, Power System Stability and Control.NewYork,NY, USA: McGraw-Hill, 1994. [10] K. Kobayashi,
M. Goto, K. Wu, Y. Yokomizu, and T. Matsumura, ―Power system stability improvement by energy storage type
STATCOM,‖ inProc. IEEE Power Tech Conf., Bologna, Italy, Jun. 2003, vol. 2, DOI 10.1109/PTC.2003.1304302.
[11] L. Zhang and Y. Liu, ―Bulk power system low frequency oscillation suppression by FACTS/ESS,‖ inProc.
IEEE PES Power Syst. Conf. Exp., Oct. 2004, pp. 219–226.