16
Reference Guide for UML 2.0 UML 2.0 2007 The basic and most important concepts and diagrams of UML 2.0 stripped down and analyzed at the point of view of a starter.
Reference Guide for UML 2.0
UML 2.0
2007 The basic and most important concepts and diagrams of UML 2.0 stripped down and analyzed at the point of view of a starter.
Reference Guide for UML 2.0 2007
LeMiffe © 2007 2
Index
Contents
Introduction: ............................................................................................................................ 3
Models: .................................................................................................................................... 3
Structure Diagrams ................................................................................................................... 4
I. Class Diagram ..............................................................................................................................4
II. Component Diagram ..................................................................................................................5
III. Composite Structure Diagram ...................................................................................................5
IV. Deployment Diagram ................................................................................................................6
V. Object Diagram (Also known as Instance Diagrams) ..................................................................7
VI. Package Diagram .......................................................................................................................9
Behavior Diagrams ................................................................................................................. 10
VII. Activity Diagram .....................................................................................................................10
VIII. State Diagram........................................................................................................................11
IX. Use Case Diagram ....................................................................................................................12
Interaction Diagrams .............................................................................................................. 13
X. Communication Diagram ..........................................................................................................13
XI. Sequence Diagram ..................................................................................................................14
Reference Guide for UML 2.0 2007
LeMiffe © 2007 3
Unified Modeling Language
Introduction:
In the field of software engineering, the Unified Modeling Language (UML) is a standardized
specification language for object modeling. UML is a general-purpose modeling language that
includes a graphical notation used to create an abstract model of a system, referred to as a UML
model.
UML is officially defined at the Object Management Group (OMG) by the UML metamodel, a
Meta-Object Facility metamodel (MOF). Like other MOF-based specifications, the UML metamodel
and UML models may be serialized in XMI. UML was designed to specify, visualize, construct, and
document software-intensive systems.
UML is not restricted to modeling software. UML is also used for business process modeling,
systems engineering modeling, and representing organizational structures.
UML has been a catalyst for the evolution of model-driven technologies, which include Model
Driven Development (MDD), Model Driven Engineering (MDE), and Model Driven Architecture
(MDA). By establishing an industry consensus on a graphic notation to represent common
concepts like classes, components, generalization, aggregation, and behaviors, UML has allowed
software developers to concentrate more on design and architecture.
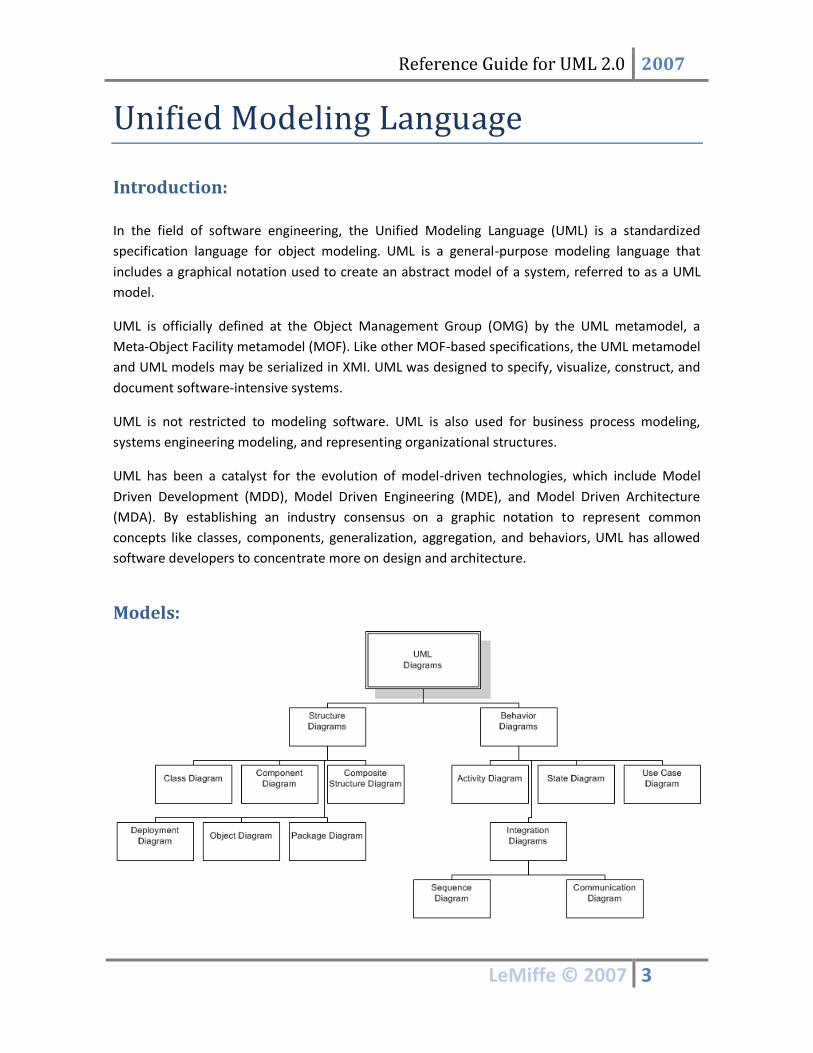
Models:
Reference Guide for UML 2.0 2007
LeMiffe © 2007 4
Diagrams
Structure Diagrams
I. Class Diagram
In the Unified Modeling Language (UML), a class diagram is a type of static structure diagram that
describes the structure of a system by showing the system's classes, their attributes, and the
relationships between the classes.
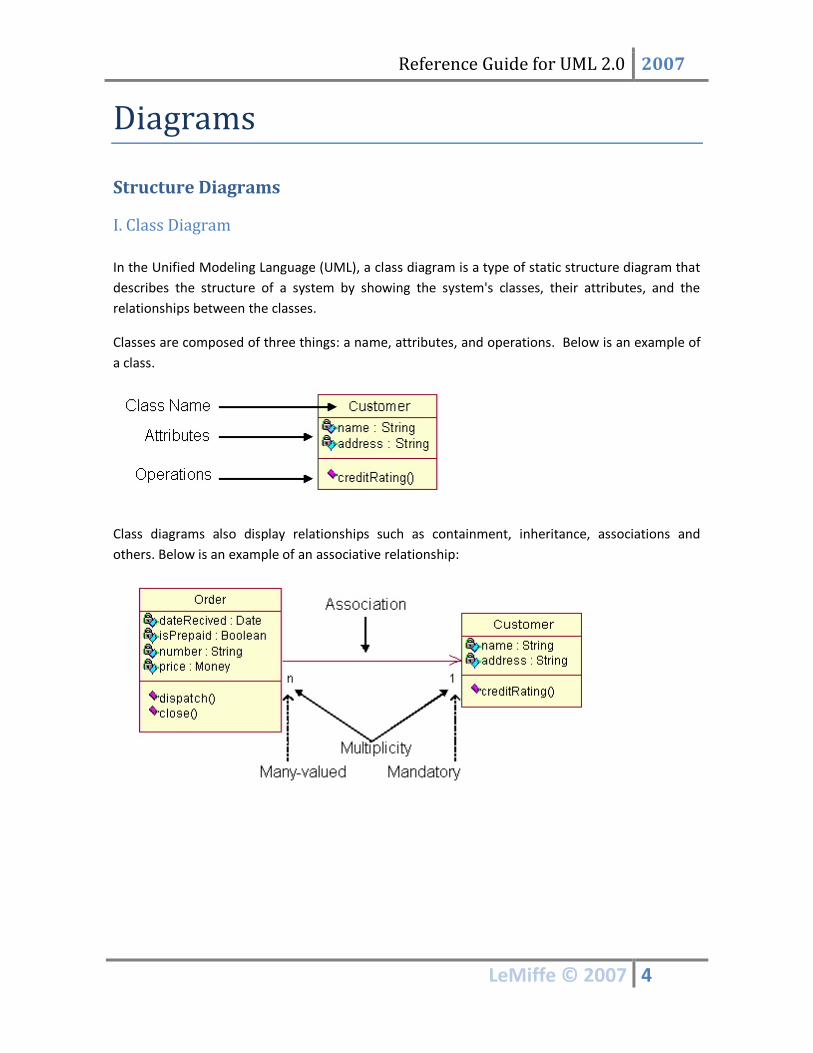
Classes are composed of three things: a name, attributes, and operations. Below is an example of
a class.
Class diagrams also display relationships such as containment, inheritance, associations and
others. Below is an example of an associative relationship:
Reference Guide for UML 2.0 2007
LeMiffe © 2007 5
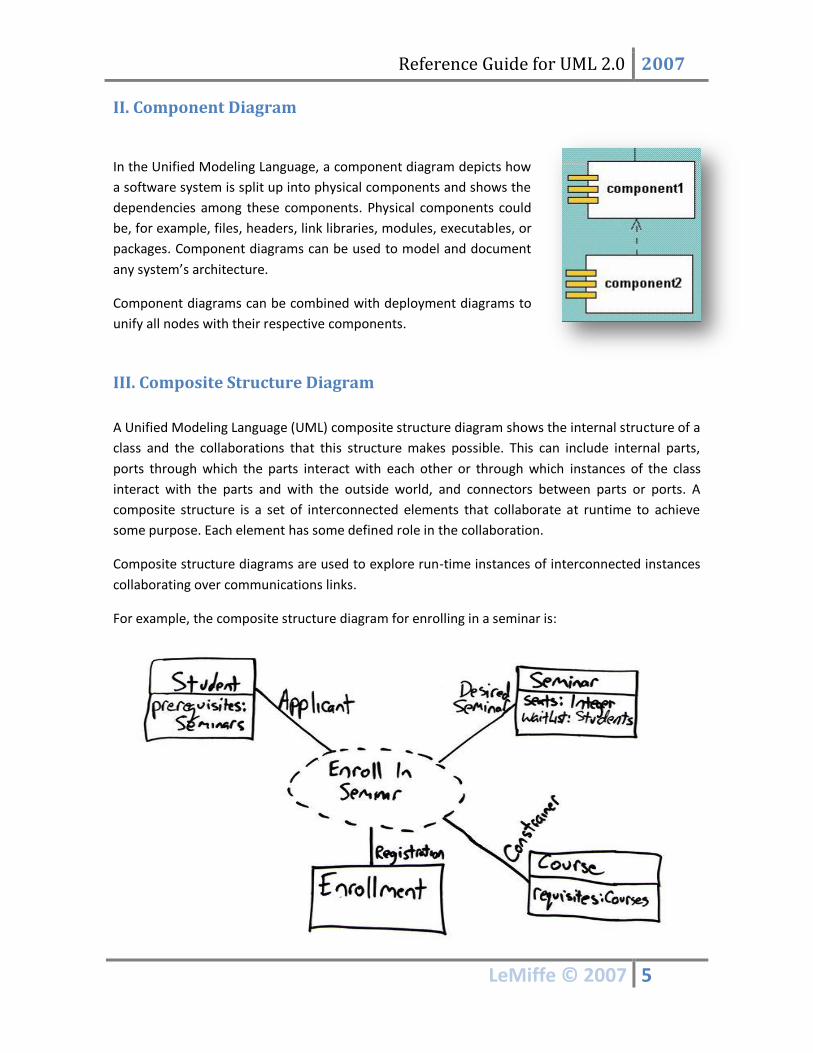
II. Component Diagram
In the Unified Modeling Language, a component diagram depicts how
a software system is split up into physical components and shows the
dependencies among these components. Physical components could
be, for example, files, headers, link libraries, modules, executables, or
packages. Component diagrams can be used to model and document
any system’s architecture.
Component diagrams can be combined with deployment diagrams to
unify all nodes with their respective components.
III. Composite Structure Diagram
A Unified Modeling Language (UML) composite structure diagram shows the internal structure of a
class and the collaborations that this structure makes possible. This can include internal parts,
ports through which the parts interact with each other or through which instances of the class
interact with the parts and with the outside world, and connectors between parts or ports. A
composite structure is a set of interconnected elements that collaborate at runtime to achieve
some purpose. Each element has some defined role in the collaboration.
Composite structure diagrams are used to explore run-time instances of interconnected instances
collaborating over communications links.
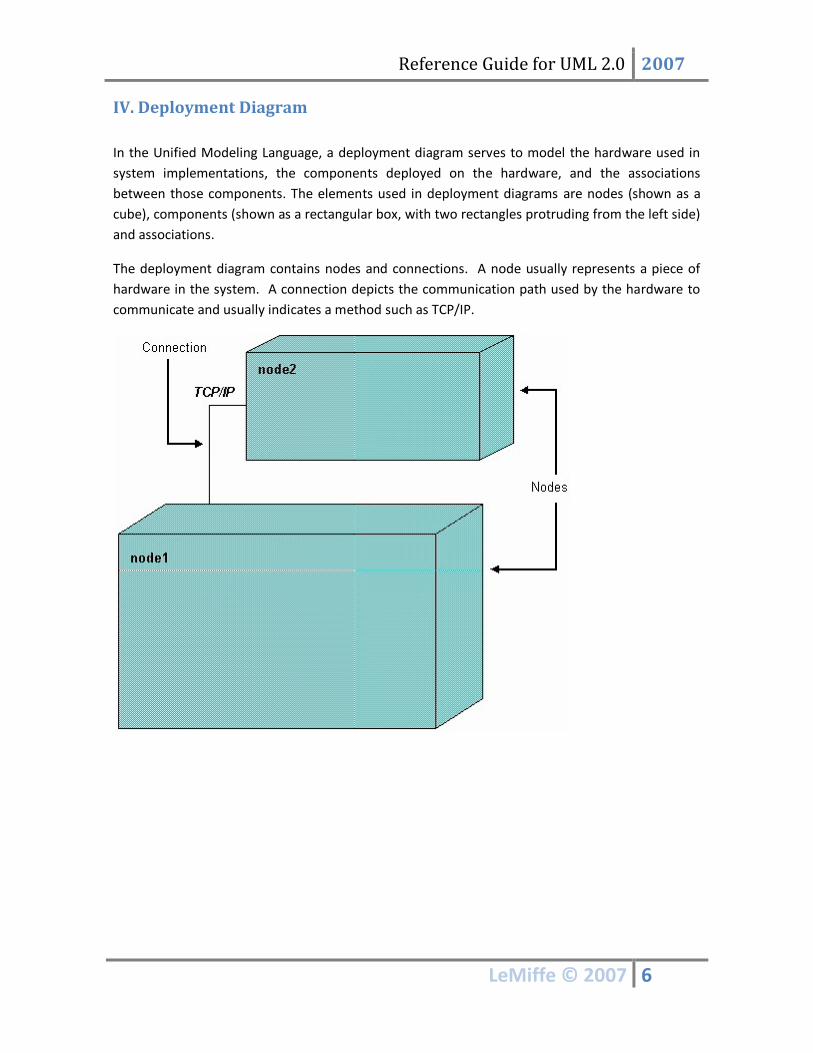
For example, the composite structure diagram for enrolling in a seminar is:
Reference Guide for UML 2.0 2007
LeMiffe © 2007 6
IV. Deployment Diagram
In the Unified Modeling Language, a deployment diagram serves to model the hardware used in
system implementations, the components deployed on the hardware, and the associations
between those components. The elements used in deployment diagrams are nodes (shown as a
cube), components (shown as a rectangular box, with two rectangles protruding from the left side)
and associations.
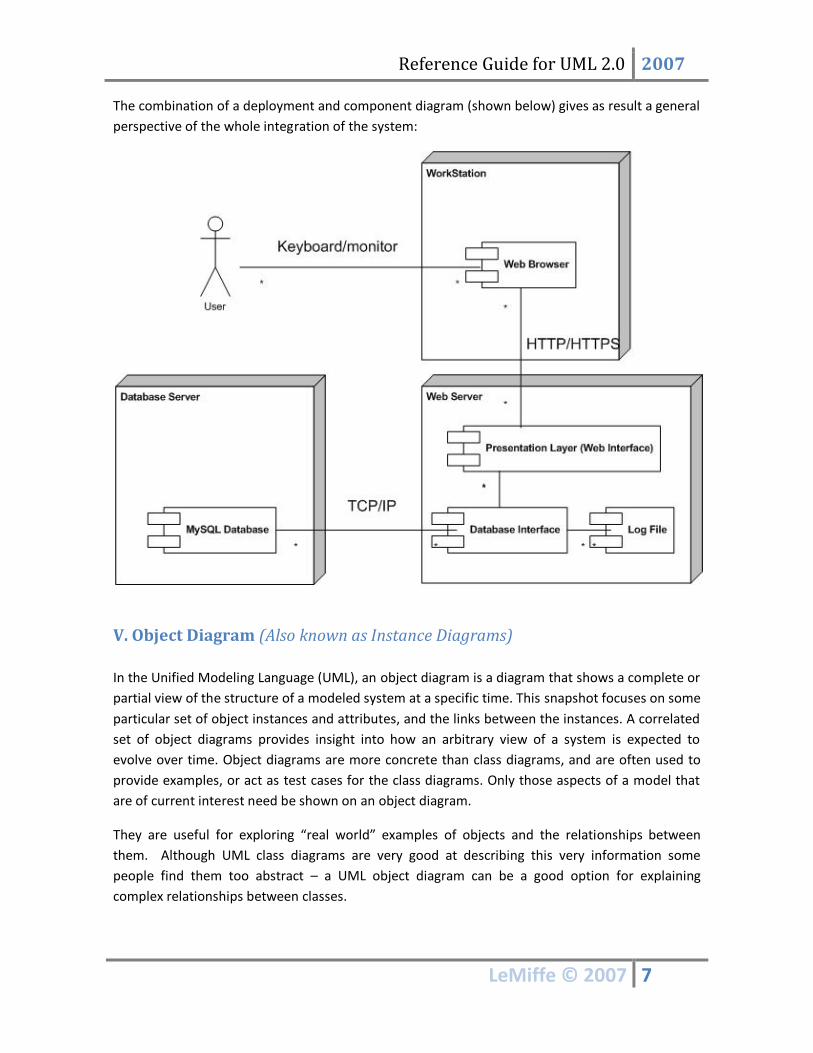
The deployment diagram contains nodes and connections. A node usually represents a piece of
hardware in the system. A connection depicts the communication path used by the hardware to
communicate and usually indicates a method such as TCP/IP.
Reference Guide for UML 2.0 2007
LeMiffe © 2007 7
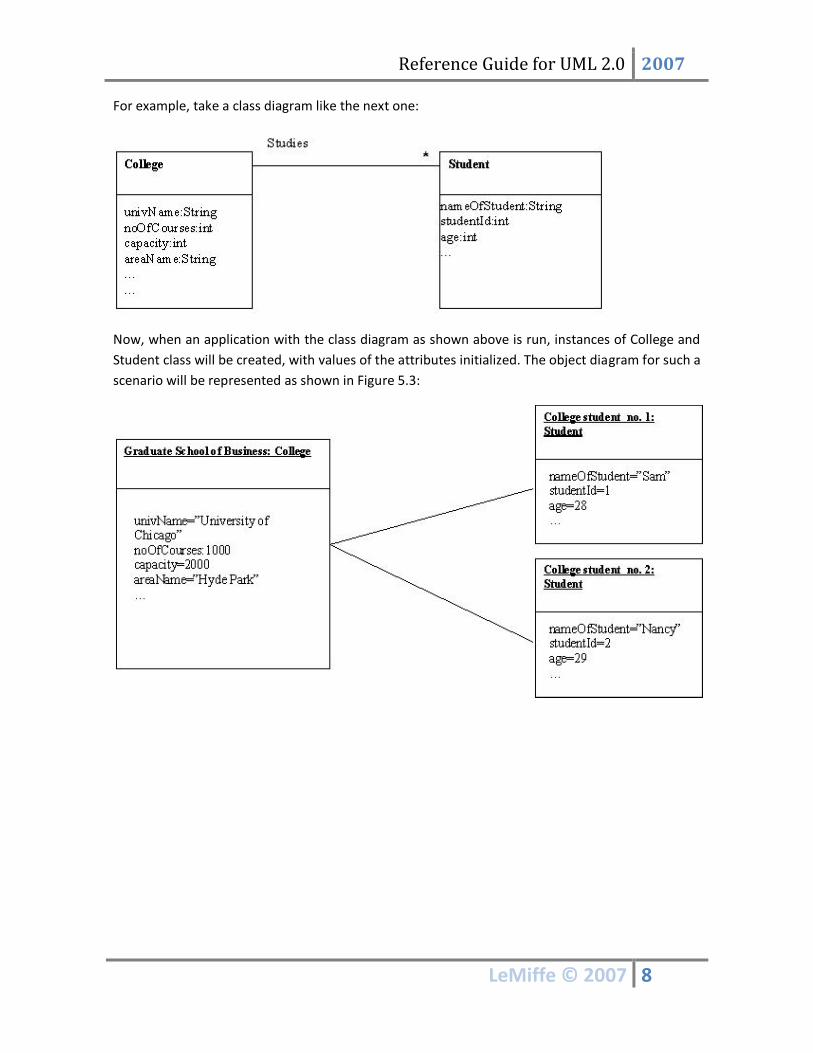
The combination of a deployment and component diagram (shown below) gives as result a general
perspective of the whole integration of the system:
V. Object Diagram (Also known as Instance Diagrams)
In the Unified Modeling Language (UML), an object diagram is a diagram that shows a complete or
partial view of the structure of a modeled system at a specific time. This snapshot focuses on some
particular set of object instances and attributes, and the links between the instances. A correlated
set of object diagrams provides insight into how an arbitrary view of a system is expected to
evolve over time. Object diagrams are more concrete than class diagrams, and are often used to
provide examples, or act as test cases for the class diagrams. Only those aspects of a model that
are of current interest need be shown on an object diagram.
They are useful for exploring “real world” examples of objects and the relationships between
them. Although UML class diagrams are very good at describing this very information some
people find them too abstract – a UML object diagram can be a good option for explaining
complex relationships between classes.
Reference Guide for UML 2.0 2007
LeMiffe © 2007 8
For example, take a class diagram like the next one:
Now, when an application with the class diagram as shown above is run, instances of College and
Student class will be created, with values of the attributes initialized. The object diagram for such a
scenario will be represented as shown in Figure 5.3:
Reference Guide for UML 2.0 2007
LeMiffe © 2007 9
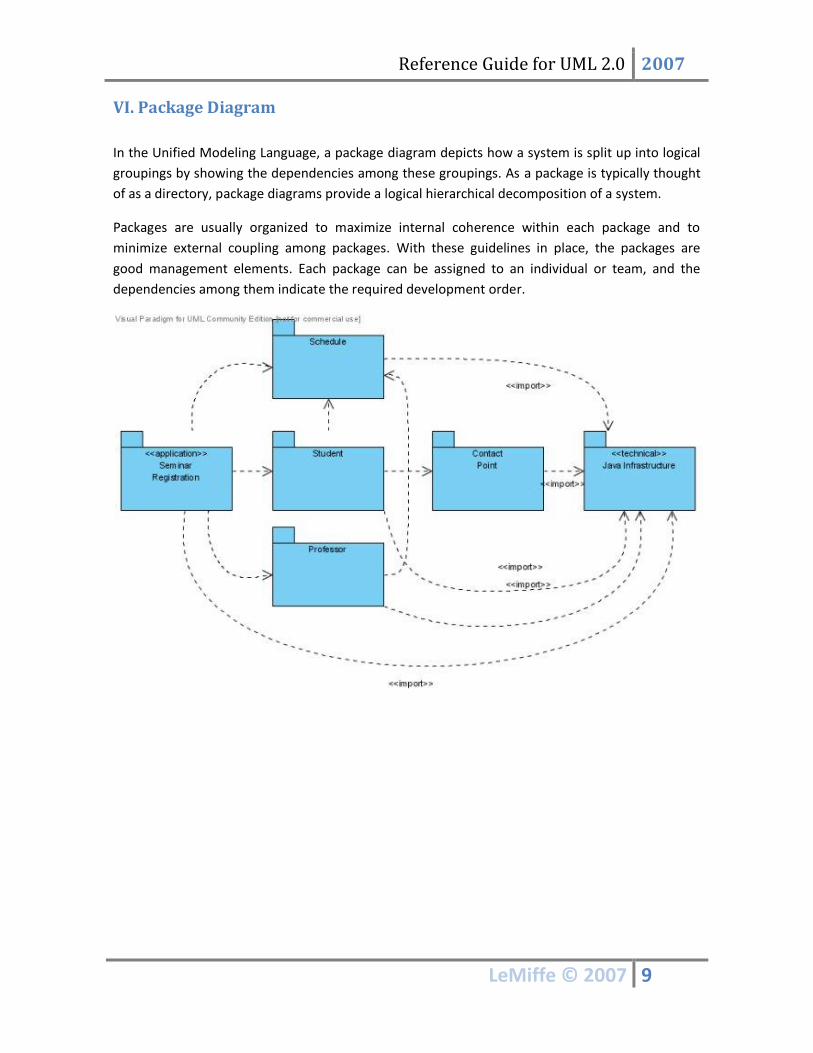
VI. Package Diagram
In the Unified Modeling Language, a package diagram depicts how a system is split up into logical
groupings by showing the dependencies among these groupings. As a package is typically thought
of as a directory, package diagrams provide a logical hierarchical decomposition of a system.
Packages are usually organized to maximize internal coherence within each package and to
minimize external coupling among packages. With these guidelines in place, the packages are
good management elements. Each package can be assigned to an individual or team, and the
dependencies among them indicate the required development order.
Reference Guide for UML 2.0 2007
LeMiffe © 2007 10
Behavior Diagrams
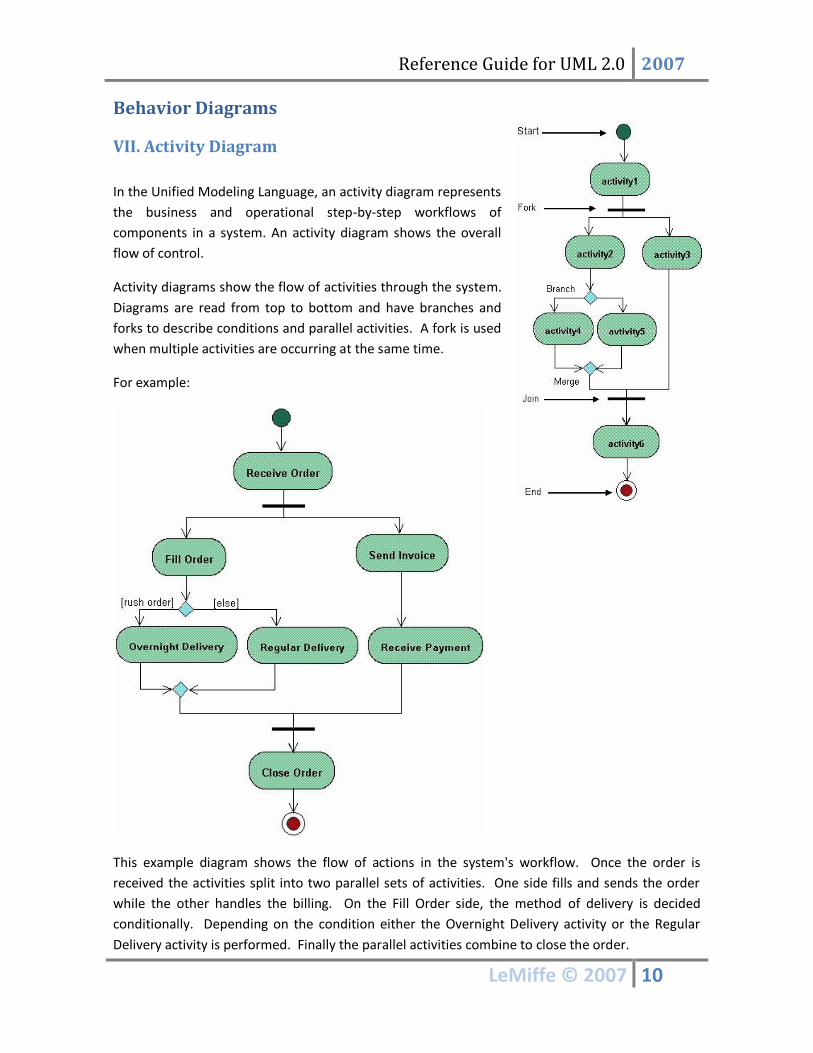
VII. Activity Diagram
In the Unified Modeling Language, an activity diagram represents
the business and operational step-by-step workflows of
components in a system. An activity diagram shows the overall
flow of control.
Activity diagrams show the flow of activities through the system.
Diagrams are read from top to bottom and have branches and
forks to describe conditions and parallel activities. A fork is used
when multiple activities are occurring at the same time.
For example:
This example diagram shows the flow of actions in the system's workflow. Once the order is
received the activities split into two parallel sets of activities. One side fills and sends the order
while the other handles the billing. On the Fill Order side, the method of delivery is decided
conditionally. Depending on the condition either the Overnight Delivery activity or the Regular
Delivery activity is performed. Finally the parallel activities combine to close the order.
Reference Guide for UML 2.0 2007
LeMiffe © 2007 11
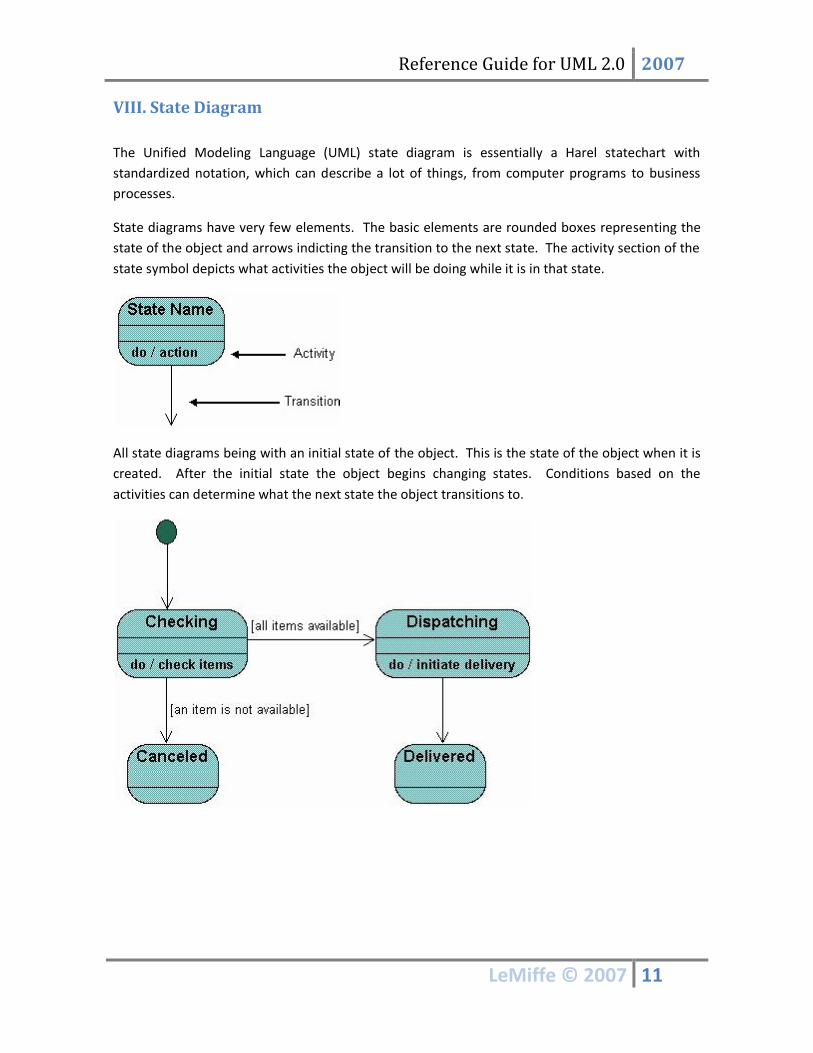
VIII. State Diagram
The Unified Modeling Language (UML) state diagram is essentially a Harel statechart with
standardized notation, which can describe a lot of things, from computer programs to business
processes.
State diagrams have very few elements. The basic elements are rounded boxes representing the
state of the object and arrows indicting the transition to the next state. The activity section of the
state symbol depicts what activities the object will be doing while it is in that state.
All state diagrams being with an initial state of the object. This is the state of the object when it is
created. After the initial state the object begins changing states. Conditions based on the
activities can determine what the next state the object transitions to.
Reference Guide for UML 2.0 2007
LeMiffe © 2007 12
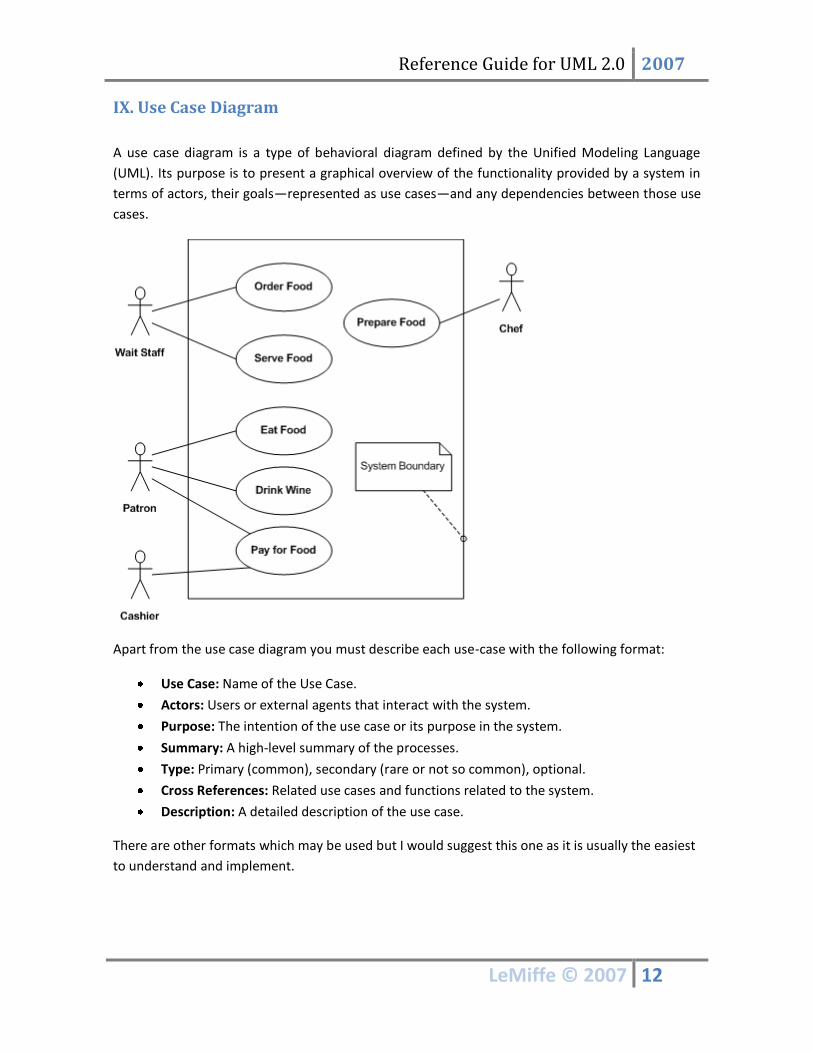
IX. Use Case Diagram
A use case diagram is a type of behavioral diagram defined by the Unified Modeling Language
(UML). Its purpose is to present a graphical overview of the functionality provided by a system in
terms of actors, their goals—represented as use cases—and any dependencies between those use
cases.
Apart from the use case diagram you must describe each use-case with the following format:
Use Case: Name of the Use Case.
Actors: Users or external agents that interact with the system.
Purpose: The intention of the use case or its purpose in the system.
Summary: A high-level summary of the processes.
Type: Primary (common), secondary (rare or not so common), optional.
Cross References: Related use cases and functions related to the system.
Description: A detailed description of the use case.
There are other formats which may be used but I would suggest this one as it is usually the easiest
to understand and implement.
Reference Guide for UML 2.0 2007
LeMiffe © 2007 13
Interaction Diagrams
X. Communication Diagram
In the Unified Modeling Language (UML) 2.0, a communication diagram is a simplified version of
the UML 1.x collaboration diagram.
A Communication diagram models the interactions between objects or parts in terms of
sequenced messages. Communication diagrams represent a combination of information taken
from Class, Sequence, and Use Case Diagrams describing both the static structure and dynamic
behavior of a system.
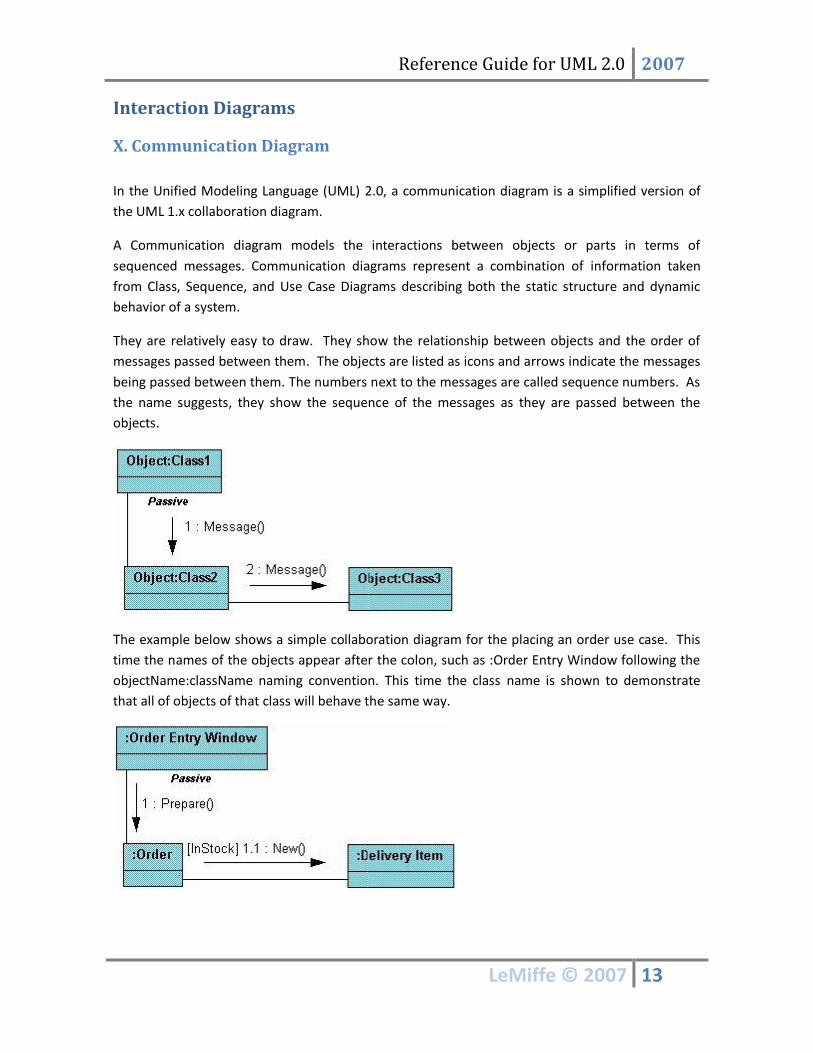
They are relatively easy to draw. They show the relationship between objects and the order of
messages passed between them. The objects are listed as icons and arrows indicate the messages
being passed between them. The numbers next to the messages are called sequence numbers. As
the name suggests, they show the sequence of the messages as they are passed between the
objects.
The example below shows a simple collaboration diagram for the placing an order use case. This
time the names of the objects appear after the colon, such as :Order Entry Window following the
objectName:className naming convention. This time the class name is shown to demonstrate
that all of objects of that class will behave the same way.
Reference Guide for UML 2.0 2007
LeMiffe © 2007 14
XI. Sequence Diagram
The well-known Message Sequence Chart technique has been incorporated into the Unified
Modeling Language (UML) diagram under the name of Sequence Diagram. A sequence diagram
shows, as parallel vertical lines, different processes or objects that live simultaneously, and, as
horizontal arrows, the messages exchanged between them, in the order in which they occur. This
allows the specification of simple runtime scenarios in a graphical manner.
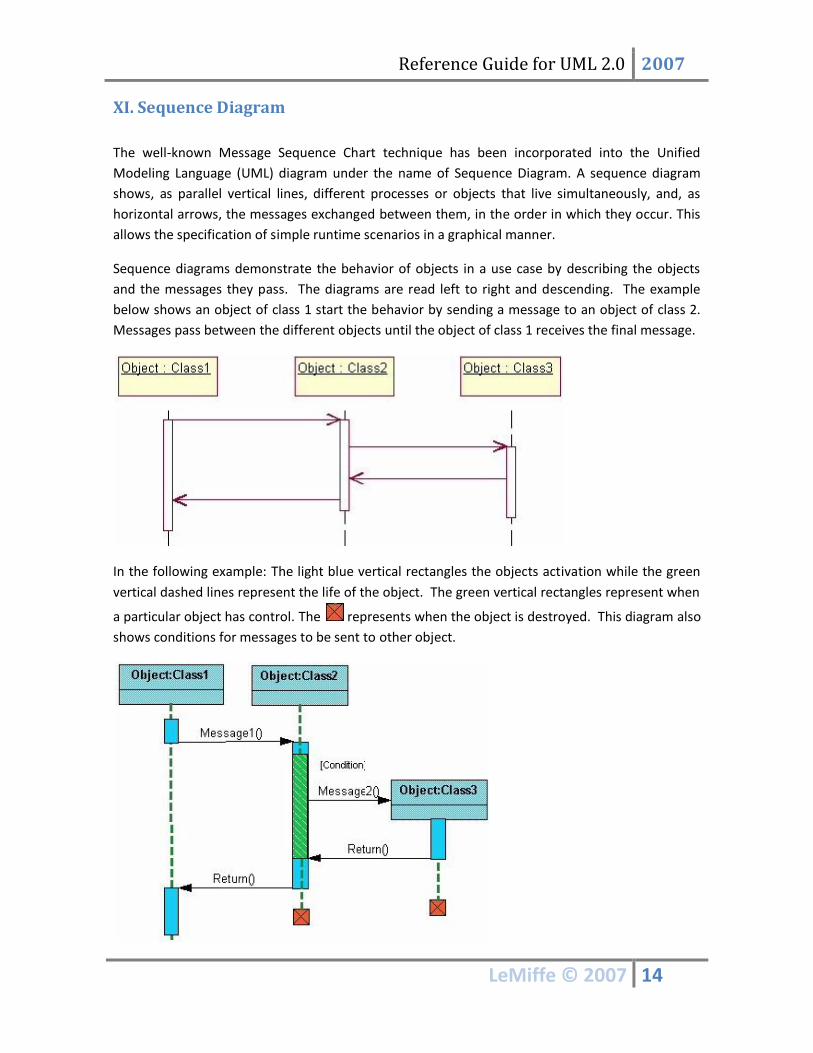
Sequence diagrams demonstrate the behavior of objects in a use case by describing the objects
and the messages they pass. The diagrams are read left to right and descending. The example
below shows an object of class 1 start the behavior by sending a message to an object of class 2.
Messages pass between the different objects until the object of class 1 receives the final message.
In the following example: The light blue vertical rectangles the objects activation while the green
vertical dashed lines represent the life of the object. The green vertical rectangles represent when
a particular object has control. The represents when the object is destroyed. This diagram also
shows conditions for messages to be sent to other object.
Reference Guide for UML 2.0 2007
LeMiffe © 2007 15
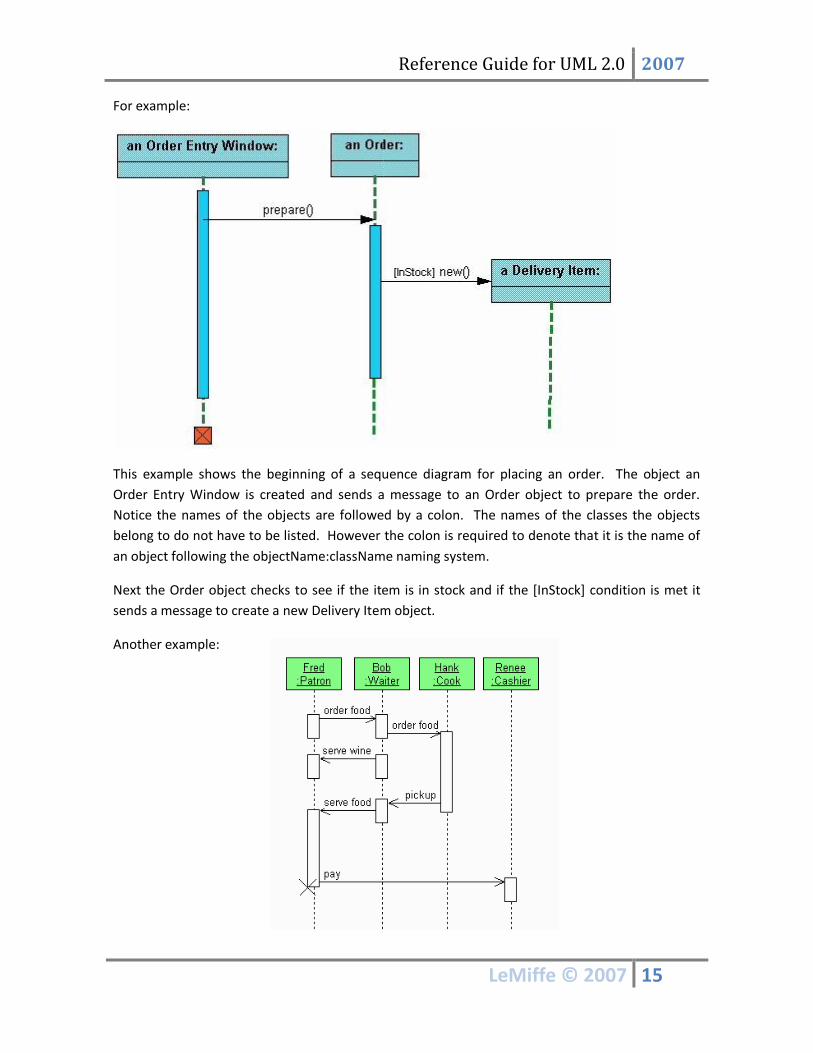
For example:
This example shows the beginning of a sequence diagram for placing an order. The object an
Order Entry Window is created and sends a message to an Order object to prepare the order.
Notice the names of the objects are followed by a colon. The names of the classes the objects
belong to do not have to be listed. However the colon is required to denote that it is the name of
an object following the objectName:className naming system.
Next the Order object checks to see if the item is in stock and if the [InStock] condition is met it
sends a message to create a new Delivery Item object.
Another example:
Reference Guide for UML 2.0 2007
LeMiffe © 2007 16
Bibliography
UML General Information. Wikipedia. 12/10/2007
http://en.wikipedia.org/wiki/Unified_Modeling_Language
UML Diagrams. Kennesaw. 12/10/2007
http://atlas.kennesaw.edu/~dbraun/csis4650/A&D/UML_tutorial/diagrams.htm
Object Diagrams. Agile Modeling. 12/10/2007
http://www.agilemodeling.com/artifacts/objectDiagram.htm
Object Diagrams. Developer.com. 12/10/2007
www.developer.com/design/article.php/2223551


