13
1 Reference Slides Earnings Call for Q3-16 Results

1
Reference Slides Earnings Call for Q3-16 Results
2 October 16
Safe Harbor Provision
• Certain statements made herein that use words such as “estimate,” “project,” “intend,” “expect,” “'believe”, "may", "might", "predict", "potential", "anticipate", "plan" or similar expressions are intended to identify forward-looking statements within the meaning of the Private Securities Litigation Reform Act of 1995 and other securities laws. For example, statements about potential new projects, investments to support the Company’s growth, meeting market demand for the Company’ solutions, coordination with and executing on customer commitments, that AT&T plans to virtualize approximately 75% of their network by 2020, projected sales cycles with top-tier carriers, whether the Company’s activities will materialize into new deals, strengthening the Company’s positioning within the NFV ecosystem, scaling up workforce with a focus on engineering, expected gross margin, R&D hiring and increased capabilities to support customers and widening the gap with competitors, expected expenses, continued engagement with top-tier CSPs on potential projects, ramping up North America office, presence and activities and expected 2016 revenues all constitute forward-looking statements. These forward-looking statements involve known and unknown risks and uncertainties that could cause the actual results, performance or achievements of the Company to be materially different from those that may be expressed or implied by such statements, including, among others, changes in general economic and business conditions and specifically, decline in the demand for the Company’s products, inability to timely develop and introduce new technologies, products and applications, and loss of market share and pressure on prices resulting from competition. For additional information regarding these and other risks and uncertainties associated with the Company’s business, reference is made to the Company’s reports filed from time to time with the United States Securities and Exchange Commission. The Company does not undertake to revise or update any forward-looking statements for any reason.
• The Company does not undertake to update forward-looking statements.
• In this conference call, management will be referring to certain non-GAAP financial measures, which are provided to enhance the user's overall understanding of the Company’s financial performance. By excluding certain non-cash charges, non-GAAP results provide information that is useful in assessing the Company's core operating performance, and in evaluating and comparing our results of operations on a consistent basis from period to period. The presentation of this additional information is not meant to be considered a substitute for the corresponding financial measures prepared in accordance with generally accepted accounting principles. Investors are encouraged to review the reconciliations of GAAP to non-GAAP financial measures which are included in the quarter’s earnings release, which is available on the Company’s website at http://radcom.com/investor-relations
3 October 16
Overview
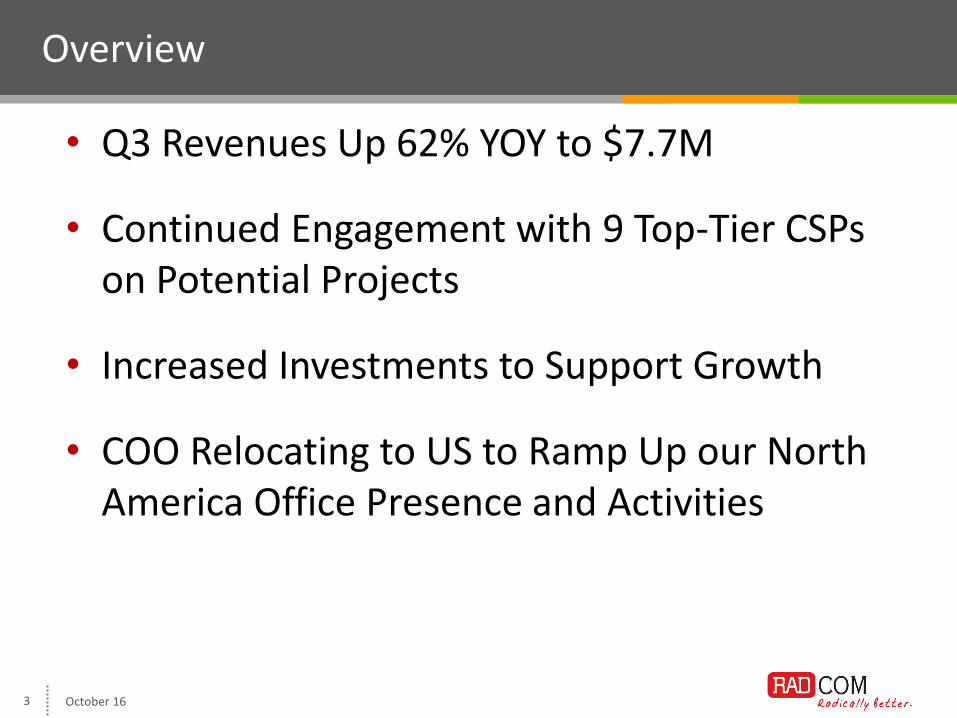
• Q3 Revenues Up 62% YOY to $7.7M
• Continued Engagement with 9 Top-Tier CSPs on Potential Projects
• Increased Investments to Support Growth
• COO Relocating to US to Ramp Up our North America Office Presence and Activities

4
Financials

5 October 16
Income Statement for Q3 (GAAP, US$ 1000s)
Q3-16 Q3-15 Sales 7,726 4,767
Cost of sales 2,357 835
Gross profit 5,369 3,932 Gross Margin 69.5% 82% R&D Gross 1,985 1,389
Less participation 385 867 R&D Net 1,600 522 Sales & Marketing 2,352 2,194 General & Administrative 1,436 534
Operating expenses 5,388 3,250
Operating profit (loss) (19) 682 Financial income (expenses) 39 (107) Net profit before Tax 20 575 Taxes (18) (14) Net profit 2 561 EPS basic $0.00 $0.07 Diluted $0.00 $0.06
6 October 16
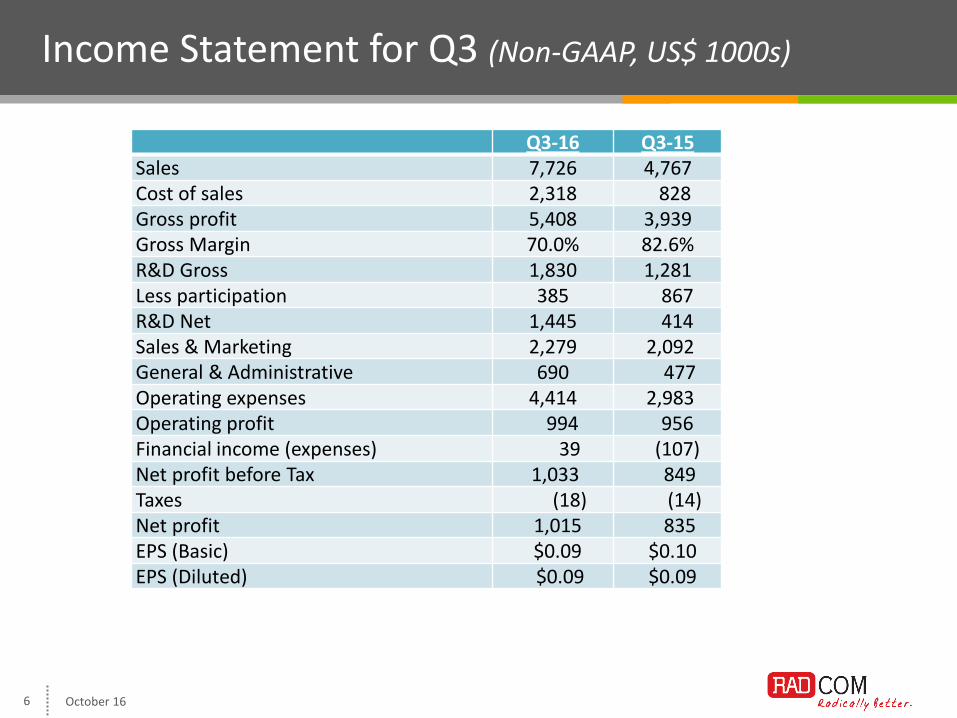
Income Statement for Q3 (Non-GAAP, US$ 1000s)
Q3-16 Q3-15
Sales 7,726 4,767
Cost of sales 2,318 828
Gross profit 5,408 3,939 Gross Margin 70.0% 82.6% R&D Gross 1,830 1,281
Less participation 385 867
R&D Net 1,445 414
Sales & Marketing 2,279 2,092 General & Administrative 690 477
Operating expenses 4,414 2,983 Operating profit 994 956 Financial income (expenses) 39 (107) Net profit before Tax 1,033 849 Taxes (18) (14) Net profit 1,015 835 EPS (Basic) $0.09 $0.10 EPS (Diluted) $0.09 $0.09

7 October 16
Income Statement for 9 months (GAAP, US$ 1000s)
9M-2016 9M-2015
Sales 21,473 15,958
Cost of sales 6,186 3,189
Gross Profit 15,287 12,769
Gross Margin 71.2% 80.0%
R&D Gross 5,453 4,452
Less participation 1,141 1,007
R&D Net 4,312 3,445
Sales & Marketing 5,611 5,781
General & Administrative 3,463 1,740
Operating expenses 13,386 10,966
Operating profit 1,901 1,803
Financial income (expenses) 775 (481)
Net profit 2,676 1,322
Taxes (24) (121)
Net profit 2,652 1,201
EPS (GAAP) $0.26 $0.14
Diluted (GAAP) $0.26 $0.13
8 October 16
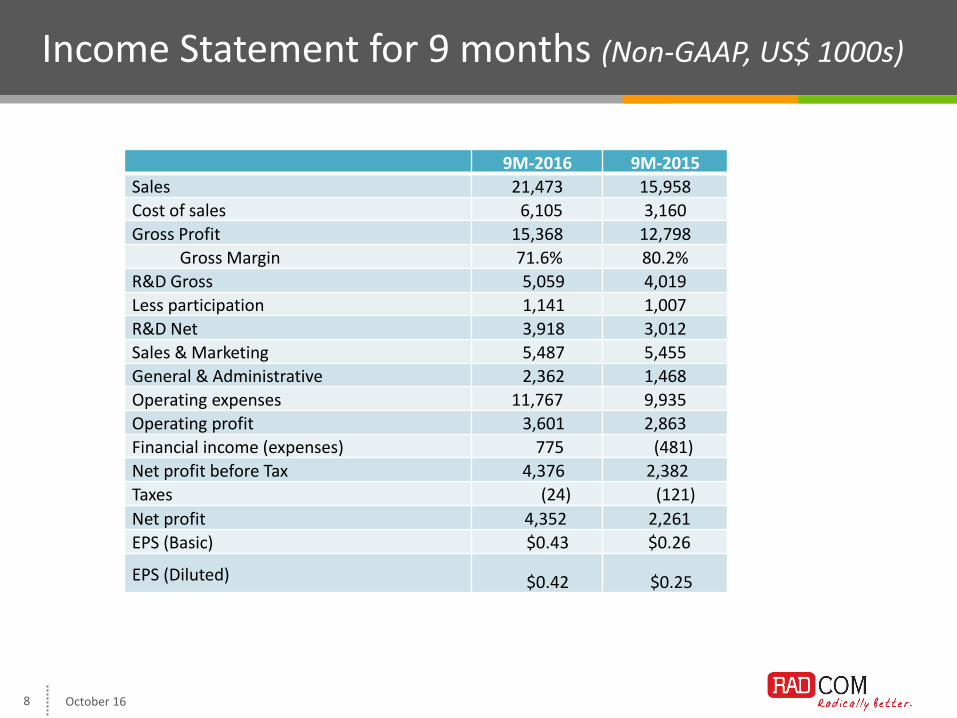
Income Statement for 9 months (Non-GAAP, US$ 1000s)
9M-2016 9M-2015
Sales 21,473 15,958
Cost of sales 6,105 3,160
Gross Profit 15,368 12,798
Gross Margin 71.6% 80.2%
R&D Gross 5,059 4,019
Less participation 1,141 1,007
R&D Net 3,918 3,012
Sales & Marketing 5,487 5,455
General & Administrative 2,362 1,468
Operating expenses 11,767 9,935
Operating profit 3,601 2,863
Financial income (expenses) 775 (481)
Net profit before Tax 4,376 2,382
Taxes (24) (121)
Net profit 4,352 2,261
EPS (Basic) $0.43 $0.26
EPS (Diluted) $0.42 $0.25

9 October 16
Operating Expenses (GAAP, US$ 1000s)
9M-2016 9M-2015 R&D Gross 5,453 4,452 Less participation 1,141 1,007 R&D Net 4,312 3,445 Sales & Marketing 5,611 5,781 General & Administrative 3,463 1,740 Operating expenses 13,386 10,966

10 October 16
Operating Expenses (Non GAAP, US$ 1000s)
9M-2016 9M-2015 R&D Gross 5,059 4,019 Less participation 1,141 1,007 R&D Net 3,918 3,012 Sales & Marketing 5,487 5,455 General & Administrative 2,362 1,468 Operating expenses 11,767 9,935

11 October 16
Balance Sheet (US$ 1000s)
US$ ‘000s
Sep-16 Sep-15
Cash and cash equivalents 43,248 7,946 Restricted cash deposits 32 32 Trade Receivables 4,413 5,527
Inventories 1,151 1,709
Other receivables 2,503 1,928
Current assets 51,347 17,142
Assets for severance benefits 3,205 3,130
Property & Equipment-Net 984 316 Other long term receivables 621 464 Total Assets 56,157 21,052
Trade payables 2,801 1,013
Current deferred revenues 4,819 799
Other payables 5,354 3,850
Current Liabilities 12,974 5,662
Long-term deferred revenues 25 318 Liability For severance benefits 3,807 3,573
Equity 39,351 11,499
Total Liabilities & Equity 56,157 21,052
12
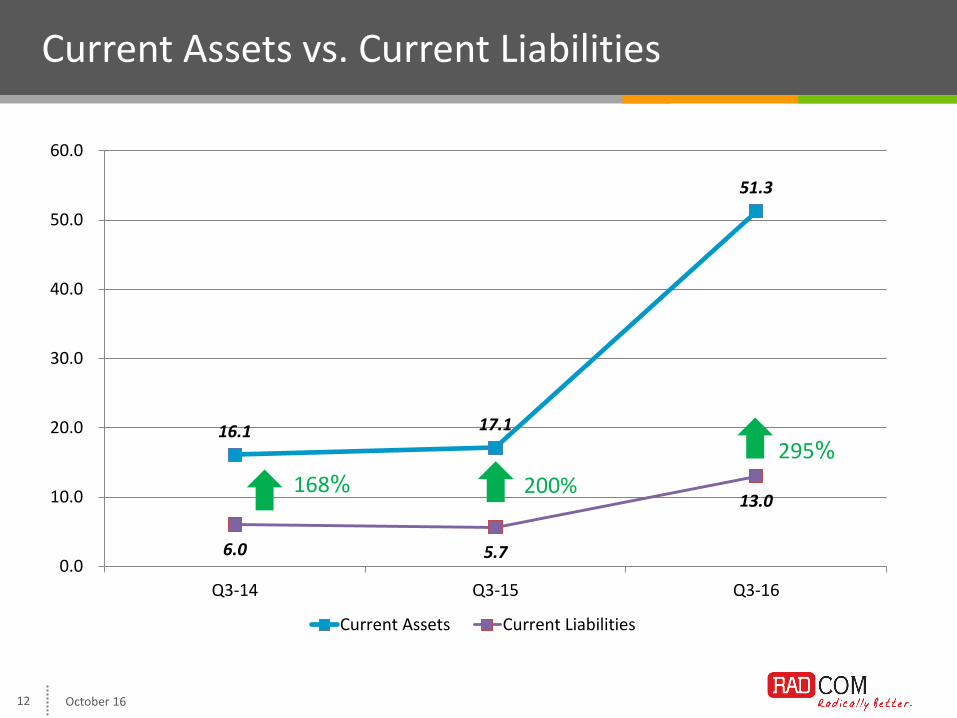
16.1 17.1
51.3
6.0 5.7
13.0
0.0
10.0
20.0
30.0
40.0
50.0
60.0
Q3-14 Q3-15 Q3-16
Current Assets Current Liabilities
October 16
Current Assets vs. Current Liabilities
200%
295%
168%

13
Thank You
October 16


