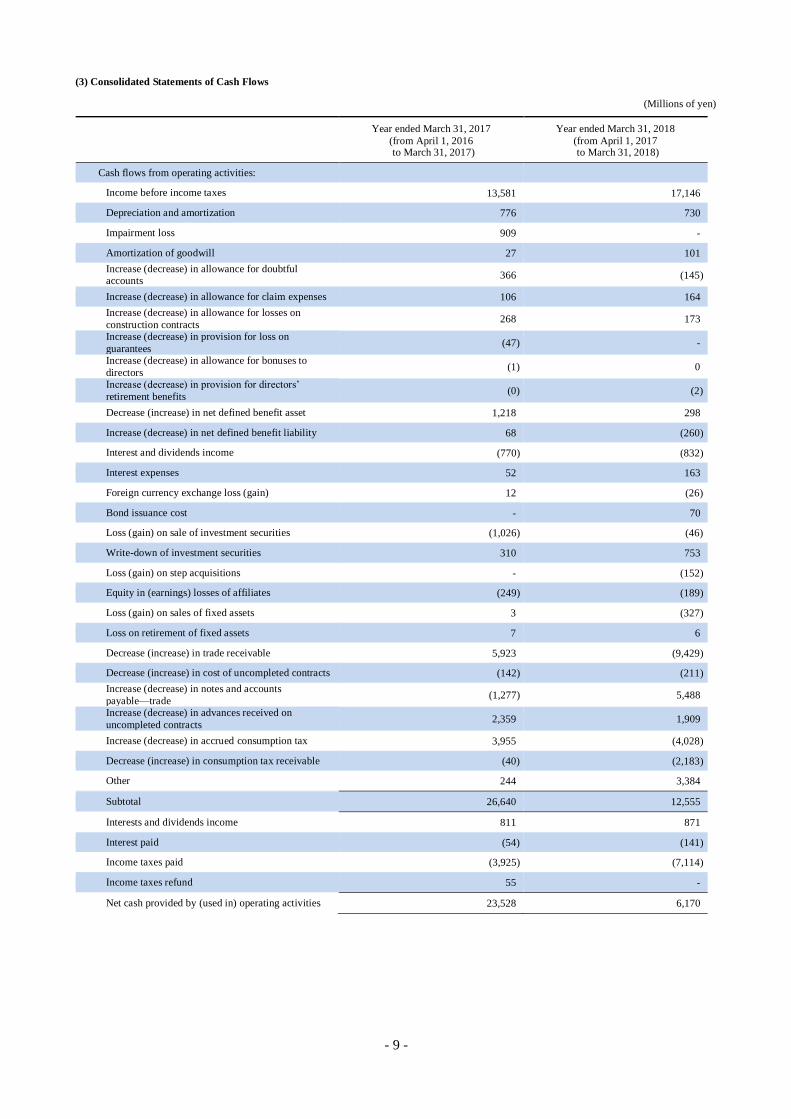
- 1 - Reference translation Financial Results for the Year Ended March 31, 2018 May 11, 2018 Company Name: Takasago Thermal Engineering Co., Ltd. Stock Exchange Listing: Tokyo 1st section Code Number: 1969 Company URL: https://www.tte-net.com/ Representative: Atsushi Ouchi, Chairman, President and Representative Director Contact: Yoshiyuki Hara, Director and Managing Executive Officer, Group General Manager, Corporate Group Phone: (03) 6369-8215 Scheduled date of ordinary general meeting of shareholders: June 26, 2018 Scheduled date to commence dividend payment: June 27, 2018 Scheduled date to submit the Securities Report: June 26, 2018 (Fraction less than one million yen has been omitted) 1. Consolidated Results for the Year Ended March 31, 2018 (April 1, 2017 to March 31, 2018) (1) Consolidated Results of Operations (% indicates changes from the previous term) Net sales Operating income Ordinary income Net income attributable to owners of parent (Millions of yen) (%) (Millions of yen) (%) (Millions of yen) (%) (Millions of yen) (%) Year ended March 31, 2018 289,933 11.4 16,362 32.1 17,461 30.0 11,804 36.2 Year ended March 31, 2017 260,204 3.5 12,383 33.3 13,427 26.7 8,665 30.3 (Note) Comprehensive income: Year ended March 31, 2018: ¥14,398 million year on year: 54.2% Year ended March 31, 2017: ¥9,339 million year on year: -% Basic earnings per share Diluted earnings per share Rate of return on equity Ratio of ordinary income to total assets Ratio of operating income to net sales (Yen) (Yen) (%) (%) (%) Year ended March 31, 2018 160.41 159.94 10.3 7.0 5.6 Year ended March 31, 2017 117.83 117.49 8.2 5.8 4.8 (Reference) Equity in earnings (losses) of affiliated companies: Year ended March 31, 2018: ¥189 million Year ended March 31, 2017: ¥249 million (2) Consolidated Financial Positions Total assets Net assets Equity ratio Net assets per share (Millions of yen) (Millions of yen) (%) (Yen) Year ended March 31, 2018 265,326 124,484 45.4 1,637.63 Year ended March 31, 2017 234,716 111,574 46.6 1,487.29 (Reference) Shareholders’ equity: Year ended March 31, 2018: ¥120,546 million Year ended March 31, 2017: ¥109,382 million (3) Consolidated Cash Flows Cash flows from operating activities Cash flows from investing activities Cash flows from financing activities Cash and cash equivalents at the end of the period (Millions of yen) (Millions of yen) (Millions of yen) (Millions of yen) Year ended March 31, 2018 6,170 (5,685) 7,107 54,558 Year ended March 31, 2017 23,528 2,329 (6,079) 46,556
Transcript
- 1 -
Reference translation
Financial Results for the Year Ended March 31, 2018
May 11, 2018
Company Name: Takasago Thermal Engineering Co., Ltd. Stock Exchange Listing: Tokyo 1st section
Code Number: 1969 Company URL: https://www.tte-net.com/
Representative: Atsushi Ouchi, Chairman, President and Representative Director
Contact: Yoshiyuki Hara, Director and Managing Executive Officer, Group General Manager, Corporate Group
Phone: (03) 6369-8215
Scheduled date of ordinary general meeting of shareholders:
June 26, 2018
Scheduled date to commence
dividend payment:
June 27, 2018
Scheduled date to submit the Securities Report:
June 26, 2018
(Fraction less than one million yen has been omitted)
1. Consolidated Results for the Year Ended March 31, 2018 (April 1, 2017 to March 31, 2018) (1) Consolidated Results of Operations
(% indicates changes from the previous term)
Net sales Operating income Ordinary income Net income attributable to
owners of parent
(Millions of yen) (%) (Millions of yen) (%) (Millions of yen) (%) (Millions of yen) (%)
(Note) Breakdown of the ¥22 year-end dividends for the year ended March 31, 2017: Ordinary dividends of ¥16, special dividends of ¥6 3. Forecasts for the Consolidated Financial Results for the Year Ending March 31, 2019 (April 1, 2018 to March 31, 2019)
(% indicates changes from the previous corresponding term)
Net sales Operating income Ordinary income Net income attributable to
owners of parent Basic earnings
per share
(Millions of yen) (%) (Millions of yen) (%) (Millions of yen) (%) (Millions of yen) (%) (Yen)
Full year 300,000 3.5 16,500 0.8 17,500 0.2 11,800 (0.0) 160.34
(Reference) Orders received (estimated): (End of second quarter) ¥155,000 million
(Full year) ¥280,000 million
*Notes
(1) Changes in Important Subsidiary (Change in Specific Subsidiary Accompanying Change in Scope of Consolidation) During the Term: None
(2) Changes in Accounting Policies, Changes in Accounting Estimates and Restatements
(i) Changes in accounting policies in accordance with the revision of accounting standard, etc.: None (ii) Changes in accounting policies other than (i) above: None
(iii) Changes in accounting estimates: None (iv) Restatements: None
(3) Number of Issued Shares (Common Stock)
(i) Number of issued shares at fiscal year end (including treasury stock)
March 31, 2018: 82,765,768 shares
March 31, 2017: 82,765,768 shares
(ii) Number of treasury shares at fiscal year end
March 31, 2018: 9,155,382 shares
March 31, 2017: 9,220,817 shares
(iii) Average number of shares during the period
Year ended March 31, 2018: 73,594,611 shares
Year ended March 31, 2017: 73,539,820 shares
(References) Summary of Non-consolidated Financial Results 1. Non-consolidated Financial Results for the Year Ended March 31, 2018 (April 1, 2017 to March 31, 2018) (1) Non-consolidated Results of Operations
(% indicates changes from the previous term)
Net sales Operating income Ordinary income Net income
(Millions of yen) (%) (Millions of yen) (%) (Millions of yen) (%) (Millions of yen) (%) Year ended
Basic earnings per share Diluted earnings per share
(Yen) (Yen)
Year ended
March 31, 2018 139.53 139.14
Year ended
March 31, 2017 116.60 116.26
- 3 -
(2) Non-consolidated Financial Positions
Total assets Net assets Equity ratio Net assets per share
(Millions of yen) (Millions of yen) (%) (Yen) Year ended
March 31, 2018 229,223 108,806 47.4 1,469.76
Year ended
March 31, 2017 205,496 99,565 48.3 1,345.92
(Reference) Shareholders’ equity: Year ended March 31, 2018: ¥108,578 million Year ended March 31, 2017: ¥99,347 million
2. Forecasts for the Non-consolidated Financial Results for the Year Ending March 31, 2019 (April 1, 2018 to March 31, 2019) (% indicates changes from the previous corresponding term)
Net sales Operating income Ordinary income Net income Basic earnings
per share
(Millions of yen) (%) (Millions of yen) (%) (Millions of yen) (%) (Millions of yen) (%) (Yen)
Full year 228,000 4.8 13,100 (3.5) 14,600 (2.8) 10,400 0.9 140.81
(Reference) Orders received (estimated): (End of second quarter) ¥120,000 million (Full year) ¥205,000 million
* These consolidated financial results are outside the scope of audit by certified public accountants or audit corporations
*Explanation concerning proper use of the forecasts for the financial results and other special instructions
Forward-looking statements, including the financial results forecasts, in this document are based on currently available information held by the Company and on certain premises considered reasonable by the Company. It is not the intention of the Company to undertake the realization of these
statements. Actual business results may differ from the forecasts, depending on various factors.
- 4 -
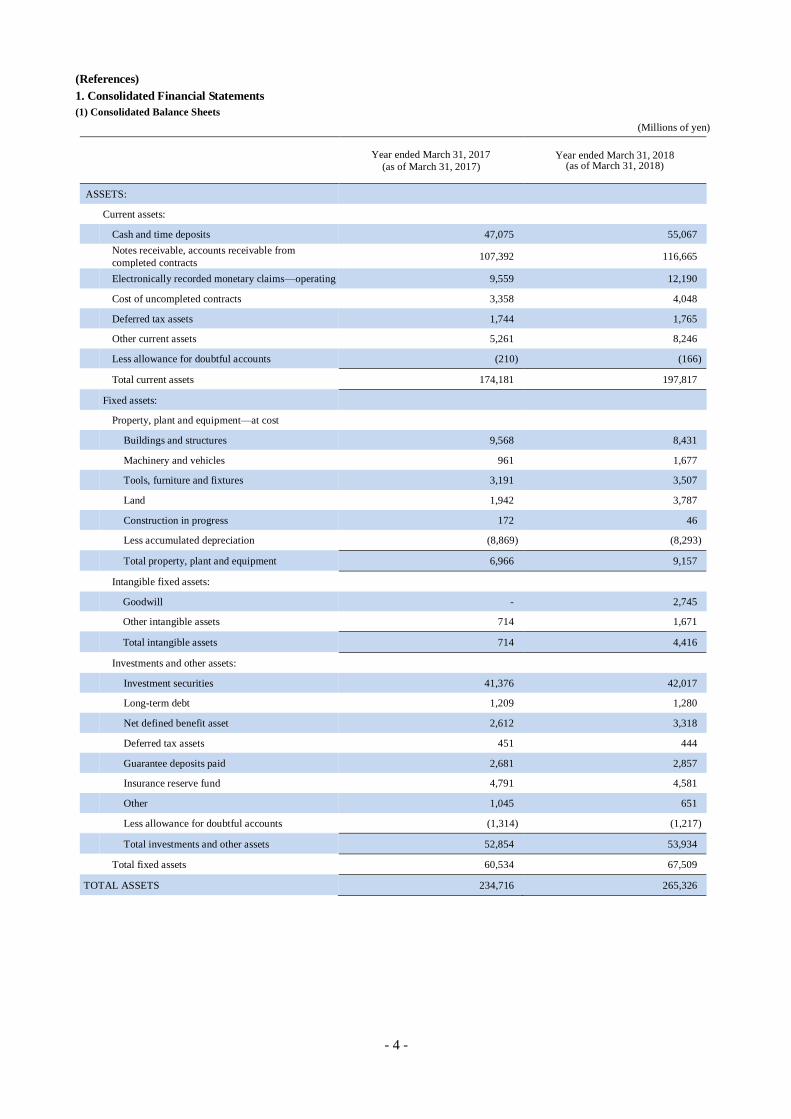
(References)
1. Consolidated Financial Statements
(1) Consolidated Balance Sheets
(Millions of yen)
Year ended March 31, 2017
(as of March 31, 2017) Year ended March 31, 2018
(as of March 31, 2018)
ASSETS:
Current assets:
Cash and time deposits 47,075 55,067
Notes receivable, accounts receivable from
completed contracts 107,392 116,665
Electronically recorded monetary claims—operating 9,559 12,190
Cost of uncompleted contracts 3,358 4,048
Deferred tax assets 1,744 1,765
Other current assets 5,261 8,246
Less allowance for doubtful accounts (210) (166)
Total current assets 174,181 197,817
Fixed assets:
Property, plant and equipment—at cost
Buildings and structures 9,568 8,431
Machinery and vehicles 961 1,677
Tools, furniture and fixtures 3,191 3,507
Land 1,942 3,787
Construction in progress 172 46
Less accumulated depreciation (8,869) (8,293)
Total property, plant and equipment 6,966 9,157
Intangible fixed assets:
Goodwill - 2,745
Other intangible assets 714 1,671
Total intangible assets 714 4,416
Investments and other assets:
Investment securities 41,376 42,017
Long-term debt 1,209 1,280
Net defined benefit asset 2,612 3,318
Deferred tax assets 451 444
Guarantee deposits paid 2,681 2,857
Insurance reserve fund 4,791 4,581
Other 1,045 651
Less allowance for doubtful accounts (1,314) (1,217)
Total investments and other assets 52,854 53,934
Total fixed assets 60,534 67,509
TOTAL ASSETS 234,716 265,326
- 5 -
(Millions of yen)
Year ended March 31, 2017
(as of March 31, 2017) Year ended March 31, 2018
(as of March 31, 2018)
LIABILITIES
Current liabilities:
Notes payable, accounts payable for construction
contracts 57,096 62,068
Electronically recorded obligations - operating - 23,571
Short-term debt 5,527 6,123
Accounts payable—other 27,824 2,119
Income taxes payable 4,310 1,980
Advances received on uncompleted contracts 5,401 7,673
Deferred tax liabilities - 24
Allowance for bonuses to directors 137 137
Allowance for claim expenses 792 958
Allowance for losses on construction contracts 1,993 2,175
Other current liabilities 12,997 16,067
Total current liabilities 116,080 122,900
Non-current liabilities:
Bonds payable - 10,000
Net defined benefit liability 1,316 1,041
Allowance for accrued severance indemnities to
directors and corporate auditors 8 5
Long-term accounts payable—other 64 69
Deferred tax liabilities 5,166 6,271
Other non-current liabilities 505 554
Total non-current liabilities 7,061 17,942
TOTAL LIABILITIES 123,141 140,842
NET ASSETS
Shareholders’ equity:
Capital stock 13,134 13,134
Capital surplus 12,854 12,730
Retained earnings 80,767 89,839
Treasury stock (8,850) (8,789)
Total shareholders’ equity 97,906 106,916
Accumulated other comprehensive income:
Net unrealized holding gains on securities 11,603 13,230