References Lemaire et al: Pricing Term Insurance in the Presence of a Family History of Breast or Ovarian Cancer. North American Act. J., 2000, 75-87 Subramanian et al: Estimating Adverse Selection Costs From Genetic Testing for Breast and Ovarian Cancer: The Case of Life Insurance. J. of Risk and Insurance, 1999, 66, 531-550
Transcript
References
Lemaire et al: Pricing Term Insurance in the Presence of a Family History of Breast or Ovarian Cancer. North American Act. J., 2000, 75-87
Subramanian et al: Estimating Adverse Selection Costs From Genetic Testing for Breast and Ovarian Cancer: The Case of Life Insurance. J. of Risk and Insurance, 1999, 66, 531-550
Adverse Selection from Genetic Testing for BRCA in a Term Life Insurance Market. Inelastic and Elastic Demands
Jean LemaireThe Wharton School
Krupa SubramanianTemple University
Genetic Tests and their Implications in Insurance
Jean Lemaire
Wharton School
Krupa Subramanian
Temple University
Genetic Testing in the News
Humane Genome Project Clinton Executive Order DNA testing on death row UAE require testing prior to marriage Greek Orthodox Church requires testing Pre-marital counseling in Sardinia Alzheimer-free embryos Fear of job and insurance discrimination in public
Genetic Diseases (% of carriers)
Huntington’s Disease Cystic Fibrosis
– 1/2,500 US whites– 1/17,000 US African-Americans
Tay-Sachs Disease– 1/27 US Ashkenazi Jews– 1/250 US Sephardic Jews– High Accadians, Cajuns
Sickle-Cell Anemia– 1/4 Central Africa
BRCA– 1/43 US Ashkenazi Jews– 1/833 US whites– High Iceland, Thailand
Six-fingered Drawfism– High Amish, Pennsylvania
Genes impact other diseases
Alzheimer’s Disease Diabetes Manic Depression Schizophrenia Multiple Sclerosis Rheumatoid Arthritis Thalassemia Haemophilia and over 1,100 others Over 800 tests offered
Genetic Testing Issues
Privacy concerns Voluntary testing Job and insurance discrimination Regulation addressing genetic testing Adverse selection in insurance markets
Mortality Ratios for Common Conditions and Diseases
DISEASE MEASUREMENT -RATIOSystolic bloodpressure 158-167 (men) 2.06Systolic bloodpressure 178-187 (women) 2.78Diabetes mellitus Men 2.50Build 40% overweight (women) 1.62Build 60% overweight (men) 2.60Epilepsy All types 2.78Alcoholism 5 drinks a day 3.00Smoking Average (men) 1.70Smoking 40 cigarettes/day (men) 2.00HIV 35-year-old male 50.00
Relative cost of term insurance
(No Family History: Cost = 100)
AGE TERM 1 FDR – OC 1 FDR – BC 2 FDR - BC BRCA10 109.01 113.51 140.80 205.203020 112.20 122.33 167.00 255.5110 112.52 111.81 138.20 240.684020 112.20 115.97 150.05 250.2410 108.87 106.00 120.32 172.365020 107.92 107.58 124.67 170.23
4574.180.140
20.205SelectionAdverseofCost
Adverse Selection Markov Model
•First model: Inelastic Demand
•Discrete-state, continuous-time Markov Model
Not TestedNot Insured
Not TestedInsured
Test NegativeNever Buy or Lapses
DEAD
Test NegativeSame Insurance
Test NegativeBuy Less
Test PositiveSame Insurance
Test PositiveBuy Less
Test NegativeBuy Insurance
412 6
Test NegativeBuy More
Test PositiveBuy More
7 10
11
9
2
Test PositiveBuy Insurance
5
14
Lapse
8
Test PositiveNever Buy or Lapses
13
1
3
Implicit Cost of Adverse Selection =
E.V. of Claim costs (Full information) E.V. of Claim costs (Allowable information)
Each state for which there is an outward transition translates to a differential equation (Thieles’s differential equation for reserves).
jk
t
j)1(
tjk
k)1(
t
jk
t
j)1(
tt
j)1(
t)VVb(VV
dt
d
where
Vtj( )1 Benefit reserve for State j at time t
Vtk()1 Benefit reserve for State k at time t
t Force of interest at time tbtjk Payments due upon transitions from state j
btjk to state k.tjk Intensity of transition from state j to state k
tjk at time t.
Behavioural Assumptions
Inelastic demand for insurance Rate of genetic testing: 0.05 Force of Interest: 0.05 Rate of insurance purchase: 0.05 Rate of lapsing before testing: 0.05 Rate of re-entry into State 1
Adverse selection costs for a woman with no family history of BC or OC, insured at onset; basic benefit $1
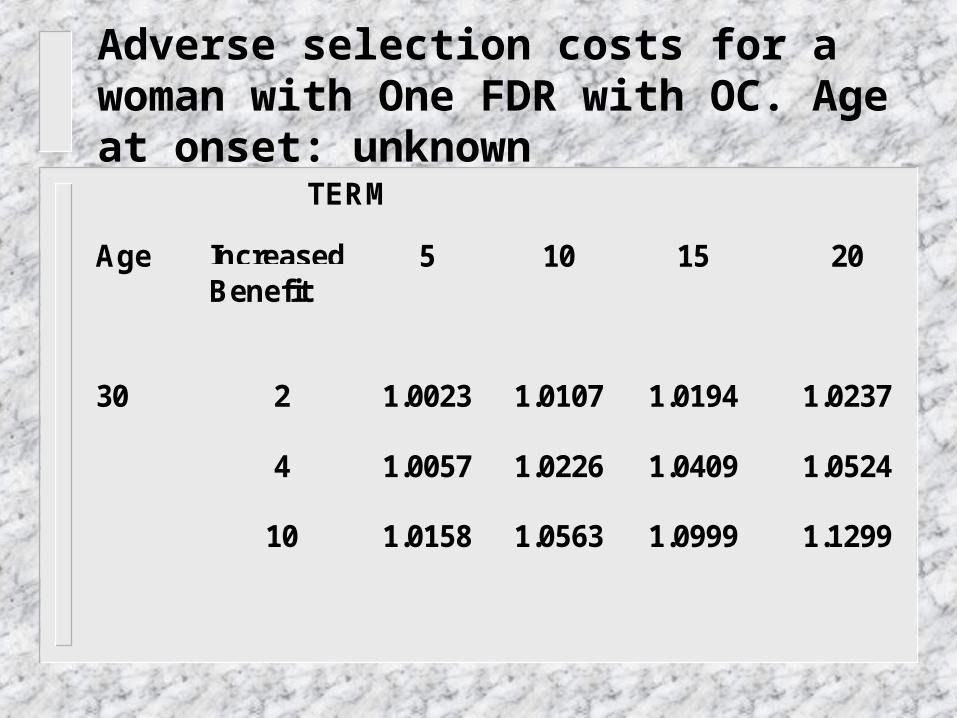
Adverse selection costs for a woman with One FDR with OC. Age at onset: unknown
TERM
Age IncreasedBenefit
5 10 15 20
30 2 1.0023 1.0107 1.0194 1.0237
4 1.0057 1.0226 1.0409 1.0524
10 1.0158 1.0563 1.0999 1.1299
Adverse selection costs for a woman with one FDR with BC, age at Onset: 20-29.
TERM
Age IncreasedBenefit
5 10 15 20
30 2 1.0065 1.0177 1.0294 1.0386
4 1.0126 1.0369 1.0626 1.0825
10 1.0300 1.0893 1.1495 1.1935
TERM
Age IncreasedBenefit
5 10 15 20
40 2 1.0144 1.0380 1.0544 1.0523
4 1.0233 1.0632 1.0925 1.0928
10 1.0489 1.1322 1.1924 1.1949
TERM
Age IncreasedBenefit
5 10 15 20
50 2 1.0079 1.0197 1.0271 1.0250
4 1.0128 1.0331 1.0468 1.0449
10 1.0269 1.0698 1.0985 1.0952
Adverse selection costs for a woman with two FDR with BC, Age at Onset: 20-29
TERM
Age IncreasedBenefit
5 10 15 20
30 2 1.0089 1.0168 1.0237 1.0294
4 1.0186 1.0421 1.0631 1.0787
10 1.0445 1.1034 1.1510 1.1819
Sensitivity Analysis: 40-year old Woman, 2 FDR with BC
Adverse selection costs for a woman with two FDR with BC, age at Onset 20-29, who claims no family history of BC or OC;
Age Increased Benefit
5 10 15 20
30 2 1.2356 1.5149 1.7253 1.8490
4 1.2813 1.6364 1.9312 2.1263
10 1.4170 1.9933 2.5300 2.9260
Sensitivity Analysis: 40-year old Woman, 2 FDR with BC, but reports No family history of BC or OC
Second Model: Elastic Demand
Discrete-state, discrete time Markov model A cohort of 1,000 women is tracked down
for 20 years. Initially they are all insured for $100,000 under an annually renewable term policy, and untested for BRCA
Three decrements from initial cohort: death, lapse, testing for BRCA mutation
All may change their benefit each year
Adverse selection results from
Differentiated lapsing rates: women testing positive will exhibit a lower lapsing rate
Differentiated benefits: women testing positive are more likely to increase their benefits
Different reactions to price increases: women testing positive are more likely to accept a price increase
The insurance company
Will increase premiums as a result of adverse selection
Myopic reaction of insurer is assumed: each year, it calculates past losses, and attempts to recoup them by increasing premiums
The same % premium increase is applied to each rating cell
Twelve rating cells: Ages 30, 40, 50. 1 FDR-BC, 2 FDR-BC, 1 FDR OC, No family history
The insurer never fully recovers losses, as it is always one step behind: it does not anticipate the fact that customers constantly change insurance purchasing behaviour as a result of pricing decisions
Other pricing strategies are possible: the insurer could anticipate future mortality trends in portfolio
Elastic Demand
Marshall’s Law of Demand: PλQ = Cst λ is the constant elasticity of demand with
respect to price: λ = - (dQ/Q) / (dP/P) We expect “price elasticity” parameters