Raza Jawad
Regional Director, Business Development
UOP Middle East Company, Dubai
Refining & Petrochemicals Integration
Business Drivers & Enabling Technologies
© 2006 UOP LLC. All rights reserved. UOP 4698-01
SAS-AIChE Meeting
February 27, 2007
Al-Khobar, KSA
mahdavi
Textbox
VCMStudy.ir
Refining & Petrochemicals Integration Business Drivers & Enabling Technologies
•Refining & petrochemicals markets
• Investment strategies
•Enabling technologies
•Concluding remarks
UOP 4698-02
mahdavi
Textbox
VCMStudy.ir
70%
75%
80%
85%
90%
1980
1985
1990
1995
2000
2005
Av
era
ge
Glo
ba
l U
tilis
ati
on
, %
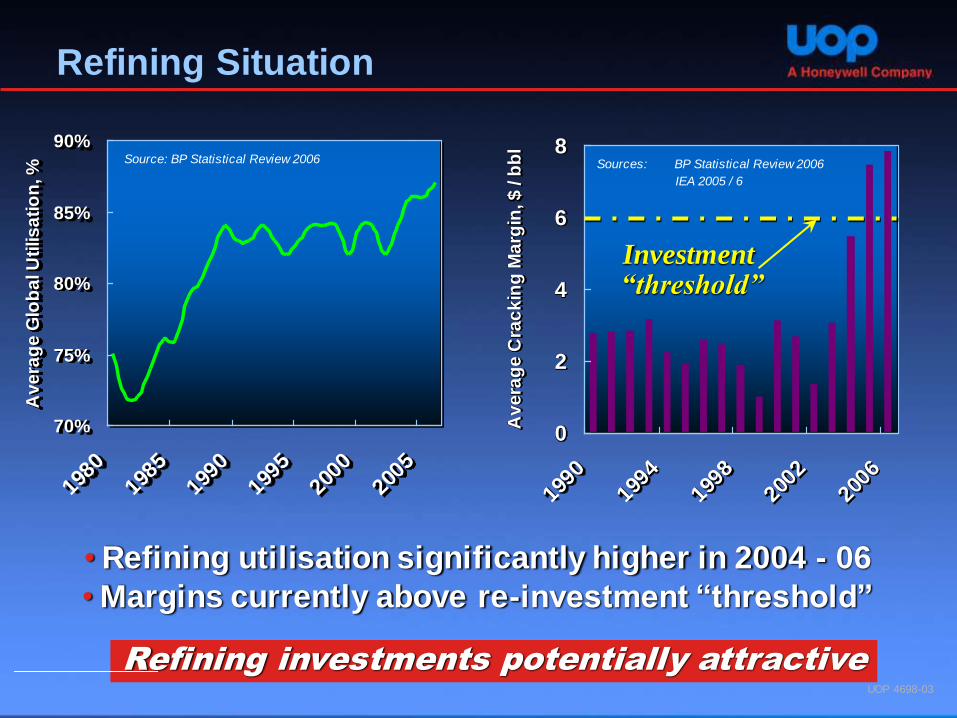
Source: BP Statistical Review 2006
Refining Situation
Refining investments potentially attractive
• Refining utilisation significantly higher in 2004 - 06
• Margins currently above re-investment “threshold”
0
2
4
6
8
1990
1994
1998
2002
2006
Av
era
ge
Cra
ck
ing
Ma
rgin
, $
/ b
bl
Sources: BP Statistical Review 2006
IEA 2005 / 6
Investment “threshold”
UOP 4698-03
mahdavi
Textbox
VCMStudy.ir
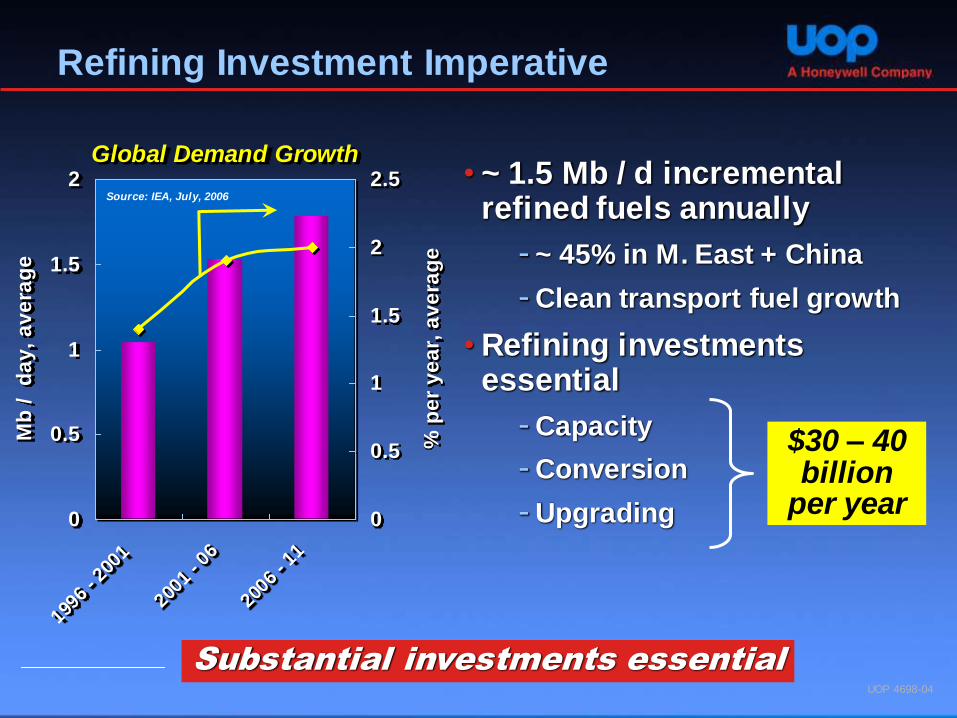
Refining Investment Imperative
• ~ 1.5 Mb / d incremental refined fuels annually
- ~ 45% in M. East + China
- Clean transport fuel growth
• Refining investments essential
- Capacity
- Conversion
- Upgrading
Global Demand Growth
0
0.5
1
1.5
2
1996
- 20
01
2001
- 06
2006
- 11
Mb
/
da
y,
av
era
ge
0
0.5
1
1.5
2
2.5
% p
er
ye
ar,
av
era
ge
Source: IEA, July, 2006
$30 – 40 billion
per year
Substantial investments essential
UOP 4698-04
mahdavi
Textbox
VCMStudy.ir
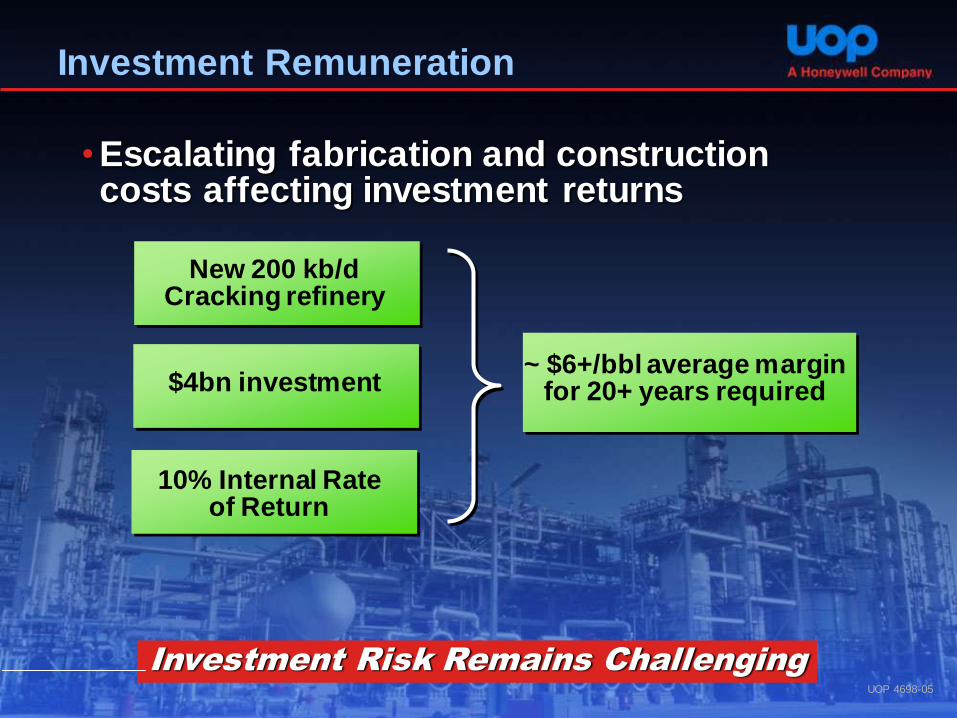
Investment Remuneration
•Escalating fabrication and construction costs affecting investment returns
Investment Risk Remains Challenging
10% Internal Rate of Return
New 200 kb/d Cracking refinery
$4bn investment ~ $6+/bbl average margin
for 20+ years required
UOP 4698-05
mahdavi
Textbox
VCMStudy.ir
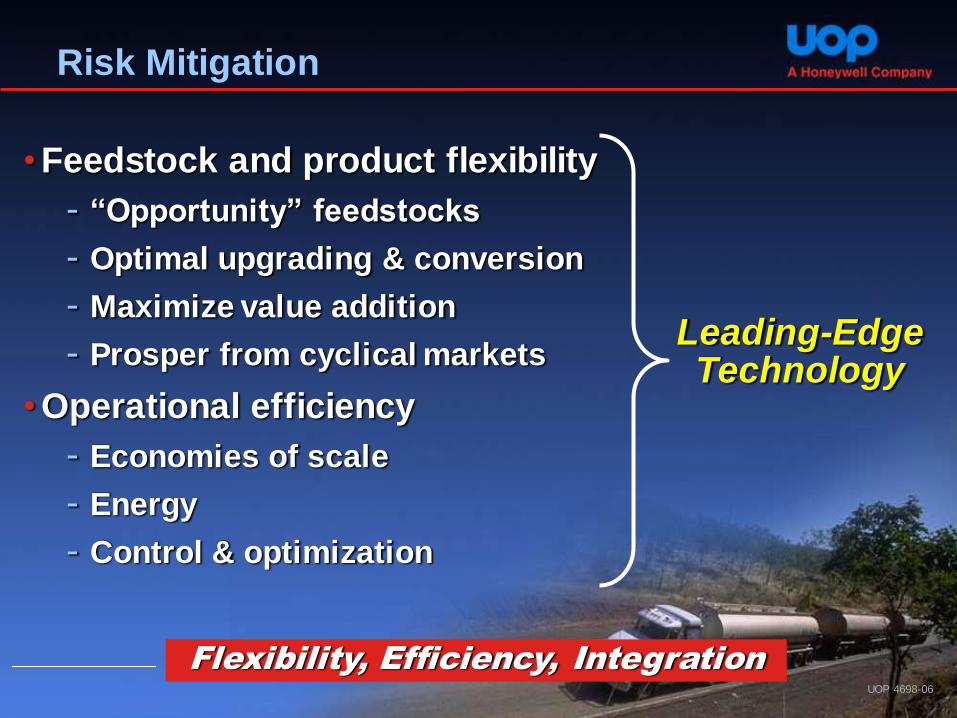
Risk Mitigation
•Feedstock and product flexibility
- “Opportunity” feedstocks
- Optimal upgrading & conversion
- Maximize value addition
- Prosper from cyclical markets
•Operational efficiency
- Economies of scale
- Energy
- Control & optimization
Flexibility, Efficiency, Integration
Leading-Edge Technology
UOP 4698-06
mahdavi
Textbox
VCMStudy.ir
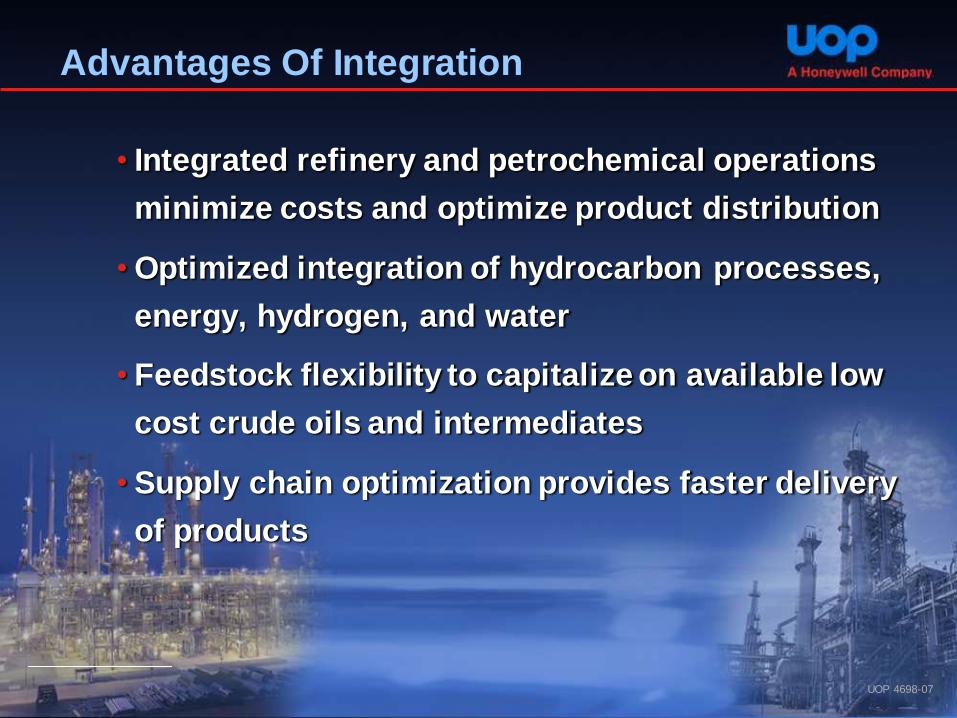
Advantages Of Integration
UOP 4698-07
• Integrated refinery and petrochemical operations
minimize costs and optimize product distribution
• Optimized integration of hydrocarbon processes,
energy, hydrogen, and water
• Feedstock flexibility to capitalize on available low
cost crude oils and intermediates
• Supply chain optimization provides faster delivery
of products
mahdavi
Textbox
VCMStudy.ir
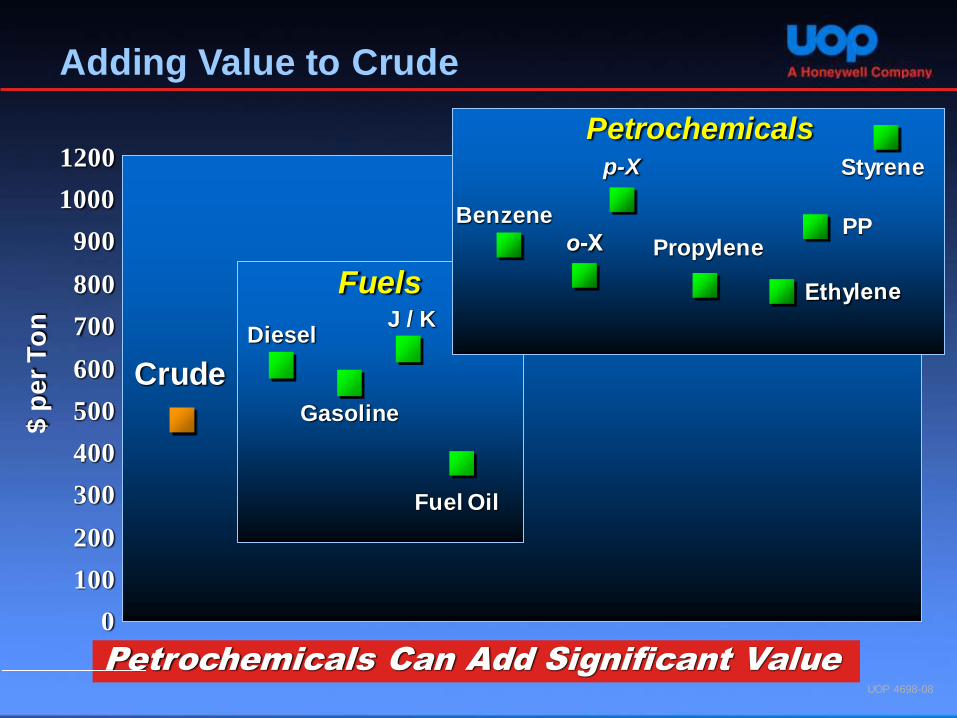
Adding Value to Crude $ p
er
To
n
0
100
200
300
400
500
600
700
800
Crude
900
1000
1200
Fuels
Gasoline
J / K Diesel
Fuel Oil
Petrochemicals
Benzene
Propylene PP
Styrene
Petrochemicals Can Add Significant Value
p-X
UOP 4698-08
mahdavi
Textbox
VCMStudy.ir
0
5
10
15
20
25
30
2000 2001 2002 2003 2004 2005 2006 2007 2008 2009
De
ma
nd
In
cre
as
e
ov
er
19
99
- M
M M
T
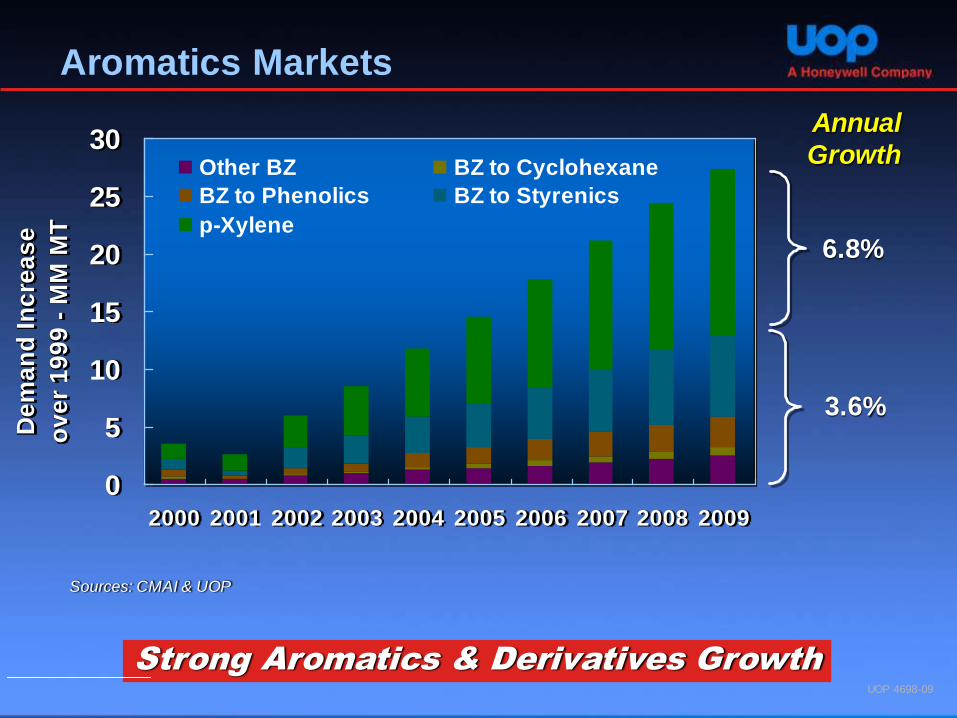
Other BZ BZ to Cyclohexane
BZ to Phenolics BZ to Styrenics
p-Xylene6.8%
3.6%
Sources: CMAI & UOP
Aromatics Markets
Annual
Growth
Strong Aromatics & Derivatives Growth
UOP 4698-09
mahdavi
Textbox
VCMStudy.ir
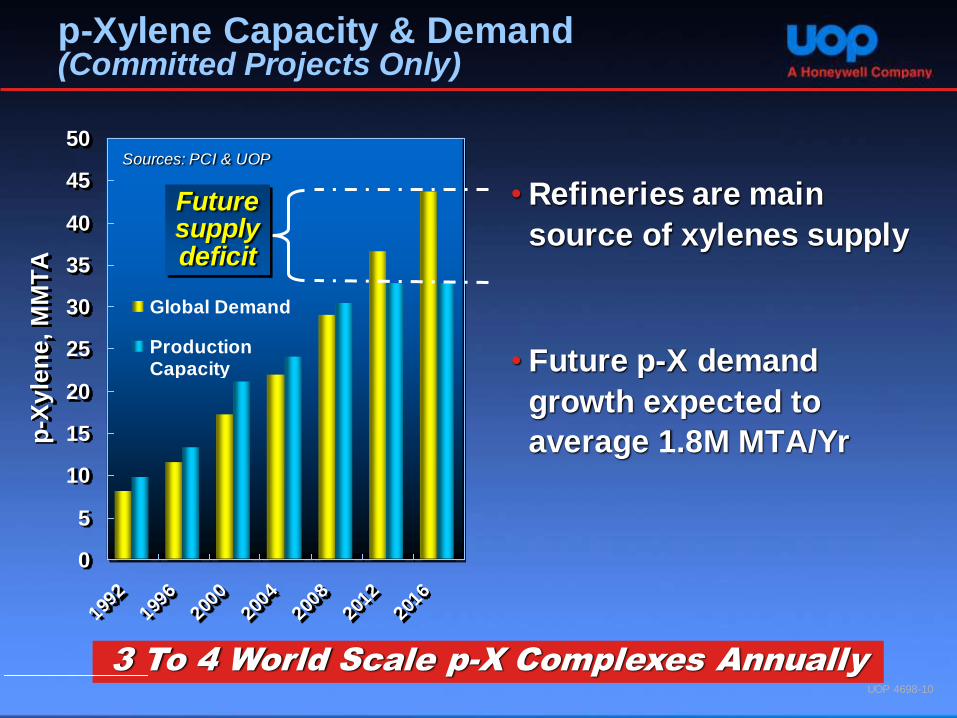
• Refineries are main
source of xylenes supply
• Future p-X demand
growth expected to
average 1.8M MTA/Yr
3 To 4 World Scale p-X Complexes Annually
p-Xylene Capacity & Demand (Committed Projects Only)
0
5
10
15
20
25
30
35
40
45
50
1992
1996
2000
2004
2008
2012
2016
p-X
yle
ne
, M
MT
A
Global Demand
ProductionCapacity
Future supply deficit
Sources: PCI & UOP
UOP 4698-10
mahdavi
Textbox
VCMStudy.ir
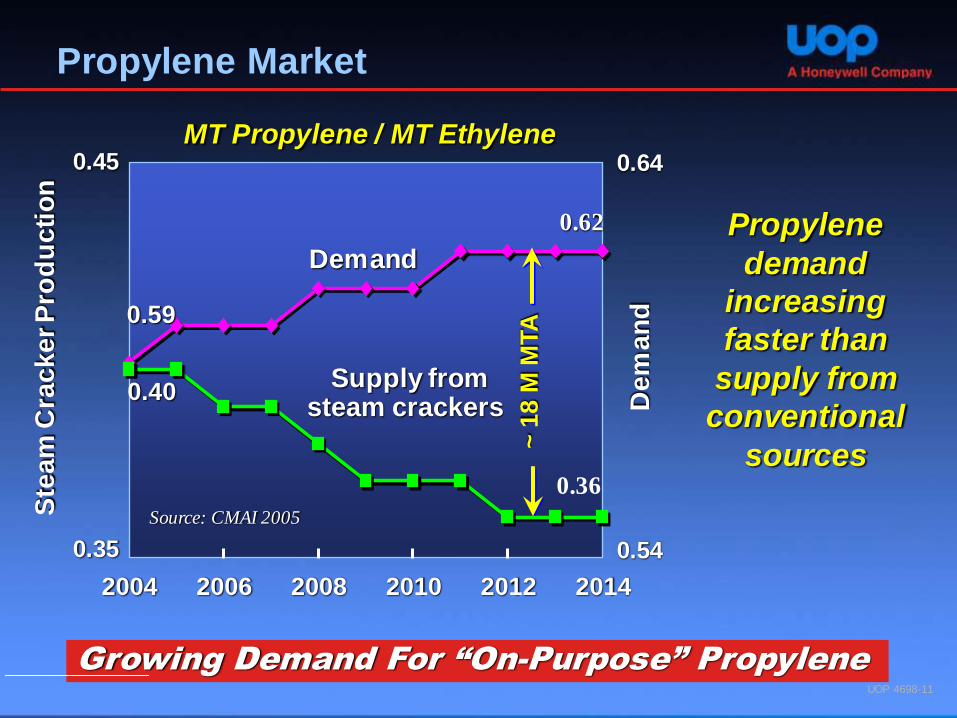
Propylene Market
MT Propylene / MT Ethylene
0.59
2004 2006 2008 2010 2012 2014
Supply from steam crackers
~ 1
8 M
MTA
0.40
0.35
0.45
Ste
am
Cra
cker P
rod
ucti
on
0.54
0.64
Dem
an
d
Source: CMAI 2005
Demand
0.62
0.36
Propylene
demand
increasing
faster than
supply from
conventional
sources
Growing Demand For “On-Purpose” Propylene
UOP 4698-11
mahdavi
Textbox
VCMStudy.ir
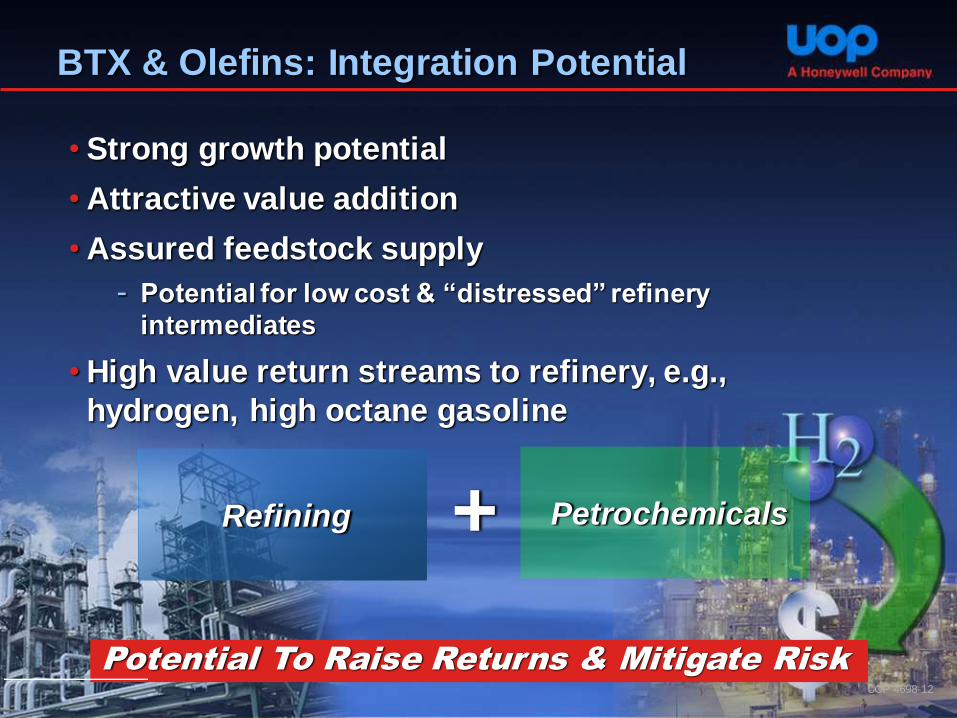
BTX & Olefins: Integration Potential
• Strong growth potential
• Attractive value addition
• Assured feedstock supply
- Potential for low cost & “distressed” refinery
intermediates
• High value return streams to refinery, e.g.,
hydrogen, high octane gasoline
Potential To Raise Returns & Mitigate Risk
+ Petrochemicals Refining
UOP 4698-12
mahdavi
Textbox
VCMStudy.ir
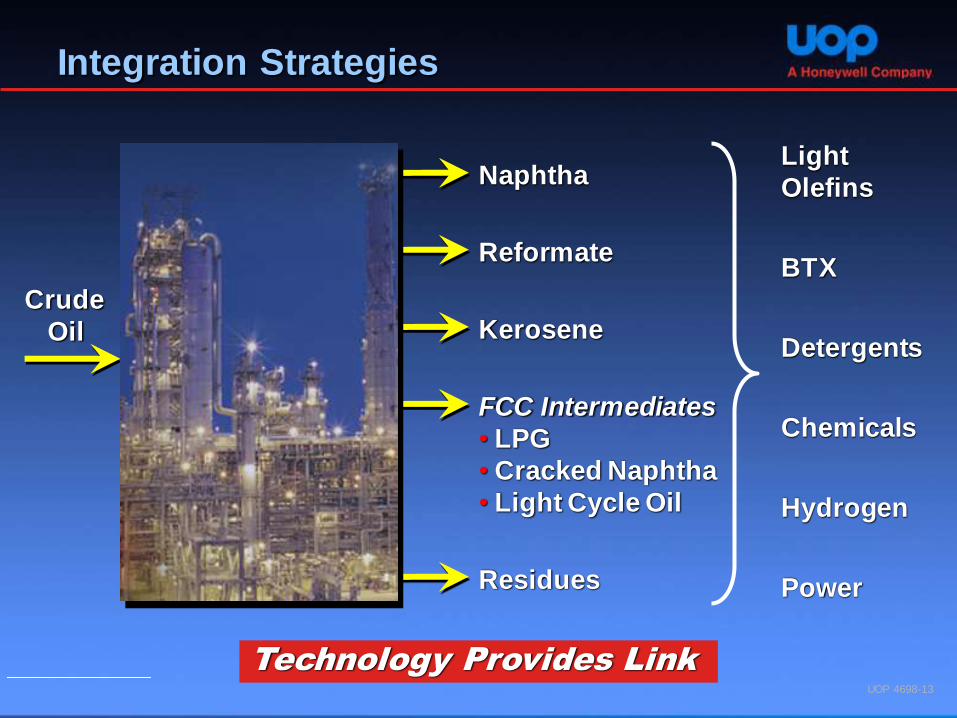
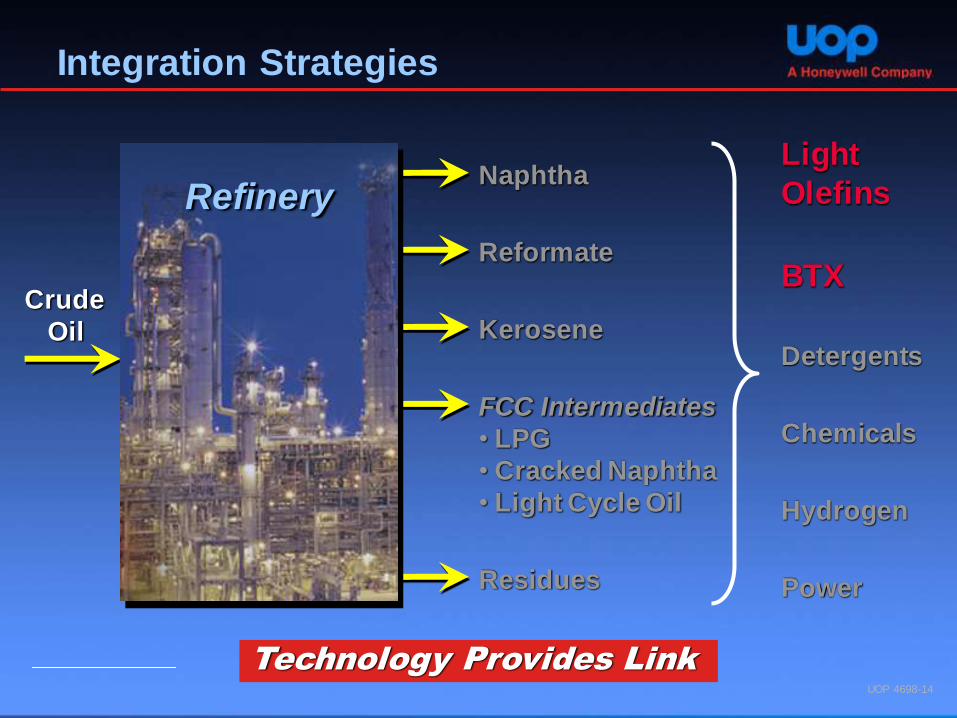
Integration Strategies
Light
Olefins
BTX
Detergents
Chemicals
Hydrogen
Power
Technology Provides Link
Crude
Oil
Naphtha
Reformate
FCC Intermediates
• LPG
• Cracked Naphtha
• Light Cycle Oil
Residues
Kerosene
Refinery
UOP 4698-13
mahdavi
Textbox
VCMStudy.ir
Crude
Oil
Naphtha
Reformate
FCC Intermediates
• LPG
• Cracked Naphtha
• Light Cycle Oil
Residues
Kerosene
Refinery
Integration Strategies
Light
Olefins
BTX
Detergents
Chemicals
Hydrogen
Power
Technology Provides Link
UOP 4698-14
mahdavi
Textbox
VCMStudy.ir
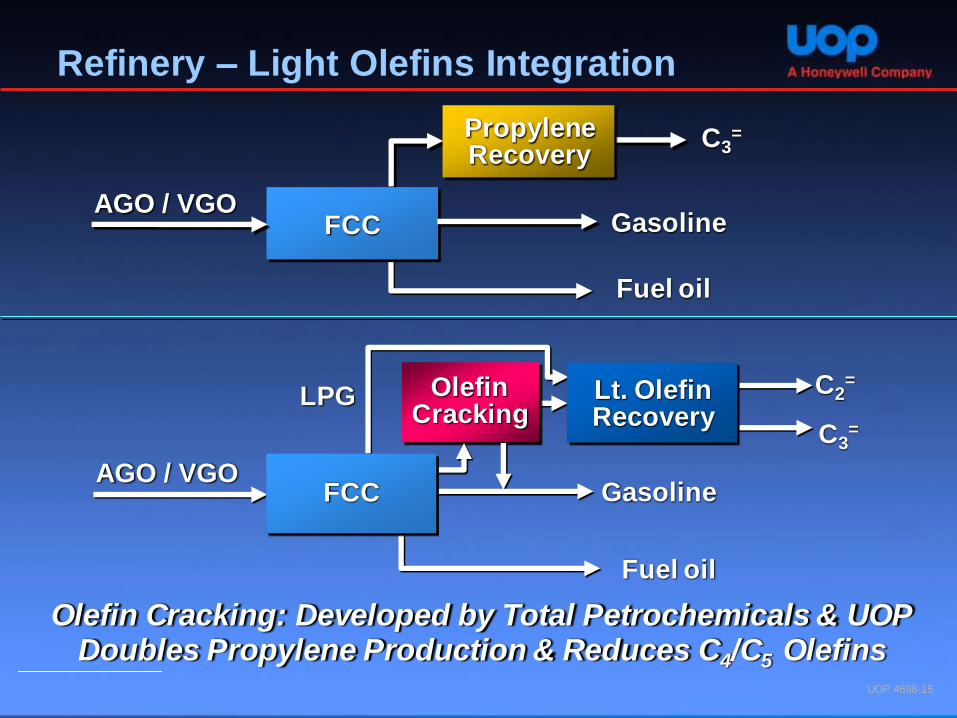
AGO / VGO
Refinery – Light Olefins Integration
Gasoline
Fuel oil
C3=
FCC
Propylene Recovery
Olefin Cracking
UOP 4698-15
Olefin Cracking: Developed by Total Petrochemicals & UOP Doubles Propylene Production & Reduces C4/C5 Olefins
LPG
AGO / VGO
Fuel oil
Gasoline
C3=
Lt. Olefin Recovery
FCC
C2=
Lt. Olefin Recovery
FCC
mahdavi
Textbox
VCMStudy.ir
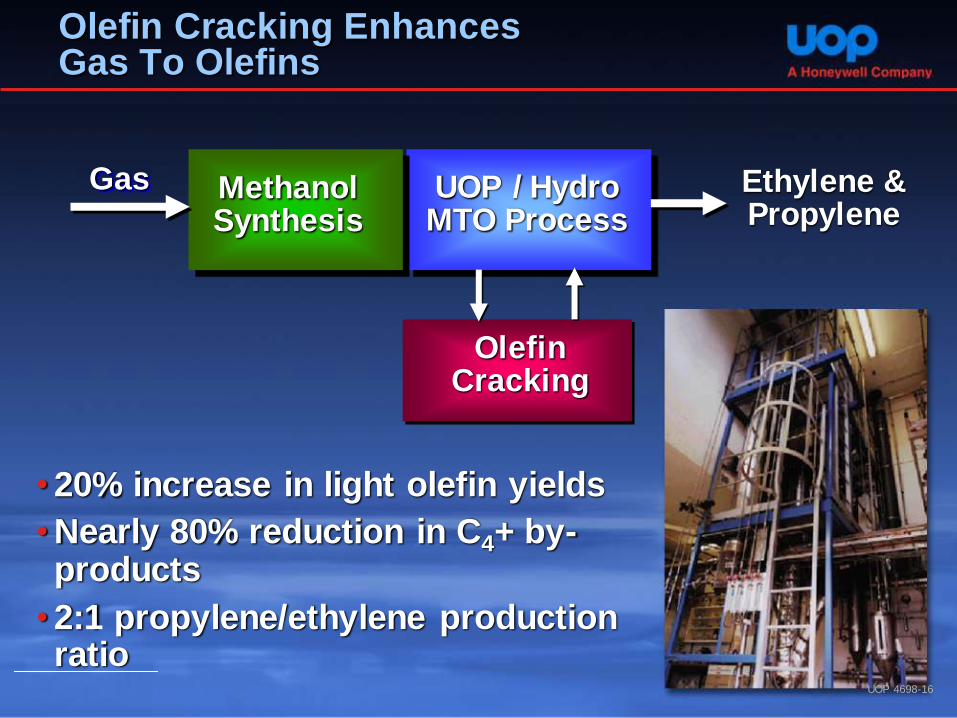
Olefin Cracking Enhances Gas To Olefins
Ethylene & Propylene
Gas UOP / Hydro MTO Process
Methanol Synthesis
Olefin Cracking
•20% increase in light olefin yields
•Nearly 80% reduction in C4+ by-products
•2:1 propylene/ethylene production ratio
UOP 4698-16
mahdavi
Textbox
VCMStudy.ir
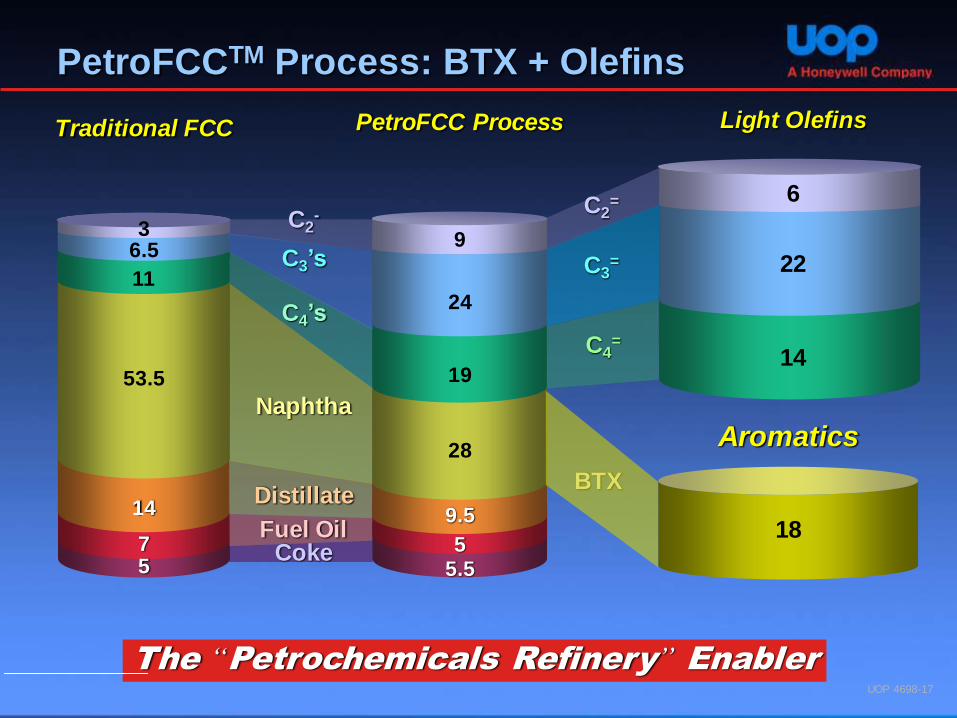
PetroFCCTM Process: BTX + Olefins
Naphtha
Distillate
Fuel Oil Coke
53.5
14
7 5
28
9.5
5.5 5
C4’s
11
19 14
C4=
Traditional FCC PetroFCC Process Light Olefins
C3’s 6.5
24
22 C3=
C2-
9
6 C2
=
3
18
Aromatics
BTX
The “Petrochemicals Refinery” Enabler
UOP 4698-17
mahdavi
Textbox
VCMStudy.ir
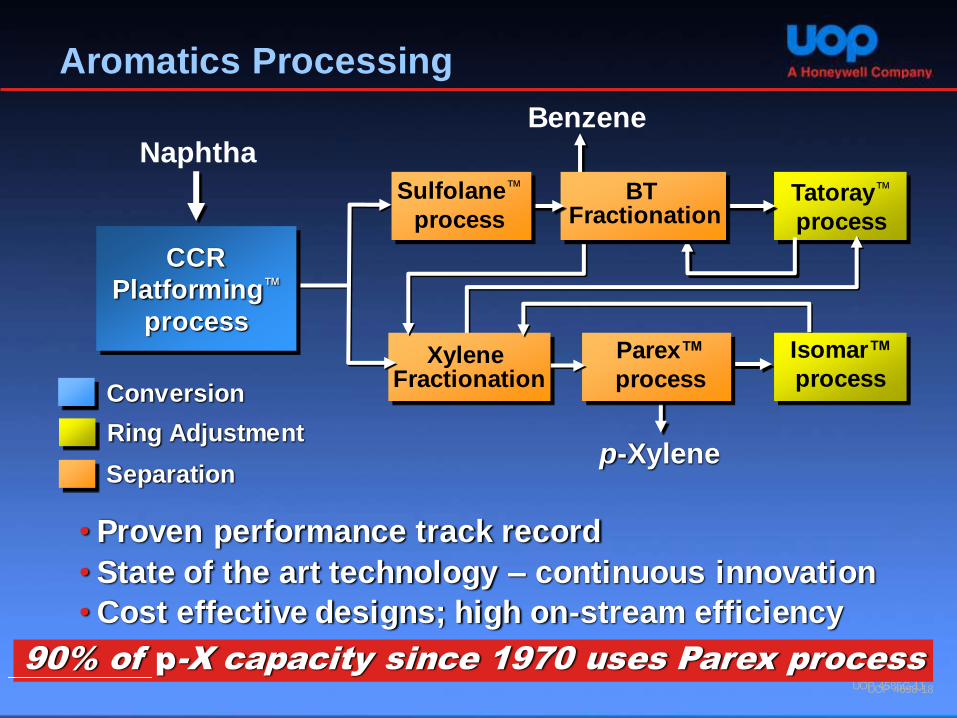
Tatoray™
process
Aromatics Processing
p-Xylene
Xylene Fractionation
Parex™
process
Benzene
CCR
Platforming™
process
Naphtha
Conversion Ring Adjustment Separation
UOP 4585C-11
• Proven performance track record
• State of the art technology – continuous innovation
• Cost effective designs; high on-stream efficiency
90% of p-X capacity since 1970 uses Parex process
BT Fractionation
Sulfolane™
process
Isomar™
process
UOP 4698-18
mahdavi
Textbox
VCMStudy.ir
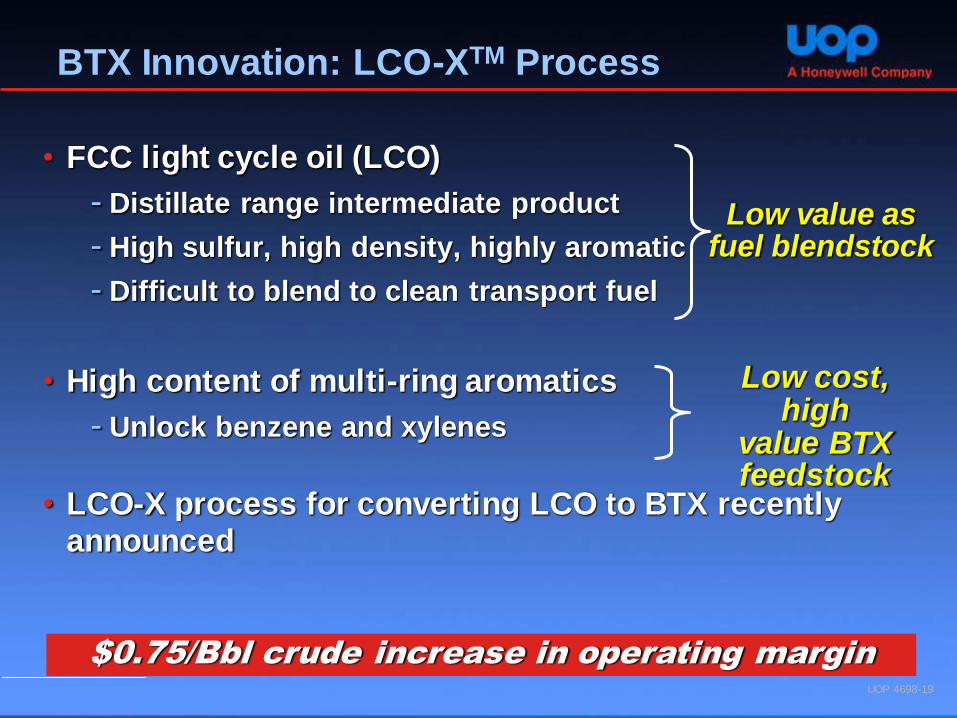
BTX Innovation: LCO-XTM Process
• FCC light cycle oil (LCO)
- Distillate range intermediate product
- High sulfur, high density, highly aromatic
- Difficult to blend to clean transport fuel
• High content of multi-ring aromatics
- Unlock benzene and xylenes
Low value as fuel blendstock
Low cost, high
value BTX feedstock
$0.75/Bbl crude increase in operating margin
• LCO-X process for converting LCO to BTX recently announced
UOP 4698-19
mahdavi
Textbox
VCMStudy.ir
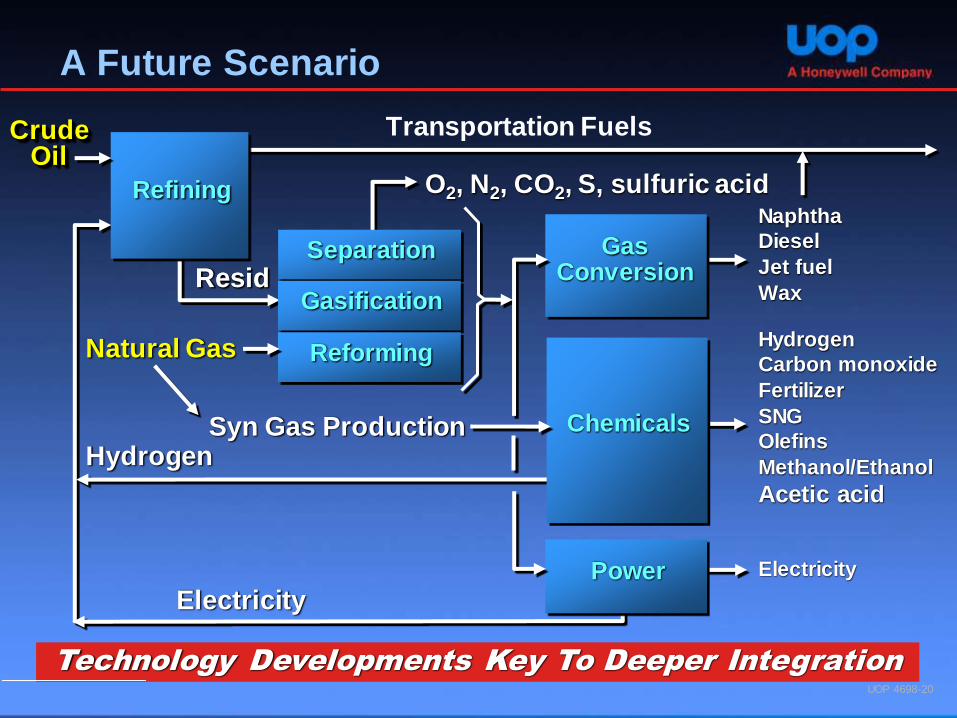
Refining
Gasification
Syn Gas Production
Hydrogen
Carbon monoxide
Fertilizer
SNG
Olefins
Methanol/Ethanol
Acetic acid
Naphtha
Diesel
Jet fuel
Wax
Electricity
Separation
O2, N2, CO2, S, sulfuric acid
Transportation Fuels
Resid
Natural Gas Reforming
Electricity
Hydrogen
A Future Scenario
Chemicals
Gas Conversion
Power
Crude Oil
Resid
Technology Developments Key To Deeper Integration
UOP 4698-20
mahdavi
Textbox
VCMStudy.ir
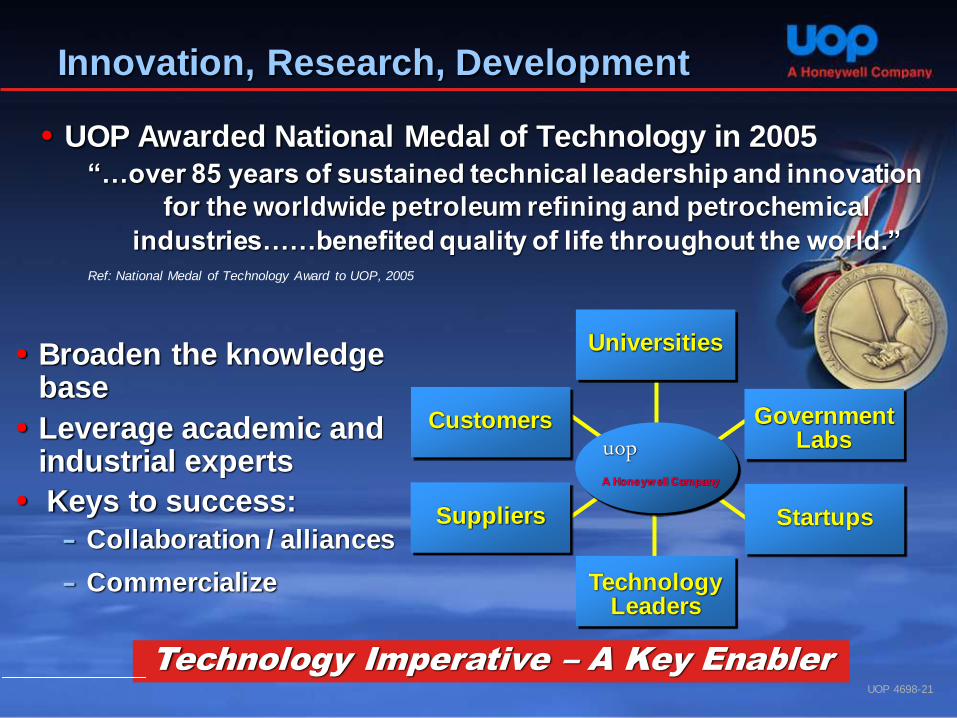
Innovation, Research, Development
Broaden the knowledge base
Leverage academic and industrial experts
Keys to success:
− Collaboration / alliances
− Commercialize
Technology Imperative – A Key Enabler
UOP Awarded National Medal of Technology in 2005 “…over 85 years of sustained technical leadership and innovation
for the worldwide petroleum refining and petrochemical
industries……benefited quality of life throughout the world.”
Universities
Government Labs
Startups
Technology Leaders
Customers
Suppliers
uop A Honeywell Company
UOP 4698-21
Ref: National Medal of Technology Award to UOP, 2005
mahdavi
Textbox
VCMStudy.ir
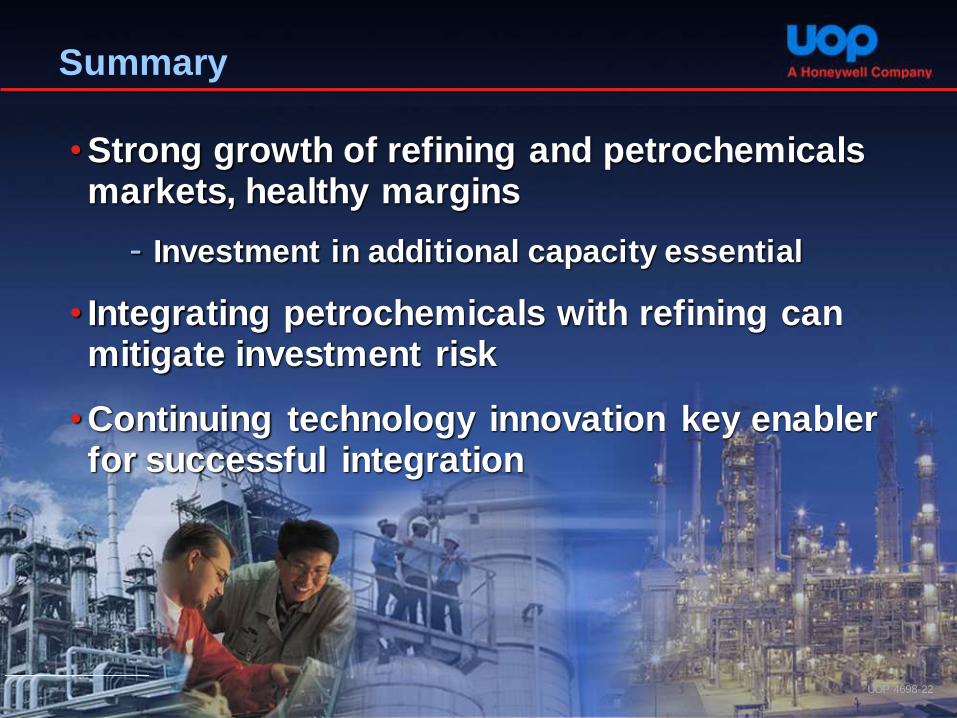
Summary
•Strong growth of refining and petrochemicals markets, healthy margins
- Investment in additional capacity essential
• Integrating petrochemicals with refining can mitigate investment risk
•Continuing technology innovation key enabler for successful integration
UOP 4698-22
mahdavi
Textbox
VCMStudy.ir
Thank You
UOP 4698-23
mahdavi
Textbox
VCMStudy.ir