REFINING U.S. PETROLEUM A SURVEY OF U.S. REFINERY USE OF GROWING U.S. CRUDE OIL PRODUCTION March 2015 A Report by American Fuel & Petrochemical Manufacturers Survey Conducted by Veris Consulting Charles LeRoy
Transcript
REFINING U.S. PETROLEUMA SURVEY OF U.S. REFINERY USE OF GROWING U.S. CRUDE OIL PRODUCTION
March 2015
A Report by
American Fuel & Petrochemical Manufacturers
Survey Conducted by
Veris ConsultingCharles LeRoy
Refining U.S. Petroleum A Survey of U.S. Refinery Use of Growing U.S. Crude Oil Production
REFINING U.S. PETROLEUMA SURVEY OF U.S. REFINERY USE OF GROWING U.S. CRUDE OIL PRODUCTION
March 2015
A Report by
American Fuel & Petrochemical Manufacturers
Survey Conducted by
Veris ConsultingCharles LeRoy
Refining U.S. Petroleum A Survey of U.S. Refinery Use of Growing U.S. Crude Oil Production
Electronic Access
This report is available on AFPM’s website in PDF format. It can be found at http://afpm.org/uploadedFiles/Refining-US-Capacity.pdf
Contacts
The report was prepared by:
American Fuel & Petrochemical Manufacturers1667 K Street, NWSuite 700Washington, DC 20006202-457-0480
Media questions or comments may be directed to Diana Cronan ([email protected]), and technical questions to Joanne Shore ([email protected]).
Appendix A. Misunderstanding U.S. Refineries’ Ability to Use Increasing U.S. Light Crude Production ........................................................................................................20
Appendix B. AFPM Technical Papers on Processing Light Tight Oil .....................................23
Appendix C. Survey Form ............................................................................................................25
Appendix D. Petroleum Administration for Defense District Map .........................................31
Refining U.S. Petroleum A Survey of U.S. Refinery Use of Growing U.S. Crude Oil Production
Figures
Figure 1 U.S. Regional Crude Oil Production.............................................................................. 4
Figure 2 Location and Volume of New Production Relative to Refining Required Significant Infrastructure Changes ................................................................................................. 5
Figure 3 U.S. Crude Production Growth is Mainly Very Light (>42°API) .............................. 6
Figure 4 Growing U.S. Production Reduced U.S. Crude Imports ............................................ 7
Figure 5 Annual Average Historical & Future Tight Oil Changes in Crude Quality ............. 11
Figure 6 Planned Use of Super Light Crude Oil vs. Capability to Use ................................... 13
Figure 7 Separating Crude Oil into Streams for Further Processing ....................................... 15
Table 2 Survey Respondent Refinery Size Distribution ...............................................................9
Table 3 Total Refinery Actual and Planned Inputs of Crude Oil by Gravity .........................10
Table 4 Share of Crude Quality Inputs (Excluding Condensates) ............................................10
Table 5 PADD 2 Refinery Actual and Planned Inputs of Crude Oil by Gravity ..................11
Table 6 PADD 3 Refinery Actual and Planned Inputs of Crude Oil by Gravity ..................12
Table 7 Total Capability to Process Increasing U.S. Light Crude Oil Greater than 30.9° API ................................................................................................................................13
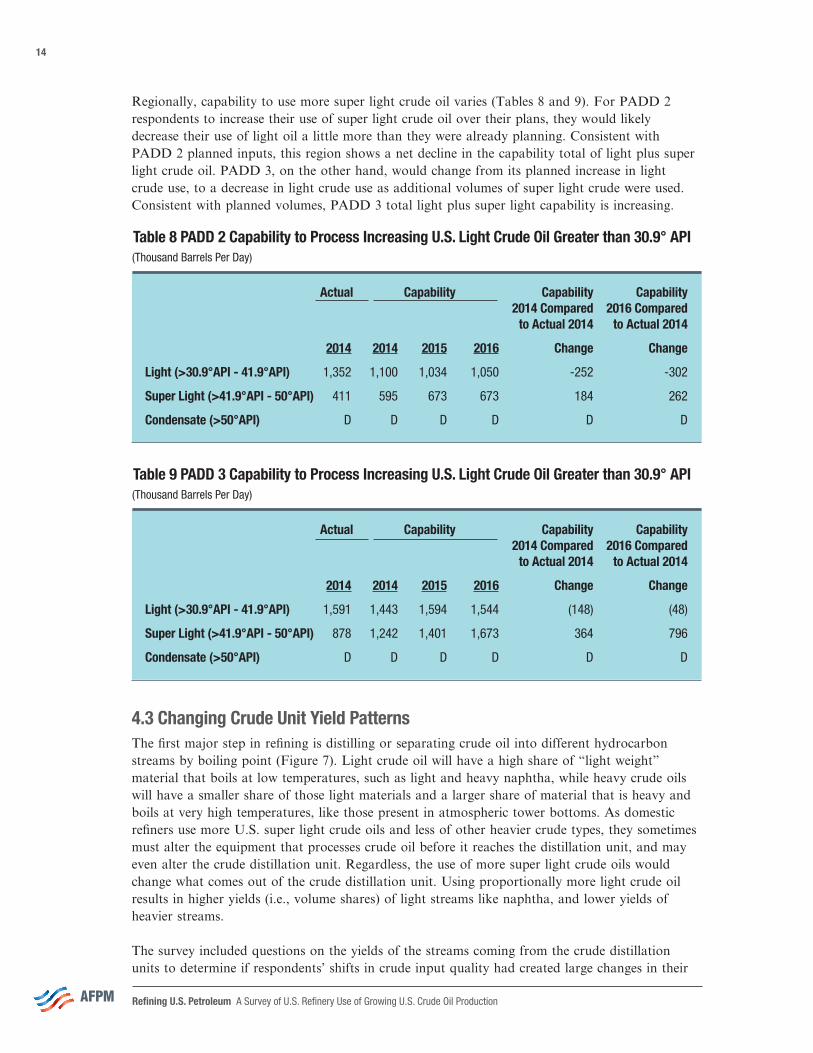
Table 8 PADD 2 Capability to Process Increasing U.S. Light Crude Oil Greater than 30.9° API ................................................................................................................................14
Table 9 PADD 3 Capability to Process Increasing U.S. Light Crude Oil Greater than 30.9° API ................................................................................................................................14
Table 10 Average Crude Distillation Yields ..............................................................................15
Table 11 U.S. Light (> 31° API) Crude Volume Increases Allocated to Means of Increase & Ranking by Volume....................................................................................................16
Table 12 Relative Crude Access Activity by Tight Oil Region and Transportation Mode 2013-2016 .............................................................................................................................17
Table 13 2013-2016 Aggregate Investment Ranking to Use More U.S. Crude Oil & Associated Crude Capacity Increases ................................................................................18
Refining U.S. Petroleum A Survey of U.S. Refinery Use of Growing U.S. Crude Oil Production
1
SummaryThe unexpected and welcomed reversal of declining U.S. crude production since 2008 has benefitted the nation in many ways. Most of the recent U.S. crude oil production growth has come from geologi-cal structures called tight oil formations, which contain very light and sweet (low sulfur) quality crude oils. Refiners run many different quality crude oils, and most U.S. refiners have added capability to run heavy sour (high sulfur) quality crude oils. These two facts – increasing light sweet production and refining heavy sour crude processing capability – have created much confusion and misunderstanding about U.S. refiners’ capability to use the increasing volumes of light sweet crude being produced and the economics around the issue (Appendix A).
The American Fuel & Petrochemical Manufacturers (AFPM) decided that a simple first step to understanding U.S. refiners’ capability to handle growing U.S. supply was to ask its membership about their plans and capabilities for using this new crude. This report highlights the results of the voluntary survey developed by AFPM and administered by a third party. AFPM represents virtually all U.S. refining and petrochemical manufacturing capacity.
The respondents to this survey represent 61 percent of U.S. refining capacity. The highest response rates came from the Gulf Coast, East Coast and Midwest regions where much of the new U.S. production is being used.
The respondent industry subset indicates that from 2014 through 2016, they plan to increase their use of “super light” crude oil by more than 730,000 barrels per day. Super light crude oil (42 to 50° API gravity1) is the gravity range of most new U.S. tight oil production. Furthermore, if logistics access to the new crude oil were not an issue and economics supported increased use of this oil, the respondents have the capability - in place or in progress - to run an additional 800,000 barrels
1 API gravity is a measure of the density of oil. The larger the API gravity, the lighter and less dense the petroleum. Light crude oils are defined for this report at 31° API gravity and higher. Heavy crude oils begin at 24° API gravity and lower. Medium weight crude oils are in between.
Planned Use of Super Light Crude Oil vs. Capability to Use
2013 2014 2015 2016
3,500
3,000
2,500
2,000
1,500
1,000
500
0
1,411
1,723
2,589
2,149
2,917
2,456
3,254
1,53
1
866
798
Thou
sand
Bar
rels
Per
Day
Actual/Planned
Capability
Note: Capability represents potential volumes that could be run if economics were favorable, and if delivery of the crude oil were not an issue.
Refining U.S. Petroleum A Survey of U.S. Refinery Use of Growing U.S. Crude Oil Production
2
in 2016. That amount, over and above the 730,000 barrels per day increase in their current plans, means that the respondent subset alone has a capability to refine 1.5 million barrels per day more super light crude oil in 2016 than they processed in 2014.
The survey indicates that the respondent industry subset has more than enough processing capability to absorb all new U.S. super light oil production that the Energy Information Administration (EIA) is projecting through 2016. EIA’s February 2015 outlook2 shows production in the lower 48 states to increase 720,000 barrels per day from 2014 through 2016. This volume contains the tight oil formation production. The federal Gulf of Mexico production is projected to increase another 220,000 barrels per day, but this crude oil is closer to medium sour quality and has properties that make it easier to process than light tight oil.
The survey results representing 61 percent of U.S. capacity emphasize that U.S. refiners are not capacity constrained in the next several years to use the growing super light production from U.S. tight oil formations. The survey respondents will achieve their plans to increase use of this new crude production by continuing to reduce imported light and medium quality crude oils and by investing to better utilize this domestic resource. Under more favorable logistics and economic conditions,3 respondents have the physical capability to process substantially higher volumes than reflected in their plans. With nearly 40 percent of the refining industry unrepresented in these re-sults, total U.S. industry plans for increasing super light crude oil, as well as physical capability to run more light crude oil, represent volumes even larger than the results of this survey. Inadequate delivery infrastructure has delayed U.S. refinery access to the new production, but significant changes and expansion in this infrastructure have and will continue to occur.
2 EIA’s February 2015 Short-Term Energy Outlook.3 The survey did not define explicit economic requirements for respondents to consider when estimating their
full capability to process U.S. light crude oils.
Refining U.S. Petroleum A Survey of U.S. Refinery Use of Growing U.S. Crude Oil Production
3
1 IntroductionThe unexpected and welcomed achievement of increasing U.S. crude production has benefitted the nation in many ways. These production increases have improved U.S. energy security by allowing U.S. refiners to back out crude imports from distant, less stable areas of the world. U.S. crude imports from areas outside of North America (i.e., Canada and Mexico), declined from 6.7 million barrels per day in 2007 before the large increase in tight oil production to 3.7 million barrels per day in 2014.4 U.S. share of crude oil supply coming from imports outside of North America dropped from 45 percent in 2007 to 23 percent in 2014.
Most of the U.S. crude oil production increase has come from geological structures called tight oil formations and is very light (high API gravity) and sweet (low sulfur) in quality. Tight oil formations constrain the flow of petroleum, which made them too expensive to produce prior to deployment of advanced drilling and completion processes such as horizontal drilling and hydraulic fracturing.5 The recent advances in these production technologies have opened significant domestic petroleum resources to economic development.
Refiners process many different quality crude oils, and most U.S. refiners have made investments to add heavy sour (high sulfur) quality crude oils. Two apparently disjointed facts – increasing light sweet production and high percentage of refineries processing heavy sour oil – have created misunderstanding about the capability and economic competitiveness of U.S. refiners using increasing volumes of U.S. light sweet tight oil (Appendix A). This survey emphasizes U.S. refiners’ capabilities.
The question of how much U.S. light sweet crude domestic refiners might be able to use with competitive economics in the short term is important information for producers and policymakers. Refining is a critical part of the evolving energy landscape, and good information about refining capabilities is necessary to ensure sound policy decisions. AFPM decided to collect information about U.S. refiners’ capability to handle growing U.S. supply by asking its members about their plans and capabilities to use this new crude oil. AFPM members represent virtually all U.S. refining and petrochemical manufacturing capacity.
The survey responses are summarized in this report. The document begins with a brief description of the rapidly changing petroleum environment, and is followed by a chapter describing the survey approach and response rates. The results chapter is divided into the five main areas that were surveyed: actual and planned crude oil use by quality; capability to run increasing crude oil production; changing U.S. refining crude unit yield patterns; logistics paths used to obtain U.S. light crude oil; and investments to increase capability to process U.S. light crude oil.
4 Available EIA data from January through November 2014. 5 “Understanding Tight Oil,” Canadian Society for Unconventional Resources.
Refining U.S. Petroleum A Survey of U.S. Refinery Use of Growing U.S. Crude Oil Production
4
2 BackgroundThe changes in the petroleum sector that have occurred over the past 30 years have been large and profound. A long decline in U.S. production (Figure 1) began in the mid-1980’s as fields in areas like Alaska were depleting and restrictions on resource development in federally controlled areas hindered adding replacement volumes. Recently, however, U.S. production has shown a dramatic increase since it bottomed out in 2008 at around 5 million barrels per day, and is expected to average almost 8.7 million barrels per day in 2014 – a 73 percent increase. The increase is even steeper when considering North America overall. Most of that increase has come from tight oil formations located in traditional producing areas like Texas and in new areas like North Dakota. This boom in production was the result of advances in extraction and recovery techniques using horizontal drilling and hydraulic fracturing, which produce economic petroleum flow rates from the low-permeable tight oil formations.
The existing distribution infrastructure to move crude oil to refineries was not designed to handle these new flows. The major refining centers (Figure 2) are far from production areas like North Dakota, and the existing infrastructure in traditional producing areas like Eagle Ford and Permian Basin was not initially able to accommodate the new increase in flows. Production preceded delivery infrastructure changes and stranded crude oil in areas like Cushing, Oklahoma sold at deep discounts to equivalent quality international crude oils until delivery infrastructure expanded to help relieve that bottleneck. Crude price discounts have helped to hasten crude logistics investments and changes.
Refiners, along with others, invested in rail unloading facilities, tank cars, pipeline changes and other transport capabilities to gain access to this new crude oil. Pipelines adapted by reversing, expanding, and even changing under-utilized natural gas pipelines to crude oil delivery, moving the new production along existing routes to existing markets. Rail movements expanded offering service where pipelines did not exist. Rail options allowed flexibility in pickup and delivery points, and provided the ability to expand and contract with smaller up-front financial commitments, but
Figure 1 U.S. Regional Crude Oil Production
Jan 81 Jan 86 Jan 91 Jan 96 Jan 01 Jan 06 Jan 11
10
9
8
7
6
5
4
3
2
1
0
Mill
ion
Barr
els
Per D
ay
Rest of U.S.
California
Alaska
North Dakota
Texas
Source: Energy Information Administration.
Refining U.S. Petroleum A Survey of U.S. Refinery Use of Growing U.S. Crude Oil Production
5
higher operating costs. Inland and coastal waterborne movements of domestic crude oil increased substantially, pulling hard on limited vessel availability. While U.S. refinery access to growing domestic crude production has improved considerably since 2008, logistics are still lagging behind production.
Most of the increase in U.S. crude oil production is light quality oil, with especially strong growth in a very light category ranging from 40-50° API gravity (Figure 3). Prior to U.S. tight oil development, refiners had focused on processing increasing volumes of heavy high sulfur crude oil. In the 1980’s, U.S. refiners on the Gulf Coast began to invest to process heavy high sulfur crude oils from growing production in nearby areas such as Mexico and Venezuela as well as other parts of the world. More recently, refiners in the Midwest have been adding capability to process heavy oils emerging from Canada. But, processing heavy crude oil does not physically prevent refiners from processing more volumes of light crude oil. Under the right economic circumstances, more light crude can be used.
Refiners typically process a mix of crude oils with different qualities. Their facilities can operate with varying proportions of light, medium and heavy crude. Besides density, as measured by API gravity, other tight oil characteristics impact refinery processing. For example, the naphtha6 content in tight oils
Figure 2 Location and Volume of New Production Relative to Refining Required Significant Infrastructure Changes
Light & Heavy Crude OilsCrude oil varies in density or weight over a large range. For convenience, crude oils are frequently discussed as light, medium or heavy quality oils. Light crude oil contains a higher percentage of light weight material (much of which is similar in density and boiling range to gasoline and diesel fuel) than heavy crude oil contains. Heavy crude oil has a lower share of light material and a higher share of heavy, dense material. Heavy crudes typically require more processing steps in order to be turned into useful finished products. Medium density crudes fall in between light and heavy.
Current play - Oldest stacked playCurrent play - Intermediate depth/age stacked playCurrent play - Shallowest/youngest stacked playProspective playBasin
* Mixed shale & chalk play ** Mixed shale & limestone play *** Mixed shale & dolostone- siltstone-sandstone play **** Mixed shale & limestone- siltstone-sandstone play
Source: U.S. Energy Information Administration based on data from various published studies.Updated: January 8, 2015.
6 Naphtha is a stream of material distillated from crude oil that goes into gasoline or petrochemical feedstocks.
Lower 48 States Shale Plays
Refining U.S. Petroleum A Survey of U.S. Refinery Use of Growing U.S. Crude Oil Production
6
is large enough to challenge the existing processing equipment of some refiners. These tight oils also have high paraffin (wax) contents that can impact cold flow diesel fuel properties, potentially requiring some refining changes and/or investments.7 To date, U.S. refiners have absorbed the increasing U.S. light crude production by:
• Replacing imported light crude of similar quality to U.S. light crude oils;• Increasing overall refinery utilization (use more of everything including U.S. light crude oils);• Replacing light high sulfur and medium gravity imports with U.S. very light crude oil; and • Investing in refinery changes to use more U.S. light crude oil.
As a result, between 2007, prior to the tight oil production surge, and 2013, crude imports dropped by 2.3 million barrels per day (Figure 4). During that period, crude inputs to refineries increased slightly by 0.2 million barrels per day. Light and medium quality crude imports declined the most, and since 2007, super light crude imports (42-50 °API) practically disappeared. Heavy crude oil volumes remained flat during that same period.
While U.S. crude production increased, U.S. demand decreased for finished petroleum products.8 Gasoline declined mainly due to the recession and increasing vehicle efficiency. EIA has projected gasoline demand to continue to decline long term as light-duty vehicles become more fuel efficient. By contrast, diesel demand is expected to continue to grow long term, since most of this product is used in commercial trucks, which EIA does not project9 to experience the same degree of
Figure 3 U.S. Crude Production Growth is Mainly Very Light (>40°API)
2011 2012 2013 2014 2015
10
9
8
7
6
5
4
3
2
1
0
Mill
ion
Barr
els
Per D
ay
API 50+
API 45-50
API 40-45
API 40-50 sweet
API 35-40 sweet
API 35-40 sour
API 27-35 med-sour
API 27-35 sour
California
API <27 sweet
API <27 sour
Source: Edited graph from Energy Information Administration; sweet (low sulfur), sour (high sulfur). See also Energy Information Administration, U.S. Crude Oil Production Forecast: Analysis of Crude Types, May 29, 2014.
7 “Optimizing Naphtha Complexes in the Tight Oil Boom,” UOP LLC, a Honeywell Company, Mary Jo Wier et al, 2014; also see Appendix B listing relevant American Fuel & Petrochemical Manufacturers’ technical papers.
8 Finished petroleum products includes biofuel use in gasoline and distillate fuels. 9 Energy Information Administration, 2014 Annual Energy Outlook.
Refining U.S. Petroleum A Survey of U.S. Refinery Use of Growing U.S. Crude Oil Production
7
efficiency improvements. International diesel fuel and heating oil demand have grown faster than gasoline and are expected to continue that trend. U.S. refiners have been changing operations and investing in order to increase the yield or proportion of diesel fuel from a barrel of crude oil.
U.S. finished product demand peaked in 2005 at almost 18.7 million barrels per day. By 2013 it dropped to 16.5 million barrels per day — a decline of 12 percent from its peak. The decline in U.S. demand left a surplus of U.S. refining capacity that has been used to export fuel and petrochemical products to the rest of the world. In 2009, the United States went from a net petroleum product importer to a net product exporter. These product exports allowed domestic refiners to run at higher utilization and supply U.S. demand. In 2014, net product exports
12,000
10,000
8,000
6,000
4,000
2,000
0
Thou
sand
Bar
rels
Per
Day
Figure 4 Growing U.S. Production Reduced U.S. Crude Imports
2007 2013
>50 Condensate
>41.9-50 Super Light
>30.9-41.9 Light
>24-30.9 Medium
<=24 Heavy
Source: Energy Information Administration.
3,707
2,060
3,626548
3,652
1,607
2,336 98
7
60
(finished products plus gasoline components) averaged about 1.7 million barrels per day. Additionally, investments to improve yields and produce more diesel fuels relative to gasoline have helped meet the most pressing international demand needs, while fully supplying U.S. markets.
In summary, as U.S. refiners reduced crude oil imports from overseas, those foreign supplies were freed to be used in foreign refineries to fill demand in other parts of the world. At the same time, U.S. refiners were able to supply more product exports into the world, while fully supplying shrinking U.S. consumption. U.S. refiners’ declining need for crude imports and increasing product exports stemming from our growing supply of U.S. crude oil increased world petroleum supply, which put downward pressure on world crude price. These survey results examine U.S. refining capability to use the increasing supply of light tight crude oil over the next few years.
Refining U.S. Petroleum A Survey of U.S. Refinery Use of Growing U.S. Crude Oil Production
8
3 Survey Approach and Response This chapter provides a general description of the information being collected and response rates in order to help the reader interpret the results. A copy of the survey is provided in Appendix C.
3.1 ApproachThe purpose of this survey was to explore U.S. refiners’ ability to make use of growing U.S. light crude oil production. As such, the questions focus on refiners’ use of different crude qualities. The main quality of interest is the density or light/heavy quality measured by API gravity, and many survey questions break down crude information into API gravity categories.
While refiners have been able to use increased U.S. production of light tight oil to date, claims have been made that U.S. refiners are now seriously constrained and cannot use any more of this crude oil.10 To help clear up this confusion, the survey asked about refiners’ plans through 2016. Pushing beyond that time frame would increase response uncertainty. Not only do market conditions change, but capital projects further out in time are much less certain. Most capital projects scheduled to be completed within the next two years are underway or fully committed, and as such, are much more certain.
This conservative time limitation means that the expected increase in the ability to process light sweet crude from projects already underway, but not scheduled for completion until after 2016, are not considered. An example is the Flint Hills’ Eagle Ford project11 on its Corpus Christi, Texas, West Refinery. The West Refinery currently processes about 230,000 barrels per day of crude oil, but the project would both enable the plant to process as much as 10 percent more crude each day and allow the refinery to process 100 percent domestic crude.
The survey was voluntary. AFPM encouraged members to respond, but interest in the topic was the main incentive for participating. The survey was launched on November 5, 2014 via a web survey instrument, and all submissions were received by the first week in December.
AFPM used a third party contractor, Veris Consulting, to collect the data in order to maintain company confidentiality and ensure compliance with antitrust laws. Regional aggregated data is presented only for PADDs 2 and 3 to prevent disclosure of individual respondent data. AFPM also retained an independent refining expert consultant, Charles LeRoy, to work with Veris Consulting to validate and assure data quality. Results were aggregated and provided to AFPM for this report.
10 See Appendix A.11 “Flint Hills Resources breaks ground on new project at Corpus Christi oil refinery,” PennEnergy Editorial
Staff article, December 3, 2014.
3.2 Survey ResponseThe response rate for this type of voluntary survey was very good. A total of 23 companies pro-vided information on 69 refineries that represented 61 percent of all U.S. refining capacity in 2014. The total capacity reported by the respondents in each year is summarized in Table 1, and the distribution in refinery size is shown in Table 2. In the six years from 2007 to 2013, respondents’ capacity grew by an annual average 1.3 percent, and by about 1.2 percent from 2013 through 2016.
Refining U.S. Petroleum A Survey of U.S. Refinery Use of Growing U.S. Crude Oil Production
Table 2 Survey Respondent Refinery Size Distribution
Average Calendar Day Distillation Capacity Survey No. U.S. No. No. of Survey Facilities(Thousand Barrels Per Day) of Facilities of Facilities as Percent of U.S. Facilities in Same Size Range
0-49 7 39 18%
50-99 19 33 58%
100-149 13 18 72%
150-199 10 12 83%
200-249 10 16 63%
>250 10 18 56%
Note: The U.S. count was taken from EIA’s reported operable calendar day distillation capacity as of January 2014.
12 Survey data tables are not explicitly sourced as coming from the survey on each table. 13 Petroleum for Administration Defense District. Appendix D provides a map of the regions.
The Gulf Coast (PADD 313), which had a 64 percent response rate, is a critical area because it represents about 50 percent of all U.S. capacity, and many of the pipeline changes to date have been made to move new crude production within and to that region. The Midwest (PADD 2), which has been increasing its use of heavy Canadian crude oil, had a 62 percent response rate. PADDs 1, 4 and 5 combined had a 54 percent response rate, with the East Coast (PADD 1) being well over 60 percent and the Rocky Mountains and West Coast (PADDs 4 and 5) individually having less than 50 percent, but still providing meaningful and substantial shares.
The survey requested crude quality breakdowns as follows:• Heavy (<=24°API)• Medium (>24 - 30.9°API)• Light (>30.9 - 41.9°API)• Super Light (>41.9 - 50°API)• Condensate (>50°API)
This breakout was based on crude groupings used by Turner Mason & Company, a petroleum engineering and management consulting firm, in many of its reports. It was chosen because it provided enough granularity to capture most U.S. tight oil in one category, the super light category, with condensates broken out separately.
Refining U.S. Petroleum A Survey of U.S. Refinery Use of Growing U.S. Crude Oil Production
4 ResultsThe Results chapter summarizes the survey responses. It is divided into the five major topics of the survey: 1) actual and planned crude oil use by quality; 2) capability to run increasing light crude oil production; 3) changing U.S. refining crude unit yield patterns; 4) paths to obtaining U.S. light crude oil; and 5) investments.
4.1 Respondents’ Actual and Planned Crude UseTable 3 summarizes the actual and planned crude oil inputs to the refineries represented in the survey. Condensate inputs could not be shown due to potential disclosure of individual respondent’s data.14 From 2007, before tight oil production was visible, through 2013, total inputs increased in this respondent group, but super light crude increased the most, rising almost 850,000 barrels per day during this six years. Recall that super light quality is the category that captured most increases in U.S. production.
Table 3 provides an answer to a key question. In the two years from 2014 to 2016, the respondents representing 61 percent of U.S. capacity alone are planning to increase their use of super light crude oil over 730,000 barrels per day. With nearly 40 percent of U.S. capacity not represented in the survey, total industry plans to increase super light crude oil use would be even higher.
10
(Thousand Barrels Per Day)
Table 3 Total Refinery Actual and Planned Inputs of Crude Oil by Gravity
Total Excl. Condensate 8,649 9,780 10,018 10,389 10,204 18% 186
Table 4 Share of Crude Quality Inputs (Excluding Condensates)
2007 2013 2014 2015 2016
Heavy (<=24°API) 25% 25% 24% 26% 27%
Medium (>24 - 30.9°API) 24% 19% 20% 15% 13%
Light (>30.9 - 41.9°API) 45% 41% 39% 38% 36%
Super Light (>41.9 - 50°API) 7% 14% 17% 21% 24%
14 The letter “D” is used in this report to indicate that, while data was collected for a given table cell, it had to be suppressed due to potential disclosure of an individual company’s data.
Refining U.S. Petroleum A Survey of U.S. Refinery Use of Growing U.S. Crude Oil Production
11
Table 4 demonstrates the shift in crude qualities on a share basis. Super light crude oil inputs, as a share of inputs excluding condensates, doubled from 7 percent in 2007 to 14 percent in 2013. By 2016, this category is projected to make up 24 percent of the inputs, as shares of light and medium crude oil inputs decline. Heavy crude oil maintains is proportion of total crude use.
Figure 5 displays the changes in quality on an annual average basis for the historical six years from 2007 through 2013, and the three-year period from 2013 through 2016. The first period captures the transition from before the tight oil production increases to when those volumes had grown significantly. Respondents increased their use of super light crudes the most during this time period. Heavy and light crude oil volumes also increased, with medium volumes declining slightly. This pattern indicates that much of the historical super light growth likely came from backing out imports and filling increasing capacity.
Figure 5 Annual Average Historical & Future Tight Oil Changes in Crude Quality
Heavy Medium Light Super Light
600
500
400
300
200
100
(100)
(200)
(300)
Thou
sand
Bar
rels
Per
Day
Annual Avg 2007-2013
Annual Avg 2013-2016
Note: The data represent the differences in crude inputs between the stated years divided by the number of years in the interval.
The period from 2013 to planned 2016 presents some differ-ences from the 2007 to 2013 historical period. Again, heavy and super light crude inputs increase, with super light crudes still increasing the most. Heavy crude oil maintains its pro-portional share of crude use, but survey respondents are now significantly reducing their use of medium and light crude oils. Those declines would typically be coming from import reductions. As described in the background section, medium crude imports had declined slightly historically, consistent with the survey results, but this chart implies that some of the largest declines in the next few years could come from medium quality crudes.
The crude quality plans for PADDs 2 and 3 (Tables 5 and 6) are a reminder of the wide variations in crude use not only among individual refiners, but also among regions. PADD 2 (Midwest) contains refiners that have been expanding their use of Canadian heavy oil sands crude. Many also have access to the North Dakota Bakken crudes. Table 5 shows super light and heavy volumes are increasing, while light volumes are declining.
(Thousand Barrels Per Day)
Table 5 PADD 2 Refinery Actual and Planned Inputs of Crude Oil by Gravity
Super Light (>41.9 - 50°API) D 360 411 451 561 D 150
Condensate (>50°API) D D D D D D D
Refining U.S. Petroleum A Survey of U.S. Refinery Use of Growing U.S. Crude Oil Production
12
Table 6 illustrates a different pattern of crude use in PADD 3 (Gulf Coast). Heavy, light and super light crude volumes are increasing. However, the ratio of heavy crude oil volumes to the total light plus super light volumes is declining slightly, while super light crude oils are representing a growing share of the light plus super light total. Together this implies a continued increase in average API for the respondents in this region.
(Thousand Barrels Per Day)
Table 6 PADD 3 Refinery Actual and Planned Inputs of Crude Oil by Gravity
4.2 Capability to Run Increasing U.S. Crude ProductionU.S. refiners set their plans based on their individual outlooks, which could be very different, given the tremendous uncertainties associated with U.S. production forecasts, world crude oil prices and logistics. Refiners’ near-term plans do not necessarily reflect what their facilities are currently capable of doing under different circumstances and economic considerations. After reporting on plans, the survey asked respondents to address current capability to use U.S. light oil over and above planned volumes. To do this, each considered how much crude in the light, super light and condensate categories they could process if the volumes were economic to run and if delivery of the crude oil were not an issue (i.e., infrastructure were in place for refineries to receive U.S. light tight oil). Specific economic assumptions were not provided. In addition, respondents were also asked to continue to supply the same domestic product volumes they planned in their current projections, and to assume no additional changes to capital investments beyond their current plans. They were not required to supply the same volumes of product exports.
Table 7 summarizes how much light tight oil the survey respondents currently are capable of running under the survey assumptions. The main increase in crude capability was in the super light category, highlighted in Figure 6. Comparing 2014 super light actuals with 2014 capability, Table 7 and Figure 6 show that respondents could have run an additional 866,000 barrels per day of U.S. super light crude oils in 2014, while reducing another 469,000 barrels per day of light crude imports, had delivery infrastructure, production and economics supported the need.
Table 7 and Figure 6 also indicate that in 2016, the respondents have the capability to run an additional 1.5 million barrels per day more super light crude oil than they actually ran in 2014. This is about 800,000 barrels per day more than respondents plan to run in 2016 (Figure 6). Table 7 also indicates that if these refineries ran an additional 1.5 million barrels per day of super light in 2016 than in 2014, they also would reduce 446,000 barrels per day of light crude imports over those used in 2014.
Refining U.S. Petroleum A Survey of U.S. Refinery Use of Growing U.S. Crude Oil Production
13
(Thousand Barrels Per Day)
Table 7 Total Capability to Process Increasing U.S. Light Crude Oil Greater than 30.9° API
Actual Capability Capability Capability 2014 Compared 2016 Compared to Actual 2014 to Actual 2014
The survey results indicate that, under the assumptions of the capability estimates, this refining industry subset representing 61 percent of U.S. capacity alone has more than adequate capability in the short term (through 2016) to handle projected U.S. tight oil crude production. In February EIA projected that U.S. production in the lower 48 states (including the tight oil formations) may increase 720,000 barrels per day from 2014 to 2016. This contains more than light tight oil, but even if it were all light tight oil, the volumes are well within the capability of the respondent in-dustry subset. EIA also projected the federal Gulf of Mexico area to increase production 220,000 barrels per day. Gulf of Mexico offshore crude oil is generally medium sour, but contains some
“heavier” light crude oils like Louisiana Light Sweet crude oil (about 37° API). The lighter Gulf of Mexico crudes are easier to process than light tight oils as they tend to have qualities better balanced for U.S. refineries, such as less naphtha content. Any growth in Gulf of Mexico volumes will be processed in the United States at the expense of similar quality imports. The combined federal Gulf of Mexico and lower 48 increases in production, which total to an additional 940,000 barrels per day15 between 2014 and 2016, is not all light tight oil.
Figure 6 Planned Use of Super Light Crude Oil vs. Capability to Use
2013 2014 2015 2016
3,500
3,000
2,500
2,000
1,500
1,000
500
0
1,411
1,723
2,589
2,149
2,917
2,456
3,254
1,53
1
866
798
Thou
sand
Bar
rels
Per
Day
Actual/Planned
Capability
Note: Capability represents potential volumes that could be run if economics were favorable, and if delivery of the crude oil were not an issue.
15 EIA’s February 2015 projected net production increase from 2014 to 2016 is 860,000 barrels per day, reflecting the continuing decline in Alaskan production.
Refining U.S. Petroleum A Survey of U.S. Refinery Use of Growing U.S. Crude Oil Production
14
(Thousand Barrels Per Day)
Table 8 PADD 2 Capability to Process Increasing U.S. Light Crude Oil Greater than 30.9° API
Actual Capability Capability Capability 2014 Compared 2016 Compared to Actual 2014 to Actual 2014
Regionally, capability to use more super light crude oil varies (Tables 8 and 9). For PADD 2 respondents to increase their use of super light crude oil over their plans, they would likely decrease their use of light oil a little more than they were already planning. Consistent with PADD 2 planned inputs, this region shows a net decline in the capability total of light plus super light crude oil. PADD 3, on the other hand, would change from its planned increase in light crude use, to a decrease in light crude use as additional volumes of super light crude were used. Consistent with planned volumes, PADD 3 total light plus super light capability is increasing.
4.3 Changing Crude Unit Yield PatternsThe first major step in refining is distilling or separating crude oil into different hydrocarbon streams by boiling point (Figure 7). Light crude oil will have a high share of “light weight” material that boils at low temperatures, such as light and heavy naphtha, while heavy crude oils will have a smaller share of those light materials and a larger share of material that is heavy and boils at very high temperatures, like those present in atmospheric tower bottoms. As domestic refiners use more U.S. super light crude oils and less of other heavier crude types, they sometimes must alter the equipment that processes crude oil before it reaches the distillation unit, and may even alter the crude distillation unit. Regardless, the use of more super light crude oils would change what comes out of the crude distillation unit. Using proportionally more light crude oil results in higher yields (i.e., volume shares) of light streams like naphtha, and lower yields of heavier streams.
The survey included questions on the yields of the streams coming from the crude distillation units to determine if respondents’ shifts in crude input quality had created large changes in their
Refining U.S. Petroleum A Survey of U.S. Refinery Use of Growing U.S. Crude Oil Production
15
Figure 7 Separating Crude Oil into Streams for Further Processing
Crude Oil
Crude Distillation Unit
Boiling < 85°F Butanes and Lighter
85°F – 185°F Light Straight Run Naphtha (Gasoline blending)
>185°F – 350°F Heavy Straight Run Naphtha (Further processing to gasoline)
>350°F – 450°F Kerosene, Jet Fuel
>450°F – 650°F Diesel, Heating Oil
>650°F Atmospheric Tower Residual Fuels Bottoms and Streams - Vacuum Gas Oil for Upgrading - Vacuum Tower Bottoms to Products
Light Ends(Low Boiling Point)
Heavy Bottoms(High Boiling Point)
Streams
yield patterns. As yield patterns shift from heavier streams to lighter streams, they can reach points that require refiners to alter processing units downstream of the distillation unit. Table 10 summarizes the survey results. When comparing 2007 to 2016, as expected the respondents see increases in the yields of lighter streams, while heavier streams decline. For example, from 2007 to 2016, the naphtha streams together increased 2.8 percentage points in yield (light straight run increased 1.6 percentage points and heavy straight run increased 1.2), while atmospheric tower bottoms, vacuum gas oil, and vacuum tower bottoms declined 2.5 percentage points in total (atmospheric tower bottoms declined 0.9 percentage points, vacuum gas oil declined 0.4, and vacuum tower bottoms dropped 1.2 percentage points). The results indicate that for
Table 10 Average Crude Distillation Yields
2007 2013 2014 2015 2016 Change from 2007 to 2016
Butane and Lighter 2.2% 2.3% 2.6% 2.7% 2.7% 0.5%
Light Straight Run Naphtha 6.5% 7.4% 7.4% 7.7% 8.1% 1.6%
Heavy Straight Run Naphtha 15.8% 16.1% 16.5% 16.8% 17.0% 1.2%
Note: Average yields are weighted by facility crude input volumes. Facilities without a vacuum tower completed the atmospheric tower bottoms row, while those with a vacuum tower completed the vacuum gas oil and vacuum tower bottoms rows.
Refining U.S. Petroleum A Survey of U.S. Refinery Use of Growing U.S. Crude Oil Production
16
the aggregate respondent group, the shifts from 2007 to 2016 are not unusually large; however, the aggregate numbers can mask the yield shifts that individual refiners may experience. The aggregate shifts in Table 10 would not be expected to significantly impact the aggregate product output slate. Yield results are consistent with investment plans summarized below that indicate few planned investments downstream of the crude unit relative to other investments to use more U.S. light crude oil.
4.4 Paths to Using More U.S. Light Crude OilThe survey requested information to explore how refiners are increasing their use of light crude oil. Respondents allocated their increases in inputs of light crude oil (crudes ranging from 31° API and higher) to eight paths shown in Table 11. The first data column shows the aggregate increase in light crude oil volumes by path from 2013 to 2016. The paths are listed from the highest volume to the lowest over this four-year time frame. Those same paths are ranked separately during the historical years 2013-2014, and future years 2015-2016. Increasing access to logistics infrastructure to obtain new U.S. crude production is the path that ranks first in both historical and future years. That is, the largest increase in refiners’ use of U.S. light crude oil came from infrastructure changes that allowed for increased delivery of the oil to refiners. Substituting for imports ranks second historically, but crude distillation unit investments are expected to have a larger impact than import replacement in the two future years.
Table 11 U.S. Light (> 31° API) Crude Volume Increases Allocated to Means of Increase & Ranking by Volume
Means of Increase Thousand Barrels Per Day Rank
2013-2016 2013-2014 2015-2016
New delivery infrastructure access paths 1,704 1 1
Replace similar quality imports (no investment) 995 2 3
Downstream units investment 595 3 6
Adjust crude mix without significant investments 370 4 5
Crude distillation investment 320 5 2
Crude pre-fractionation investment 154 6 4
Naphtha/light ends overhead system investment D D D
Other D D D
Note: Volumes in Table 11 are not comparable to volumes on Table 3. Table 11 includes volumes of U.S. crude oil that replaced imports, for example, and would be expected to be larger.
Table 12 breaks out more information on how U.S. refiners are using logistics infrastructure to increase their U.S. tight oil input volumes. This table captures the relative frequency respondents indicated that a change in infrastructure allowed them to improve U.S. light crude use by tight oil producing region during 2013 through 2016. Respondents recorded 159 instances when a change in access mode resulted in an increase in light crude oil use.
Ten regions were included on the form, but most activity was in just four of those regions high-lighted in Table 12; all other regions are aggregated into the “Other” column of that table. The
Refining U.S. Petroleum A Survey of U.S. Refinery Use of Growing U.S. Crude Oil Production
17
Table 12 Relative Crude Access Activity by Tight Oil Region and Transportation Mode 2013-2016
Mode of Crude Oil MT/ND TX TX/NM CO/WY Other TotalDelivery Bakken Eagle Ford Permian Niobrara
Pipeline 17% 7% 13% 4% 3% 43%
Water 1% 14% 3% 0% 1% 18%
Rail 10% 0% 0% 6% 1% 16%
Rail/Water 8% 1% 0% 0% 1% 9%
Pipeline/Rail 2% 0% 0% 3% 0% 4%
Pipeline/Water 0% 1% 1% 1% 2% 4%
Truck 0% 0% 0% 0% 3% 3%
Truck/Pipeline 0% 0% 0% 0% 1% 1%
Total 37% 24% 16% 13% 10% 100%
Note: The table represents the distribution of all instances where a change in access allowed respondents to use more tight oil. A total of 159 instances were recorded from 2013 through 2016, and represents 100% on the table. Totals may not equal the sums due to rounding.
4.5 Investments in Refining and InfrastructureIn addition to volumes, the survey captured refining and infrastructure investments designed to use additional U.S. light crude oil. Specific capital projects targeted to increase use of U.S. light crude that were finished or plan on being finished during 2013 through 2016 are aggregated in Table 13. This table displays the total dollars spent or planned to be spent during these years, and the associated increase in capacity to process that light crude oil (i.e., all crude greater than 31°API) as measured in barrels per stream day.16 The respondents reported over $5 billion dollars
Bakken producing region showed the most crude delivery activity at 37 percent of the total 159 instances of improved access provided by the respondents, presumably because Bakken is an area that was new to crude production and had the least infrastructure in place. Two older crude producing areas, Eagle Ford and Permian, also showed significant crude delivery activities. Even though these areas had some logistics infrastructure in place, their reinvigorated production volumes required changes in and expansions to the infrastructure, and the survey respondents indicated a significant number of crude delivery increases to take advantage of those increased volumes.
The pipeline delivery mode is where most changes occurred, followed by water and rail. Most rail movements of crude oil within the United States have been from the Bakken area, which this survey emphasizes. The rail/water combination was also fairly large. Rail/water includes rail movements to inland waterways, or rail to a coast location where the crude is then moved by tanker or barge to a refinery. Truck and truck/pipeline were indicated in several of the less active crude producing regions grouped under “Other.”
16 Barrels per stream day: The maximum number of barrels of input that a distillation facility can process within a 24-hour period when running at full capacity under optimal crude and product slate conditions with no allowance for downtime. This value is greater than capacity expressed as barrels per calendar day, which takes into consideration time needed for maintenance.
Refining U.S. Petroleum A Survey of U.S. Refinery Use of Growing U.S. Crude Oil Production
18
of project investments during this time to gain about 2 million barrels per day of increased capacity to process the light crude oil. In context, the total U.S. refining sector accounts for about $10 billion per year of capital expenditures.17
The rankings in Table 13 show that investing in delivery infrastructure to receive U.S. crude oil has the largest total expenditures and results in the largest increases in capacity to use more volumes of light crude oil. The next largest category was investments in crude distillation capacity to handle the new crudes; it also had the second highest volume of additional light crude oil. But the rankings then shift, with crude pre-fractionation projects18 ranking third in expenditures, while only achieving fourth place for additional volumes. Naphtha/light ends overhead system projects19 had the lowest aggregate expenditures, but ranked third in additional light volumes. The last column in Table 13 illustrates that the highest ratio of investment dollar/daily capacity barrel was associated with the downstream unit projects to increase light crude oil use. While investing in delivery infrastructure and naphtha light ends overhead system projects were the lowest cost per daily capacity barrel.
17 Industrial Info Resources Topline Market Spending Forecast, 2014 Q4 Edition. 18 Crude pre-fractionation is a step that removes some of the light material from crude oil before it goes
to the atmospheric distillation unit. In many cases the process is a pre-flash tower where an atmospheric flash reduces the amount of light ends in the crude being sent to the crude heater prior to atmospheric distillation. This process allows more crude to be run through the crude heater, which can be limited by heat release. Another pre-fractionation process separates light components of crude oil in a distillation column prior to the crude heater.
19 Projects to expand the capacity of the equipment that handles naphtha and other light ends material distilled and exiting “overhead” from the atmospheric distillation tower.
Table 13 2013-2016 Aggregate Investment Ranking to Use More U.S. Crude Oil & Associated Crude Capacity Increases
Investment Additional Light Crude Ratio of Investment Expenditures Capacity (>30.9 API) Dollars/Daily Resulting from Investment Capacity Barrel
Ranking Ranking Ranking
Increase access 1 1 4
Crude distillation 2 2 3
Crude pre-fractionation 3 4 2
Downstream units 4 5 1
Naphtha/light ends overhead system 5 3 5
Total $5,039,560,000 2,021,700 BPSD $2,493/BPSD
Note: Ranking number 1 is the largest value. BPSD - Barrels Per Stream Day. Total volume increase is not comparable to the investment volumes in Table 11. For example, Table 11 allocation of increasing light crude oil volumes to investment categories include volume gains resulting from investments made prior to 2013.
Refining U.S. Petroleum A Survey of U.S. Refinery Use of Growing U.S. Crude Oil Production
19
5 ConclusionThe survey results from facilities representing 61 percent of U.S. capacity emphasize that U.S. refiners are not capacity constrained in the near term to using growing production from the domestic tight oil resource base. Current plans of the refining industry survey respondents alone reflect use of U.S. superlight crude oil adequate to absorb the February EIA production forecast for the onshore lower-48 states – the region encompassing U.S. tight oil production. These respondents will achieve their plans by continuing to reduce imports of light and medium quality crude oils and by investing to better utilize this domestic resource.
Lack of delivery infrastructure from new producing areas slowed U.S. refinery access to new production, but significant changes and expansion in this infrastructure have occurred and will continue to evolve. The respondents are putting more capital into improved access to U.S. crude production than into any other area targeted to increase light crude processing volumes.
Additionally, if access and favorable economics support refiners using more U.S. crude oil than reflected in their current plans, the respondents have the physical capability to use volumes substantially higher than planned. As previously mentioned, given the fact nearly 40 percent of the industry is unrepresented, nation-wide refinery plans and physical capability to run additional light crude oil exceed the volumes represented in this survey.
In conclusion, U.S. refining is not a bottleneck to producing and using more very light U.S. crude oil over the next few years. The refining industry continues to substitute U.S. crude oil for volumes previously imported from less stable parts of the world, both supporting energy security and allowing time for policymakers and the public to better understand and debate how best to deal with the changing U.S. energy environment.
Refining U.S. Petroleum A Survey of U.S. Refinery Use of Growing U.S. Crude Oil Production
20
Appendix A. Misunderstanding U.S. Refineries’ Ability to Use Increasing U.S. Light Crude ProductionRoll Call, Jan. 27, 2015Op-ed by William O’Keefe, chief executive officer of the George C. Marshall Institute, is president of Solutions Consulting Inc.
Congress Needs To Free U.S. Energy Resources“For Americans, the steep increase in U.S. supply of oil and gas has brought with it a bounty of benefits. The energy sector has increased employment in states that otherwise saw economic decline, and the growth in direct jobs has indirectly benefited communities throughout the country. At the same time, the taxes paid by the energy industry have helped bolster our national economy….Despite being outdated and largely irrelevant, the ban on U.S. crude exports has gone unaddressed for the past 40 years simply because it remained a non-issue when U.S. energy production was declining. However, we have reached a turning point. Most U.S. refineries, which were built when the country imports of crude oil were growing, are fitted to process heavy petroleum — not the light, sweet crude oil that represents the increase in domestic production. As a result, the impressive production growth over the last decade has largely outpaced our refining capabilities, creating a glut of light crude oil locked inside our borders.”
Wall Street Journal, Jan. 16, 2015 Editorial
Oil Export MythsLifting the ban will increase U.S. supply and energy security.“…To the extent more U.S. crude makes it to the global market, prices will be lower, other things being equal. All the more so given that most U.S. oil is lighter crude that can’t all be processed by U.S. refiners. American refineries on the Gulf Coast were built to process heavy imported crude from the likes of Venezuela. Light crude is valuable and should be fetching a pre-mium. Instead, U.S. producers are at the mercy of U.S. refiners, since the export ban means they have nowhere else to sell. As U.S. supplies have swelled, those refineries have had more leverage to push down prices for U.S. shale oil. While the price of Brent crude, the world benchmark, is still about $50 a barrel, producers in the Bakken Shale in North Dakota this month are averaging about $34 a barrel for light crude. Exports would allow a more efficient oil market. Opponents of lifting the ban argue that keeping U.S. oil here will enhance U.S. energy security, as if it can be stockpiled for use in an emergency. The feds already have the Strategic Petroleum Reserve, which can provide some relief in a genuine crisis. But companies are only going to drill if they can sell oil at a profit.”
Refining U.S. Petroleum A Survey of U.S. Refinery Use of Growing U.S. Crude Oil Production
21
Bismarck Tribune, Jul. 24, 2014Article
Domestic oil production approaching refinery capacity“An oversupply of crude oil in the United States isn’t something mentioned very often, if at all. But as a result of surging domestic production, that could be the case in the months ahead with light sweet crude oil production likely exceeding current refinery capacity for that class of crude in the near future. Tight oil extraction in plays like the Bakken in North Dakota and Eagle Ford in Texas, have led to a renaissance in domestic oil production. The catch - U.S. refineries are nearing full capacity for light sweet crude oil processing - is that most facilities are configured to process heavy crudes instead.”
CNBC, Jul. 13, 2014Web Article
US oil output booms—now refiners have to catch up“The United States is swimming in oil and gas. But processing the new-found bounty is posing a challenge to U.S. refiners, which can’t come to grips with the abundance in domestic supply. A production renaissance has catapulted the United States into the upper strata of global energy producers. Yet with fewer than 150 refineries, the U.S. has a surprisingly limited capacity to process the bounty.”
Reuters, Jun. 2, 2014 Column
U.S. refiners struggle with too much light crude: KempBy John Kemp “Most of the extra oil produced in the United States in the next two years will be light crudes and condensates that domestic refineries will struggle to process - intensifying pressure for at least a partial relaxation of the country’s export ban. U.S. oil production is set to increase by another 2 million barrels per day in 2014-15. More than 60 percent of the forecast growth will consist of light oils with a specific gravity of 40 degrees API or higher, according to the U.S. Energy Information Administration (“U.S. crude oil production forecast: analysis of crude types”, May 29). But with imports of competing crudes from West Africa already reduced close to zero, U.S. refineries will be unable to process all this extra oil without enormous investment in equipment. Distillation towers, furnaces, heat exchangers and downstream conversion units would need expensive and time-consuming overhauls to enable them to handle a higher share of light oil.”
Refining U.S. Petroleum A Survey of U.S. Refinery Use of Growing U.S. Crude Oil Production
22
Motley Fool, Jun. 16, 2014Web Article
Can Refiners Keep Up With Surging U.S. Oil Production?“Though advances in drilling technology have propelled U.S. crude oil production to levels not seen since the late 1980s, many U.S. refineries are poorly equipped to handle these growing volumes of mainly light, sweet crude oil -- a higher quality grade of crude as mea-sured by API gravity and sulfur content. Let’s take a closer look at the main factors driving this growing mismatch between U.S. refining capacity and domestic crude production and why Valero may be the best positioned refiner to benefit from this trend. … Many U.S. refiners are poorly equipped to handle these light sweet grades of crude mainly because they were upgraded over the past decade to process heavier, sour crudes. After all, nobody was expecting a shale revolution 10 years ago and refiners figured they would continue to rely on imports of heavier grades. Therein lies the main issue -- the growing mismatch between surging light sweet crude production and refining capacity configured to process imported heavy, sour crudes. While some of these refineries do have the flexibility to modify their feedstock to process greater volumes of lighter crudes, doing so would generally reduce their utilization rate and, therefore, profitability. In order to process higher volumes of lighter crudes, Gulf Coast refineries that have been configured to handle heavy, sour crudes would have to invest heavily in distillation towers, downstream conversion units, furnaces, and other equipment. Such an overhaul would require hundreds of millions of dollars and as long as five years to complete.”
Refining U.S. Petroleum A Survey of U.S. Refinery Use of Growing U.S. Crude Oil Production
23
Appendix B. AFPM Technical Papers on Processing Light Tight OilThe following are papers presented at AFPM annual meetings in 2012, 2013, and 2014
Arriaga, Raul (Albemarle Corp.). “Sink or Swim? How to Thrive in the Flood of Tight Oils.” AM-14-64, March 2014.
Davis, Samuel (Wood Mackenzie). “Can U.S. Refiners Invest for Success?” AM-14-53, March 2014.
Deepak, R.D. (Criterion Catalysts and Technologies). “Challenges of Processing Feeds Derived from Tight Oil Crudes in the Hydrocracker.” AM-14-15, March 2014.
Dion, Michael (GE Water & Process Technologies). “Challenges and Solutions for Processing Opportunity Crudes.” AM-14-13, March 2014.
Federspiel, Michael (Grace Catalysts Technologies). “Processing Tight Oils in the FCC: Issues, Opportunities, and Flexible Catalytic Solutions.” AM-14-16, March 2014.
Foster, Jim (Platts). “Petrochemical Landscapes: The Blessing and Curse of the Shale Revolution.” AM-14-34, March 2014.
Green, M. Scott (KBC). “Tracking and Auditing the Impact of New Crudes on Refinery Operability and Profitability.” AM-14-43, March 2014.
Gunaseelan, Praveen (Vantage Point Energy Consulting). “Impact of US Shale Gas and Liquids on the Refining Sector.” AM-12-04, March 2012.
Gunaseelan, Praveen (Vantage Point Advisors) and Matt Thundyil (Transcend Solutions). “How Shale Hydrocarbons are Reshaping US Refined Product Markets.” AM-13-56, March 2013.
Hittle, Ann-Louise (Wood Mackenzie). “Will OPEC Sideline U.S. Producers by Defeating Tight Oil?” AM-14-12, March 2014.
Huovie, Chad (UOP), Richard Rossi (UOP), Dan Sioui (UOP), Mary Jo Wier (UOP), Rajeswar Gattupalli (UOP), and Jeff Sexton (Marathon Petroleum). “Solutions for FCC Refiners in the Shale Oil Era.” AM-13-06, March 2013.
Kemp, Charles and Rick Thomas (Baker & O’Brien, Inc). “Growing U.S. Oil and Gas Production Set to Reshape Competitive Position of U.S. Refineries.” AM-13-62, March 2013.
Lockhart, Mark (Burns and McDonnell). “Shale Gas Boom and Tight Oil - A New Era for the Refining Industry.” AM-14-39, March 2014.
Lordo, Sam (NALCO Champion). “Use of Crude Unit Overhead Monitoring Automation Improves Reliability in Processing Conventional and Non-Conventional Crude Oils.” AM-14-73, March 2014.
Refining U.S. Petroleum A Survey of U.S. Refinery Use of Growing U.S. Crude Oil Production
24
Marques, Patricia (Petrobras). “Distillation Heater Operation while Processing Tight Oil.” AM-14-14, March 2014.
Mayes, John (Turner, Mason & Company). “Changing Crude Qualities and Their Impacts on U.S. Refinery Operations.” AM-14-42, March 2014.
Ohmes, Robert, Michael Gibson-Robinson, and Robert Powell (KBC Advanced Technologies, Inc). “Characterizing and Tracking Contaminants in Opportunity Crudes.” AM-13-33, March 2013.
Pan, Shaun (BASF). “Capturing Maximum Values for Processing Tight Oil through Optimization of FCC Catalyst Technology.” AM-14-23, March 2014.
Stark, Joseph (Baker Hughes). “Selection of Hydrogen Sulfide Scavengers for Minimal Refinery Impact.” AM-12-21, March 2012.
Vogt, Kaspar (Albemarle). “Diesel Hydrotreating Challenges & Opportunities When Processing Tight Oil.” AM-14-17, March 2014.
Wier, Mary (UOP LLC). “Optimizing Naphtha Complexes in the Tight Oil Era.” AM-14-35, March 2014.
Wojciechowski, Michael (Wood Mackenzie). “The Impact of Resurgent North American Crude Production on Refining Crude Slate.” AM-13-35, March 2013.
Wright, Brude and Corina Sandu, PhD (Baker Hughes Incorporated).”Problems and Solutions for Processing Tight Oils.” AM-13-55, March 2013.
Ye, Eric (DuPont Sustainable Solutions). “Gasoline Production in the Age of Tight Oil, Renewable Fuel Mandates, and Tier 3 Regulations.” AM-14-36, March 2014.
Refining U.S. Petroleum A Survey of U.S. Refinery Use of Growing U.S. Crude Oil Production
25
Appendix C. Survey Form
Introduction:
Please complete the survey by November 21, 2014.
Contact InformationAFPMJoanne Shore, Chief Industry [email protected](202) 552-4368
The purpose of this survey is to illustrate that many refiners have and are planning to use more U.S. light crude oil in the next few years. This will be used to help dispel the misunderstanding that refiners cannot use more US light crude oil. In addition, the survey is designed to capture changing refinery access to the tight oil production regions, and refining capability to use more light crude oil, if economics and access encourage more light crude use.
Please note that all data will be aggregated and will be collected and analyzed by a third party. AFPM and its staff will neither collect nor review any of the individual company data.
Refining U.S. Petroleum A Survey of U.S. Refinery Use of Growing U.S. Crude Oil Production
26
Survey Instructions:a. The Survey tab contains the entire AFPM Crude Oil Capacity Survey. Please complete 1 survey per individual refinery.b. Please read all instructions before completing each section of the survey. c. All cells highlighted BLUE should be completed unless otherwise noted. d. Additional instructions for specific sections are presented below. e. Additional definitions can be found on the “Definitions” tab. f. Once complete, please save your worksheet and upload it into your secured account: https://secure3.verisconsulting.com/AFPM
Part IIIOutput Yields (Percent of Crude Input):
Part IVPlease attribute increases in light US crude use* for >30.9° API to the actions below:
Part VAssumptions for Part V:
Part VIInvestments costs both in total dollars and daily barrels (in BPSD) of additional light crude (>30.9° API)
- In both tables, place the total investment cost in the year the project is completed.
- Confirm the accuracy of your entries by reviewing the dollars/BPSD calculation to the right of the second table.
- In the second table, please indicate the resulting additional daily barrels of light crude.
- If your facility does not have a vacuum tower, please fill in Atmospheric Tower Bottoms. Otherwise, please complete for Vacuum Gas Oil and Vacuum Tower Bottoms.
- Totals on this table may exceed the annual crude changes in PART III because this table includes replacing light imports with light US crude oil - which could potentially have little impact on light crude oil being run in PART III. - Replace similar quality imports (no investment) - This row is trying to capture import substitution. It could include some small investments to make the substitution.
Please indicate what kind of access path(s) has or will change from the prior year using the drop-down options in the matrix below: - If no change in access path will contribute to your increased US light oil use, please select "None."
- When light-crude-use expansion is part of a larger project, estimate and report the portion of project designed to increase light crude use for this section.
- For All years: Assume you will still need to meet your normal market requirements. (i.e., don't cut volume output) - For 2014: Using equipment in place, use actual 2014 prices and assume unlimited access to US light crude
- For 2015-16: Assume a) current investment plans, b) price incentives large enough to use as much light crude oil as you can, and c) access to unlimited supply of US light crude, BUT d) continue to produce enough product volume to serve your current domestic transportation and heating markets (product exports can be reduced).
- In the first table, please indicate the investment size in thousands of dollars.
Refining U.S. Petroleum A Survey of U.S. Refinery Use of Growing U.S. Crude Oil Production
Vacuum Gas Oil (>650-1000°F)Vacuum Tower Bottoms (>1000°F)
Total 0% 0% 0% 0% 0%
EstimateActual
EstimateActual
Estimated
AFPM Crude Oil Capacity Survey
PART III: Inputs and Outputs
ActualData Check
Part I: Facility ID - Individual Refinery
PART II: Facility Size
Note: All cells highlighted BLUE should be completed unless otherwise noted.
- If your facility does not have a vacuum tower, please fill in Atmospheric Tower Bottoms. Otherwise, please complete for Vacuum Gas Oil and Vacuum Tower Bottoms.- Please make sure that the sum of input volumes are equal to the Annual Crude Runs in Part II.
Refining U.S. Petroleum A Survey of U.S. Refinery Use of Growing U.S. Crude Oil Production
28
*In this section, please only consider use of US Light Crude Oil.Instructions:
Please attribute increases in light US crude use* for API >30.9° to the actions below:
Actual 2013 2014 2015 2016
Replace similar quality imports (no investment)** Adjust crude mix without significant investments
Participation in new crude access paths Investments (actual or planned)
- Naphtha/light ends overhead system investment - Downstream Units investment
- Investment to increase access (e.g., invest in rail, pipe, etc)Other (fill in)_______________________
Total 0 0 0 0
• To enter an access path that is not indicated on the drop-down list, simply type your answer into the cell.
Source of light volume: 2007 2013 2014 2015 2016TX, Eagle Ford
MT/ND, Bakken TX/NM, Permiam
CO/WY, Niobrara-Codell Haynesville
Marcellus OK Woodford
OK, TX Granite Wash LA, TX Auston Chalk
CA Monterey Other (fill in) _______________
Estimate
Please attribute increases in light US crude use for >30.9° API to the actions below (in KB/D):
Please indicate what kind of access path(s) has or will change from the prior year using the drop-down options in the matrix below:• If no change in access path will contribute to your increased US light oil use, please select "None."
**Replace similar quality imports (no investment) - This row is trying to capture import substitution. This could include some small investments to make the substitution.Please indicate what kind of access path(s) has or will change from the prior year using the drop-down options in the matrix below - If no change in access path will contribute to your increased US light oil use, please select "None."- To enter a access path that is not indicated on the drop-down list, simply type your answer into the cell.
PART IV: Means of Getting More Light US Crude Oil
- Totals on this table may exceed the annual crude changes in PART III because this table includes replacing light imports with light US crude oil - which could potentially have little impact on light crude oil being run in PART III. - Replace similar quality imports (no investment) - This row is trying to capture import substitution. It could include some small investments to make the substitution.
Estimate
Actual
If you selected Participation in new crude access paths or Investment to increase access above, please complete the following table. If not, please proceed to Part V.
Refining U.S. Petroleum A Survey of U.S. Refinery Use of Growing U.S. Crude Oil Production
29
Example:
Actual2013 2014 2015 2016
1
1
810
10
0 10 10 10
Estimate - This refinery planned increases to light US crude oil of 10KB/D in 2014-2016.
- For those three years, each column adds to 10 KB/D.
- The column totals here for this refinery would not be expected to equal >30.9° API in the inputs table in Part III because Part III does not account for substituting light US crude for simlar API imports.
Refining U.S. Petroleum A Survey of U.S. Refinery Use of Growing U.S. Crude Oil Production
30
Assumptions:
2014 2015 2016Light (>30.9°API - 41.9°API)
Super Light (>41.9°API - 50°API)Condensate (>50°API)
- Crude distillation investment - Naphtha/light ends overhead system investment
- Downstream Units investment - Investment to increase access (e.g., invest in rail, pipe, etc)
Total $0 $0 $0 $0 $0
Barrels per Stream Day (BPSD) of additional light crude (>30.9° API) 2007 2013 2014 2015 2016 - Crude prefractionation investment
- Crude distillation investment - Naphtha/light ends overhead system investment
- Downstream Units investment - Investment to increase access (e.g., invest in rail, pipe, etc)
Total 0 0 0 0 0
Dollars per BPSD (in Thousands $) 2007 2013 2014 2015 2016 - Crude prefractionation investment
- Crude distillation investment - Naphtha/light ends overhead system investment
- Downstream Units investment - Investment to increase access (e.g., invest in rail, pipe, etc)
Total
Actual Estimate
Please review the calculated ratios here and revise your responses in Part VI if necessary.
- Confirm the accuracy of your entries by reviewing the dollars/BPSD calculation below the second table.
- For 2015-16: Assume a) current investment plans, b) price incentives large enough to use as much light crude oil as you can, and c) access to unlimited supply of US light crude, BUT d) continue to produce enough product volume to serve your current domestic transportation and heating markets. Product exports can be reduced.
What are your assumed crude runs for these estimates (in KB/D)?
Please indicate your capability to use light US crude in KB/D (see Assumptions above):
Actual Estimate
Actual Estimate
If investments are planned, indicate the investment costs in total dollars and the resulting additional barrels of light crude in Barrels per Stream Day (BPSD). Please refer to the Instructions above.
PART VI: Investment Dollars
- When increasing light crude use is part of a larger project, please estimate the share of that project designed to increase light crude use.
- First Table: Please indicate the investment size in thousands of dollars. - Second Table: please indicate the resulting additional barrels of light crude in BPSD. - In both tables, place the total investment cost in the year the project is completed.
- For All years: Assume you will still need to meet your normal market requirements. (i.e., don't cut volume output) - For 2014: Using equipment in place, use actual 2014 prices and assume unlimited access to US light crude
PART V: Capability (vs Plans) to Use More US Light Crude OilAssumptions:
2014 2015 2016Light (>30.9°API - 41.9°API)
Super Light (>41.9°API - 50°API)Condensate (>50°API)
- Crude distillation investment - Naphtha/light ends overhead system investment
- Downstream Units investment - Investment to increase access (e.g., invest in rail, pipe, etc)
Total $0 $0 $0 $0 $0
Barrels per Stream Day (BPSD) of additional light crude (>30.9° API) 2007 2013 2014 2015 2016 - Crude prefractionation investment
- Crude distillation investment - Naphtha/light ends overhead system investment
- Downstream Units investment - Investment to increase access (e.g., invest in rail, pipe, etc)
Total 0 0 0 0 0
Dollars per BPSD (in Thousands $) 2007 2013 2014 2015 2016 - Crude prefractionation investment
- Crude distillation investment - Naphtha/light ends overhead system investment
- Downstream Units investment - Investment to increase access (e.g., invest in rail, pipe, etc)
Total
Actual Estimate
Please review the calculated ratios here and revise your responses in Part VI if necessary.
- Confirm the accuracy of your entries by reviewing the dollars/BPSD calculation below the second table.
- For 2015-16: Assume a) current investment plans, b) price incentives large enough to use as much light crude oil as you can, and c) access to unlimited supply of US light crude, BUT d) continue to produce enough product volume to serve your current domestic transportation and heating markets. Product exports can be reduced.
What are your assumed crude runs for these estimates (in KB/D)?
Please indicate your capability to use light US crude in KB/D (see Assumptions above):
Actual Estimate
Actual Estimate
If investments are planned, indicate the investment costs in total dollars and the resulting additional barrels of light crude in Barrels per Stream Day (BPSD). Please refer to the Instructions above.
PART VI: Investment Dollars
- When increasing light crude use is part of a larger project, please estimate the share of that project designed to increase light crude use.
- First Table: Please indicate the investment size in thousands of dollars. - Second Table: please indicate the resulting additional barrels of light crude in BPSD. - In both tables, place the total investment cost in the year the project is completed.
- For All years: Assume you will still need to meet your normal market requirements. (i.e., don't cut volume output) - For 2014: Using equipment in place, use actual 2014 prices and assume unlimited access to US light crude
PART V: Capability (vs Plans) to Use More US Light Crude Oil
Refining U.S. Petroleum A Survey of U.S. Refinery Use of Growing U.S. Crude Oil Production
31
Appendix D. Petroleum Administration for Defense District Map