D. V. Petrov Vol. 13, No. 7/July 1996/J. Opt. Soc. Am. B 1491 Reflection Z-scan technique for the study of nonlinear refraction and absorption of a single interface and thin film D. V. Petrov Departament de Teoria del Senyai i Comunicacions, Universitat Polit ´ ecnica de Catalunya, Gran Capitan, UPC-D3, Barcelona 08034, Spain Received April 18, 1995; revised manuscript received January 11, 1996 Spatial modification of a Gaussian beam reflected from a single interface and a thin film with intensity- dependent refractive index and absorption coefficient is studied theoretically. The measurement of this modification by different positions of the nonlinear surface with respect to the beam waist (the modified Z-scan technique) can be used to study nonlinear optical properties. For a single interface the measurements permit the nonlinear parameters to be determined unambiguously. For a thin film the multiple internal reflections are important, and the value and the sign of nonlinear refraction and absorption coefficients cannot be uniquely found. 1996 Optical Society of America 1. INTRODUCTION Among different experimental methods of nonlinear optics 1 the transmission Z scan 2 (TZ scan) technique is considered one of the simplest and most accurate single- beam methods for measurement of nonlinear parameters. In this kind of experiment a thin slab of material with a thickness smaller than the Rayleigh length of a Gaussian beam is scanned near the beam’s focus. A plot of the far-field transmittance through an aperture as a function of the sample’s position allows us to determine both the nonlinear refraction (NLR) and the nonlinear absorption (NLA) coefficients. The modifications introduced into the TZ-scan technique make it possible to measure the NLR and the NLA in transparent and opaque materials, 3 to distinguish among nonlinear mechanisms of different origins, 4–6 and to explore the anisotropy of the nonlinear refraction. 7 New variations of the TZ scan 8–10 can also provide enhancement of the sensitivity. If the faces of the studied sample are parallel, multiple internal reflections become important, and propagation of the probe Gaussian beam in a nonlinear Fabry – Perot resonator should be considered. The effect of multiple sample reflections on the TZ-scan measurement was stud- ied theoretically in Ref. 11 for a film with NLR. It was shown, in particular, that saturable absorption or two- photon absorption can be simulated, depending on the original resonator detuning from resonance. Therefore care must be exercised in interpreting Z-scan traces to explain the phenomenon observed, whether it be true nonlinear absorption or an ´ etalon effect. For moderate reflectance samples with large nonlinear phase shifts, strong distortion of the TZ-scan traces results. Regions of optical switching and bistability combine with strong self-focusing to produce these distortions. At present there is a strong trend toward the study of optical effects in a small-thickness sample (a thin film upon a substrate) or upon a surface. To apply the Z-scan technique for a single interface by using a Gaussian beam as a probe it is necessary to consider how the incident Gaussian beam reflects at a linear interface and then to modify boundary conditions to include nonlinear proper- ties of the interface. For this purpose one should express the input beam as an expansion in terms of plane-wave components, ap- ply the Fresnel expressions to calculate the reflection and the transmission of each component, and then add all the resulting plane-wave components to get the re- flected and the transmitted beams (see Ref. 12 and refer- ences therein). The theoretical study of two-dimensional Gaussian beam reflection showed that the reflected beam consists of the fundamental and the higher-order reflected modes. The fundamental mode represents the mirror- reflected beam. The higher-order modes are generated because of the nonlinear dependence of the Fresnel co- efficients on the angle of incidence. The generation of these modes causes the reflected beam to spread and split. However, at normal incidence (which is used for the Z scan), the amplitudes of the higher modes are at least 1 order of magnitude smaller than the mirror-reflected beam amplitude. 13 An analytical theory of the nonlinear interface reflec- tion was derived in Ref. 14, in which it was assumed that the input beam was a plane wave. The nonlinear total internal reflection at the interface of a linear medium and a nonlinear medium with a positive Kerr constant was considered in Refs. 15 and 16. The main results obtained for a single interface consist in a jump switch from total internal reflection to a state with both transmitted and reflected beams, a large nonlinear Goos – Hanchen shift, and a large variation of the reflected beam angle by small changes in the input intensity. The internal total reflec- tion from a nonlinear film was studied in Refs. 17–22. In particular, a large intensity-dependent phase shift in a reflected wave near the total internal reflection that gives 0740-3224/96/071491-08$10.00 1996 Optical Society of America
Transcript
D. V. Petrov Vol. 13, No. 7 /July 1996/J. Opt. Soc. Am. B 1491
Reflection Z-scan technique for the studyof nonlinear refraction and absorption
of a single interface and thin film
D. V. Petrov
Departament de Teoria del Senyai i Comunicacions, UniversitatPolitecnica de Catalunya, Gran Capitan, UPC-D3, Barcelona 08034, Spain
Received April 18, 1995; revised manuscript received January 11, 1996
Spatial modification of a Gaussian beam reflected from a single interface and a thin film with intensity-dependent refractive index and absorption coefficient is studied theoretically. The measurement of thismodification by different positions of the nonlinear surface with respect to the beam waist (the modified Z-scantechnique) can be used to study nonlinear optical properties. For a single interface the measurements permitthe nonlinear parameters to be determined unambiguously. For a thin film the multiple internal reflectionsare important, and the value and the sign of nonlinear refraction and absorption coefficients cannot be uniquelyfound. 1996 Optical Society of America
1. INTRODUCTIONAmong different experimental methods of nonlinearoptics1 the transmission Z scan2 (TZ scan) technique isconsidered one of the simplest and most accurate single-beam methods for measurement of nonlinear parameters.In this kind of experiment a thin slab of material with athickness smaller than the Rayleigh length of a Gaussianbeam is scanned near the beam’s focus. A plot of thefar-field transmittance through an aperture as a functionof the sample’s position allows us to determine both thenonlinear refraction (NLR) and the nonlinear absorption(NLA) coefficients. The modifications introduced intothe TZ-scan technique make it possible to measure theNLR and the NLA in transparent and opaque materials,3
to distinguish among nonlinear mechanisms of differentorigins,4–6 and to explore the anisotropy of the nonlinearrefraction.7 New variations of the TZ scan8–10 can alsoprovide enhancement of the sensitivity.
If the faces of the studied sample are parallel, multipleinternal reflections become important, and propagationof the probe Gaussian beam in a nonlinear Fabry–Perotresonator should be considered. The effect of multiplesample reflections on the TZ-scan measurement was stud-ied theoretically in Ref. 11 for a film with NLR. It wasshown, in particular, that saturable absorption or two-photon absorption can be simulated, depending on theoriginal resonator detuning from resonance. Thereforecare must be exercised in interpreting Z-scan traces toexplain the phenomenon observed, whether it be truenonlinear absorption or an etalon effect. For moderatereflectance samples with large nonlinear phase shifts,strong distortion of the TZ-scan traces results. Regionsof optical switching and bistability combine with strongself-focusing to produce these distortions.
At present there is a strong trend toward the studyof optical effects in a small-thickness sample (a thin filmupon a substrate) or upon a surface. To apply the Z-scan
0740-3224/96/071491-08$10.00
technique for a single interface by using a Gaussian beamas a probe it is necessary to consider how the incidentGaussian beam reflects at a linear interface and then tomodify boundary conditions to include nonlinear proper-ties of the interface.
For this purpose one should express the input beamas an expansion in terms of plane-wave components, ap-ply the Fresnel expressions to calculate the reflectionand the transmission of each component, and then addall the resulting plane-wave components to get the re-flected and the transmitted beams (see Ref. 12 and refer-ences therein). The theoretical study of two-dimensionalGaussian beam reflection showed that the reflected beamconsists of the fundamental and the higher-order reflectedmodes. The fundamental mode represents the mirror-reflected beam. The higher-order modes are generatedbecause of the nonlinear dependence of the Fresnel co-efficients on the angle of incidence. The generation ofthese modes causes the reflected beam to spread and split.However, at normal incidence (which is used for the Zscan), the amplitudes of the higher modes are at least1 order of magnitude smaller than the mirror-reflectedbeam amplitude.13
An analytical theory of the nonlinear interface reflec-tion was derived in Ref. 14, in which it was assumed thatthe input beam was a plane wave. The nonlinear totalinternal reflection at the interface of a linear medium anda nonlinear medium with a positive Kerr constant wasconsidered in Refs. 15 and 16. The main results obtainedfor a single interface consist in a jump switch from totalinternal reflection to a state with both transmitted andreflected beams, a large nonlinear Goos–Hanchen shift,and a large variation of the reflected beam angle by smallchanges in the input intensity. The internal total reflec-tion from a nonlinear film was studied in Refs. 17–22.In particular, a large intensity-dependent phase shift in areflected wave near the total internal reflection that gives
1996 Optical Society of America
1492 J. Opt. Soc. Am. B/Vol. 13, No. 7/July 1996 D. V. Petrov
rise to a strong divergence of the beam was observed ex-perimentally in the study reported in Ref. 20.
By intensity-dependent absorption and refraction therefractive index is modulated by a Gaussian beam in boththe transverse and the longitudinal directions. Thus anonlinear medium is no longer homogeneous along theaxis of propagation, and reflection occurs with such in-homogeneity. The generation of this self-reflected wavepropagating in a medium with the Kerr nonlinearity23
or in a saturable absorber24 becomes possible. Spatialmodification of a Gaussian beam on reflection from a sat-urable absorber, for which the condition of self-reflectedwave generation is satisfied, was studied theoretically inRef. 25. The dependence of the reflectivity on the inten-sity of the incoming field is revealed through the changesthat are induced in the transverse profile of the reflectedGaussian beam. These changes derive mainly from theeffective aperturing effects in amplitude and phase.
The application of the Z-scan technique to study opticalproperties of surfaces was proposed and demonstrated inRef. 26, where the reflection Z-scan (RZ-scan) techniquewas introduced. A theoretical description was given, andthe sensitivity of the method in measuring laser-inducedsurface deformation and NLR and NLA coefficients wasdiscussed. For a material with linear absorption coeffi-cient a0 the ratio of sensitivities of RZ scan and TZ scan isequal to skDeffd21, where k is the wave number (k 2pyl;l is the wavelength), Deff f1 2 exps2a0Ddgya0 is the ef-fective propagation length, and D is the sample thickness.Hence the sensitivities of the two methods are compara-ble for highly absorbing materials (a0 . k and a0D .. 1)or for thin films with D , k21.
The theoretical results of Ref. 26 can be applied di-rectly to experiments in a strongly absorbing material orin a sample of the special geometry, where the backward-reflected wave from the far end of the sample is excludedfrom the total reflected field. For study of optical prop-erties of thin films by the RZ scan the interference effectsshould be considered. In previously published papers onthe TZ scan it was assumed that the contribution of thereflection coefficient change (surface effect) in the spa-tial amplitude and phase modulation of the transmittedGaussian beam can be neglected compared with the mod-ulation incurred by propagation in the bulk of the studiedsample (bulk effect). For the samples with Deff .. l thiscondition is satisfied with good accuracy. In the oppositecase, Deff ,, l, the surface effect and the bulk effect canbe comparable. In this paper a theoretical study of thespatial transformation of a Gaussian beam by reflectionfrom a single interface and a film of arbitrary thicknessfor both the NLR and the NLA is presented. A model forthe description of a Gaussian beam propagating in a non-linear Fabry–Perot resonator with strong nonlinear ab-sorption is proposed. A comparison with reflection froma single interface is made. The application of the RZ-scan for measurement of the NLA and NLR coefficientsof a single interface and a thin film is discussed.
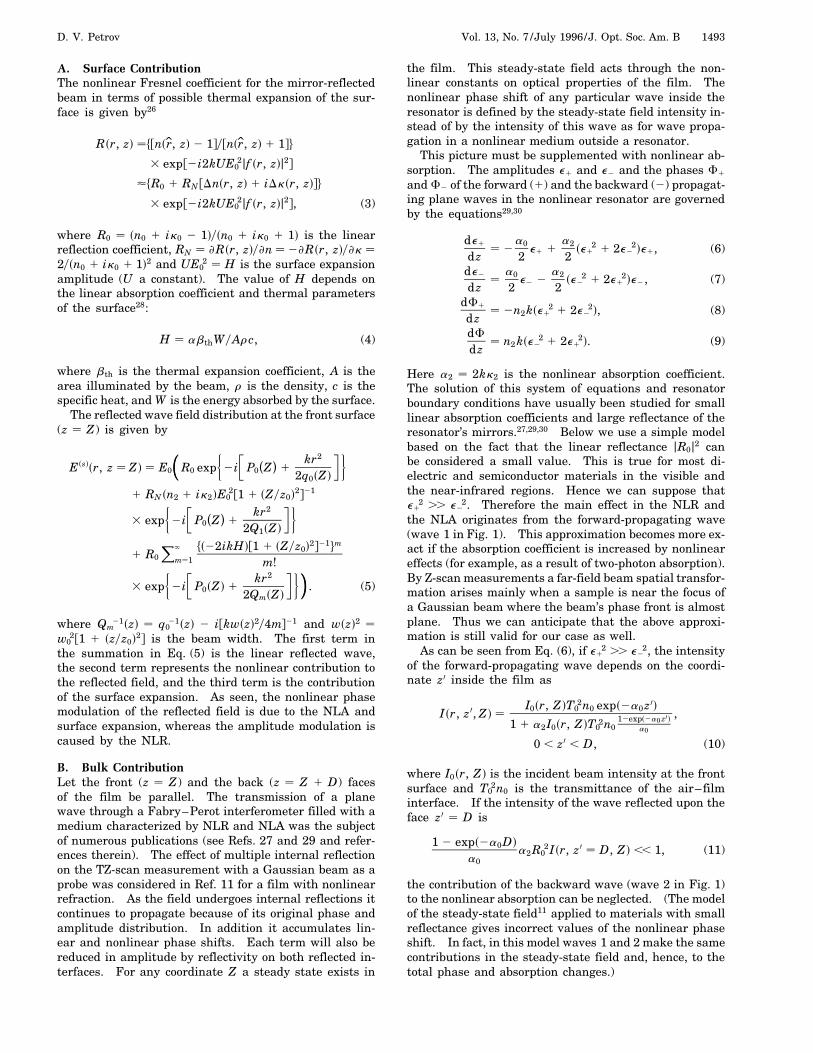
2. THEORYThe geometry of the problem is illustrated in Fig. 1. Afilm of thickness D is positioned with its front surface asZ relative to the origin, which is taken as the position of
the incident Gaussian beam waist. Following the usualapproach to the Z-scan problem, the film thickness isassumed to be small enough that the changes in thebeam diameter within the sample that are due to eitherdiffraction or nonlinear refraction can be neglected. Inthe absence of the film the field in the Gaussian beam atthe front interface is given by
E0sr, z Z, td E0f sr, Zd expfisvt 2 kZdg, (1)
where E0 is the electric field at the focus; f sr, zd exp sss 2
ihP0szd 1 fkr2y2q0szdgjddd, q0szd z 1 iz0, and P0szd 2i lns1 2 izyz0d are the complex beam parameters;z0 kw0
2y2 is the confocal parameter; w0 is the beamwaist radius; r is the radial coordinate of the Gaussianbeam; and v is the frequency.
The refractive index of a nonlinear material witha Gaussian beam is nsbr, zd nsr, zd 1 iksr, zd, wherensr, zd n0 1 Dnsr, zd and ksr, zd k0 1 iDksr, zd.Here n0 and k0 are the linear refractive index and theextinction coefficient, respectively. The dependence ofthe nonlinear contributions Dnsr, zd and Dksr, zd on thebeam intensity I sr, zd E0
2jf sr, zdj2 is determined bya particular mechanism of the nonlinearity. Below weassume that
Dnsr, zd n2E02jf sr, zdj2, Dksr, zd k2E0
2jfsr, zdj2,
(2)
where n2 and k2 are the NLR and the NLA coefficients,respectively. To neglect the self-reflected wave genera-tion we assume that the nonlinear contributions to thecomplex refractive index are small and that n0 .. k0.24
The far-field transformation of the reflected beam is dueto a surface-effect (the reflection coefficient change) anda bulk-effect (phase and amplitude changes in the multi-ple internal reflected waves propagating inside the film).Moreover, energy transformation processes can cause alattice deformation with a subsequent expansion of thesurface that also contributes to the phase changes inducedin the reflected beam.
Below we discuss the Gaussian decomposition method.2
To apply this method we should find the field at theexit plane (z Z), decompose this field into a sum ofGaussian beams, and consider every beam propagatingto the aperture plane (z 2L) as following the law ofpropagation of a Gaussian beam.27
Fig. 1. Reflection of a Gaussian beam from a film.
D. V. Petrov Vol. 13, No. 7 /July 1996/J. Opt. Soc. Am. B 1493
A. Surface ContributionThe nonlinear Fresnel coefficient for the mirror-reflectedbeam in terms of possible thermal expansion of the sur-face is given by26
Rsr, zd hfnsbr, zd 2 1gyfnsbr, zd 1 1gj
3 expf2i2kUE02jf sr, zdj2g
øhR0 1 RN fDnsr, zd 1 iDksr, zdgj
3 expf2i2kUE02jf sr, zdj2g, (3)
where R0 sn0 1 ik0 2 1dysn0 1 ik0 1 1d is the linearreflection coefficient, RN ≠Rsr, zdy≠n 2≠Rsr, zdy≠k 2ysn0 1 ik0 1 1d2 and UE0
2 H is the surface expansionamplitude (U a constant). The value of H depends onthe linear absorption coefficient and thermal parametersof the surface28:
H abthWyArc, (4)
where bth is the thermal expansion coefficient, A is thearea illuminated by the beam, r is the density, c is thespecific heat, and W is the energy absorbed by the surface.
The reflected wave field distribution at the front surface(z Z) is given by
E ssdsr, z Zd E0
µµµR0 exp
Ω2i
∑P0
°Z
¢1
kr2
2q0sZd
∏æ1 RN sn2 1 ik2dE0
2f1 1 sZyz0d2g21
3 expΩ
2i∑
P0
°Z
¢1
kr2
2Q1sZd
∏æ1 R0
X`
m1
hs22ikHdf1 1 sZyz0d2g21jm
m!
3 expΩ
2i∑
P0sZd 1kr2
2QmsZd
∏æ∂∂∂. (5)
where Qm21szd q0
21szd 2 ifkwszd2y4mg21 and wszd2 w0
2f1 1 szyz0d2g is the beam width. The first term inthe summation in Eq. (5) is the linear reflected wave,the second term represents the nonlinear contribution tothe reflected field, and the third term is the contributionof the surface expansion. As seen, the nonlinear phasemodulation of the reflected field is due to the NLA andsurface expansion, whereas the amplitude modulation iscaused by the NLR.
B. Bulk ContributionLet the front (z Z) and the back (z Z 1 D) facesof the film be parallel. The transmission of a planewave through a Fabry–Perot interferometer filled with amedium characterized by NLR and NLA was the subjectof numerous publications (see Refs. 27 and 29 and refer-ences therein). The effect of multiple internal reflectionon the TZ-scan measurement with a Gaussian beam as aprobe was considered in Ref. 11 for a film with nonlinearrefraction. As the field undergoes internal reflections itcontinues to propagate because of its original phase andamplitude distribution. In addition it accumulates lin-ear and nonlinear phase shifts. Each term will also bereduced in amplitude by reflectivity on both reflected in-terfaces. For any coordinate Z a steady state exists in
the film. This steady-state field acts through the non-linear constants on optical properties of the film. Thenonlinear phase shift of any particular wave inside theresonator is defined by the steady-state field intensity in-stead of by the intensity of this wave as for wave propa-gation in a nonlinear medium outside a resonator.
This picture must be supplemented with nonlinear ab-sorption. The amplitudes e1 and e2 and the phases F1
and F2 of the forward (1) and the backward (2) propagat-ing plane waves in the nonlinear resonator are governedby the equations29,30
de1
dz 2
a0
2e1 1
a2
2se1
2 1 2e22de1, (6)
de2
dz
a0
2e2 2
a2
2se2
2 1 2e12de2, (7)
dF1
dz 2n2kse1
2 1 2e22d, (8)
dF
dz n2kse2
2 1 2e12d. (9)
Here a2 2kk2 is the nonlinear absorption coefficient.The solution of this system of equations and resonatorboundary conditions have usually been studied for smalllinear absorption coefficients and large reflectance of theresonator’s mirrors.27,29,30 Below we use a simple modelbased on the fact that the linear reflectance jR0j2 canbe considered a small value. This is true for most di-electric and semiconductor materials in the visible andthe near-infrared regions. Hence we can suppose thate1
2 .. e22. Therefore the main effect in the NLR and
the NLA originates from the forward-propagating wave(wave 1 in Fig. 1). This approximation becomes more ex-act if the absorption coefficient is increased by nonlineareffects (for example, as a result of two-photon absorption).By Z-scan measurements a far-field beam spatial transfor-mation arises mainly when a sample is near the focus ofa Gaussian beam where the beam’s phase front is almostplane. Thus we can anticipate that the above approxi-mation is still valid for our case as well.
As can be seen from Eq. (6), if e12 .. e2
2, the intensityof the forward-propagating wave depends on the coordi-nate z0 inside the film as
I sr, z0, Zd I0sr, ZdT0
2n0 exps2a0z0d1 1 a2I0sr, ZdT0
2n012exps2a0z0d
a0
,
0 , z0 , D, (10)
where I0sr, Zd is the incident beam intensity at the frontsurface and T0
2n0 is the transmittance of the air–filminterface. If the intensity of the wave reflected upon theface z0 D is
1 2 exps2a0Dda0
a2R02I sr, z0 D, Zd ,, 1, (11)
the contribution of the backward wave (wave 2 in Fig. 1)to the nonlinear absorption can be neglected. (The modelof the steady-state field11 applied to materials with smallreflectance gives incorrect values of the nonlinear phaseshift. In fact, in this model waves 1 and 2 make the samecontributions in the steady-state field and, hence, to thetotal phase and absorption changes.)
1494 J. Opt. Soc. Am. B/Vol. 13, No. 7/July 1996 D. V. Petrov
The local nonlinear absorption coefficient of the film isdefined now by the intensity distribution of wave 1:
anlsr, z0, Zd a0 1a2I0sr, ZdT0
2n0 exps2a0z0d1 1 a2I0sr, ZdT0
2n012exps2a0z0d
a0
. (12)
At the front interface (z Z) the field of the wave trans-mitted 2m times through the film is given by
Emsbdsr, Zd E0T0
2jR0j2m21
3 exps2ma0Dd exps2i2mkn0Dd
3 expΩ
2i∑
Pm
°Z
¢1
kr2
2qm
°Z
¢∏ æ
3 f1 1 a2I0sr, ZdT02n0Deff g
2m21Pp0
∑2i kn2
a2R0
2p exps2pa0Dd∏,
m 1, 2 . . . , (13)
where qmszd q0szd 1 i2mDyn0 and Pmszd P0szd 2
i lnh1 1 f2mDyq0szdn0gj are the complex parameters ofthe Gaussian beam transmitted through the film. Bya2I0sr, ZdT0
C. Total Field at an ApertureThe total field at the exit phase (z Z) is now
ET sr, Zd E ssdsr, Zd 1X
m1Em
sbdsr, Zd. (15)
Each term in Eq. 15 is a sum of the Gaussian beams.The field distribution at an aperture placed at a distanceZ 1 L from the film’s front surface is determined witha help of the known transformation law for a Gaussianbeam parameters P szd and qszd (Ref. 27):
PmasZ 1 Ld Pm
ssZd 2 i ln
"1 1
Z 1 Lqm
ssZd
#,
qmasZ 1 Ld qm
ssZd 1 sZ 1 Ld. (16)
Here Pma, qm
a and Pms, qm
s are the complex beam pa-rameters at the aperture and the film’s front surface,respectively.
Below we illustrate the behavior of the sample re-flectance as a function of Z for different nonlinear pa-rameters. The reflectance is defined as
R°Z
¢
Rrap0 rjET
apsr, Zdj2drRrap0 rjET
apsr, Zdj2n20,k20,U0dr, (17)
where rap is the radius of the aperture and ETapsr, Zd is
the total reflected field at the aperture.
Simple expressions for RsZd can be obtained for thesurface contribution. The on-axis reflectance (rap ! 0)[the small-aperture measurement (SAM)] is given by
Ldyfkw2sZdy2g.The total intensity (rap ! `) [the open-aperture mea-
surement (OAM)] is obtained by integration over r inEq. (4). Taking into account that k2E0
2 ,, 1 and n2E02 ,
, 1 yields the reflectance:
ROAMssd
°Z
¢ 1 1
R0
RN
n2E02
1 1 sZyz0d2. (19)
3. RESULTS OF CALCULATIONSFigure 2 illustrates the behavior of the on-axis reflectanceif only the surface effect is included. For a flat surfacethat possesses nonlinear absorption (n2 0, U 0) or fora linear material suffering surface expansion (n2 0, k2 0), RZ-scan curves represent the peak-and-valley depen-dence [Fig. 2(a)]. Figure 2(b) shows the dependence ofthe reflectance if a flat surface possesses NLR (k2 0,U 0). For OAM’s the NLR affects the reflectance[Fig. 2(c)]. Different values of the product (nonlinear pa-rameter 3 on-axis intensity E0
2) were considered. By cal-culations we suppose that n0 1.55 and a0 220 cm–1,which are close to the parameters of semiconductor-dopedglasses in the wavelength band of strong absorption. Thewavelength l 0.53 mm is used. The linear reflectioncoefficient was calculated as R0 sn0 1 ik0 2 1dysn0 1
ik0 1 1d, and k0 a0y2k 1.1 3 1023. For the param-eters given above the reflectance jR0j2 0.04. In theframework of the proposed model the value of R0 can-not affect the final results because the normalization onthe linear reflectance is always used. In materials witha large refractive index, such as ,3.5 for GaAs, R0 ø 0.55.In this case the wave 2 (see Fig. 1) should be included bythe calculation of the steady-state field.
Note that, unlike for the TZ scan, the characteristicpeak-and-valley dependence in the SAM RZ scan is ob-served for the NLA, for thermal expansion, or for both.In the OAM the total intensity of the reflected beam isaffected by the NLR only, which can be explained if oneconsiders the expression for the nonlinear reflection coef-ficient [relation (3)]. If n2 0, the reflection coefficientis given by
Rsr, zd ø hR0 2 RN 1 RN expfik2E02jf sr, zdj2gj
3 expf2i2kUE02jf sr, zdj2g, (20)
and thus the thermal expansion and the NLA induce aphase modulation in the transverse direction of the re-flected beam. This type of modulation changes the cur-vature of the Gaussian beam, and it produces the peak-and-valley dependence of the on-axis intensity. This ef-fect is analogous to a TZ-scan signature for NLR.2 Ifk2 0 and U 0 the reflection coefficient is given by
Rsr, zd ø R0 1 RN n2E02jf sr, zdj2, (21)
D. V. Petrov Vol. 13, No. 7 /July 1996/J. Opt. Soc. Am. B 1495
Fig. 2. Contribution of the surface effect to the reflectance:the RZ-scan traces (a), (b) for the SAM and (c) for the OAM.(a) n2 0, (b), (c) k2 0.
and an amplitude modulation arises in the reflected beam.This modulation causes changes in the field intensity atthe aperture when the Gaussian beam focus is near thesurface. These changes are always positive or negative,depending on the sign of the NLR coefficient.
The OAM is affected by the NLR only. Hence for asingle interface the RZ-scan curves allow the NLA and theNLR coefficients to be determined unambiguously. Oneshould perform the OAM as a first step in finding theNLR coefficient by using Eq. (19). Then one should fitEq. (18) to the SAM data to calculate the NLA coefficient.
The numerical evaluation of Eq. (18) showed that, if theexperimental apparatus is capable of resolving reflectancechanges of ø1%, nonlinearities corresponding to the val-ues n2E0
2 7 3 1023 and k2E02 1022 are detectable.
Thus, for a peak irradiance of E02 1 GWycm2, a NLR co-
efficient higher than n2 7 3 10212 cm2yW and a NLA co-efficient higher than k2 10211 cm2yW can be measuredwith the RZ scan used for a single interface.
Figure 3 illustrates the bulk contributions into re-flectance, i.e., the term
PEm
sbdsr, Zd in Eq. (15) withoutthe contributions of linear and nonlinear reflection onthe front interface. Figure 3(a) shows the on-axis re-flectance as a function of the film’s thickness D for a filmwith NLR, whereas Fig. 3(b) shows the same dependencefor a film with saturable absorption. The values of thepeaks increase with increasing D, but the reflectance’schanges are saturated. The saturation is observed whenthe penetration depth of the wave, calculated by use of thenonlinear absorption coefficient, is equal to the sample’sthickness. As expected, in this case the RZ-scan tracesare analogous to the same curves of a TZ scan. No in-terference effects are observed on the RZ-scan traces,which means that for a given set of optical parametersthe amplitudes of the waves with m . 1 are small.
The total reflected field, of course, exhibits an interfer-ence with the film’s thickness that is due to both the linearand the nonlinear phase shifts between the bulk and thesurface contributions. Figure 4 shows the reflectance asa function of D for the SAM [Fig. 4(a)] and the OAM[Fig. 3(b)] if the NLA dominates (k2 .. n2). To empha-size the interference effects we consider a small range of
Fig. 3. Contribution of the bulk effect to the reflectance: theRZ-scan traces for different film thicknesses: (a) n2E0
2 1023,k2 0; (b) k2E0
2 28 3 1024, n2 0.
1496 J. Opt. Soc. Am. B/Vol. 13, No. 7/July 1996 D. V. Petrov
Fig. 4. RZ-scan traces as a function of the film’s thickness for(a) the SAM and (b) the OAM. k2E0
2 28 3 1024, n2 0.
the film’s thickness changes (0.5 mm). The maximal re-flectance variations are much larger than for the surfacecontribution (Fig. 2). For the SAM the peak-and-valleytraces alternate with maximum and minimum curves.This new feature appears as a result of interference effectsinside the nonlinear film. For the OAM, curves with onemaximum or minimum are observed. The calculationsshowed that these features are also present if the NLRdominates (n2 .. k2). In a comparison of the data inFigs. 2–4, account must be taken of the small absolutevalue of the bulk contribution to linear reflectance that isdue to the large linear absorption coefficient.
More-complicated Z-scan traces appear if the film’sthickness is rather small when the bulk and surface con-tributions are comparable (Fig. 5). By calculations wesuppose that the NLR dominates the NLA. For any film’sthickness the SAM RZ-scan trace is a combination of thepeak-and-valley trace and the trace with one maximum(minimum). The bulk effect becomes larger than the sur-face effect starting from a thickness of ,0.2 mm (one max-imum curve on the SAM traces is changed by the peak-and-valley signature). In the intermediate range of filmthickness the bulk and the surface contributions have thesame significance, and the total RZ-scan trace depends onthe relative phases of the contributions.
Interesting behavior is observed for the OAM RZ-scan traces. It is known2 that the NLR cannot con-tribute to the OAM if the bulk effect is considered alone.Figure 5(b) shows that the OAM traces depend on thefilm’s thickness. The reason is that increasing the film’s
thickness decreases the total linear reflectance [denomi-nator of Eq. (17)] because of the effect of linear absorption.
Similar effects should be observed in the RZ-scancurves for the case of sub-micrometer films upon thesurfaces of transparent or opaque substrates, for exam-ple, GaAlAsyGaAs multilayer structures upon a GaAssubstrate.
The results shown above reveal a more-complicateddependence of the reflectance when the TZ scan and theRZ scan we compared by reflection from a single inter-face. Figure 6 shows Z-scan traces for different filmthicknesses. Different combinations of the nonlinearproperties of the film are assumed. For the SAM thepeak-and-valley traces alternate with the one maximum(minimum) trace at both pure NLR and pure NLA. Forthe OAM the peak-and-valley traces do not appear forany film thickness. As shown, even if the film thicknessis known with good accuracy it is hard for one unambigu-ously to find the values of the nonlinear parameters byusing the SAM and OAM RZ-scan curves.
4. CONCLUSIONThe reflectance of a single interface and a thin film pos-sessing nonlinear refraction and absorption was studiedas a function of the incident Gaussian beam waist posi-tion with respect to the surface. It was shown that themeasurements of the reflectance changes (the reflectionZ scan) permit the sign and the value of the nonlinearoptical coefficients of the single interface to be found un-ambiguously. In applying the reflection Z scan to a thin
Fig. 5. RZ-scan traces as a function of the film’s thickness for(a) the SAM and (b) the OAM. n2E0
2 1023, k2 0.
D. V. Petrov Vol. 13, No. 7 /July 1996/J. Opt. Soc. Am. B 1497
Fig. 6. RZ-scan traces for four film thicknesses [0, D0 129 mm; 1, D D0 1 lys8n0d; 2, D D0 1 lys4n0d; 3, D D0 1 3lys8n0d].(a), (b) n2E0
film one could encounter difficulties in interpretation ofexperimental data because of interference effects. TheRZ-scan technique is of special significance for use withmaterials with strong linear absorption when the conven-tional TZ-scan measurements cannot be performed. Inthis case limitations in applying the RZ-scan can ariseonly for thin-film materials with strong saturation ofabsorption.
The RZ-scan technique, like any optical method dealingwith reflected light (e.g., ellipsometry, second-harmonicgeneration by reflection), should be sensitive to anychanges in the optical properties on the studied surface,including, in particular, adsorbed molecules and struc-ture changes of the surface. The sensitivity of the RZscan to these surface imperfections needs special study.
The RZ-scan technique can easily be extended for mea-surements of nondegenerate susceptibilities as well as fortime-resolved measurements of surface nonlinearities byuse of two beams of different colors.
ACKNOWLEDGMENTSThis research was supported by the Brazilian AgencyConselho Nacional de Desenvolvimento Cientıfico e Tec-nologico. The author thanks Cid B. de Araujo and
A. S. L. Gomes for helpful discussions and for use ofthe computer facilities of their laboratories.
REFERENCES1. Y. R. Shen, The Principles of Nonlinear Optics (Wiley, New
York, 1984).2. M. Sheik-Bahae, A. A. Said, T. H. Wei, D. J. Hagen, and
E. W. Van Stryland, “Sensitive measurements of optical non-linearities using a single beam,” IEEE J. Quantum Electron.26, 760–769 (1990).
3. H. Ma, A. S. L. Gomes, and C. B. de Araujo, “Measurement ofnondegenerate optical nonlinearity using a two-color singlebeam method,” Appl. Phys. Lett. 59, 2666–2668 (1991).
4. J. Wang, J. Sheik-Bahae, A. A. Said, D. J. Hagan, andE. W. Van Stryland, “Time-resolved Z-scan measurementsof optical nonlinearities,” Proc. SPIE 1962, 63–72 (1992).
5. D. V. Petrov, A. S. L. Gomes, and C. B. de Araujo, “Spa-tial phase modification due to the thermal nonlinearity insemiconductor-doped glass,” Phys. Rev. B 50, 9092–9097(1994).
6. J.-G. Tian, W.-P. Zang, and G. Zhang, “Two modified Z-scanmethods for determination of nonlinear-optical index withenhanced sensitivity,” Opt. Commun. 107, 415–419 (1994).
7. R. DeSalvo, M. Sheik-Bahae, A. A. Said, D. J. Hagan, andE. W. Van Stryland, “Z-scan measurements of the anisotropyof nonlinear refraction and absorption in crystals,” Opt. Lett.18, 194–196 (1993).
1498 J. Opt. Soc. Am. B/Vol. 13, No. 7/July 1996 D. V. Petrov
8. W. Zhao and D. Palffy-Muhoray, “Z-scan technique usingtop-hat beams,” Appl. Phys. Lett. 63, 1613–1615 (1993).
9. T. Xia, D. J. Hagan, M. Sheik-Bahae, and E. W. Van Stry-land, “Eclipsing Z-scan measurement of wave front distor-tion of 1y104,” Opt. Lett. 19, 317–319 (1994).
10. L. C. Oliveira and S. C. Zilio, “Single-beam time-resolved Z-scan measurements of slow absorbers,” Appl. Phys. Lett. 65,2121–2123 (1994).
11. R. L. Sutherland, “Effect of multiple internal sample reflec-tions on nonlinear refractive Z-scan measurement,” Appl.Opt. 33, 5571–5575 (1994).
12. S. Kazaki and H. Sakurai, “Characteristic of a Gaussianbeam at a dielectric interface,” J. Opt. Soc. Am. 68, 508–514(1978).
13. Y. M. Antaraud and W. M. Boerner, “Gaussian beam inter-action with a planar dielectric interface,” Can. J. Phys. 52,962–972 (1974).
14. A. E. Kaplan, “Theory of hysteresis reflection and refractionof light by a boundary of nonlinear medium,” Sov. Phys.JETP 45, 896–905 (1977).
15. W. J. Tomlinson, J. P. Gordon, P. W. Smith, and A. E.Kaplan, “Reflection of a Gaussian beam at a nonlinear in-terface,” Appl. Opt. 21, 2041–2051 (1982); P. W. Smith andW. J. Tomlinson, “Nonlinear interface: switching behav-ior,” IEEE J. Quantum Electron. QE-20, 30–36 (1984).
16. D. R. Andersen and J. J. Regan, “Reflection and refractionof a three-dimensional Gaussian beam at a nonlinear inter-face,” J. Opt. Soc. Am. B 6, 1484–1492 (1989).
17. E. Lantz, D. Metin, H. Cornet, and A. Lacourt, “Transmis-sion of a Gaussian beam through a nonlinear thin film nearthe total reflection state,” J. Opt. Soc. Am. B 11, 347–354(1994).
18. Th. Peschel, P. Dannberg, U. Langbein, and F. Lederer,“Investigation of optical tunneling through nonlinear films,”J. Opt. Soc. Am. B 5, 29–36 (1988).
19. I. C. Khoo and P. Zhou, “Dynamics of switching total internalreflection to transmission in a dielectric-cladded nonlinearfilm,” J. Opt. Soc. Am. B 5, 884–888 (1988).
20. I. C. Khoo and P. Zhou, “Nonlinear interface tunneling phaseshift,” Opt. Lett. 17, 1325–1327 (1992).
21. Y.-Y. Wu and C. H. Chen, “Optical switching of a nonlinearslab in total internal reflection state,” Opt. Commun. 75,179–183 (1990).
22. K. Strobl and I. Golub, “All optical switching of reflectivityand transmissivity by a nonlinear sandwich,” IEEE J. Quan-tum Electron. 28, 1435–1438 (1992).
23. S. D. Kunitsin, A. P. Sukhorukov, and V. A. Trovimov, “Self-reflection of a light beam from a nonlinear focus,” Bull. Russ.Acad. Sci. 56, 2007–2014 (1992).
24. L. Roso-Franco, “Self-reflected wave inside a very dense sat-urable absorber,” Phys. Rev. Lett. 55, 2149–2151 (1985).
25. S. R. Hartmann and J. T. Manassah, “Spatial modificationof a Gaussian beam on reflection from a saturable absorber,”Opt. Lett. 16, 1349–1351 (1991).
26. D. V. Petrov, A. S. L. Gomes, and C. B. de Araujo, “ReflectionZ-scan technique for measurements of optical properties ofsurfaces,” Appl. Phys. Lett. 65, 1067–1069 (1994).
27. H. A. Haus, Waves and Fields in Optoelectronics (Prentice-Hall, Englewood Cliffs, N.J., 1984).
28. C. Karner, A. Mandel, and F. Trager, “Pulsed laser photo-thermal displacement spectroscopy for surface studies,”Appl. Phys. A 38, 19–21 (1985).
29. H. M. Gibbs, Optical Bistability: Controlling Light by Light(Academic, New York, 1984).
30. S. M. Zakharov, “Bistable transmission by a Fabry–Perotinterferometer filled by a medium characterized by activeand reactive nonlinearities,” Russ. Quantum Electron. 24,56–58 (1994).