37
Reflections on Inequality and Capital in the 21 st century Thomas Piketty Paris School of Economics Miami, BHC-EBHA Meeting, June 26 2015
| Date post: | 26-Dec-2015 |
| Category: |
Documents |
| Upload: | sylvia-amelia-mills |
| View: | 214 times |
| Download: | 0 times |

Reflections on Inequality and Capital in the 21st century
Thomas PikettyParis School of Economics
Miami, BHC-EBHA Meeting, June 26 2015

• This presentation is based upon Capital in the 21st century (Harvard University Press, March 2014)
• This book studies the global dynamics of income and wealth distribution since 18c in 20+ countries; I use historical data collected over the past 15 years with Atkinson, Saez, Postel-Vinay, Rosenthal, Alvaredo, Zucman, and 30+ others; I try to shift attention from rising income inequality to rising wealth inequality
• The book includes four parts: Part 1. Income and capitalPart 2. The dynamics of the capital/income ratioPart 3. The structure of inequalitiesPart 4. Regulating capital in the 21st century
• In this presentation I will present some results from Parts 2 & 3, focusing upon the long-run evolution of capital/income ratios and wealth concentration (all graphs and series are available on line:
see http://piketty.pse.ens.fr/capital21c )
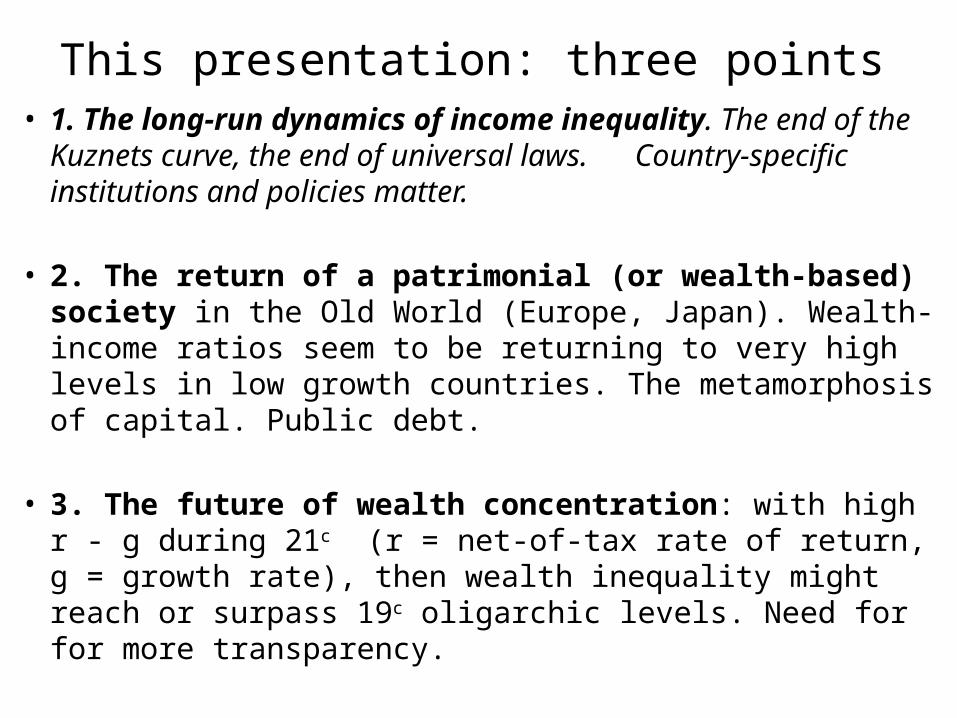
This presentation: three points• 1. The long-run dynamics of income inequality. The end
of the Kuznets curve, the end of universal laws. Country-specific institutions and policies matter.
• 2. The return of a patrimonial (or wealth-based) society in the Old World (Europe, Japan). Wealth-income ratios seem to be returning to very high levels in low growth countries. The metamorphosis of capital. Public debt.
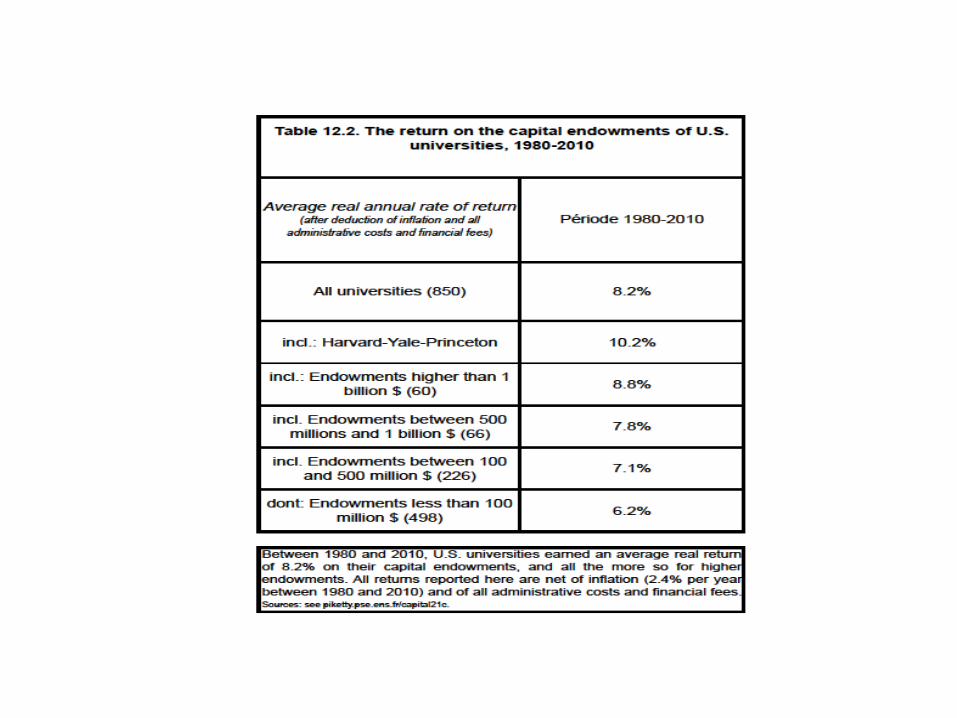
• 3. The future of wealth concentration: with high r - g during 21c (r = net-of-tax rate of return, g = growth rate), then wealth inequality might reach or surpass 19c oligarchic levels. Need for for more transparency.


• Three facts about inequality in the long-run: income inequality, wealth-inequality, wealth-income ratios
(Piketty-Saez, « Inequality in the long run », Science 2014)
• Fact n°1: in 1900-1910, income inequality was higher in Europe than in the United States; in 2000-2010, it is a lot higher in the United States

25%
30%
35%
40%
45%
50%
1900 1910 1920 1930 1940 1950 1960 1970 1980 1990 2000 2010
Shar
e of
top
inco
me
deci
le in
tota
l pre
tax
inco
me
(dec
enni
al a
vera
ges)
The share of total income accruing to top decile income holders was higher in Europe than in the U.S. around 1900-1910; it is a lot higher in the U.S. than in Europe around 2000-2010.
Sources and series: see piketty.pse.ens.fr/capital21c (fig.9,8)
Figure 1. Income inequality: Europe and the U.S., 1900-2010
Top 10% income share: Europe
Top 10% income share: U.S.

25%
30%
35%
40%
45%
50%
1910 1920 1930 1940 1950 1960 1970 1980 1990 2000 2010
Sha
re o
f top
dec
ile in
nat
iona
l inc
ome
The top decile share in U.S. national income dropped from 45-50% in the 1910s-1920s to less than 35% in the 1950s (this is the fall documented by Kuznets); it then rose from less than 35% in the 1970s to 45-50% in the 2000s-2010s.
Sources and series: see
Figure I.1. Income inequality in the United States, 1910-2012
Share of top decile in total income (including capital gains)
Excluding capital gains

25%
30%
35%
40%
45%
50%
1900 1910 1920 1930 1940 1950 1960 1970 1980 1990 2000 2010
Shar
e of
top
inco
me
deci
le in
tota
l pre
tax
inco
me
(dec
enni
al a
vera
ges)
The share of total income accruing to top decile income holders was higher in Europe than in the U.S. around 1900-1910; it is a lot higher in the U.S. than in Europe around 2000-2010.
Sources and series: see piketty.pse.ens.fr/capital21c (fig.9,8)
Figure 1. Income inequality: Europe and the U.S., 1900-2010
Top 10% income share: Europe
Top 10% income share: U.S.
19001901190219031904190519061907190819091910191119121913191419151916191719181919192019211922192319241925192619271928192919301931193219331934193519361937193819391940194119421943194419451946194719481949195019511952195319541955195619571958195919601961196219631964196519661967196819691970197119721973197419751976197719781979198019811982198319841985198619871988198919901991199219931994199519961997199819992000200120022003200420052006200720082009201025%
30%
35%
40%
45%
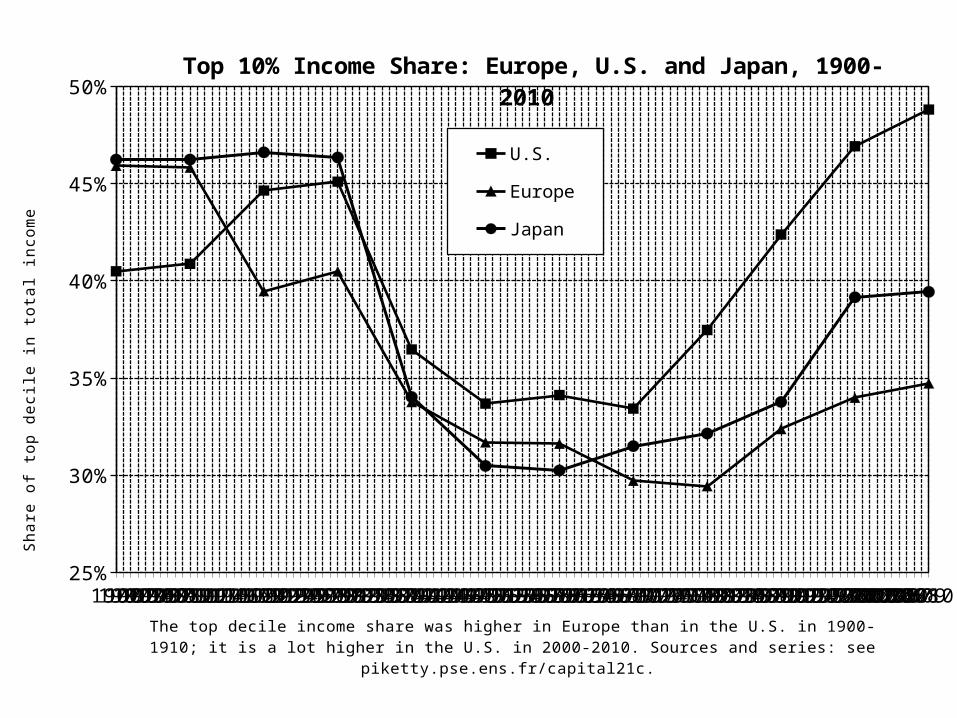
50%Top 10% Income Share: Europe, U.S. and Japan, 1900-2010
U.S.
Europe
Japan
The top decile income share was higher in Europe than in the U.S. in 1900-1910; it is a lot higher in the U.S. in 2000-2010. Sources and series: see piketty.pse.ens.fr/capital21c.
Sh
are
of t
op
de
cile
in to
tal i
nco
me

• The rise in US inequality in recent decades is mostly due to rising inequality of labor income
• It is due to a mixture of reasons: changing supply and demand for skills; race between education and technology; globalization; more unequal to access to skills in the US (rising tuitions, insufficient public investment); unprecedented rise of top managerial compensation in the US (changing incentives, cuts in top income tax rates); falling minimum wage in the US
institutions and policies matter


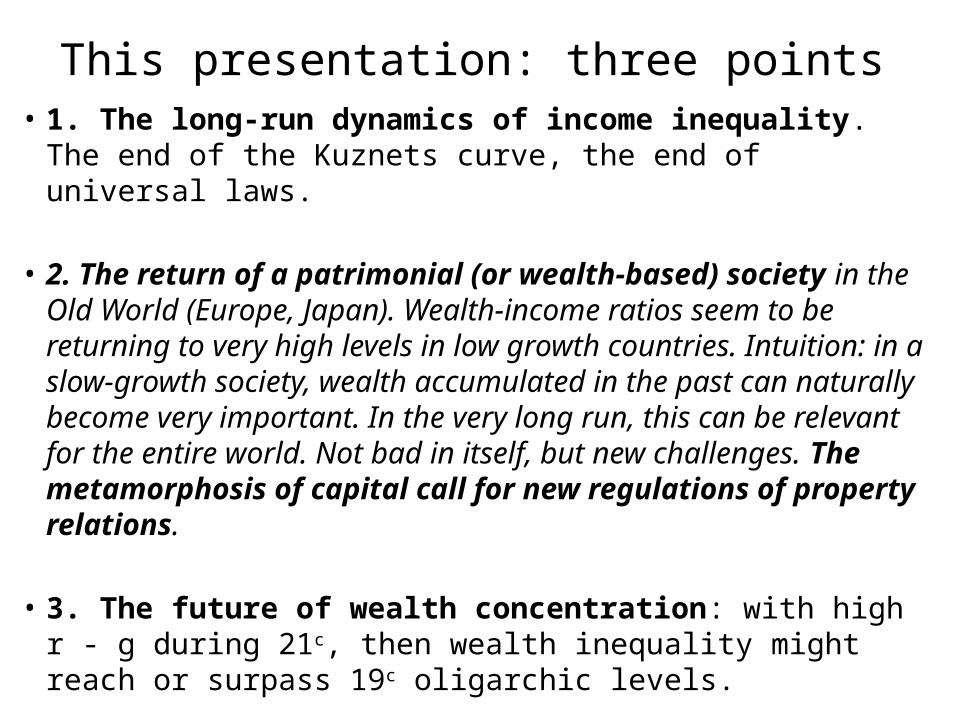
This presentation: three points• 1. The long-run dynamics of income inequality. The end of the Kuznets curve, the end of universal laws.
• 2. The return of a patrimonial (or wealth-based) society in the Old World (Europe, Japan). Wealth-income ratios seem to be returning to very high levels in low growth countries. Intuition: in a slow-growth society, wealth accumulated in the past can naturally become very important. In the very long run, this can be relevant for the entire world. Not bad in itself, but new challenges. The metamorphosis of capital call for new regulations of property relations.
• 3. The future of wealth concentration: with high r - g during 21c, then wealth inequality might reach or surpass 19c oligarchic levels.

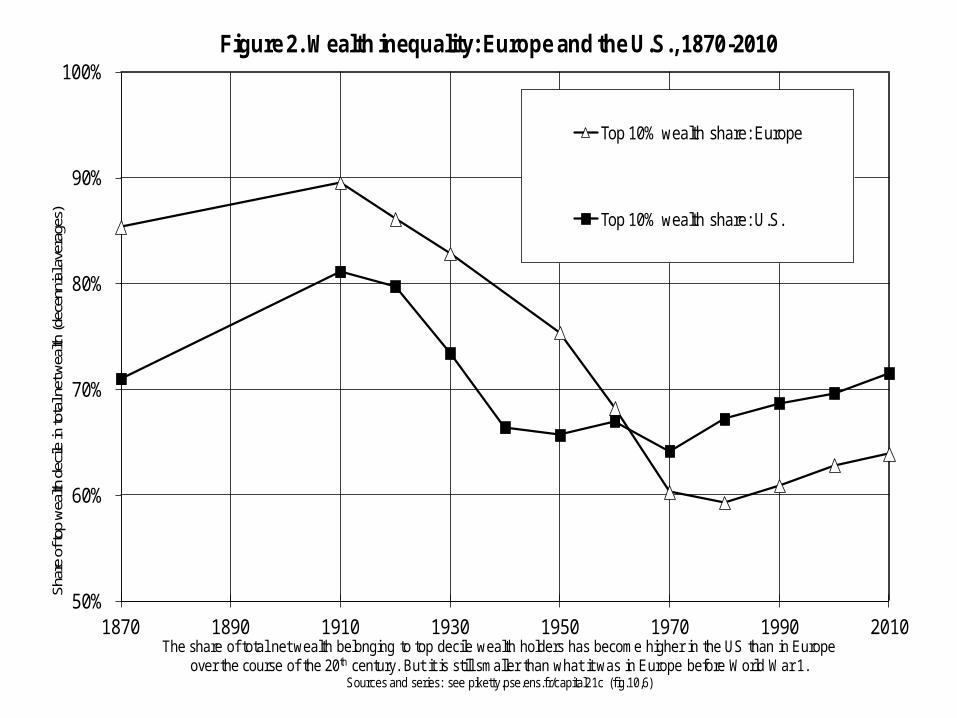
• Fact n°2: wealth inequality is always a lot higher than income inequality; it is now higher in the US than in Europe
• Fact n°3: wealth inequality is less extreme today than a century ago in Europe, although the total capitalization of private wealth relative to national income has now recovered from the 1914-1945 shocks

50%
60%
70%
80%
90%
100%
1870 1890 1910 1930 1950 1970 1990 2010
Shar
e of
top
wea
lth d
ecile
in to
tal n
et w
ealth
(dec
enni
al a
vera
ges)
The share of total net wealth belonging to top decile wealth holders has become higher in the US than in Europe over the course of the 20th century. But it is still smaller than what it was in Europe before World War 1.
Sources and series: see piketty.pse.ens.fr/capital21c (fig.10,6)
Figure 2. Wealth inequality: Europe and the U.S., 1870-2010
Top 10% wealth share: Europe
Top 10% wealth share: U.S.

200%
300%
400%
500%
600%
700%
1900 1910 1920 1930 1940 1950 1960 1970 1980 1990 2000 2010
Tota
l mar
ket v
alue
of n
et p
rivat
e w
ealth
(% n
atio
nal i
ncom
e)(d
ecen
nial a
vera
ges)
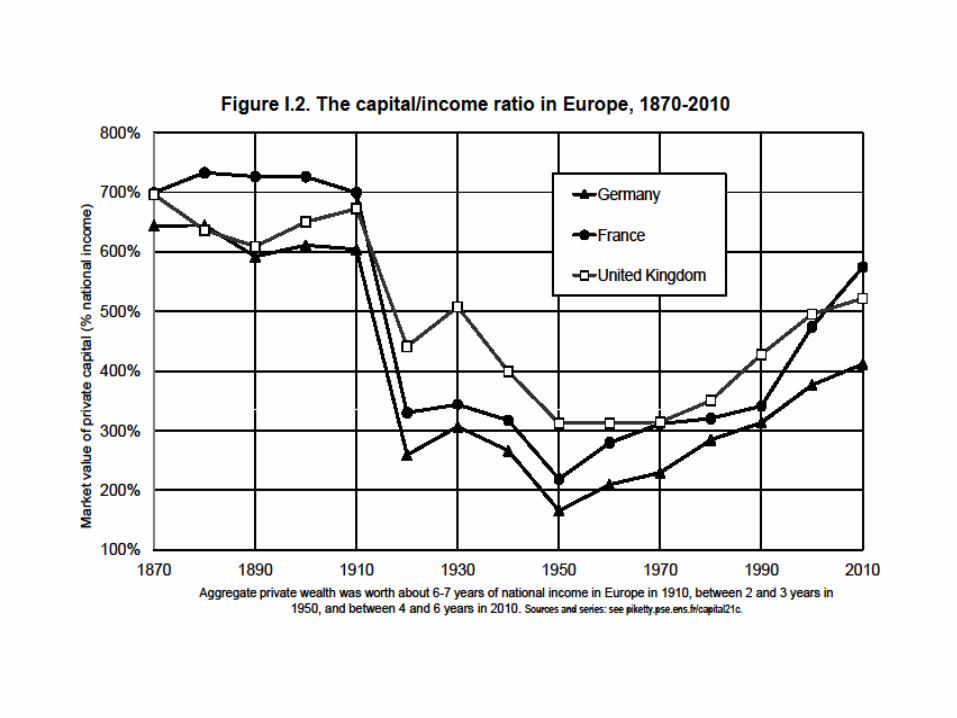
Total net private wealth was worth about 6-7 years of national income in Europe prior to World War 1, down to 2-3 years in 1950-1960, back up to 5-6 years in 2000-2010. In the US, the U-shapped pattern was much less marked.
Sources and series: see piketty.pse.ens.fr/capital21c (fig.5,1)
Figure 3. Wealth-income ratios: Europe and the U.S., 1900-2010
Europe
U.S.

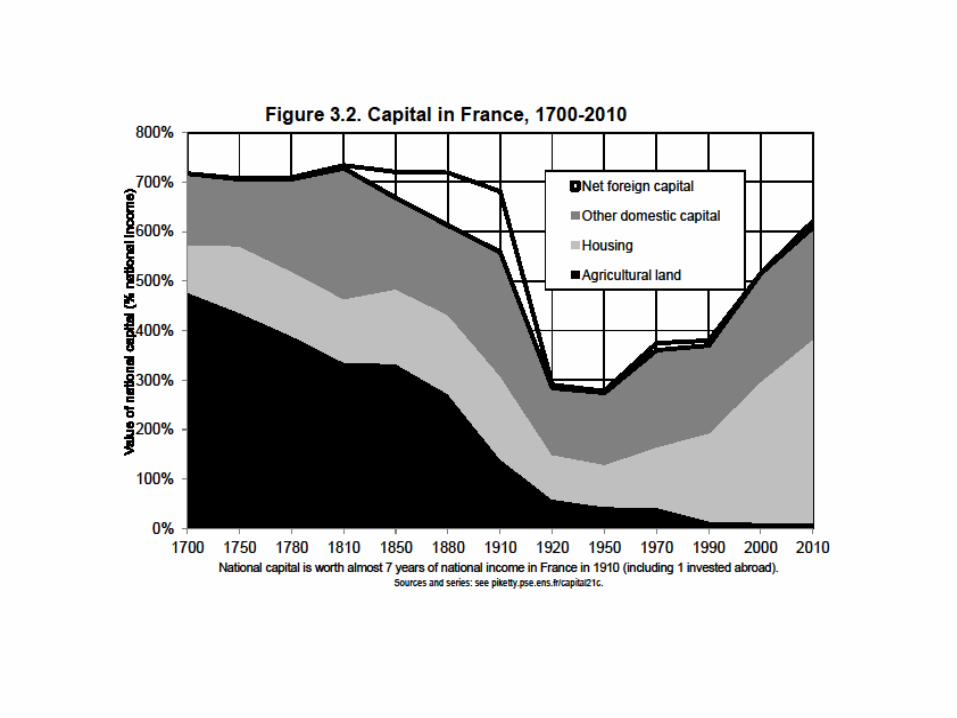
The metamorphosis of capital
• There’s nothing bad with high wealth-income ratios (postwar reconstruction, growth slowdown), but this creates new policy challenges: financial regulation, real estate bubbles, return of inheritance
A multidimensional approach to the history of capital and property relations: from land to business assets, foreign assets, real estate, public debt, immaterial capital, etc.


1970 1975 1980 1985 1990 1995 2000 2005 2010100%
200%
300%
400%
500%
600%
700%
800%
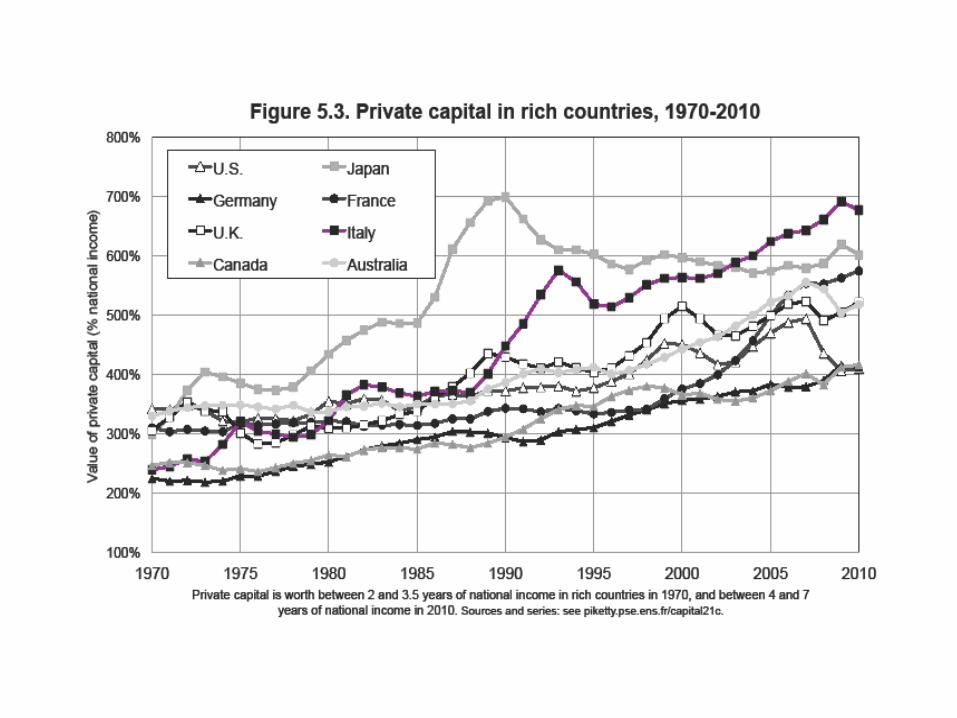
Figure S5.2. Private capital in rich countries: from the Japanese to the Spanish bubble
U.S.A Japan Germany
France U.K. Italy
Canada Australia Spain
Private capital almost reached 8 years of national income in Spain at the end of the 2000s (ie. one more year than Japan in 1990). Sources and series: see piketty.pse.ens.fr/capital21c.
Va
lue
of
pri
vate
ca
pita
l (%
of
na
tion
al i
nco
me
)

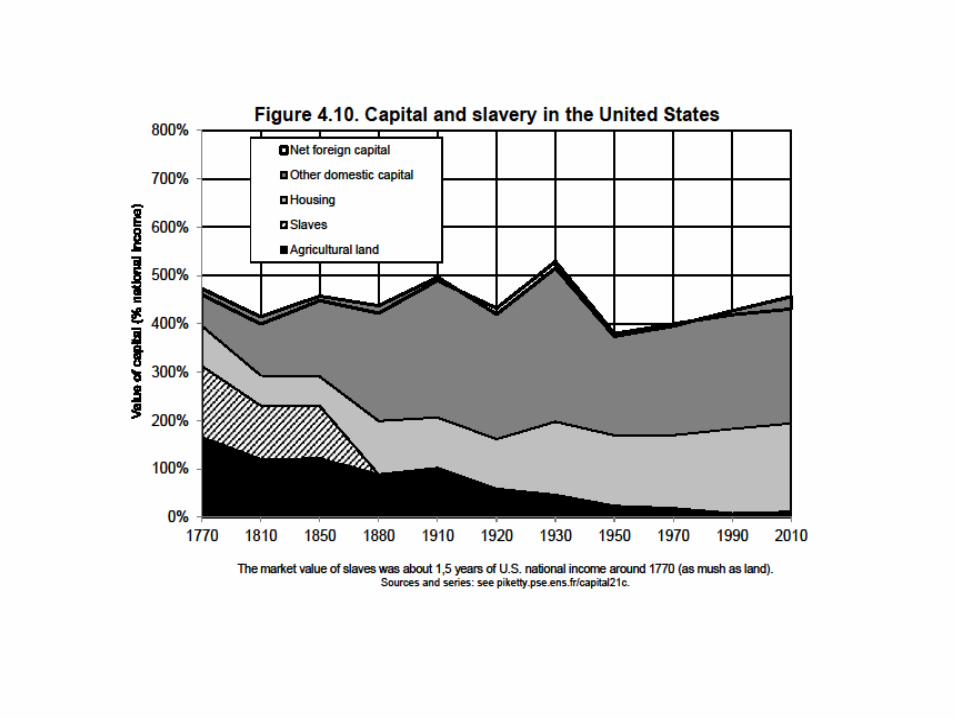
Capital & inequality in America• Inequality in America = a different structure as in Europe: more egalitarian in some ways, more inegalitarian in others
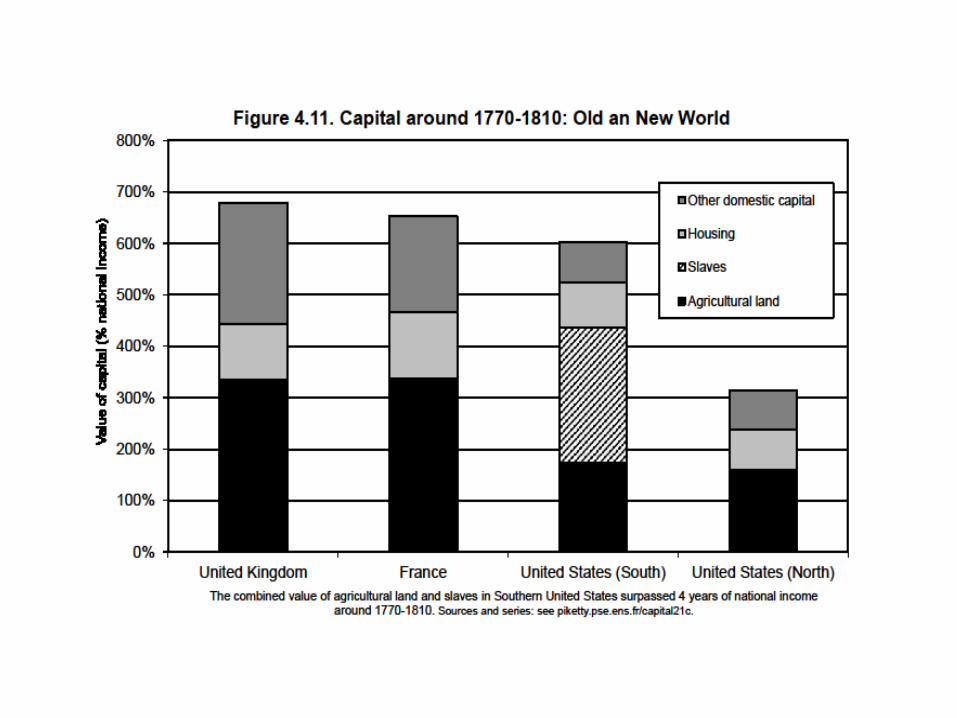
• The New World in the 19th century: the land of opportunity (capital accumulated in the past matters less than in Europe; perpetual pop. growth as a way to reduce the level of inherited wealth and wealth concentration)… and also the land of slavery: extreme form of property relation
• Northern US were in many ways more egalitarian than Old Europe; but Southern US were more inegalitarian
• We still have the same ambiguous relationship of America with inequality today: in some ways more merit-based; in other ways more violent (« meritocratic extremism »)


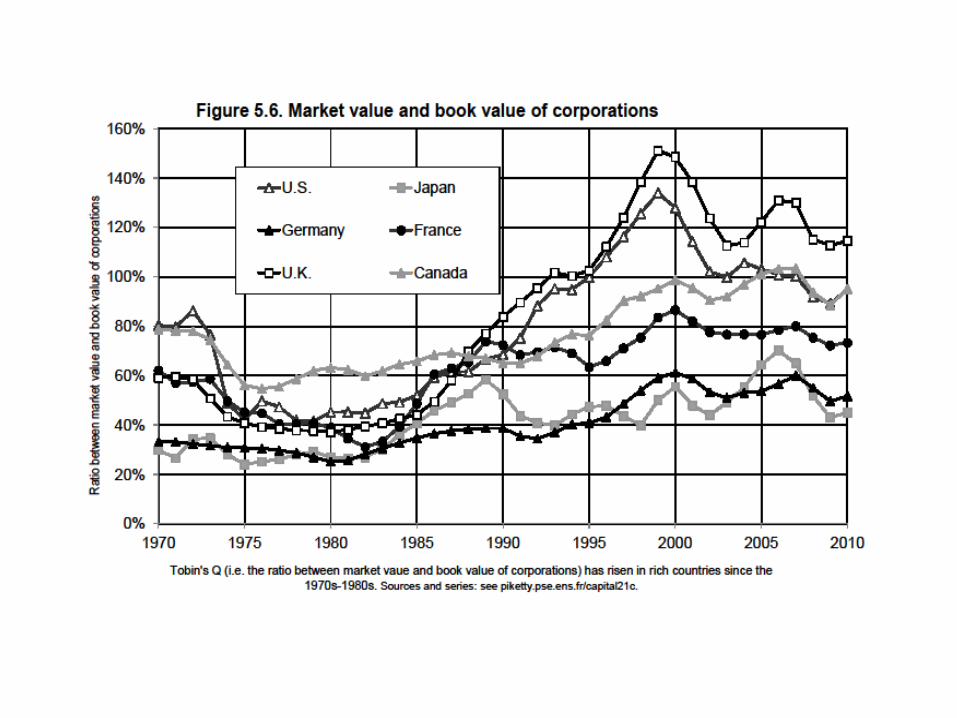
Capital & inequality in Germany• Lower market values of capital assets in Germany: lower real estate prices, and lower stock market capitalization of corporations
• Stakeholder capitalism: shareholders have to share power with worker representatives, regional govt, etc., so that the market value is much less than book value of corporation
• Apparently this does not prevent German companies from producing good cars
• This clearly illustrates that market and social values of capital can differ; property relations are socially, legally and historically determined

This presentation: three points• 1. The long-run dynamics of income inequality. The end of the Kuznets curve, the end of universal laws. Country-specific institutions and policies matter.
• 2. The return of a patrimonial (or wealth-based) society in the Old World (Europe, Japan). Wealth-income ratios seem to be returning to very high levels in low growth countries.
• 3. The future of wealth concentration: with high r - g during 21c (r = net-of-tax rate of return, g = growth rate), then wealth inequality might reach or surpass 19c oligarchic levels. Conversely, suitable institutions can allow to democratize wealth. Strong need for more transparency about global wealth dynamics and cross-border financial assets, in rich countries as well as in emerging countries (China, Latin America, Africa).
50%
60%
70%
80%
90%
100%
1870 1890 1910 1930 1950 1970 1990 2010
Shar
e of
top
wea
lth d
ecile
in to
tal n
et w
ealth
(dec
enni
al a
vera
ges)
The share of total net wealth belonging to top decile wealth holders has become higher in the US than in Europe over the course of the 20th century. But it is still smaller than what it was in Europe before World War 1.
Sources and series: see piketty.pse.ens.fr/capital21c (fig.10,6)
Figure 2. Wealth inequality: Europe and the U.S., 1870-2010
Top 10% wealth share: Europe
Top 10% wealth share: U.S.


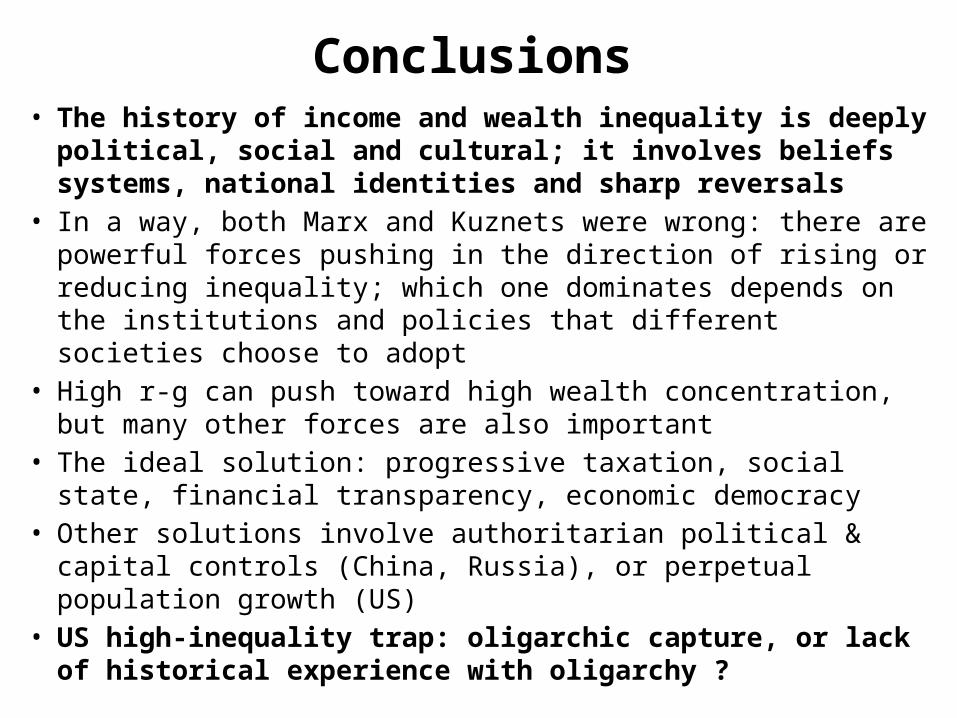
Conclusions• The history of income and wealth inequality is deeply political,
social and cultural; it involves beliefs systems, national identities and sharp reversals
• In a way, both Marx and Kuznets were wrong: there are powerful forces pushing in the direction of rising or reducing inequality; which one dominates depends on the institutions and policies that different societies choose to adopt
• High r-g can push toward high wealth concentration, but many other forces are also important
• The ideal solution: progressive taxation, social state, financial transparency, economic democracy
• Other solutions involve authoritarian political & capital controls (China, Russia), or perpetual population growth (US)
• US high-inequality trap: oligarchic capture, or lack of historical experience with oligarchy ?


