Page 1
Reform directions for China’s socialist market
economy: a macroeconomic perspective 1
Introduction
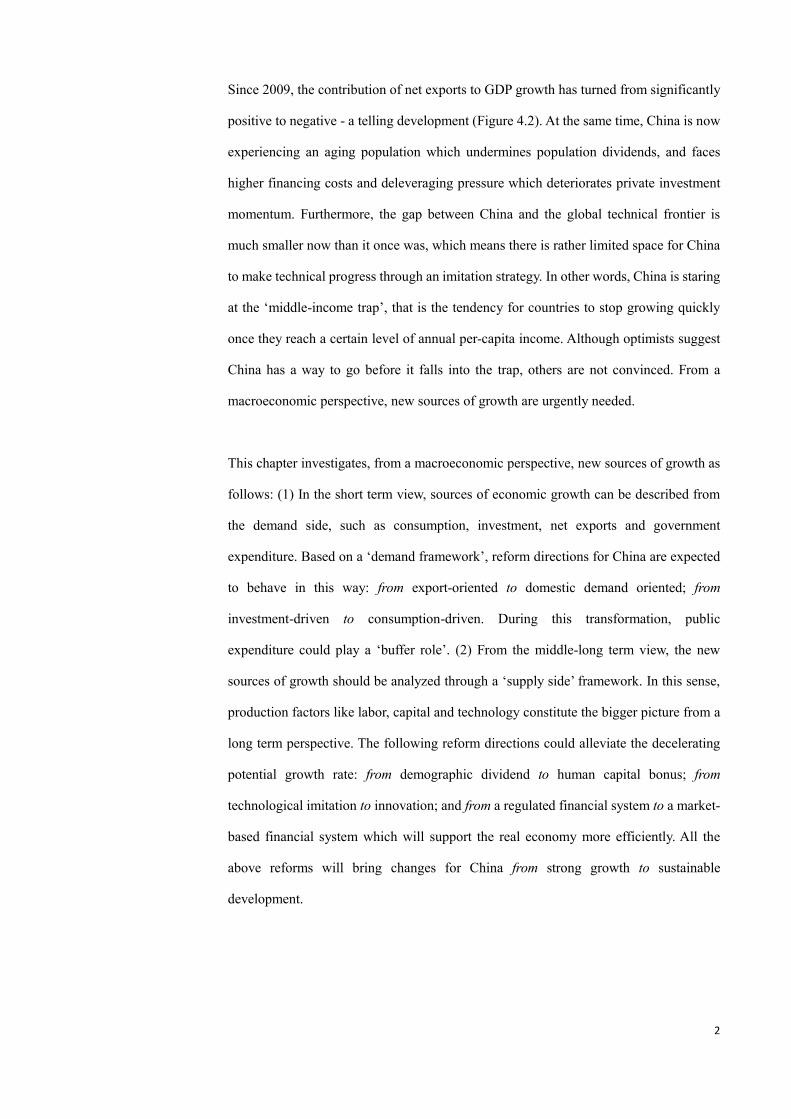
China enjoyed very substantial growth from 2000 until the global financial crisis hit in
2009 (see Figure 4.1). In March 2012, for the first time, the Central Government Work
Report revised down the GDP growth rate target from 8 per cent to 7.5 per cent. Again
in March 2015, the Central Government Work Report revised the growth target to 7 per
cent. China’s economy has entered into the period of ‘New Normal’. The New Normal
is a government narrative about the era of double-digit expansion being over. The
potential for infrastructure investment has contracted, returns on assets have fallen,
export growth is slowing and overcapacity has soared. The old engines of growth,
investment and export, are spluttering. Furthermore, China has consecutively suffered
from the global slowdown that followed the U.S. financial crisis, the debt crisis in Europe,
and then the exit strategies of the Federal Reserve. It is now a factory too big for the
world market.
1 This paper is chapter 4, in “China’s Socialist Rule of Law: Ideology, Deepening Reform
and International Legal Implications”, edited by John Garrick and Yan Chang Bennett,
Routledge (London & New York),2016.
G D P
全球发展展望
Global Development Perspective
中国社会科学院世界经济与政治研究所 经济发展研究中心 国际经济与战略研究中心
Qiyuan Xu
Working Paper No. 16.002
February 22 2016
Page 2
2
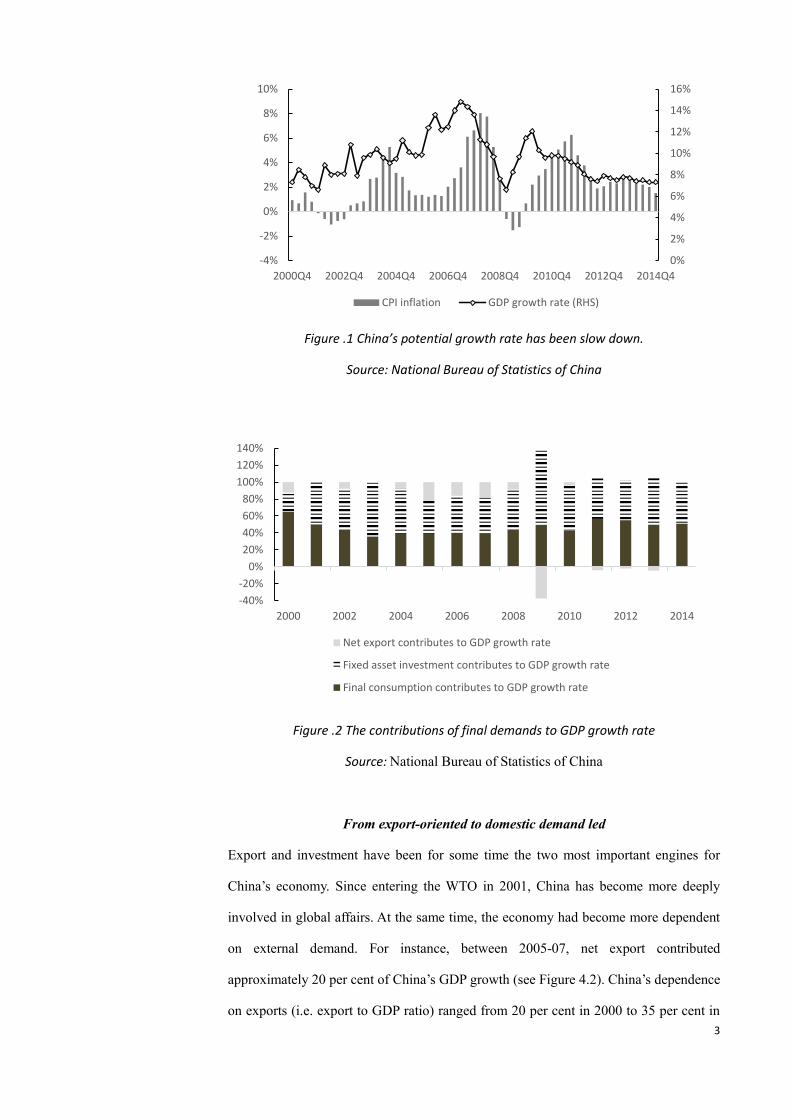
Since 2009, the contribution of net exports to GDP growth has turned from significantly
positive to negative - a telling development (Figure 4.2). At the same time, China is now
experiencing an aging population which undermines population dividends, and faces
higher financing costs and deleveraging pressure which deteriorates private investment
momentum. Furthermore, the gap between China and the global technical frontier is
much smaller now than it once was, which means there is rather limited space for China
to make technical progress through an imitation strategy. In other words, China is staring
at the ‘middle-income trap’, that is the tendency for countries to stop growing quickly
once they reach a certain level of annual per-capita income. Although optimists suggest
China has a way to go before it falls into the trap, others are not convinced. From a
macroeconomic perspective, new sources of growth are urgently needed.
This chapter investigates, from a macroeconomic perspective, new sources of growth as
follows: (1) In the short term view, sources of economic growth can be described from
the demand side, such as consumption, investment, net exports and government
expenditure. Based on a ‘demand framework’, reform directions for China are expected
to behave in this way: from export-oriented to domestic demand oriented; from
investment-driven to consumption-driven. During this transformation, public
expenditure could play a ‘buffer role’. (2) From the middle-long term view, the new
sources of growth should be analyzed through a ‘supply side’ framework. In this sense,
production factors like labor, capital and technology constitute the bigger picture from a
long term perspective. The following reform directions could alleviate the decelerating
potential growth rate: from demographic dividend to human capital bonus; from
technological imitation to innovation; and from a regulated financial system to a market-
based financial system which will support the real economy more efficiently. All the
above reforms will bring changes for China from strong growth to sustainable
development.
Page 3
3
Figure .1 China’s potential growth rate has been slow down.
Source: National Bureau of Statistics of China
Figure .2 The contributions of final demands to GDP growth rate
Source: National Bureau of Statistics of China
From export-oriented to domestic demand led
Export and investment have been for some time the two most important engines for
China’s economy. Since entering the WTO in 2001, China has become more deeply
involved in global affairs. At the same time, the economy had become more dependent
on external demand. For instance, between 2005-07, net export contributed
approximately 20 per cent of China’s GDP growth (see Figure 4.2). China’s dependence
on exports (i.e. export to GDP ratio) ranged from 20 per cent in 2000 to 35 per cent in
0%
2%
4%
6%
8%
10%
12%
14%
16%
-4%
-2%
0%
2%
4%
6%
8%
10%
2000Q4 2002Q4 2004Q4 2006Q4 2008Q4 2010Q4 2012Q4 2014Q4
CPI inflation GDP growth rate (RHS)
-40%
-20%
0%
20%
40%
60%
80%
100%
120%
140%
2000 2002 2004 2006 2008 2010 2012 2014
Net export contributes to GDP growth rate
Fixed asset investment contributes to GDP growth rate
Final consumption contributes to GDP growth rate
Page 4
4
2006 and 2007 in the peak (see Figure 4.3). In 2009, for the first time, China exceeded
the U.S. as the world’s largest exporter. Thereafter, in 2014 China’s GDP has surpassed
the U.S. in terms of purchasing power parity (PPP), becoming the largest in the world.
China’s economy has shifted from a relatively small economy to a very large one within
a short timeframe. It has become a factory that is too big for the world market. What it
implies is that the export-oriented strategy will become less effective over time.
At an earlier `takeoff’ stage, China enjoyed the benefits of the export-oriented strategy.
However, once it became a large economy, external demand seems to have been restricted
by global market limitations and imbalances. Under more restrictive conditions, the
export-oriented strategy has been confronted by diminishing benefits and increasing costs.
Because of its high dependence on exports, China has experienced its own imbalance.
Such a growth model is characterized by high vulnerability to external shocks. Another
serious problem, emphasized by Premier Li Keqiang in 2014, is caused by excessive
foreign exchange reserves accumulated through trade surplus, which is not only a wealth
but also a burden and a risk (Guo 2014). Compared to the service industry, a typical non-
tradable sector, manufacturing is tradable and more capital intensive. As a result, an
economy that is heavily dependent on exports will be more capital intensive and less
labor intensive. Consequently, the income distribution will incline to capital but not labor.
This may result in a widening income gap between capital and labor (Zhang and He 2006).
Along the same lines, pollution and general welfare benefit less from the export-oriented
strategy.
Due to growing labor costs and currency appreciation, China’s export growth rate has
declined since 2008. At the same time, net export to GDP ratio also decreased. After the
financial crisis, the net export contribution to GDP growth has been negative or near zero.
Page 5
5
Figure .3 Export is a key driver to China’s GDP
Source: National Bureau of Statistics of China
Although the IMF (2012) believes the decrease in China’s current account surplus is just
periodic and unsustainable, other economists think it indicates a trend towards current
account balance (Feldstein 2011; Sun and Lu 2012, Zhang 2014). So far, the data in recent
years has proved the latter. With such a trend, export and net export will contribute even
less in the future. Consistent with the trend, the Twelfth Five-year Plan published in 2011
pointed out that China’s growth should change from being ‘export-oriented’ to ‘domestic
demand-oriented’.
Three aspects to boost domestic demand
Until domestic demand replaces external demand, how could China manage to realize
the transformation and keep growth stable? From the demand side, the answer will be
discussed in the next section of the chapter, and includes a solution to boost domestic
consumption. From the supply side, it is interesting to find out why there are so many
producers who prefer to export rather than doing the same business domestically. Xu
(2009) points out three reasons as follows:
First, export rebates. The tax reimbursement for exports can be as high as 17 per
cent. For example, for tire products, the export rebate ratio is 9 per cent which,
although not as high compared to other items, is still fairly important to the
exporter’s profit margin. If producers are to sell the precisely same commodities
15%
20%
25%
30%
35%
40%
0%
1%
2%
3%
4%
5%
6%
7%
8%
9%
10%
2001 2003 2005 2007 2009 2011 2013
Net export to GDP
Export to GDP (RHS)
Page 6
6
in the domestic market, they will lose their export rebates. Although export
rebates should be a ‘neutral’ policy (to avoid duplicate taxation), the authorities
have had a tendency to employ it as a macroeconomic policy tool. For instance,
in 2009, when China’s exports met difficulties, the export rebate ratios for
various commodities were revised up to three times.
Second, higher risk premiums in the domestic credit system. This makes it more
difficult for enterprises to run a domestically-oriented business. With risks in the
credit system, if receivables are not received on time, sometimes this can even
cause default. If the borrower lives in another city, the cost of dispute solution
will be perceived by the creditor as too high. Producers, therefore, are reluctant
to sell commodities in the domestic market, or forced to quote a higher price that
includes the risk premium. In contrast, the international trade credit system is
supported by bank letters of credit, which facilitates quick and safe settlement.
Exporters can enjoy the safer credit system and quick turnover velocity of capital.
Third, high transaction costs in the domestic market. High costs result from local
protectionism, corruption and logistics costs. As to logistics costs, in 2011 it
accounts for just 8.5 per cent of America’s GDPi, compared to 17.8 per cent for
China.ii For railways, the U.S. has a track network of 300,000 km, while for
China in 2014 it is estimated to be 110,000 km. On a per-capita basis, the length
is thus 8.2 cm for the Chinese, shorter than a cigarette! Further differences apply
as the American railway has a major function in logistics; China’s railway plays
a critical role in passenger traffic (see Suo 2014 for details). Suo (ibid) also
claims that the price of road tolls in China is much higher with highway tolls, in
general accounting for up to 20 per cent of total company transportation costs.
Considering the above constraints, international trade has been boosted while the
domestic market has been restricted. To realize the transform to a domestic-demand led
economy, China should make reforms to at least the following: (1) restoring export
Page 7
7
rebates as a neutral policy; (2) constructing a more mature social credit system, and (3)
reducing transaction costs in the domestic market through anticorruption, enhancing the
transparency of the fiscal budget of local government, and breaking local protectionism
through fiscal reforms. In addition there needs to be reform to officials’ evaluation
mechanisms.
From investment-driven to consumption-driven
The twelfth five-year plan declared the strategy to transition from investment-driven to
consumption-driven economic growth. This is expected to feature in the next five-year
plan again. Figure 4.2 shows the final consumption/GDP ratio has been deteriorating
since the financial turmoil in 2008, although the ratio has subsequently improved
moderately. The ratio was 51 per cent in 2014, 14 percentage points lower compared to
the early 2000s. Moreover, government expenditure is included in final consumption.
The challenge of realizing the transformation remains arduous for Beijing. Based on
existing literature, the following reforms should help set priorities:
Improving the social welfare system
The existing literature (Luo 2004) denotes that ‘uncertainty factors’, such as
unemployment risk, uncertainty of medical expenses and educational expenses, have
significant negative effects on China’s household consumption. A sound welfare system
will benefit consumption by reducing such uncertainty. Yet a sound welfare system
demands strong support from fiscal budgets. For a country like China which is still
developing this is not straightforward and longer-term sustainability issues must be faced.
The 18th Party Congress report stressed that China should institute a fully covered, multi-
tiered and sustainable system for basic social security provision - for both the urban and
rural population. On the one hand, it is a popular decision to expand the welfare system
to all households. But on the other hand, this has to be affordable. China can thus draw
on lessons from the recent management of the European debt crisis which had to take
into account the development level of member states including ‘middle income’ countries.
The policies to establish a comprehensive welfare system in China will be active in the
Page 8
8
foreseeable future, but cautious on fiscal sustainability.
Household registration reforms
China’s social inequalities are well documented (Sun and Guo 2012). There is a large
rural-urban disparity influenced by the household registration institution, or ‘Hukou’
system. This separates rural migrant workers in cities from access to the urban welfare
system. That partially explains why rural migrant workers save more of their wages.
Consequently their consumption is restrained. Chen et al. (2010) found that the marginal
consumption rate of migrants is lower than that of urban residents by about 14.6
percentage points. If Hukou restrictions were removed, it is estimated the average
consumption of migrants would rise by approximately 20.8 per cent (ibid.). Chen et al
conclude that the extent to which migrant consumption is constrained by the Hukou
system may account for up to half of the decline in household consumption between
2000-05.
China’s history reveals a trend associated with economic development whereby the
agriculture population (including the population living in rural areas) declines in growth
periods. The Hukou system may help slow down this process. But its negative side-effect
includes a deteriorating household consumption pattern. In terms of political economy,
reforms need to be implemented gradually to take account of the various vested interest
groups. In 2014, the third plenary session of 18th Party Congress specifically referred to
‘advancing urbanization’, emphasizing the need to strictly control the urban population
size in megacities like Beijing, Shanghai and Guangzhou. In spite of this, Hukou reforms
could be expected in most of small and middle sized cities. In 2014, the CPC’s political
bureau of the central committee published the Document on Further Promoting the
Hukou System Reforms. This sets a target of one-hundred million people immigrating to
urban areas who can be registered in the urban Hukou system. Clearly the government is
targeting reform of the Hokou system as one way of boosting domestic consumption.
Page 9
9
Reducing income disparities
Besides uncertainties in expenditure, income disparity also deteriorates the average
propensity to consume. The poor may consume with very limited income, while the rich
stores substantial wealth. Zhu et al. (2002), Li (2003) and Yang (2009) show that income
disparity plays an important role in China’s low consumption share of GDP. For instance,
in 2008 and 2009, the income gini index in China reached 0.49. Then it slowly declined
from its peak. In 2014 it was 0.47, still high above what is generally considered ‘the
danger level’ of 0.4, but heading downwards. Moreover, comparing with the income gini
index, the wealth gini index is even higher, recording 0.73 in 2012 -- the top 1 per cent
of households occupied one third of the national wealth, while the bottom 25 per cent of
households own 1 per cent of the total wealth (Investigation Center of Chinese Social
Sciences, Peking University 2014)! Such income and wealth disparity seriously
undermines consumption and has other serious social and legal consequences well
documented elsewhere in this book.
Corruption and monopolistic practices are two critical causes of income disparities (Wu
2006). The authorities have cracked-down hard on corruption (see Ho in Chapter 7). This
has the potential to reduce some income disparity and promote consumption. But this
requires a long term view. Yue et al. (2013) also found that there is more than a 50 per
cent income gap between monopoly and competitive industries. They argue that this is
unreasonable. If the implicit welfare costs are included, this level of income gap would
likely be even larger. From a macroeconomic perspective it follows that anti-monopoly
and SOE dividend reforms should be expected to make income distribution more
equitable. Whilst some well-connected ‘princelings’ might be unhappy about this,
politically it is very likely to be popular.
Reshaping the industry structure
Figure 4.2 shows that investment has contributed to approximately half, or even more, to
GDP growth for the last decade. Compared to other major economies, this ratio is truly
extraordinary. However, the investment-driven model corresponds to the peculiar
Page 10
10
industry structure in China. For manufacturing for example, the proportion of the
country’s potential economic capacity that is ‘in use’ has declined from around 80 per
cent before 2008, to around 60 per cent in 2012 (The IMF 2012). Whilst there may have
been overcapacity in manufacturing, the service sector has lacked investment and is
therefore in short supply. Finance, education, and healthcare suffer from excessive
regulation and lack of competition. Water and environmental conservation, which are
important public goods, have not been given sufficient attention including investment for
the longer term. All of the above contribute to supply constraints and high prices;
shortages in the supply of services inhibits consumption. Medical treatment, education
and financial services are often difficult to access and expensive - a very hot topic for
many Chinese.
These constraints also contribute to important structural problems in demand. On the one
hand, there is oversupply in the manufacturing industry; on the other hand the service
sector is short of supply, and the consumption of services restrained. Figure 4.4 compares
employment structures in the service sectors of China and the U.S. Compared to the U.S,
China’s employment ratio is lower in education, banking and insurance, scientific
research, polytechnic services and, especially, in water conservancy, environment and
public utility management, health care, social security and social welfare. In order to
make these service industries more competitive and increase their capacity, Chinese
authorities should do well to set them free of excessive regulation, and bolster
transparency. Again, reforms to establish a sound social welfare system are necessary.
Page 11
11
Figure .4 Structure of employment in service sector:
a comparison between China and US.
Source: China's Ministry of Human Resources and Social Security, United States
Department of Labor. Note: The data shown in the figure is the difference between the
employment ratio in an industry in China and US.
The transformation from an investment-driven to a consumption-driven economy is
feasible. In the short term, the high levels of fixed-asset investment (that is, investment
in long-term physical assets such as property) could be redirected towards investment in
services. This would relieve the shock of currently falling investment levels. Given the
supply constraints outlined above, returns on investment could be even higher in services
than they have been in the manufacturing industry and perhaps even property. In the long
run, the development of services is needed to produce enough supply to match domestic
consumer demand. In this model, structural unemployment amongst university graduates
would decrease; their wages would increase; national income distribution could be made
fairer; and consumption in innovative services could be fuelled. The corollary is less
reliance on investment and foreign demand.
From demographic dividend to human capital bonus
From a ‘supply side’ perspective, labor, capital and technical progress are the resources
China < US China = US China >US
Page 12
12
of economic growth. From the view of labor, China has enjoyed a young demographic
structure, ‘population dividends’, over the past three decades. According to Cai (2009),
the decrease of dependency ratio, i.e. the proportion of dependents to people at work,
contributed to 2.3 percentage points, or a quarter to per capita GDP growth rate. But a
turning point in the population dividend occurs in 2015, whereby the dependency ratio
trends unfavorably (Cai 2009). For instance, in 2015 the proportion of the population
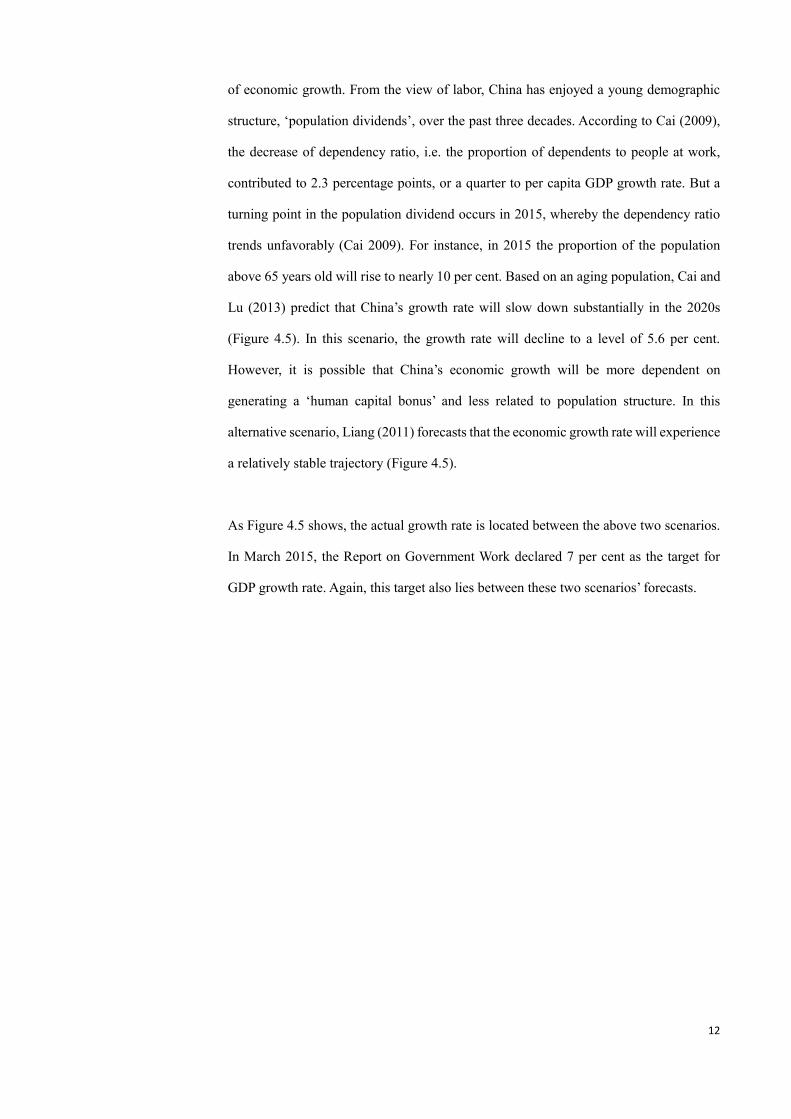
above 65 years old will rise to nearly 10 per cent. Based on an aging population, Cai and
Lu (2013) predict that China’s growth rate will slow down substantially in the 2020s
(Figure 4.5). In this scenario, the growth rate will decline to a level of 5.6 per cent.
However, it is possible that China’s economic growth will be more dependent on
generating a ‘human capital bonus’ and less related to population structure. In this
alternative scenario, Liang (2011) forecasts that the economic growth rate will experience
a relatively stable trajectory (Figure 4.5).
As Figure 4.5 shows, the actual growth rate is located between the above two scenarios.
In March 2015, the Report on Government Work declared 7 per cent as the target for
GDP growth rate. Again, this target also lies between these two scenarios’ forecasts.
Page 13
13
Figure .5 Forecasting of China’s growth rate in 2020s: Two Scenarios
Source: Liang (2011), Cai and Lu (2013). National Bureau of Statistics of China (date)
at: http://data.stats.gov.cn/workspace/index?m=hgnd
The real growth rate is shown to be higher than the demographic dividends scenario but
lower than the human capital bonus scenario. This implies human capital may only be
partly (or not totally) turned into real productivity. If this is correct this indicates
structural problems in China’s labor market. Figure 4.6 shows the coexistence of
unemployment for high-educated labor force and vacancy ratios for the low–educated
labor force. In 2014, unemployment among the tertiary educated labor force (or higher)
is 12 per cent. The vacancy ratio among the secondary educated labor force (or lower) is
18 per cent. To understand why this is so it is essential to examine the services industry.
Employment here represents only 34 per cent of the total workforce, compared with 60
per cent in Malaysia and 81 per cent in the U.S (Figure 4.7). Based on China’s position
on a typical development path, one would expect the service sector to account for about
50 per cent of today’s jobs. The deficit is particularly apparent in healthcare, finance and
education, as shown in Figure 4.4.
At the same time, it is difficult for university graduates to find work, and their salaries
have not risen commensurate to China’s growth over the past twenty years or so. In
contrast, most factories are short of workers with low levels of education, even migrant
workers, and wages for them have increased by more than 10 per cent per annum for
Page 14
14
several years. At this point in time, the development of the service sector will produce
more job opportunities which can then release the human capital bonus, and consequently
enhance potential growth. But the transition remains a challenge as Figure 4.6 shows.
Figure .6 Structural problems in China’s labor market
Calculated by the author. Source: China's Ministry of Human Resources and Social
Security,
Figure .7 China’s employment in service sector is inhibited
Source: World Bank, World Development Indicator Online.
20%
30%
40%
50%
60%
70%
80%
90%
2.5 3 3.5 4 4.5 5
China
US
Log per capita GDP
Em plo
ym ent
rati
o o
f
ser
vice
sect
or
Page 15
15
A liberalized financial system to support the ‘real economy’: the ‘middle way’ to
reform?
In China’s economy, capital is as important as labor. But the role of capital is played out
through various distortions. For instance, the interest rate system is regulated so as to
provide low-cost capital to industries. During the past three decades, the real deposit
interest rate by 2012 had averaged around 0 per cent. In many years it was even negative,
for example, it was -1.1 per cent in 2010. As a result, debtors, or the producers and
government, benefit, while creditors and households suffer loss. Another distortion has
been the renminbi exchange rate regime. For most of the time since 1994, the RMB has
been either hard or soft pegged to the U.S. dollar. Since 2002, however, there have been
disputes about renminbi undervaluation with many researchers believing the exchange
rate undervaluation has contributed to China’s current account imbalance.
The control of China’s capital account makes the above distortions possible due to the
following factors: (1) Because of central controls, depositors could not make asset
allocations in the global market. They have had to choose the domestic market and accept
the very low yield rate. (2) Due to the control, the central bank could keep the exchange
rate stable and maintain independence in monetary policy within the ‘trilemma puzzle’.iii
This puzzle refers to a trade-off amongst the following three goals: a fixed exchange rate,
national independence in monetary policy and capital mobility. The theory is that ‘in
pursuing any two of these goals, a nation must forgo the third’ (Obstfeld, Shambaugh and
Taylor 2005: 423).
These financial repressions of the past three decades have contributed not only to China’s
high growth rate, but also to serious structural problems. For example, the fixed exchange
rate system and the RMB undervaluation fuelled the model of export-driven growth with
over-development in manufacturing and a restrained service sector. The regulated interest
rate system has undermined consumer welfare and encouraged enterprises to operate
inefficiently. Further, capital control separates the domestic financial market from the
global market at a cost of achieving a more effective and integrated financial system. In
Page 16
16
this way, resources have been allocated with distorted capital prices. A consequence is
the sustainability of economic growth is challenged. This reality has reached political
circles with a consensus beginning to emerge that the financial system should be
reformed with a market orientation. But details such as the reach of reform, sequencing
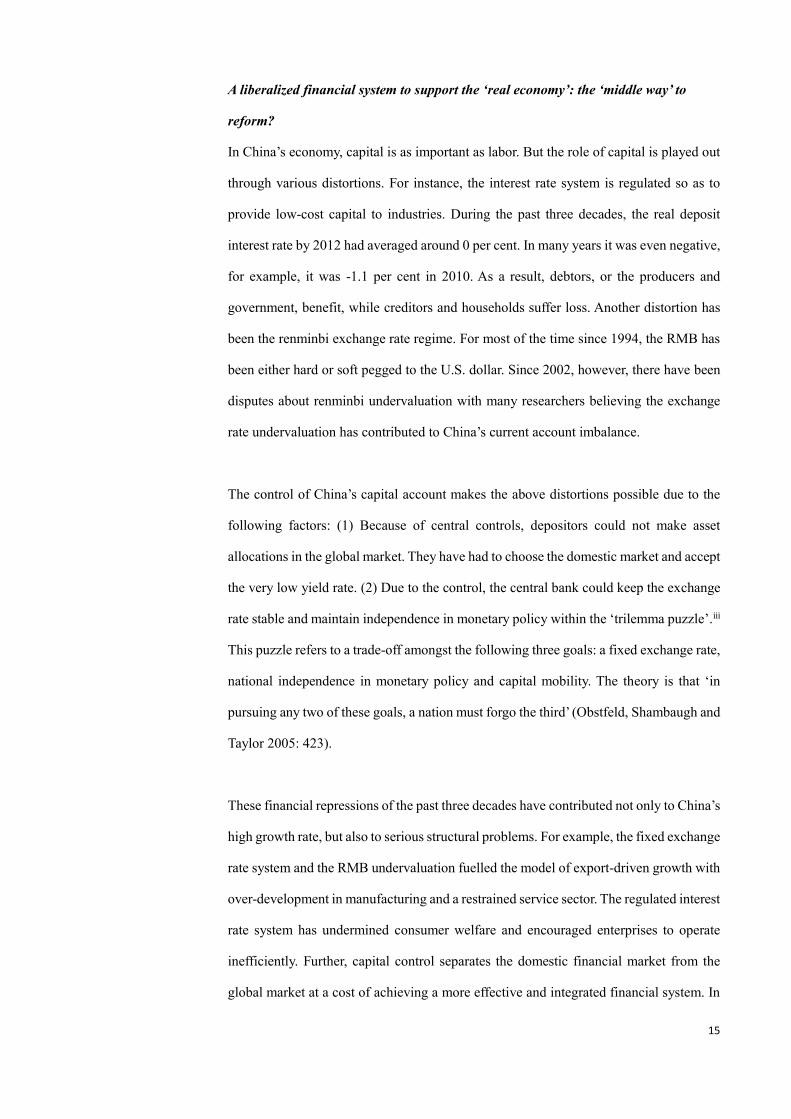
and timing remain controversial. In 2012, a questionnaire was issued to discover how
divergent thinking was in relation to sequencing financial reforms and ownership (Xu
2013). Figure 4.8 reflects the different views within financial institutions in terms of
ownership. The results show that interviewees from state owned enterprises are more
likely to hold a view of ‘traditional sequence’ (65 per cent). From a theoretical
perspective this view insists the proper order of financial reforms should commence with
interest rate liberalization, followed by exchange rate regime reforms, and then capital
account deregulation. This ‘traditional’ view sees any other sequencing as risky,
inappropriate and could cause financial instability. Of those interviewed from foreign-
owned companies, 43 per cent selected ‘traditional sequence’ and 43 per cent selected
‘no sequence’. For Sino-foreign joint companies, 50 per cent of the interviewees
preferred the option of ‘no sequence’, with 45 per cent selecting ‘traditional sequence’.
Whilst one should not draw too many firm conclusions from this type of survey, it does
reveal that SOE financial institutions may tend to support a traditional sequencing of
reform whereas Sino-foreign joint and foreign-owned financial institutions may be more
inclined to support more radical reform. Here it is worth noting that, in general, SOE
institutions are more influential in framing reform plans.
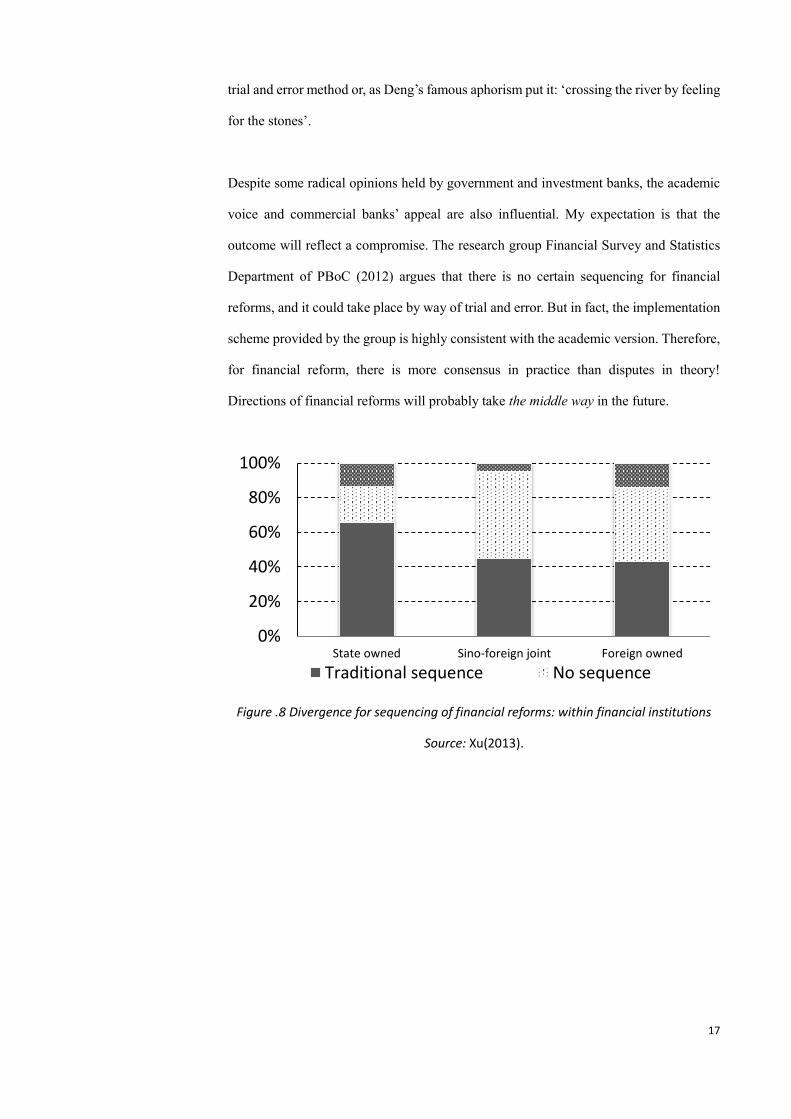
Figure 4.9 shows a subtle variation. Academic institutes stand closer to SOE financial
institutions, and are even more conservative, in that 69 per cent support traditional
sequencing. Most commercial banks are SOEs, and they share similar views to the
academic institutes. On the other hand, more investment banks are totally or partly
foreign-owned. It is not surprising that investment banks’ opinions are similar to Sino-
foreign joint and foreign-owned institutions. What is intriguing, however, is that the
government’s attitude sides with the investment banks. This is best understood from a
political economic perspective, as Chinese politicians have tended to make reforms in
Page 17
17
trial and error method or, as Deng’s famous aphorism put it: ‘crossing the river by feeling
for the stones’.
Despite some radical opinions held by government and investment banks, the academic
voice and commercial banks’ appeal are also influential. My expectation is that the
outcome will reflect a compromise. The research group Financial Survey and Statistics
Department of PBoC (2012) argues that there is no certain sequencing for financial
reforms, and it could take place by way of trial and error. But in fact, the implementation
scheme provided by the group is highly consistent with the academic version. Therefore,
for financial reform, there is more consensus in practice than disputes in theory!
Directions of financial reforms will probably take the middle way in the future.
Figure .8 Divergence for sequencing of financial reforms: within financial institutions
Source: Xu(2013).
0%
20%
40%
60%
80%
100%
State owned Sino-foreign joint Foreign owned
Traditional sequence No sequence
Page 18
18
Figure .9 Divergence for sequencing of financial reforms: among different institutions
Source: Xu(2013).
From technological imitation to innovation
In the future, China’s economic growth is expected to become more dependent on
technological progress. From a macroeconomic perspective, ‘technical progress’ is best
defined broadly and may also include institutional reforms. In terms of technological
progress itself, Chinese economists are being asked ‘what kind of technical progress
could be most helpful for China’s economy’? To answer such a question, we need a strong
theoretical framework. From the main issues arising in this chapter, answers are need to
help solve the following three ‘bottlenecks’: (1) labor market problems due to the aging
population; (2) the dilemma of environmental degradation and resource needs, and (3)
continually upgrading China’s technical level. Already, as Veugelers (2011) points out,
in specific fields like engineering, chemistry and physics, the gap between China the E.U.
and the U.S. is closing fast. For instance, the amount of authorized patents in China
reached 1.2 million in 2013, triple the number in 2000. But so far, technological progress
has evolved by way of imitation. In the past decade, the ratio of inventions in authorized
patents rose from 6.5 per cent in 2000 to 11.7 per cent in 2013. This compares poorly to
Japan’s 88.6 per cent in the same year. Designs and utility models have been dominant,
amounting to 88.3 per cent of China’s patents. In contrast, the ratio of designs and utility
models in Japan’s patents is 11.4 per cent. This structural characteristic reflects the nature
and quality of China’s patents. The problem of poor quality is, in part, a result of China’s
0%
20%
40%
60%
80%
100%
Comercial banks Academicinstitutes
Investment banks Government
Traditional sequence No sequence
Page 19
19
developmental stage. But it is also related to the institutional design of patent law. For
example, if a company is recognized as being ‘hi-tech’, it will enjoy many subsidies and
advantages. According to the ‘Guidance on Recognition of Hi-tech Enterprises’
published by the Ministry of Science and Technology, intellectual property is a weighted
index (30 per cent). In most provinces, the intellectual property index is measured by 1
invention as equaling 6 utility models. However, the cost to apply for 6 utility model
patents is fairly low compared to one invention. Consequently, enterprises are
encouraged to take advantage of this rule to get a ‘hi-tech’ recognition.
Figure .10 The structure of authorized patents: China and Japan
Source: NBS of China and Japan Patent Office(2013).
As the gap between China and the global technical frontier is smaller now than before,
there is a net reduction in the space for China to make technical progress through a
followed and imitation strategy. It is for this reason that ‘independent innovation’ has
been adopted as a national strategy (see Report of 18th Party Congress 2012). In this,
institutional reform is also considered as ‘technical progress’ in broad terms. This also
contributes to improving the productivity of labor and capital. Premier Li Keqiang
underlined ‘reforms dividend’ many times as a new resource for China’s growth. In this
regard, the new leadership has since 2013 started to streamline administration and
delegate power. Shanghai Free Trade Zone (FTZ) and other pilot projects in Tianjin and
Shenzhen have also commenced.
Page 20
20
Conclusion: from strong growth to sustainable development
China now faces multiple challenges in transitioning from economic growth to
sustainable development. This chapter has argued that structural reforms must address
both aggregate demand and supply side issues. With regard to the demand side, two
transformation directions are clear enough: (1) China’s growth is to shift from export-
oriented to domestic demand led, and from being investment-driven to consumption-
driven. To effect this shift, China will need to make reforms to restore export rebates as
a neutral policy, construct a mature social credit system, and reduce transaction costs in
the domestic market. Anti-corruption measures, greater transparency in the fiscal budget
of local government, breaking local protectionism and reforms in officials’ evaluation
mechanisms will undoubtedly help. (2) To boost consumption, the authorities will have
to improve the social welfare system, reform the household registration system, reduce
income disparities and reshape the industry structure, especially deregulation of the
service sector.
With regard to the supply side, sustainable development demands reform in three key
areas: (1) The labor factor - from demographic dividend to human capital bonus. The
analysis in this chapter reveals the supply of human capital is not in a state of over-supply;
rather the problem is related to the need to deregulate the service sector to produce more
job opportunities (and thus release the ‘human capital bonus’). From this perspective, the
following service sectors have the best potential at this stage of China’s development:
education, banking and insurance, scientific research and polytechnic services, and
especially environmental protection, public utility management, health care, social
security and social welfare. (2) The capital factor - financial deregulation to liberalize the
‘real’ economy. This analysis has shown that various views exist as to how reform should
be sequenced. It is most likely that a ‘middle way’ compromise will emerge between
sequential and trial and error methods. The likely outcome in terms of policy will be
‘gradualism’. (3) Technical progress – encourage a transformation from imitation to
innovation. To improve the quality of China’s patents, the call to reform the patent law
grows louder. The future law and policy system is expected to stress innovation. Reform
Page 21
21
itself is a kind of technical progress with a so called ‘reform dividend’. From an ‘outputs’
perspective, this dividend requires a fair distribution in terms of rural and urban provision,
better social welfare redistribution, more public goods like environmental protection, a
just legal system and less corruption generally.
Notes
i Council of Supply Chain Management Professionals (2012) ‘Research Survey Results’,
https://cscmp.org/member-benefits/survey-results.
ii National Bureau of Statistics of China (2013) at: http://www.stats.gov.cn/english
iii Obstfeld, Shambaugh and Taylor (2005: 423) explain that a ‘trilemma’, or ‘impossible
trinity’ as introduced by Robert Mundell and Marcus Fleming in 1962 and 1963, refers to
trade-offs amongst the following three goals: a fixed exchange rate, national independence
in monetary policy and capital mobility. According to the Mundell-Fleming model, a small,
open economy cannot achieve all three of these policy goals at the same time.
References
Cai, Fang (2009) ‘China’s Future Demographic Dividend: Digging New
Source of Economic Growth’, Chinese Journal of Population Science
(Zhongguo Renkou Kexue), 23:1.
Page 22
22
Cai, Fang and Lu, Yang (2013) ‘Population Change and Resulting Slowdown
in Potential GDP Growth in China’, China & World Economy, 21:2.
Chen, Binkai, Lu Min, and Zhong, Ninhua (2010) ‘Household Consumption
Constrained by Hukou System’, Economic Research Journal (Jingji
Yanjiu), 56: S1.
China Communist Party (2010), ‘A Proposal about 12th Five year Plan for
National Economic Development’, Beijing: People's Publishing
House.
Feldstein, Martin (2011) ‘On The End of China's Surplus’, Project Syndicate,
at http://www.project-syndicate.org/commentary/the-end-of-china-s-
surplus.
Guo, Jinchao (2014) ‘Li Keqiang: China’s Huge Foreign Exchange Rate
Reserve is a Ponderous Burden’, Chinanews,
http://finance.ifeng.com/a/20140511/12307297_0.shtml
International Monetary Fund (2012) ‘People’s Republic of China: 2012
Article IV Consultation’, IMF Country Report No. 12/195.
Investigation Center of Chinese Social Sciences, Peking University (2014)
‘Report on Chinese People’s Livelihood Development’, Beijing:
Peking University Publishing House.
Japan Patent Office (2013) ‘The Number of Applications and Registrations in
2013’,
http://www.jpo.go.jp/torikumi_e/hiroba_e/2013syutsugan_kensuu_e.
htm
Li, Jun (2003) ‘A Quantitative Analysis of the Influence from Income Gap to
Consumption’, Journal of Quantitative & Technical Economics
(Shuliang Jingji Jishu Jingji Yanjiu), 20:9.
Li Keqiang (2015) ‘Government Work Report of 2015’, Beijing: People's
Publishing House.
Liang, Run (2011) ‘Human Capital and Economic Growth in China’, Center
for Human Capital and Policy (CHCP), Peking University, Working
paper, Oct.26. http://www.nsd.edu.cn/cn/userfiles/Other/2011-
10/2011102415410256462049.pdf
Luo, Chuliang (2004) ‘Uncertainty During Economic Transition and
Household Consumption Behavior in Urban China’, Economic
Research Journal (Jingji Yanjiu), 50:4.
Obstfeld, Maurice, Shambaugh, Jay C. & Taylor, Alan M. (2005) ‘The
Trilemma in History: Tradeoffs Among Exchange Rates, Monetary
Policies, and Capital Mobility’, The Review of Economics and
Page 23
23
Statistics, MIT Press, Vol. 87(3), 423-438, December.
Research Group of Financial Survey and Statistics Department of PBoC (2012)
‘Conditions are Basically Ready for Accelerating China’s Capital
Account Liberlization’, China Finance (Zhongguo Jinrong), 63:5.
State Council of China (2014) ‘Document on Further Promoting the Hukou
System Reforms’, at http://www.gov.cn/zhengce/content/2014-
07/30/content_8944.htm
Sun, Guofeng and Lu, Dong (2012) ‘Predictive Analysis on Mid-long Term
Trend of Current Account Surplus in China: Based on a Perspective of
Savings-investment Structural Change’, Comparative Studies (Bijiao),
6: 6.
Suo, Husheng (2014) ‘A Comparison of Logistics Cost between China and
America’, Macroeconomic Management (Hongguan Jingji Guanli),
30:1.
Veugelers, Reinhilde (2011) ‘A G2 for Science?’, Bruegel Policy Brief, Issue
2011/03.
Wen Jiabao (2012) ‘Government Work Report of 2012’, Beijing: People's
Publishing House.
Wu, Jinglian (2006) ‘The Crux of Excessive Income Gap’, Finance and
Economy (CAIJING Magazine), 9:21.
Xu, Qiyuan (2013) ‘Consensus and Divergence upon China’s Financial
Reforms: An Analysis Based on Questionnaire’, Research Center for
International Finance, Chinese Academy of Social Sciences, Policy
Brief No. 2013.032.
Xu, Qiyuan (2009) ‘China Should Rethink the International Trade Policy’,
International Economic Review (Guoji Jingji Pinglun), 17:6.
Yang, Tianyu (2009) ‘Income Distribution and Aggregate Consumption in
China’, Peking, China Economic Publishing House.
Yu, Yongding (2009) ‘Avoid the Dollar Trap and China’s Selection’, Finance
and Economy (CAIJING Magazine), 12:8.
Yue, Ximing, Li, Shi and Sicular, Terry (2012) ‘Are the High Salaries of
Employees in Monopoly Industries Justified?’, Social Sciences in
China (Zhongguo Shehui Kexue), 31:3.
Zhang, Bin and He, Fan (2006) ‘The Consequences of Currency Appreciation:
A Theoretical Model Based on Chinese Stylized Facts’, Economic
Research (Jingji Yanjiu), 52:5.
Page 24
24
Zhang, Ming (2014) ‘China’s BOP Tends to be More Balanced’, International
Investment Studies (IIS), Institute of World Economy and Politics,
Chinese Academy of Social Sciences, Quarterly Report No.201402.
Zhu, Guolin, Fan, Jianyong and Yan, Yan (2002) ‘On China’s Consumption
Sag and Income Distribution’, Economic Research Journal (Jingji
Yanjiu), 48:5.
免责声明:
本报告为非成熟稿件,仅供内部讨论。版权为中国社会科学院世界经济与政
治研究所经济发展研究中心、国际经济与战略研究中心所有,未经本中心许
可,任何机构或个人不得以任何形式翻版、复制、上网和刊登,如有违反,
我们保留法律追责权利。
联系邮箱:[email protected]