30
The Council of Economic Advisers February 2018 September 29, 2017 Reforming Biopharmaceutical Pricing at Home and Abroad
The Council of Economic Advisers February 2018 September 29, 2017
Reforming Biopharmaceutical Pricing at Home and Abroad
CEA • Reforming Biopharmaceutical Pricing at Home and Abroad 1
Executive Summary
February 2018
The affordability of healthcare and biopharmaceutical drugs is a top concern for Americans. It is often asserted that promoting innovation and affordable drugs are conflicting goals. New innovations, however, often provide improved health that was not previously available at any price or obviate the need for more costly care. They thereby lower the effective price of health down to the price of the patented drugs, and later down to the price of generic drugs. Federal policies that affect drug pricing should satisfy two goals. First, domestic drug prices paid by Americans should be reduced. Second, the price of better health in the future should also be reduced by spurring medical innovation. This report considers policy options to simultaneously advance these two seemingly conflicting goals.
Reducing drug prices that Americans pay means recognizing that many artificially high prices result from government policies that prevent, rather than foster, healthy price competition. Drug prices, for example, are sometimes artificially high due to government regulations that raise prices. This report discusses changes to the Medicare and Medicaid programs that could help lower domestic prices, as well as reforms to the Food and Drug Administration (FDA) that could encourage more robust price competition.
Preserving incentives for biopharmaceutical innovation can be achieved while still promoting lower prices for Americans. Global financial returns from product development drive innovation. But those returns are unfairly low today. This is because most foreign governments, which are the primary buyers in their respective pharmaceutical markets, force drug manufacturers to comply with pricing rules to gain market access. Through this leverage, foreign governments are able to set drug prices below those that prevail in the United States and erode the returns to innovation manufacturers might otherwise see from selling in their markets. Among members of the Organization for Economic Co-operation and Development (OECD), CEA estimates that Americans pay more than 70 percent of patented biopharmaceutical profits, despite the fact that the United States accounts for only 34 percent of OECD GDP at Purchasing Power Parity (PPP). In short, pharmaceutical innovators—and foreign governments—across the world rely on America’s patients and taxpayers to finance critical research and development.
The objective of government in biopharmaceutical policy is to ensure that the private sector competes and invests in meaningful innovations that lower the price of health, rather than incentivizing market exclusivity and high prices on products. The two goals of reducing American prices and stimulating innovation are consistent, but can be achieved through a combined strategy that corrects government policies that hinder price-competition at home, while at the same time limiting free-riding abroad.

CEA • Reforming Biopharmaceutical Pricing at Home and Abroad 2
1. Introduction
According to recent polling of American adults, lowering prescription drug prices is one of the most important public issues, regardless of party (Figure 1). Americans are understandably concerned about a reduction in affordability, the disparity between U.S. drug prices and prices overseas, and well-publicized episodes of price manipulation.
Figure 1: Politico/Harvard Polling on Americans' Top Priorities for Congress, 2017
(Percent Responding Extremely Important)
Source: Politico/Harvard, Americans' Top Priorities for Congress through the End of CY 2017 Note: Poll of U.S. Adults open Aug 30 to Sept 3, 2017
Concerns about affordability have been magnified by the high price of many newly approved drugs. Table 1 provides a range of annual per-patient costs for treating a condition with some of these high-priced drugs. As an extreme example, the annual cost of drugs that treat genetic diseases can reach almost $800,000 for a single patient (AHIP 2016).
0
10
20
30
40
50
60
Total Democratic Republican Independent
Lower prescription drug prices Raising federal minimum wageReducing budget deficit and federal spending Repealing and replacing ACA

CEA • Reforming Biopharmaceutical Pricing at Home and Abroad 3
Table 1: Summary of Annual Per-Patient Drug Expenditures
Condition Range of Annual Per-Patient Expenditures
Low ($) High ($) Genetic Diseases (including hereditary hypercholesterolemia) 73,431 793,632 Cancer, hematological malignancies 12,897 540,648 Immune System Disorders (including Multiple Sclerosis) 12,586 462,384 Cystic Fibrosis 40,546 368,688 Infectious Diseases 13,440 226,800 Cancer, solid tumors 27,144 220,320 Pulmonary Arterial Hypertension 103,464 196,560 Hereditary Angioedema 14,292 98,040 Cancer, supportive care agents 14,183 41,576 Growth Hormone Deficiency 30,064 38,944 Organ Transplant 15,528 38,765 Ophthalmic Disorders 13,320 29,256
Source: AHIP 2016. “High-Priced Drugs: Estimates of Annual Per-Patient Expenditures for 150 Specialty Medications.”
It is misleading, however, to consider only the prices of these new drugs without evaluating the well-being of patients before the drug became available. It is important to separate the price of healthcare, such as drugs, from the effective price of better health, such as how costly it is to live longer. Innovations such as new drugs often reduce the price of health even when the new drug is very expensive relative to other goods. Consider the example of a patient diagnosed with HIV in the early 1990s. Before new breakthrough therapies for HIV emerged, the price of a longer life was prohibitively high because a longer life could not be bought at any price anywhere in the world. Once new HIV drugs were developed and marketed in 1996, the price of a longer and healthier life for HIV-positive individuals decreased dramatically: it reached the equivalent of the price of the new, patented drugs. Generally, the price of better health falls further as competing drugs enter the market, then fall even further to competitive price levels upon patent expiration when cheaper generics become available. The example of innovative HIV drugs makes the essential point that even though the price of the drug was considerable and drug spending rose, the effective price of better health declined.
Preserving incentives to innovate will ensure that the effective price of health can continue to decrease over time. This is important to high- and low-income populations, as they all will use generic or biosimilar versions of today’s high priced drugs in the future1. Indeed, the vast majority of the World Health Organization’s (WHO) Essential Drugs today are off-patent.
1 For biologics, no generics exist. FDA has the authority to approve follow-on biologics that are “interchangeable,” but it has not yet used this authority partly because of the difficulty of ascertaining sameness in complicated, very large protein molecules.
CEA • Reforming Biopharmaceutical Pricing at Home and Abroad 4
The U.S. government and biopharmaceutical industry have been the central engines in lowering the price of better health for patients worldwide by being both the world leaders in biopharmaceutical innovation as well as the source of innovative returns to those investing in such innovations. The U.S. market makes up 46 percent of OECD sales of brand name innovative drugs, funds about 44 percent of world medical R&D, invests 75 percent of global medical venture capital, and holds the intellectual property rights for most new medicines (BMI 2017; Moses et al. 2015; TEC 2017). Furthermore, publicly funded medical research in the United States has produced two-thirds of the top-cited medical articles in 2009, underlying the university research that often leads to medical breakthroughs (Moses et al. 2015).
U.S. patients and taxpayers alike have mainly financed the returns on R&D investments to innovators. Unlike other developed countries with single payer systems, which nearly all impose some sort of price controls on pharmaceuticals, the U.S. drug market is less financed by the public sector and more open to private market forces. In a free market, prices of products reflect their value as opposed to prices in government-controlled markets, which reflect political tradeoffs. CEA estimates that because of the American market system, more than 70 percent of OECD patented pharmaceutical profits come from sales to U.S. patients even though the United States only represents 34 percent of OECD GDP at Purchasing Power Parity (OECD 2016). Thus, innovators across the world rely heavily on Americans paying market prices to underwrite the returns on investments into products that improve their health because governments abroad use their monopsony power to set prices below market-levels.
The United States both conducts and finances much of the biopharmaceutical innovation that the world depends on, allowing foreign governments to enjoy bargain prices for such innovations. This indicates that our current policies are neither wise nor just. Simply put, other nations are free-riding, or taking unfair advantage of the United States’ progress in this area. In addition, prices paid by Americans for many drugs are too high, particularly so when paid for in government programs. This is the result of poorly designed reimbursement policies and regulations that inhibit price competition, and it is therefore a poor use of taxpayer money.
In light of these problems, reforms to U.S. biopharmaceutical policy may consider two simultaneous goals. First, American drug prices today should be reduced. Second, the price of health in the future should be reduced by lowering the costs and increasing the rewards of innovation.
CEA • Reforming Biopharmaceutical Pricing at Home and Abroad 5
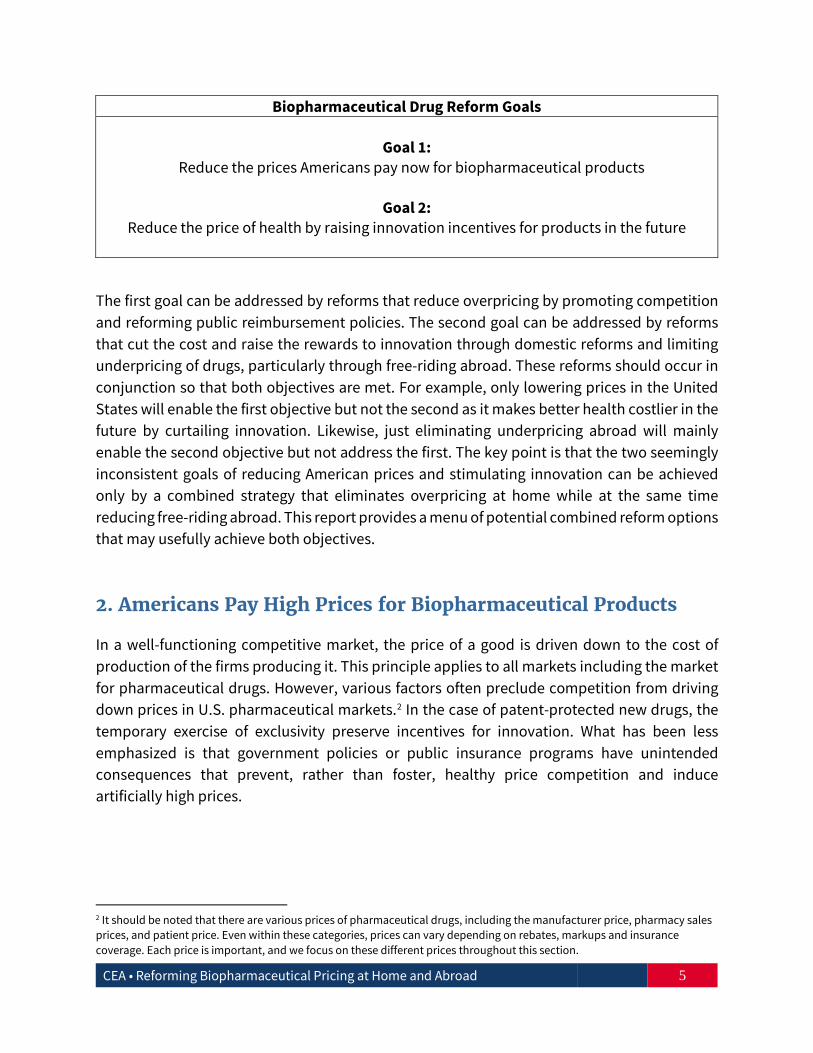
Biopharmaceutical Drug Reform Goals
Goal 1: Reduce the prices Americans pay now for biopharmaceutical products
Goal 2:
Reduce the price of health by raising innovation incentives for products in the future
The first goal can be addressed by reforms that reduce overpricing by promoting competition and reforming public reimbursement policies. The second goal can be addressed by reforms that cut the cost and raise the rewards to innovation through domestic reforms and limiting underpricing of drugs, particularly through free-riding abroad. These reforms should occur in conjunction so that both objectives are met. For example, only lowering prices in the United States will enable the first objective but not the second as it makes better health costlier in the future by curtailing innovation. Likewise, just eliminating underpricing abroad will mainly enable the second objective but not address the first. The key point is that the two seemingly inconsistent goals of reducing American prices and stimulating innovation can be achieved only by a combined strategy that eliminates overpricing at home while at the same time reducing free-riding abroad. This report provides a menu of potential combined reform options that may usefully achieve both objectives.
2. Americans Pay High Prices for Biopharmaceutical Products
In a well-functioning competitive market, the price of a good is driven down to the cost of production of the firms producing it. This principle applies to all markets including the market for pharmaceutical drugs. However, various factors often preclude competition from driving down prices in U.S. pharmaceutical markets.2 In the case of patent-protected new drugs, the temporary exercise of exclusivity preserve incentives for innovation. What has been less emphasized is that government policies or public insurance programs have unintended consequences that prevent, rather than foster, healthy price competition and induce artificially high prices.
2 It should be noted that there are various prices of pharmaceutical drugs, including the manufacturer price, pharmacy sales prices, and patient price. Even within these categories, prices can vary depending on rebates, markups and insurance coverage. Each price is important, and we focus on these different prices throughout this section.

CEA • Reforming Biopharmaceutical Pricing at Home and Abroad 6
2.1 Reduce High Prices Induced by Medicare and Medicaid Reimbursement Policy
To promote patient welfare, government policy should induce price competition. In the two primary U.S. insurance programs, Medicaid and Medicare, current policies dampen price competition, thereby artificially raising prices.
Medicaid
Manufacturers that choose to enter the Medicaid Drug Rebate Program are required to offer state Medicaid programs their prescription medications at a price that either includes a minimum rebate of 23.1 percent of the average manufacturer price (AMP – the average price paid to manufacturers by wholesalers and retail pharmacies that buy direct net of prompt pay discounts) for brand drugs or, if lower, the “best price” the manufacturers offer to any other purchaser (“Medicaid Drug Rebate Program”). In exchange for these discounted rates, states are then required to cover the manufacturer's drugs in their Medicaid programs. In fiscal year 2014, Medicaid programs spent $42 billion on prescription drugs and collected about $20 billion back in rebates so that net expenditures equaled about $22 billion (Baghdadi et al. 2017). The practice of mimicking public relative prices to private relative prices is partly beneficial because it allows the private market rather than bureaucrats to determine relative prices based on patient value.
While this basic approach of using market prices is sound, as currently implemented, the Medicaid Best Price program can create artificially high prices in the private sector under certain conditions. If a large share of a given drug’s market is enrolled in Medicaid (e.g., for HIV or mental health drugs), a pharmaceutical firm has an incentive to inflate prices in the private sector so that it can collect higher post-rebate prices from its large Medicaid customer base. Similarly, the mandated price discrimination implicit in this program prevents price discounts to lower-income patients in the private sector. Lower-income, private patient populations cannot be charged low prices as that jeopardizes the Medicaid price. Reforms could help prevent the inflated private sector prices the program induces while at the same time allowing the government to use pricing information from the private sector to determine value.
While CMS rules require that best prices be determined on a unit basis, Medicaid statutes do not (42 C.F.R. 477.506(e)(2)) (Sachs et al. 2017). CMS could revise rules to specify how manufacturers calculate best prices determined after the sale and the patient’s recovery. This may encourage competition and lower prices. It would also incentivize better adherence regimens and lower the risk to the government that it pays money for something that turns out to be less effective than expected. CMS could also provide more guidance on how value-based contracts and price reporting would affect other price regulations. This would encourage drug purchasers to negotiate, thus increasing competition and lowering prices.
CEA • Reforming Biopharmaceutical Pricing at Home and Abroad 7
Medicare
Medicare Part B Physician Administered Drugs
Medicare Part B drugs are those administered by physicians in their outpatient clinics to Medicare recipients. From 2006 through 2013, twenty-eight percent of this spending was for newly approved drugs that were concentrated among a small number of conditions, such as cancer, blood diseases, and ophthalmology (GAO 2015). According to the GAO, over time, expensive specialty drugs and biologics approved through expedited pathways have come to represent a higher proportion of newly approved drugs that are administered by physicians.
In the Medicare Part B program, through which many specialty drugs are reimbursed, drugs administered in physicians’ offices and hospital outpatient departments are reimbursed based on a 6 percent markup (now 4.3 percent due to the sequester) above the Average Sales Price (ASP), that manufacturers receive net of any price discounts. For example, with a 6 percent markup above ASP the doctor receives $600 for administering a $10,000 drug and $60 for a $1,000 drug. As is true in any cost-plus reimbursement environment, this leads to a lack of incentive to control costs and instead an incentive to raise costs. The current policy mutes the incentives for doctors to prescribe cheaper drugs and therefore for manufacturers to engage in price competition. While there may be larger costs to providers for prescribing more expensive drugs, such as storing expensive drugs and the lower probability of collecting reimbursement or copays, these costs are routinely handled in other healthcare markets without resorting to distorted cost-plus reimbursements. While some private payers have responded to this type of perverse incentive problem through alternative reimbursement procedures for drugs delivered in clinics, similar reforms have not been made for the Medicare Part B program.
The Medicare Payment Advisory Commission (MedPAC), the Government Accountability Office (GAO), the Department of Health and Human Services (HHS) Office of the Inspector General (OIG), and others have all proposed solutions for how Medicare could remove perverse incentives for prescribing higher-priced drugs and instead provide an incentive for doctors to prescribe cheaper drugs, putting competitive pressure on manufacturers to reduce their prices. Options for reform include:
i. Introducing physician reimbursement that is not tied to drug prices, ii. Moving Medicare Part B drug coverage into Medicare Part D, where price-competition
over drug prices is better structured, and iii. Changing how pricing data is reported to increase transparency.
By moving Part B coverage into Part D, the 71 percent of Medicare beneficiaries who participate in Part D would receive prescriptions that they would fill and their physicians would administer, thereby removing any economic incentive from prescribing decisions. There are additional
CEA • Reforming Biopharmaceutical Pricing at Home and Abroad 8
reforms to consider that increase price transparency and reduce incentives for more spending. First, require better and more accurate sales data from drugs that are older than six months since launch. This is important because drug makers have an incentive to exclude discount prices from the sales price they report, since the higher the average sales price, the more they are paid. Second, for new drugs that do not have much sales data, cut the doctor’s payment. This removes the incentive of prescribing a high-priced drug when physicians write prescriptions, and elevates clinical competition as a decision-making factor.
Medicare Part D Outpatient Drugs
Medicare Part D reimburses outpatient drugs, and the program has several provisions that artificially raise costs for patients. The Social Security Act requires Medicare Part D plan formularies to include drugs within each category and class of covered drugs. CMS has previously interpreted the Social Security Act’s requirement to include drugs within each therapeutic category and class to mean the inclusion of at least two non-therapeutically equivalent drugs. This requirement eliminates the ability of Part D sponsors to negotiate for lower prices when there are only two drugs on the market since drug manufacturers know that CMS must cover both. The two-drug requirement leads to more spending.
Another problem resulting from Medicare Part D is the overpricing of low value drugs. The Social Security Act §1860D-14A stipulates cost-sharing amounts for low-income subsidy enrollees that vary by income and are adjusted by projected program cost growth. The use of formulary tier-based cost-sharing is prohibited, which eliminates the ability of sponsor plans to price and discount drugs according to value for patients. Low-income subsidy enrollees and sponsor plans should have incentives to use high value drugs. The Medicare Payment Advisory Commission (MedPAC 2016) has highlighted this problem by reporting that 17.3 percent of low-income subsidy enrollees are high-cost compared to just 2.8 percent of other enrollees.
The Medicare Part D Coverage Gap Discount Program requires drug manufacturers to provide a 50 percent discount to enrollees while in the coverage gap. The 50 percent discount is then counted toward the calculation of an enrollee’s true out-of-pocket cost, accelerating them through the coverage gap into the catastrophic phase of benefit where Medicare pays 80 percent of all drug costs and the sponsor and enrollee are responsible for the remaining 15 and 5 percent, respectively. With such discounts, enrollees may have an incentive to use brand drugs and reference biologics when less expensive generics and biosimilars are available, since the large discounted payment counts toward the true out-of-pocket cost. The overall Part D benefit structure creates perverse incentives for plan sponsors and pharmacy benefit managers (PBMs) to generate formularies that favor high-price, high-rebate drugs that speeds patients through the early phases of the benefit structure where plans are most liable for costs.
The Medicare Part D program has unintended consequences that have resulted in higher drug prices for consumers. MedPAC and OIG, among others, have each produced various policy
CEA • Reforming Biopharmaceutical Pricing at Home and Abroad 9
options to address these misaligned incentives within the program. Solutions to overcome these problems could include:
i. Requiring plans to share drug manufacturer discounts with patients.; ii. Allowing plans to manage formularies to negotiate better prices for patients;
iii. Lowering co-pays for generic drugs for patients; and iv. Discouraging plan formulary design that speeds patients to the catastrophic coverage
phase of benefit and increases overall spending.
2.2 Cut the Duration of High Prices Induced by Price Manipulation
Prices for new and therapeutically advantageous drugs may often be higher than for existing, less effective drugs, particularly for innovative drugs that treat severe diseases with price-insensitive demand. Having exclusive rights to sell a new and therapeutically advantageous drug allows the supplier to set pricing sufficient to recoup considerable investments in innovation. But potentially higher pricing is not confined to branded, patent protected drugs.
Several recent episodes have illustrated the ability of firms to legally take advantage of their position as the sole source for old but important drugs by rapidly increasing prices.
Unlike most markets where new products can enter easily to cut prices, in the biopharmaceuticals market, the Food and Drug Administration (FDA) acts as a strict government gatekeeper for new pharmaceutical products. The evidence is clear that generic drug competition rapidly drives down the cost of drugs. After the 1984 Hatch-Waxman Act went into effect, researchers found that market entry of generic manufacturers resulted in generic prices falling to between 17 and 25 percent of the pre-expiry patented price within 24 months (Caves et al. 1991; Grabowski and Vernon 1992). A more recent paper by Berndt and Aitken (2011) estimates that U.S. generic prices fell to 6 percent of patented prices after 24 months of generic entry. Olson and Wendling (2013) account for endogenous entry of new generic competitors and find even larger decreases in drug prices after two and three competitors enter the market.
A valuable policy option might be changing the criteria for expedited review to include new molecular entities that are second or third in a class, or second or third for a given indication for which there are no generics. This would serve as a new pro-competition pathway that would enhance therapeutic price-competition by providing expedited entry into monopoly markets. To avoid imposing policies retroactively on the industry, this policy change could be phased in slowly so that current drug manufacturers of single-source drugs would retain the value of their efforts to be the first in a given therapeutic space.
In later sections we discuss FDA reforms that may enhance faster drug price competition. The FDA Reauthorization Act of 2017 (FDARA) currently authorizes the FDA to designate a drug as a “competitive generic therapy” upon request by an applicant when there is “inadequate generic
CEA • Reforming Biopharmaceutical Pricing at Home and Abroad 10
competition” i.e., when there is no more than one approved abbreviated new drug application (ANDA) for the patented reference product (not including discontinued products).3 This designation allows for improved communication with and advice from the FDA and a 180-day exclusivity period with no additional ANDA approvals available for other applicants.
2.3 Enhance Price Competition in the Pharmacy Benefit Manager Market
Pricing in the pharmaceutical drug market suffers from high market concentration in the pharmaceutical distribution system and a lack of transparency. Pharmacy benefit managers (PBMs) act as buying intermediaries between drug manufacturers and health insurance plans and their beneficiaries. They negotiate rebates off manufacturers’ list prices and then pass on some of the benefit to health insurance plans and beneficiaries. However, the PBM market is highly concentrated. Three PBMs account for 85 percent of the market, which allows them to exercise undue market power against manufacturers and against the health plans and beneficiaries they are supposed to be representing, thus generating outsized profits for themselves (Sood et al. 2017). Over 20 percent of spending on prescription drugs was taken in as profit by the pharmaceutical distribution system (Sood et al. 2017). The size of manufacturer rebates and the percentage of the rebate passed on to health plans and patients are secret. The system encourages manufacturers to set artificially high list prices, which are reduced via manufacturers’ rebates but leave uninsured individuals facing high drug prices (Sood et al. 2017). Policies to decrease concentration in the PBM market and other segments of the supply chain (i.e., wholesalers and pharmacies) can increase competition and further reduce the price of drugs paid by consumers (Sood et al. 2017).
3. Raising Innovation Incentives Reduces the Price of Better Health in the Future
It is important to continue cutting the price of health by encouraging innovation. That could be accomplished by increasing the reward to innovation by limiting underpricing in foreign countries and at home, and by decreasing the cost of R&D through FDA policy.
3.1 Limiting Under-Pricing of Drugs in Foreign Countries
Worldwide profits drive innovation incentives, but when worldwide profits are partially determined by centralized pricing of governments, this induces unique free-riding issues (Egan and Philipson 2013). While drug prices in the United States are less publicly financed than in other countries, government procedures and price controls set prices in most foreign countries. It is in each country’s interest to have other countries provide the returns to fund
3 ANDA’s or generic drug applications generally do not have to include preclinical and clinical data to become approved. A generic drug is one that is comparable to a novel drug product in intended use and effectiveness.
CEA • Reforming Biopharmaceutical Pricing at Home and Abroad 11
innovation by generous reimbursement. Smaller markets that do not significantly affect world returns have an incentive to set low prices without a discernible impact on the flow of new products their citizens enjoy. The problem is that in aggregate, these free-riding actions of many small countries have a substantial negative impact on worldwide profits. Put simply, providing innovative returns is a global public goods problem that leads to classic under-provision through government free-riding. Government payers from larger economies such as the United States face less of an incentive to free-ride as they make up a larger share of world returns and therefore enjoy less innovation from free-riding.
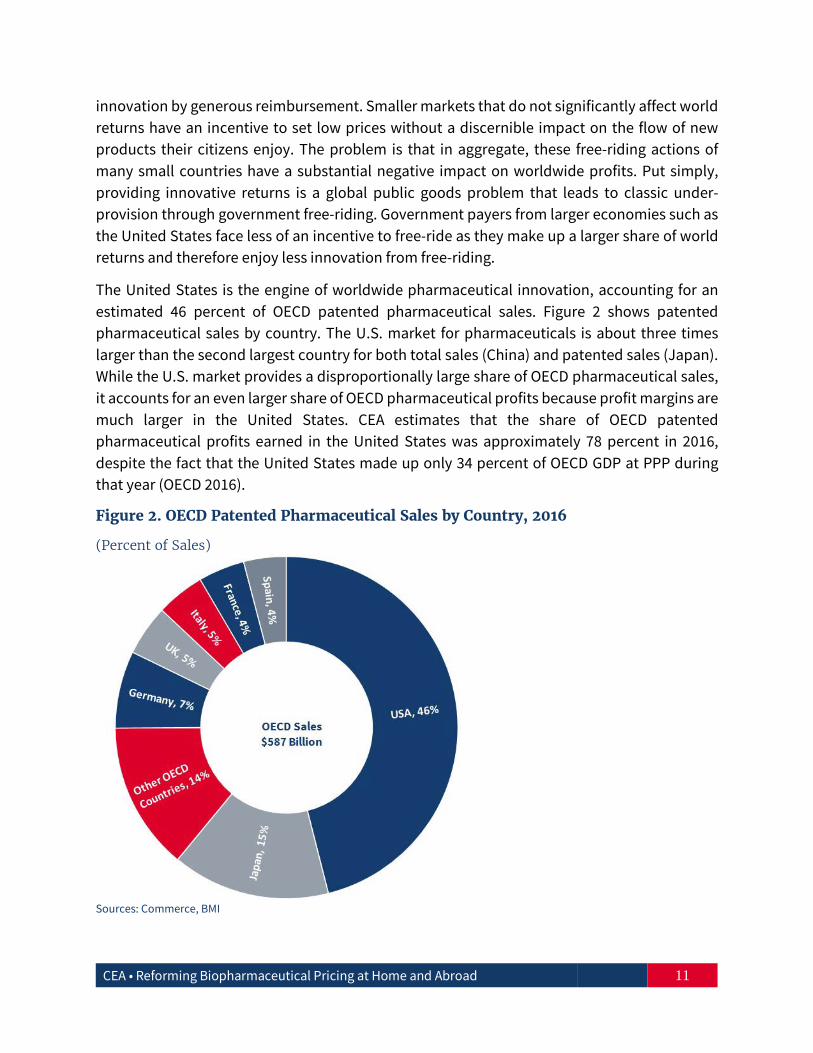
The United States is the engine of worldwide pharmaceutical innovation, accounting for an estimated 46 percent of OECD patented pharmaceutical sales. Figure 2 shows patented pharmaceutical sales by country. The U.S. market for pharmaceuticals is about three times larger than the second largest country for both total sales (China) and patented sales (Japan). While the U.S. market provides a disproportionally large share of OECD pharmaceutical sales, it accounts for an even larger share of OECD pharmaceutical profits because profit margins are much larger in the United States. CEA estimates that the share of OECD patented pharmaceutical profits earned in the United States was approximately 78 percent in 2016, despite the fact that the United States made up only 34 percent of OECD GDP at PPP during that year (OECD 2016).
Figure 2. OECD Patented Pharmaceutical Sales by Country, 2016
(Percent of Sales)
Sources: Commerce, BMI
CEA • Reforming Biopharmaceutical Pricing at Home and Abroad 12
One method of estimating profit margin is to observe the decline in prices among patented drugs when patents expire and generic manufacturers compete prices down to the marginal cost of production (Caves et al. 1991; Grabowski and Vernon 1992; Berndt and Aitken 2011). Prices declined by an average of 84 percent across three studies implementing this method, implying that marginal costs were 16 percent of the patent-protected price. Using data from Danzon and Furukawa (2011), CEA estimates that foreign variable profit margins are 20 percent among patented drugs (see Appendix).
The U.S. Department of Commerce estimates that U.S. patented pharmaceutical sales totaled $270 billion in 2016, with sales in the rest of the OECD totaling $316 billion. To estimate the U.S. share of OECD profits, we assume that economic profits are zero (i.e., that accounting profits equal a normal rate of return in the economy) for generic drugs since patent expiration of brand name drugs allows for competition that drives price to marginal cost.4 Thus, profits in a given country are equal to the sales of patented drugs multiplied by the profit margin for patented drugs. Dividing U.S. profits by foreign OECD and U.S. profits produces the U.S. profit share.
𝑈𝑈𝑈𝑈 𝑃𝑃𝑃𝑃𝑃𝑃𝑃𝑃𝑃𝑃𝑃𝑃 𝑈𝑈ℎ𝑎𝑎𝑃𝑃𝑎𝑎 = 𝑀𝑀𝑎𝑎𝑃𝑃𝑀𝑀𝑃𝑃𝑀𝑀𝑈𝑈𝑈𝑈 ∗ 𝑈𝑈𝑎𝑎𝑆𝑆𝑎𝑎𝑆𝑆𝑈𝑈𝑈𝑈
𝑀𝑀𝑎𝑎𝑃𝑃𝑀𝑀𝑃𝑃𝑀𝑀𝐹𝐹𝐹𝐹𝐹𝐹𝐹𝐹𝐹𝐹𝐹𝐹𝐹𝐹 ∗ 𝑈𝑈𝑎𝑎𝑆𝑆𝑎𝑎𝑆𝑆𝐹𝐹𝐹𝐹𝐹𝐹𝐹𝐹𝐹𝐹𝐹𝐹𝐹𝐹 + 𝑀𝑀𝑎𝑎𝑃𝑃𝑀𝑀𝑃𝑃𝑀𝑀𝑈𝑈𝑈𝑈 ∗ 𝑈𝑈𝑎𝑎𝑆𝑆𝑎𝑎𝑆𝑆𝑈𝑈𝑈𝑈 =
84% ∗ $270𝑏𝑏20% ∗ $316𝑏𝑏 + 84% ∗ $270𝑏𝑏 = 78%
Vernon (2003) derives profit margins for patented pharmaceuticals using another method with novel firm-level data that reflects margins of the world’s top 20 firms for products sold in the United States and the rest of world. The drugs sold in the United States had pre-tax, operating profit margins that were, on average, four times those of the more regulated markets of France, Italy, Germany, Japan, and the United Kingdom. When this alternative profit margin ratio is applied to the formula above, we estimate that the United States has a 77 percent share of OECD profits. This alternatively estimated ratio of U.S. to foreign profits of patented pharmaceuticals confirms the primary estimate. In addition, Goldman and Lakdawalla (2018) report, using a different methodology, a mid-range of 71 percent of world profits, as opposed to OECD profits. The fact that this world share estimate is only modestly smaller than the OECD share estimate estimated by CEA may potentially be due to the fact that OECD countries make up almost all world profits. Taken together, these studies all suggest a conservative profit share in the United States among OECD countries above 70 percent.
4 While accounting profit (the difference between revenue and explicit costs) is positive in competitive industries, economic profit is zero. That is because economic profit includes the opportunity cost of investment on top of explicit costs. Since this analysis examines variable profit, we consider economic profit because we are concerned what the companies will do with the next dollar. Companies will enter a competitive market until economic profit goes to zero (at marginal cost of production).
CEA • Reforming Biopharmaceutical Pricing at Home and Abroad 13
While U.S. consumers and taxpayers finance over 70 percent of estimated OECD profits on patented biopharmaceuticals during a single year, this does not account for the fact that these drugs are often sold in the United States before other markets. Drug manufacturers usually pursue market access in the United States before other markets due to the higher prices in the United States. Danzon, Wang, and Wang (2005) find evidence that the United States gains access to drugs sooner and has earlier drug launches compared to other developed countries. For example, the United States had several times more drug launches than Japan in the 1990s, and those launches that occurred in the United States occurred on average 19 months earlier.
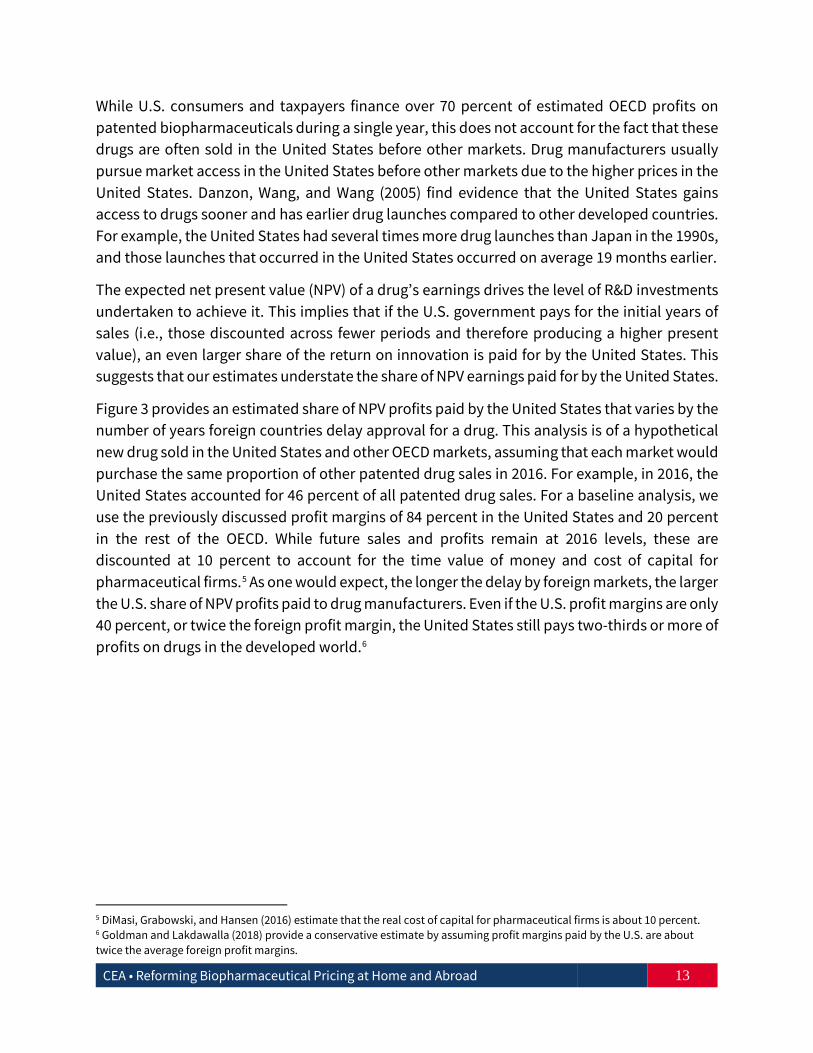
The expected net present value (NPV) of a drug’s earnings drives the level of R&D investments undertaken to achieve it. This implies that if the U.S. government pays for the initial years of sales (i.e., those discounted across fewer periods and therefore producing a higher present value), an even larger share of the return on innovation is paid for by the United States. This suggests that our estimates understate the share of NPV earnings paid for by the United States.
Figure 3 provides an estimated share of NPV profits paid by the United States that varies by the number of years foreign countries delay approval for a drug. This analysis is of a hypothetical new drug sold in the United States and other OECD markets, assuming that each market would purchase the same proportion of other patented drug sales in 2016. For example, in 2016, the United States accounted for 46 percent of all patented drug sales. For a baseline analysis, we use the previously discussed profit margins of 84 percent in the United States and 20 percent in the rest of the OECD. While future sales and profits remain at 2016 levels, these are discounted at 10 percent to account for the time value of money and cost of capital for pharmaceutical firms.5 As one would expect, the longer the delay by foreign markets, the larger the U.S. share of NPV profits paid to drug manufacturers. Even if the U.S. profit margins are only 40 percent, or twice the foreign profit margin, the United States still pays two-thirds or more of profits on drugs in the developed world.6
5 DiMasi, Grabowski, and Hansen (2016) estimate that the real cost of capital for pharmaceutical firms is about 10 percent. 6 Goldman and Lakdawalla (2018) provide a conservative estimate by assuming profit margins paid by the U.S. are about twice the average foreign profit margins.
CEA • Reforming Biopharmaceutical Pricing at Home and Abroad 14
Figure 3. Hypothetical Net Present Value of U.S. Share of OECD Patented Pharmaceutical Profits
(Percent of OECD Profits)
Source: CEA calculations. Note: Assumes 20 percent profit margin in foreign OECD markets.
Since smaller OECD countries do not face a tradeoff between prices and innovation given that innovation is not substantially affected by their pricing, most OECD nations employ price controls in an attempt to constrain the cost of novel biopharmaceutical products, e.g. through cost-effectiveness or reference pricing policies. In essence, in price negotiations with manufacturers, foreign governments with centralized pricing exploit the fact that once a drug is already produced, the firm is always better off selling at a price above the marginal cost of production and making a profit, regardless of how small, than not selling at all. Thus, the foreign government can insist on a price that covers the marginal production cost—but not the far greater sunk costs from years of research and development—and firms will continue to sell to that country.
Meaningful reforms could address the free-riding that takes unfair advantage of American innovation, whether through enhanced trade policy or policies that tie public reimbursements in the United States to prices paid by foreign governments that free-ride or other methods. Meaningful reforms would address the root of the problem: foreign, developed nations, that can afford to pay for novel drugs, free-ride by setting drug prices at unfairly low levels, leaving American patients to pay for the innovation that foreign patients enjoy. Since these nations benefit from the innovations regardless of the costs to Americans, they currently have no reason to raise their own prices and exploit the fact that novel drugs are already invented. If the United States had adopted the centralized drug pricing policy in other developed nations twenty years ago, then the world may not have highly valuable treatments for diseases that
CEA • Reforming Biopharmaceutical Pricing at Home and Abroad 15
required significant investment. The United States could take actions that change the incentives for these countries to price drugs at levels that appropriately reward innovation, rather than disproportionately putting that burden on American patients and taxpayers. As in other cases of under-provision of public goods, increased provision towards the public good would be desirable from free-riding parties.
3.2 Limiting Under-Pricing Domestically
Reducing arbitrary underpricing domestically could help to realign incentives for pharmaceutical firms to innovate. The Medicaid Drug Rebate Program, discussed above, had the unintended consequence of far fewer voluntary discounts from drug manufacturers to certain safety net health providers since the discounted price would become the “best price” for all remaining Medicaid patients. Congress created the 340B Drug Pricing Program, in part, to exempt discounts to safety net health providers from the Medicaid best price formula.
The 340B Drug Pricing Program requires manufacturers who want to have their drugs covered under Medicaid to provide “covered outpatient drugs” (prescription drugs and biologics other than vaccines) to certain hospitals and certain clinics receiving federal grants to serve vulnerable populations (“covered entities”) at or below a discounted “ceiling price.” The ceiling price is calculated the same way as Medicaid prices (AMP minus a unit rebate) resulting in a price that approximates the net price paid by Medicaid programs after rebates (Baer 2015). Manufacturers participate to qualify for federal funds for the covered outpatient drugs sold to Medicaid. Most covered entities save even more by participating in the Prime Vendor Program, which provides average savings of 10 percent below the ceiling price. Covered entities saved an estimated $3.8 billion on outpatient drugs in 2013 (MedPAC 2015).
The 340B program has expanded dramatically in recent years. Safety-net providers and their affiliated sites spent more than $16 billion to purchase 340B drugs in 2016, six times the amount spent in 2005, and the number of hospital organizations participating grew from 583 in 2005 to 2,140 in 2014 (Vandervelde and Blalock 2017; MedPAC 2015).
Two significant problems have emerged in the 340B program. First, the imprecise eligibility criteria has allowed for significant program growth beyond the intended purpose of the program. Second, providers earn significant profits from qualifying for the program, which can be used to fund other forms of care or shareholders’ dividends rather than provide care for low-income patients. These large incentives distort provider organizations’ decisions in attempts to qualify for the program, which is simply a form of rent seeking.
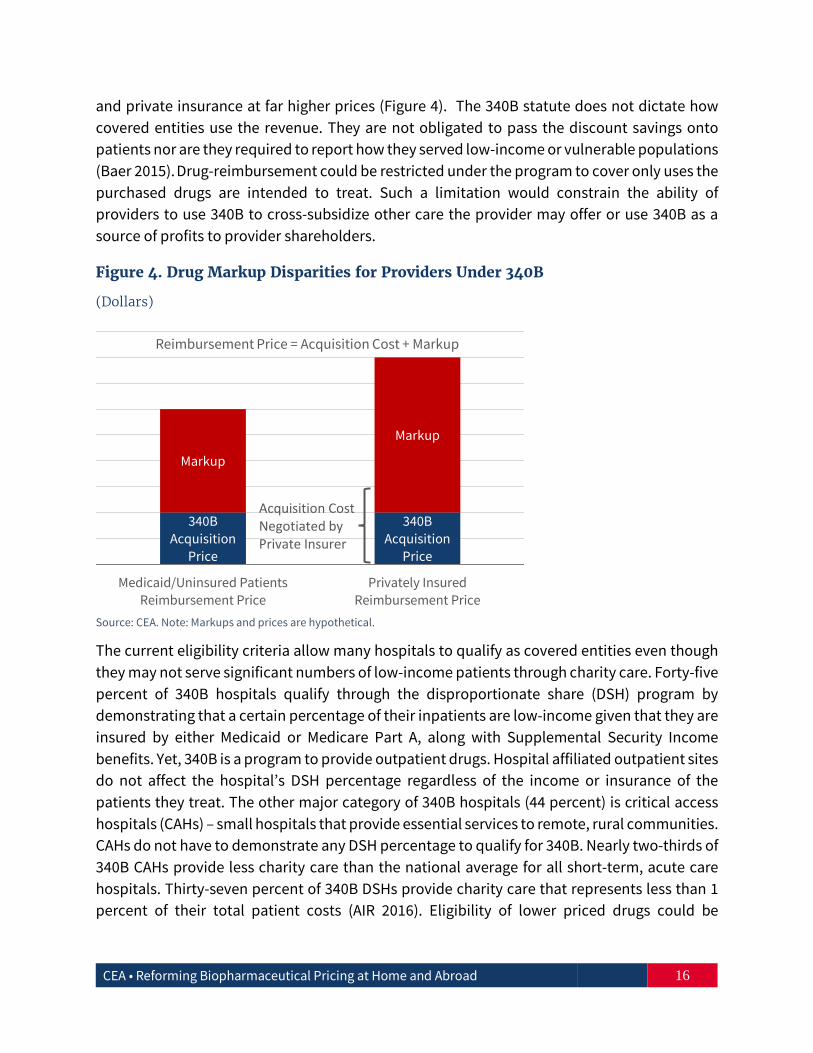
An unintended consequence of the 340B program has been that covered entities receive guaranteed profits while low-income patients who are the purported target of the program may receive little to no benefit (Conti and Bach 2014; Baer 2015). Covered entities can purchase drugs at discounted 340B prices for all their patients and sell them to patients with Medicare
CEA • Reforming Biopharmaceutical Pricing at Home and Abroad 16
and private insurance at far higher prices (Figure 4). The 340B statute does not dictate how covered entities use the revenue. They are not obligated to pass the discount savings onto patients nor are they required to report how they served low-income or vulnerable populations (Baer 2015). Drug-reimbursement could be restricted under the program to cover only uses the purchased drugs are intended to treat. Such a limitation would constrain the ability of providers to use 340B to cross-subsidize other care the provider may offer or use 340B as a source of profits to provider shareholders.
Figure 4. Drug Markup Disparities for Providers Under 340B
(Dollars)
Source: CEA. Note: Markups and prices are hypothetical.
The current eligibility criteria allow many hospitals to qualify as covered entities even though they may not serve significant numbers of low-income patients through charity care. Forty-five percent of 340B hospitals qualify through the disproportionate share (DSH) program by demonstrating that a certain percentage of their inpatients are low-income given that they are insured by either Medicaid or Medicare Part A, along with Supplemental Security Income benefits. Yet, 340B is a program to provide outpatient drugs. Hospital affiliated outpatient sites do not affect the hospital’s DSH percentage regardless of the income or insurance of the patients they treat. The other major category of 340B hospitals (44 percent) is critical access hospitals (CAHs) – small hospitals that provide essential services to remote, rural communities. CAHs do not have to demonstrate any DSH percentage to qualify for 340B. Nearly two-thirds of 340B CAHs provide less charity care than the national average for all short-term, acute care hospitals. Thirty-seven percent of 340B DSHs provide charity care that represents less than 1 percent of their total patient costs (AIR 2016). Eligibility of lower priced drugs could be
340B Acquisition
Price
340B Acquisition
Price
Markup
Markup
Medicaid/Uninsured PatientsReimbursement Price
Privately InsuredReimbursement Price
Reimbursement Price = Acquisition Cost + Markup
Acquisition Cost Negotiated by Private Insurer
CEA • Reforming Biopharmaceutical Pricing at Home and Abroad 17
restricted to the intended poor patient populations, to ensure better use of government resources.
Regulatory changes that prevent profiting from the 340B program in Medicare Part B are currently under way. Prior to 2018, Medicare Part B paid the same amount for drugs to 340B entities and non-340B entities even though the 340B entities purchase the drugs at a steep discount. Hospitals in the 340B program accounted for 48 percent of Medicare Part B spending at acute care hospitals in 2013. It is estimated that 340B hospitals receive, on average, a minimum discount of 22.5 percent of the average sales price (ASP) while Part B pays ASP plus 6 percent for outpatient drugs (MedPAC 2015). On November 1, 2017 CMS issued the Hospital Outpatient Prospective Payment System (OPPS) and Ambulatory Surgical Center (ASC) Payment System final rule, which starting January 2018, will reduce the amount Medicare pays hospitals for drugs acquired through the 340B Drug Pricing Program to ASP minus 22.5 percent rather than the current ASP plus 6 percent (CMS 2017a). These reforms will reduce overutilization of the 340B program and thus require hospitals to pay market prices for drugs for ineligible populations. It will also lower Medicare beneficiaries’ coinsurance liability, saving them an estimated $3.2 billion over the next decade (CMS 2017b).
The goal of the 340B Drug Pricing Program is to provide benefits to low-income patients, not to pay economic rents to hospitals. More precise eligibility criteria could help meet the primary goals of the program in the future. Beyond these immediate changes to the existing program, a single agency could set prices at which the eligible providers can buy drugs. Such an agency would require better guidance for how reduced eligibility and profiteering can be implemented going forward.
3.3 Reducing the Cost of Innovation through change at FDA
The fixed costs of developing and bringing a drug to market are typically large compared to the small marginal costs of producing additional pills or doses. Thus, the incentive to innovate is driven by whether expected profits exceed these fixed R&D costs, and government policies have a major influence on the size of these fixed costs.
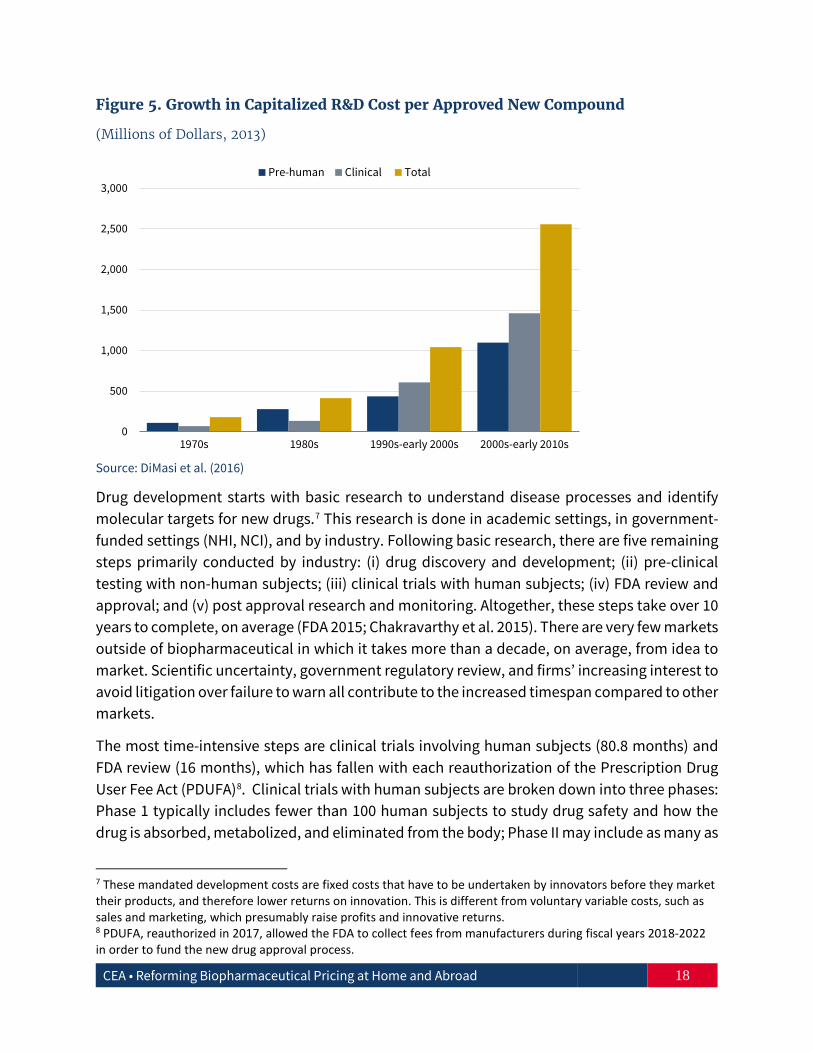
It is widely accepted that the fixed cost of bringing a new, patented drug to market has risen rapidly over time (Figure 5). The Tufts Center for the Study of Drug Development estimated that the average pre-tax, industry cost in 2013 dollars per new prescription drug approval (inclusive of failures and capital costs) is about $2.6 billion (DiMasi et al. 2014; 2016). Moderating this cost growth requires an understanding of the drug development process.
CEA • Reforming Biopharmaceutical Pricing at Home and Abroad 18
Figure 5. Growth in Capitalized R&D Cost per Approved New Compound
(Millions of Dollars, 2013)
Source: DiMasi et al. (2016)
Drug development starts with basic research to understand disease processes and identify molecular targets for new drugs.7 This research is done in academic settings, in government-funded settings (NHI, NCI), and by industry. Following basic research, there are five remaining steps primarily conducted by industry: (i) drug discovery and development; (ii) pre-clinical testing with non-human subjects; (iii) clinical trials with human subjects; (iv) FDA review and approval; and (v) post approval research and monitoring. Altogether, these steps take over 10 years to complete, on average (FDA 2015; Chakravarthy et al. 2015). There are very few markets outside of biopharmaceutical in which it takes more than a decade, on average, from idea to market. Scientific uncertainty, government regulatory review, and firms’ increasing interest to avoid litigation over failure to warn all contribute to the increased timespan compared to other markets.
The most time-intensive steps are clinical trials involving human subjects (80.8 months) and FDA review (16 months), which has fallen with each reauthorization of the Prescription Drug User Fee Act (PDUFA)8. Clinical trials with human subjects are broken down into three phases: Phase 1 typically includes fewer than 100 human subjects to study drug safety and how the drug is absorbed, metabolized, and eliminated from the body; Phase II may include as many as
7 These mandated development costs are fixed costs that have to be undertaken by innovators before they market their products, and therefore lower returns on innovation. This is different from voluntary variable costs, such as sales and marketing, which presumably raise profits and innovative returns. 8 PDUFA, reauthorized in 2017, allowed the FDA to collect fees from manufacturers during fiscal years 2018-2022 in order to fund the new drug approval process.
0
500
1,000
1,500
2,000
2,500
3,000
1970s 1980s 1990s-early 2000s 2000s-early 2010s
Pre-human Clinical Total

CEA • Reforming Biopharmaceutical Pricing at Home and Abroad 19
100 to 500 subjects to assess safety and efficacy with different strengths and dosing schedules of the drug; and Phase III includes potentially thousands of patients across multiple study sites to determine if the drug is safe and effective. Not surprisingly, Phase III accounts for the largest component of development costs.
Because clinical trials and FDA review are the most time- and resource-intensive steps, reforms that significantly reduce the fixed costs of entry could address these areas. Although FDA drug review and approval times have always been shorter than those of regulatory agencies in other countries, the FDA has over the years attempted to speed up the process (Downing et al. 2012; CIRS 2014). In particular, the FDA has four separate programs to expedite the development and approval process for drugs that address an unmet medical need in the treatment of a serious or life-threatening condition:
• Priority Review shortens the usual 10-month initial FDA review of new submissions to 6 months.
• Accelerated Approval allows the FDA to approve new drugs before full testing is completed for patients with serious conditions and limited treatment options. Since the program started in the early 1990s, over 90 new drugs and biologics have been approved.
• Fast Track designation provides for more frequent communication between the FDA and the manufacturer during development and eligibility for accelerated approval and priority review. This includes rolling reviews of results without waiting for the approval application to be complete.
• Breakthrough Therapy designation is available when preliminary clinical evidence indicates a new drug for serious conditions may demonstrate substantial improvement over currently available therapies. The FDA commits to intensively guide development beginning as early as Phase I. Between 2012 (when the program began) and 2015, 74 drugs received this designation.
While these programs have been put in place to speed up the entry for therapeutic drugs, there is still room for improvement — an average time of development and entry of new drugs of more than a decade is too long. The FDA could continue to facilitate the validation and qualification of new drug development tools that allow sponsors to demonstrate safety and efficacy more efficiently and earlier.
Furthermore, these pathways are not ideally suitable to use for defining pathways (discussed above) based on economic, as opposed to clinical, relief. The Breakthrough Therapy designation has been instrumental in bringing innovative drugs to market more quickly, with major benefits for patients who are provided new treatment options. However, the Breakthrough Therapy designation may no longer be available for new but similar drugs because they cannot demonstrate significant clinical improvement over the initial
CEA • Reforming Biopharmaceutical Pricing at Home and Abroad 20
Breakthrough Therapy drug. Moreover, Accelerated Approval and Fast Track are only available to fill “an unmet medical need,” which has already been met by the initial drug.
The government has also aided drug development utilizing biomarkers and surrogate endpoints. Biomarkers are molecular or clinical features that can be used as targets for drug treatments. Identifying patients who are likely to respond to specific treatments can shorten the time necessary to see positive results and make it easier and faster to recruit subjects who are more anxious to participate in trials. In the past three years, the FDA Center for Drug Evaluation and Research has approved more than 25 new drugs targeted at specific biomarkers. Surrogate markers that predict clinical endpoints can also shorten trials by identifying drug efficacy sooner. The 21st Century Cures Act has encouraged utilization of surrogate markers but more scientifically validated markers need to be discovered.
The problem is that there is currently no way originators of biomarkers and surrogate endpoints can capture the value of their innovation to other manufacturers using it after it has been developed. Once a biomarker or endpoint is published, it can be difficult for originators to capture the value of their innovation to other manufacturers using it. Rewarding firms that invest in the pooling, curating, and validating of potential biomarkers and surrogate endpoints that can shorten clinical trials could create appropriate incentives for more high quality research.
3.4 Reforms Reducing the Cost of Innovation Raise Price Competition
Drug development reforms should aim to lower the cost of entry and enhance price competition of new innovations. Reforms that lower prices after patents expire are also important. Generic drugs have been highly successful in driving down drug prices—as more generics come to market, prices drop rapidly to nearly half after just the second generic introduction. Faster generic drug approvals could decrease the cost of entry and thus decrease drug prices even further. The current approval process for generic drugs is based on the 1984 Drug Price Competition and Patent Term Restoration Act (also known as the Hatch-Waxman Act). Generic drugs go through an abbreviated approval process in which applicants are only required to prove bioequivalence (showing that the active ingredient is absorbed at the same rate and to the same extent as the patented drug) to an already approved drug. Tests to prove bioequivalence are much less costly than tests to prove safety and efficacy. In addition, the Hatch-Waxman Act allows applicants to start clinical testing before the patent on the original drug expires. The result was that after the Hatch-Waxman Act took effect, the lag between patent expiration and generic entry for top selling drugs dropped from more than three years to less than three months (CBO 1998). Nevertheless, the time until approval (and associated cost) for most generic drugs is far greater. The FDA is undertaking regulatory actions to streamline and speed up the process by which generics are approved. Gaming of the
CEA • Reforming Biopharmaceutical Pricing at Home and Abroad 21
regulations that distort the industry away from the intended goals of the regulations of lowering drug prices for patients can be further reduced.
In August 2017, President Trump signed the Food and Drug Administration Reauthorization Act (FDARA) into law, reauthorizing the Generic Drug User Fee Amendments (GDUFA) to empower the FDA to collect user fees for generic drug applications and consistently process applications in a timely manner. In November 2017, the FDA completed more final approvals and tentative approvals of generic drugs (107 in total) than any prior month in the agency’s history.
The Trump Administration has prioritized the approval of more generic drugs to bring down the cost of pharmaceuticals (FDA 2018). Last year, the FDA announced the Drug Competition Action Plan (DCAP) to expand access to safe and effective generic drugs. Efforts have focused on three key priorities to encourage generic drug competition: (i) preventing branded companies from keeping generics out of the market, (ii) mitigating scientific and regulatory obstacles in gaining approval, and (iii) streamlining its generic review process. The FDA has already released guidance that outlines to companies and FDA staff specific steps to reduce the number of review cycles and shorten the approval process. Some of the actions that the FDA has taken under the DCAP include:
i. New policies to expedite review of ANDAs where there are limited approved generics for a given product;
ii. Publication of a “List of Off-Patent, Off-Exclusivity Drugs without an Approved Generic,” which will receive expedited review if an ANDA for the product is submitted;
iii. New guidance for industry on submitting ANDAs; iv. Product specific guidance to support generic development of small-molecule
complex generics; and v. Guidance for industry for evaluating the abuse deterrence of generic solid oral
opioid drug products.
Biosimilar competition
Biologics—large, protein based, complex drugs made in living cells and which are typically very expensive—have become increasingly important; however, they present particular scientific and regulatory challenges. Despite being used by only 2 percent of the U.S. population, they have come to comprise between 27 percent and 40 percent of U.S. drug spending (Morton and Boller 2017; Carroll 2013; Purvis and Kuntz 2016). The Biologics Price Competition and Innovation Act (BPCIA) created an abbreviated licensure pathway for biological products (aBLA) that are demonstrated to be biosimilar to or interchangeable with an FDA-approved biological product. It is believed that biosimilars could be cheaper than their reference products and save $44 billion over 10 years (Mulcahy et al. 2014).
CEA • Reforming Biopharmaceutical Pricing at Home and Abroad 22
Biosimilar applicants must demonstrate to the FDA that there is no clinically meaningful differences in safety, purity, and potency (safety and effectiveness) compared to the reference biologic. The standards are even stricter for approval as “interchangeable”—a biosimilar must be able to be switched for the reference biologic without risk of an adverse event—so that they can be substituted for their reference biologic without a doctor’s specific permission. Nevertheless, approvals have taken time—there are only nine FDA approved biosimilars and none are considered interchangeable (FDA 2017).
Lack of competition for biologics, including those with expired patents and data exclusivity periods, is one potential reason prices remain high. Eighteen of the top 30 selling biologics were first licensed in 2004 or earlier suggesting that prices have remained high despite relevant patent expirations (Morton and Boller 2017). This is in contrast to what happens after patent expiration of small molecule drugs where generic competition rapidly brings prices down.
Developing and gaining approval for biosimilars is far more expensive than bringing typical generics to market. Small molecule generics rely on easily replicated chemical ingredients and can be approved on the basis of relatively small and inexpensive studies to prove bioequivalence. In contrast, biosimilars and biologics are highly sensitive to the living systems used to manufacture them. Production is difficult and requires significant scientific expertise (Palmer 2013). Biosimilars can take 8-10 years and hundreds of millions of dollars to gain approval (FTC 2009).
The cost of bringing biosimilars to market, as well as the complexity of manufacturing biologics and biosimilars, make it likely that large, well-established companies will dominate the biosimilars market, which would limit the number of entrants (Blackstone and Fuhr 2013). Since most biosimilars will not be interchangeable with the reference biologic, competition will be more like therapeutic competition between patented products rather than typical generic competition. CMS recently announced it will institute separate payment codes for each new biosimilar rather than have a single payment code as is done for all the versions of small molecule drugs, including all the generic versions and the original patented drug. The reference biologic could maintain significant market share among patients and physicians concerned about potential differences between the reference biologic and its biosimilars, limiting downward price pressure. In addition, the complex and costly manufacturing process means that cost savings from biosimilars will be smaller than savings from small molecule generics because of the substantially higher ongoing costs of production.
Regulatory uncertainty, driven in part by concerns over safety, has also impeded biosimilar development. Final guidelines for demonstrating biosimilarity were only finalized in 2015, five years after passage of the BPCIA, in part reflecting the complexity of this problem. The FDA has indicated it will not finalize guidelines on demonstrating biosimilar interchangeability for another two years or more. Speeding up the issuance of final guidelines could add certainty
CEA • Reforming Biopharmaceutical Pricing at Home and Abroad 23
and attract additional biosimilar applicants. If these guidelines are relatively easy and inexpensive to adhere to, it could spur interchangeable applications and approvals, which could result in more effective competition with the reference biosimilar and lower prices.
4. Conclusion
The two seemingly inconsistent goals of reducing American prices and stimulating innovation can be achieved only by a combined strategy to reduce artificially high prices at home while at the same time reducing free-riding abroad.
The objective of government in biopharmaceutical policy is to ensure that firms invest in meaningful innovations that lower the price of health, rather than provide incentives that dampen rather than promote competition between innovations. Additionally, it is also the role of government to help solve international problems such as global free-riding on drug innovation, which harms U.S. citizens. Bad government policies or insurance programs that prevent, rather than foster, healthy price competition often induce artificially high prices in the United States. The U.S. biopharmaceutical industry is the engine of worldwide biopharmaceutical innovation and an important part of our economy. Preserving this industry and encouraging it to innovate while making drugs more available and affordable for all Americans is an attainable goal.
CEA • Reforming Biopharmaceutical Pricing at Home and Abroad 24
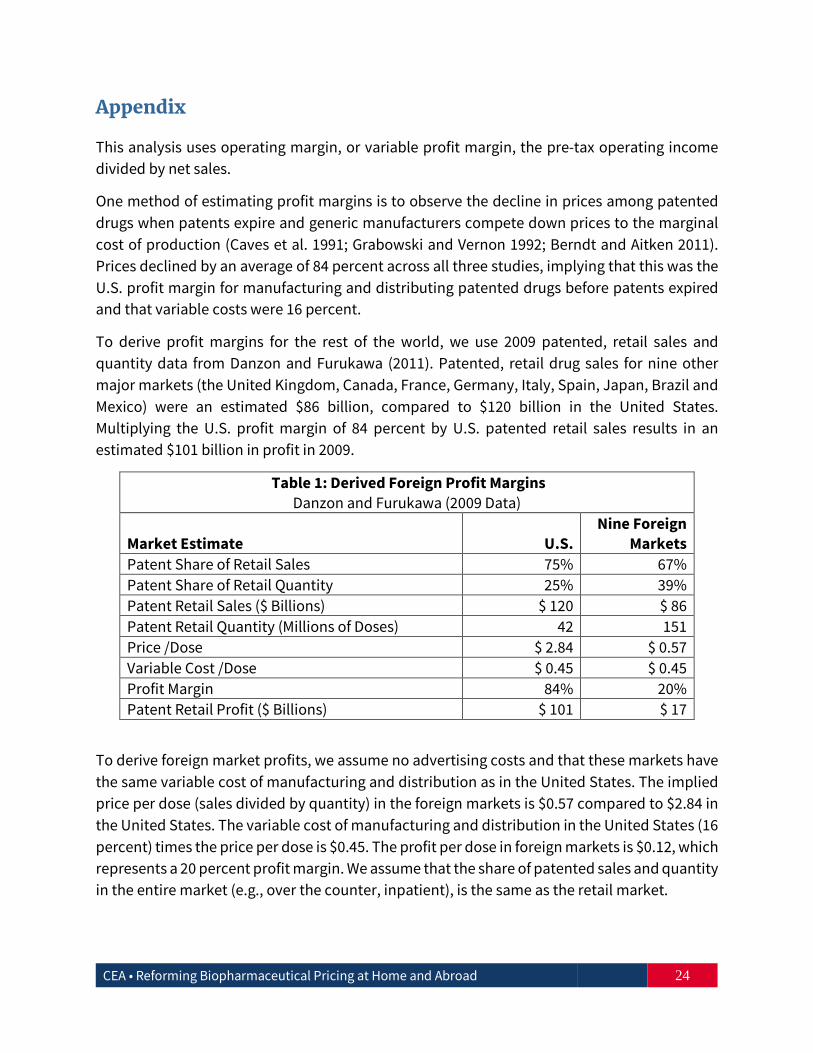
Appendix
This analysis uses operating margin, or variable profit margin, the pre-tax operating income divided by net sales.
One method of estimating profit margins is to observe the decline in prices among patented drugs when patents expire and generic manufacturers compete down prices to the marginal cost of production (Caves et al. 1991; Grabowski and Vernon 1992; Berndt and Aitken 2011). Prices declined by an average of 84 percent across all three studies, implying that this was the U.S. profit margin for manufacturing and distributing patented drugs before patents expired and that variable costs were 16 percent.
To derive profit margins for the rest of the world, we use 2009 patented, retail sales and quantity data from Danzon and Furukawa (2011). Patented, retail drug sales for nine other major markets (the United Kingdom, Canada, France, Germany, Italy, Spain, Japan, Brazil and Mexico) were an estimated $86 billion, compared to $120 billion in the United States. Multiplying the U.S. profit margin of 84 percent by U.S. patented retail sales results in an estimated $101 billion in profit in 2009.
Table 1: Derived Foreign Profit Margins Danzon and Furukawa (2009 Data)
Market Estimate U.S. Nine Foreign
Markets Patent Share of Retail Sales 75% 67% Patent Share of Retail Quantity 25% 39% Patent Retail Sales ($ Billions) $ 120 $ 86 Patent Retail Quantity (Millions of Doses) 42 151 Price /Dose $ 2.84 $ 0.57 Variable Cost /Dose $ 0.45 $ 0.45 Profit Margin 84% 20% Patent Retail Profit ($ Billions) $ 101 $ 17
To derive foreign market profits, we assume no advertising costs and that these markets have the same variable cost of manufacturing and distribution as in the United States. The implied price per dose (sales divided by quantity) in the foreign markets is $0.57 compared to $2.84 in the United States. The variable cost of manufacturing and distribution in the United States (16 percent) times the price per dose is $0.45. The profit per dose in foreign markets is $0.12, which represents a 20 percent profit margin. We assume that the share of patented sales and quantity in the entire market (e.g., over the counter, inpatient), is the same as the retail market.
CEA • Reforming Biopharmaceutical Pricing at Home and Abroad 25
References
Alliance for Integrity and Reform (AIR). 2016. “Benefiting Hospitals, Not Patients: An Analysis of Charity Care Provided by Hospitals Enrolled in the 340B Discount Program.”
America’s Health Insurance Plans (AHIP). 2016. “High-Priced Drugs: Estimates of Annual Per-Patient Expenditures for 150 Specialty Medications.”
Baer, C.J. 2015. "Drugs for the Indigent: A Proposal to Revise the 340B Drug Pricing Program." William & Mary Law Review 57 (2): 637-74.
Baghdadi, R., Pearson, S., Horvath, J., and Tollen, L. 2017. “Health Policy Brief: Medicaid Best Price." Health Affairs. DOI: 10.1377/hpb20171008.000173
Berndt, E.R., and Aitken, M.L. 2011. “Brand Loyalty, Generic Entry and Price Competition in Pharmaceuticals in the Quarter Century After the 1984 Waxman-Hatch Legislation.” International Journal of the Economics of Business 18 (2): 177-201.
Blackstone, E.A., and Fuhr, J. P. 2013. “The Economics of Biosimilars.” Am. Health & Drug Benefits 6 (8): 469-478.
Business Monitor International (BMI). 2017. Branded and Generic Pharmaceutical Sales by Country 2015-2016. Data was provided by International Trade Administration (Commerce).
Carroll, J. 2013. “Europe Offers Example for Approving Biosimilars.” Managed Care. https://www.managedcaremag.com/archives/2013/9/europe-offers-example-approving-biosimilars.
Caves, R.E., Whinston, M.D., Hurwitz, M.A., Pakes, A., and Temin, P. 1991. “Patent Expiration, Entry, and Competition in the U.S. Pharmaceutical Industry.” Brookings Papers on Economic Activity. Microeconomics: 1-66.
Centre for Innovation in Regulatory Science (CIRS). 2014. “New Drug Approvals in ICH Countries, 2004-2013.” R&D Briefing 54.
Centers for Medicare and Medicaid Services. Medicaid Drug Rebate Program. November 24, 2017. https://www.medicaid.gov/medicaid/prescription-drugs/medicaid-drug-rebate-program/index.html.
Centers for Medicare and Medicaid Services. 2017a. “CMS Issues Hospital Outpatient Prospective Payment System and Ambulatory Surgical Center Payment System and Quality Reporting Programs Changes for 2018.” https://www.cms.gov/Newsroom/MediaReleaseDatabase/Fact-sheets/2017-Fact-Sheet-items/2017-11-01.html.
CEA • Reforming Biopharmaceutical Pricing at Home and Abroad 26
Centers for Medicare and Medicaid Services. 2017b. “CMS Finalizes Policies that Lower Out-of-Pocket Drug Costs and Increase Access to High-Quality Care.” https://www.cms.gov/Newsroom/MediaReleaseDatabase/Press-releases/2017-Press-releases-items/2017-11-01-2.html
Chakravarthy, R., Cotter, K., DiMasi, J., Milne, C.P., and Wendel, N. 2015. “Public and Private Sector Contributions to the Research & Development of the Most Transformational Drugs of the Last 25 Years.” Tufts Center for the Study of Drug Development White Paper. http://csdd.tufts.edu/files/uploads/PubPrivPaper2015.pdf.
Congressional Budget Office (CBO). 1998. “How Increased Competition from Generic Drugs has Affected Prices and Returns in the Pharmaceutical Industry.” https://www.cbo.gov/publication/10938.
Conti, R.M., and Bach, P.B. 2014. “The 340B Drug Discount Program: Hospitals Generate Profits By Expanding To Reach More Affluent Communities.” Health Affairs 33 (10).
Danzon, P.M., and Furukawa, M.F., 2011. “Cross-National Evidence on Generic Pharmaceuticals: Pharmacy vs. Physician-Driven Markets.” Working Paper 17226, National Bureau of Economic Research.
Danzon, P.M., Wang, Y.R., and Wang, L., 2005. “The Impact of Price Regulation on the Launch Delay of New Drugs—Evidence From Twenty‐Five Major Markets in the 1990s.” Health Economics 14 (3): 269-92.
DiMasi, J.A., Grabowski, H.G., and Hansen, R.W. 2016. "Innovation in the Pharmaceutical Industry: New Estimates of R&D Costs." Journal of Health Economics 47: 20–33.
DiMasi, J.A., Grabowski, H.G., and Hansen, R.W. 2014. “Innovation in the Pharmaceutical Industry: New Estimates of R&D Costs.” Tufts Center for the Study of Drug Development.
Downing, N.S., Aminawung, J.A., Shah, N.D., Braunstein, J.B., Krumholz, H.M., and Ross, J.S. 2012. “Review of Novel Therapeutics by Three Regulatory Agencies.” New England Journal of Medicine 366: 1165-67.
Egan, M., and Philipson, T. 2013. “International Health Economics.” Working Paper 19280, National Bureau of Economic Research.
Federal Trade Commission (FTC). 2009. “Emerging Health Care Issues: Follow-on Biologic Drug Competition.” https://www.ftc.gov/sites/default/files/documents/reports/emerging-health-care-issues-follow-biologic-drug-competition-federal-trade-commission-report/p083901biologicsreport.pdf.
Food and Drug Administration (FDA). 2015. “The Drug Development Process.” https://www.fda.gov/forpatients/approvals/drugs/.
CEA • Reforming Biopharmaceutical Pricing at Home and Abroad 27
Food and Drug Administration (FDA). “Biosimilar Product Information.” December 13, 2017. https://www.fda.gov/Drugs/DevelopmentApprovalProcess/HowDrugsareDevelopedandApproved/ApprovalApplications/TherapeuticBiologicApplications/Biosimilars/ucm580432.htm
Food and Drug Administration (FDA). “Statement from FDA Commissioner Scott Gottlieb, M.D. on new steps to facilitate efficient generic drug review to enhance competition, promote access and lower drug prices.” January 3, 2018. https://www.fda.gov/NewsEvents/Newsroom/PressAnnouncements/ucm591184.htm
Goldman, D., and Lakdawalla, D. 2018. “The Global Burden of Medical Innovation.” Leonard Schaeffer Center for Health Policy and Economics, University of Southern California. http://healthpolicy.usc.edu/documents/01.2018_Global%20Burden%20of%20Medical%20Innovation.pdf.
Grabowski, H., and Vernon, J.M., 1992. “Brand Loyalty, Entry and Price Competition in Pharmaceuticals after the 1984 Drug Act.” Journal of Law and Economics 35: 331–350.
Medicare Payment Advisory Commission (MedPAC). 2015. “Overview of the 340B Drug Pricing Program.” http://medpac.gov/docs/default-source/reports/may-2015-report-to-the-congress-overview-of-the-340b-drug-pricing-program.pdf?sfvrsn=0.
Medicare Payment Advisory Commission (MedPAC). 2016. “Improving Medicare Part D.” http://www.medpac.gov/docs/default-source/reports/june-2016-report-to-the-congress-medicare-and-the-health-care-delivery-system.pdf?sfvrsn=0.
Morton, F.C., and Boller, L.T. 2017. “Enabling Competition in Pharmaceutical Markets.” Hutchins Center Working Papers No. 30. https://www.brookings.edu/wp-content/uploads/2017/05/wp30_scottmorton_competitioninpharma1.pdf.
Moses H., Matheson, D., Cairns-Smith, S., George, B., Palisch, C., and Dorsey, E.R. 2015. “The Anatomy of Medical Research U.S. and International Comparisons.” JAMA 313 (2): 174-89.
Mulcahy, A., Predome, Z., and Mattke, S. 2014. “The Cost Saving Potential of Biosimilar Drugs in the United States.” RAND Corporation. https://www.rand.org/content/dam/rand/pubs/perspectives/PE100/PE127/RAND_PE127.pdf.
Organization for Economic Co-operation and Development (OECD). 2016. National Accounts.
Olson, L., and Wendling, B. 2013. “The Effect of Generic Drug Competition on Generic Drug Prices During the Hatch-Waxman 180-Day Exclusivity Period” The Federal Trade Commission. https://www.ftc.gov/sites/default/files/documents/reports/estimating-effect-entry-generic-drug-prices-using-hatch-waxman-exclusivity/wp317.pdf
CEA • Reforming Biopharmaceutical Pricing at Home and Abroad 28
Palmer, E. 2013. “Conquering the Complexities of Biologics to get to Biosimilars.” FiercePharma. https://www.fiercepharma.com/regulatory/conquering-complexities-of-biologics-to-get-to-biosimilars
Patel, K. and Gottlieb, S. “A Fair Plan For Fairer Drug Prices." Health Affairs Blog. July 11, 2016. DOI: 10.1377/hblog20160711.055778
Purvis, L., and Kuntz, C. 2016. “Is High Prescription Drug Spending Becoming Our New Normal?” Health Affairs Blog. http://www.healthaffairs.org/do/10.1377/hblog20160517.054882/full/.
Sachs, R., Bagley, N., and Lakdawalla, D. 2017. “Innovative Contracting for Pharmaceuticals and Medicaid’s Best-Price Rule.” Journal of Health Politics, Policy and Law (Forthcoming).
Sood, N., Shih,T., Van Nuys, K., and Goldman, D. 2017. “The Flow of Money through the Pharmaceutical Distribution System.” Leonard Schaeffer Center for Health Policy and Economics, University of Southern California. http://healthpolicy.usc.edu/documents/USC%20Schaeffer_Flow%20of%20Money_2017.pdf.
TEConomy Partners. 2017. “Closing the Gap: Increasing Global Competition to Attract and Grow the Biopharmaceutical Sector.”
U.S. Department of Commerce. 2004. “Pharmaceutical Price Controls in OECD Countries: Implications for U.S. consumers, Pricing, Research and Development, and Innovation.” https://www.trade.gov/td/health/DrugPricingStudy.pdf.
U.S. Department of Commerce, International Trade Administration. 2016. “Top Markets Report Pharmaceuticals. A Market Assessment Tool for U.S. Exporters.” https://www.trade.gov/topmarkets/pdf/Pharmaceuticals_Top_Markets_Reports.pdf. Note: Additional Business Monitor International (BMI) sales data was provided to CEA.
U.S. Government Accountability Office (GAO). 2015. “Medicare Part B: Expenditures for New Drugs Concentrated among a Few Drugs, and Most Were Costly for Beneficiaries.” http://www.gao.gov/products/GAO-16-12.
Vandervelde, A., and Blalock, E. 2017. “Measuring the Relative Size of the 340B Program: 2012-2017.” Berkley Research Group. http://340breform.org/wp-content/uploads/2017/02/July-2017-BRG-White-Paper_Percent-of-Sales.pdf.
Vernon, J.A. 2003. “The Relationship Between Price Regulation and Pharmaceutical Profit Margins.” Applied Economics Letters 10(8): 467-70.

ABOUT THE COUNCIL OF ECONOMIC ADVISERS
The Council of Economic Advisers, an agency within the Executive Office of the President, is charged with offering the President objective economic advice on the formulation of both domestic and international economic policy. The Council bases its recommendations and analysis on economic research and empirical evidence, using the best data available to support the President in setting our nation's economic policy.
www.whitehouse.gov/cea


![Review Viral clearance for biopharmaceutical downstream ... · Viral clearance for biopharmaceutical downstream processes ... [13]. Hence a panel of ... Viral clearance for biopharmaceutical](https://static.documents.pub/doc/80x56/5ad5f65c7f8b9a5d058dd2b7/review-viral-clearance-for-biopharmaceutical-downstream-clearance-for-biopharmaceutical.jpg)


