Refractive index variation in compression moldingof precision glass optical components
Lijuan Su,1 Yang Chen,1 Allen Y. Yi,1,* Fritz Klocke,2 and Guido Pongs2
1Department of Industrial, Welding and Systems Engineering, The Ohio State University,210 Baker Systems Building, 1971 Neil Avenue, Columbus, Ohio 43210, USA
2Fraunhofer Institute for Production Technology, Steinbachstrasse 17, 52074 Aachen, Germany
Compression molding of precision glass lenses (glassmolding) is a high volume manufacturing techniquethat can be applied for precision aspherical glass op-tical components fabrication [1]. The glass moldingprocess is a hot forming method in which a heatedglass gob or blank is pressed by optically polishedmolds to create the finished lens shape. The moldedglass lens is maintained at the molding temperaturefor a fixed amount of time after molding so that thestresses induced by compression can be released byrelaxation, and the finished lens was then cooled (orannealed) thereafter. As compared to a conventionalglass fabrication technique (i.e., grinding, polishing,and lapping), glass molding is an environmentallyconscious process since it eliminates the use of pol-ishing and grinding fluids required in the conven-tional method. It is also a near net-shape process.
However, there are still quite a few technical chal-lenges involved in the new process ranging from ther-mal expansion of the molds, mold life, and residualstresses to the refractive index variation induced intothe molded glass lenses during the process.
In recent years, finite element methods (FEMs)have been utilized to study the stresses inside glasscomponents under different molding conditions andother problems (such as a lens shape change) [2]. Ac-cording to prior knowledge, compression molding ofglass materials at glass transition temperature (Tg)involves viscoelastic effects and structural relaxa-tion, which will affect material properties of themolded glass article [3]. The glass viscoelastic prop-erties in the Tg region and the stress and structuralrelaxation in the cooling stage were included to es-tablish a reliable numerical model to simulate theglass forming process. A commercial FEM programMARC (www.mscsoftware.com) was used to predictstresses, and a good agreement between the simula-tion and the experimental results was obtained [4]. Anumerical model based on the Narayanaswamymod-
el [5] was developed to simulate the glass moldingprocess [6]. The program was further developed tostudy residual stresses induced into the molded glasslenses [7]. A good agreement between the simulatedresidual stresses and the experiment results wasalso obtained.Therefractiveindexofglass lenses isoneof theprop-
erties that will be affected by compression moldingoperations, largely during cooling. The refractive in-dex is avery importantproperty forproper optical per-formance by themolded glass lenses. Refractive indexvariations inamoldedglass lenswill inducedistortionto the wavefront passing through the lens. Differentmethods have been presented to measure the refrac-tive index directly. For example, the systems basedon interferometers were developed to measure therefractive index or the change of it [8–12]. Althoughthe interferometricmethodsareprecise, theyare rela-tively complex, expensive, and require a well-controlled environment. In this paper, a system basedon a Shack–Hartmann wavefront sensor [13,14],which has several advantages over interferometers[15,16], was employed tomeasure the distorted wave-front. The variations of the refractive indexwere eval-uated from the measured wavefront information.Here our focus is to study the refractive index var-
iations inside glass lenses caused by cooling. To sim-plify the experimental setup, glass lenses wereheated to a predetermined temperature and cooleddown under different cooling rates without a com-pression operation. The refractive index variationsof the thermally treated glass were evaluated bymeasuring the wavefront variations with a Shack–Hartmann wavefront sensor. Three different coolingrates obtained in the thermal treatment experimentswere also used in the FEM simulations [7]. The re-fractive index variations were calculated using a nu-merical simulation, and results were comparable tothe measurements.
2. Numerical Simulation of Glass Cooling Process
A. Refractive Index Variation During Cooling
The refractive index change in this paper is definedas the difference between the refractive index at apoint of glass before and after thermal treatment.It is generally accepted that the relationship be-tween the density and the refractive index of glasscan be described by the following equation [17]:
dndρ ¼ ðn2
− 1Þð4π þ bn2− bÞ
8πnρ ; ð1Þ
where n is the initial refractive index, ρ is the initialdensity of the glass material, and b is an empiricalvalue whose value can be either positive or negative.The value of b for BK7 glass is −0:4 according to Rit-land’s calculation [17] with the Joos data [18]. Alter-natively in the FEM calculation, the equation can beexpressed as
ΔnΔρ ¼ ðn2
− 1Þð4π þ bn2− bÞ
8πnρ ; ð2Þ
where Δn is the refractive index change and Δρ isthe density change of a finite element after cooling.Due to the simplicity of the glass lens geometry, atwo-dimensional (2D) axisymmetrical model wasused for simulation.
Figure 1 shows the meshed geometry of a glasslens. The refractive index change of a finite elementcan be calculated by the following equation:
Δni;j ¼ −
ðn2− 1Þð4π þ bn2
− bÞ8πn ×
ΔVi;j
ðVi;j þΔVi;jÞ; ð3Þ
where Vi;j is the initial volume of the element andΔVi;j is the volume change of the element due tocooling.
The refractive index changes along the radial di-rection of the glass lens were calculated by averagingthe refractive index changes of the finite elementsalong the same axial lines, or
Δni ¼�XN
j¼1
Δni;j
�=N:
The refractive index variation in this paper is definedas the refractive index differences among differentpoints in a glass lens. The refractive index at the cen-ter of the glass was used as a reference to calculatethe refractive index variation Δnv along the radialdirection as in
Δnv;i ¼ Δni −Δn1: ð4Þ
B. Finite Element Simulation by MSC/MARC
As described earlier, 2D axisymmetric simulation ofthe glass cooling process was performed using a com-mercial FEM code MSC/MARC. MSC/MARC is ageneral purpose FEM software package that is par-ticularly suitable for highly nonlinear viscoelasticanalysis. The lower mold was a 2mm thick glassy
carbon wafer that was simplified as rigid bodies inthis simulation. The original glass lens blank wasa 25mm diameter and 10mm thick double sided po-lished cylinder, which was defined as the deformablepart. A four-node isoparametric quadrilateral ele-ment was used to mesh the glass sample into 8000elements as shown in Fig 1. The simulation includestwo major steps: (1) the glass lens blank and moldflat were heated to a temperature above the transi-tion temperature, and (2) the heated glass lens wascooled to room temperature under one of the threepredetermined cooling rates.The important material properties of BK7 glass
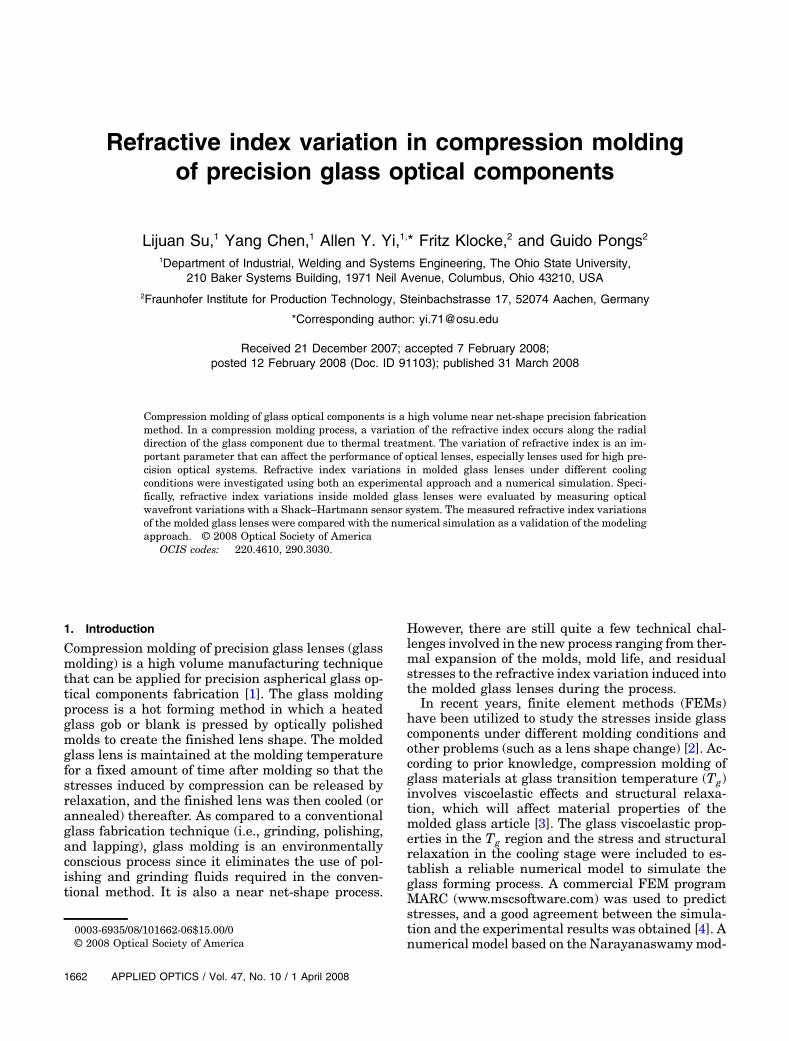
were summarized in Tables 1 and 2 [19], respectively.The thermal boundary conditions were obtainedfrom the temperature data in the experiments. Threedifferent cooling rates were used to study its influ-ence on the samples (q1 ¼ 1:60 °C=s, q2 ¼ 0:60 °C=s,and q3 ¼ 0:225 °C=s).
3. Experiments
A. Glass Molding Process
The experiments were performed on a Toshiba GMP211V machine [20–22] at the Fraunhofer Institutefor Production Technology in Aachen, Germany.Since the main goal of this paper is to study the re-fractive index variations inside glass lenses cooledwith different cooling rates, the glass lens blankswere simply heated to a predefined temperatureand cooled down with different cooling rates. Thecompression operation for glass molding was elimi-nated to simplify the problem. The BK7 glass blankused in this experiment was placed manually on thelower mold. The thermal histories of the experimentsare shown in Fig. 2. Specifically, the experimentswere conducted as described below.
1. The experiment began with placing a glasslens blank at the lower mold, then the entire moldassembly system with the glass lens was heated tothe molding temperature of 680 °C at a heating rateof 3:0 °C=s. The heating rate was the same for allthree experiments with different cooling rates.2. The temperature was maintained at 680 °C for
400 s for all three cooling rate tests.3. Cooling of the glass lens was performed at
three different cooling rates, i.e., q1 ¼ 1:60 °C=s,
q2 ¼ 0:60 °C=s, and q3 ¼ 0:225 °C=s (the cooling rateswere the nominal settings on the molding machine).
4. Once the temperature of the mold and part as-sembly was lowered to ∼200 °C, the glass lens wascooled to room temperature by natural cooling. Atthe end of the cooling test, the glass lens was re-moved from the molding machine manually.
During the experiments, the air that remained inthe gap between the glassy carbon mold and the BK7glass disk was removed by applying vacuum at thebeginning of each cycle. Oxygen residual was re-moved by a nitrogen purge to protect the glass lensand glassy carbon molds from oxidation at the hightemperature. Nitrogen was also used to maintain theconstant cooling rates. The lower mold maintainedcontact with the glass lenses during the entire cool-ing stage.
B. Refractive Index Variation Measurement
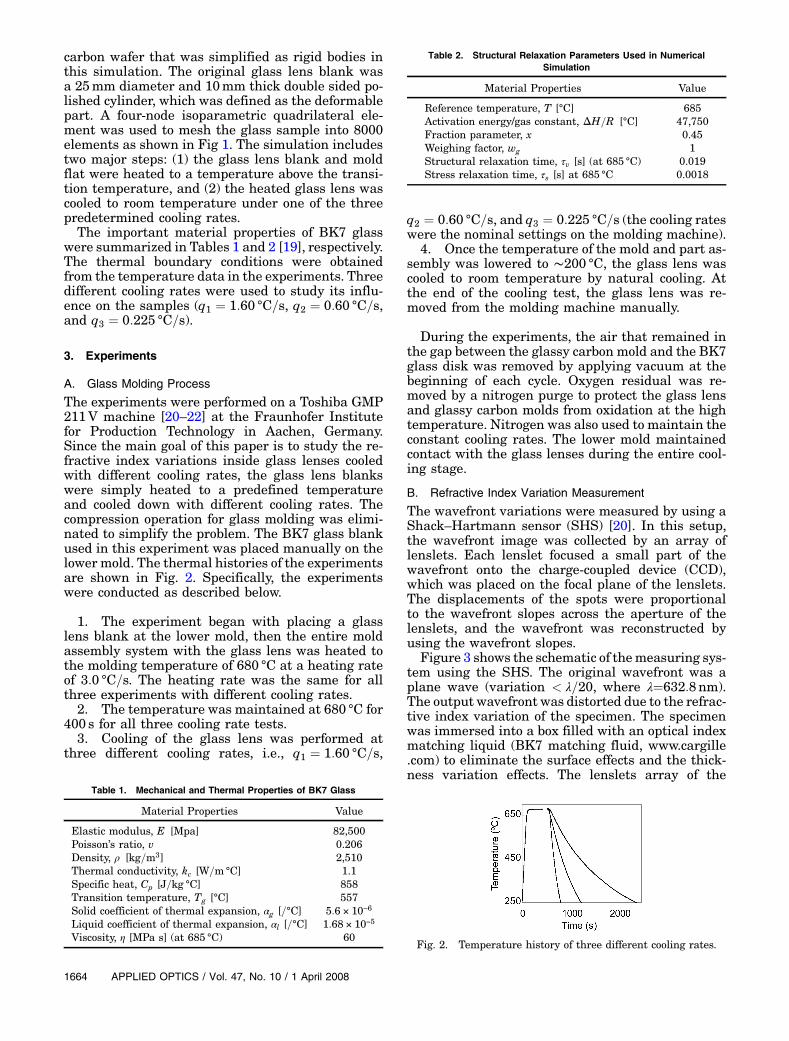
The wavefront variations were measured by using aShack–Hartmann sensor (SHS) [20]. In this setup,the wavefront image was collected by an array oflenslets. Each lenslet focused a small part of thewavefront onto the charge-coupled device (CCD),which was placed on the focal plane of the lenslets.The displacements of the spots were proportionalto the wavefront slopes across the aperture of thelenslets, and the wavefront was reconstructed byusing the wavefront slopes.
Figure 3 shows the schematic of themeasuring sys-tem using the SHS. The original wavefront was aplane wave (variation < λ=20, where λ¼632:8nm).The output wavefront was distorted due to the refrac-tive index variation of the specimen. The specimenwas immersed into a box filled with an optical indexmatching liquid (BK7 matching fluid, www.cargille.com) to eliminate the surface effects and the thick-ness variation effects. The lenslets array of the
Table 1. Mechanical and Thermal Properties of BK7 Glass
Liquid coefficient of thermal expansion, αl [=°C] 1:68 × 10−5
Viscosity, η [MPa s] (at 685 °C) 60
Table 2. Structural Relaxation Parameters Used in NumericalSimulation
Material Properties Value
Reference temperature, T [°C] 685Activation energy/gas constant, ΔH=R [°C] 47,750Fraction parameter, x 0.45Weighing factor, wg 1Structural relaxation time, τv [s] (at 685 °C) 0.019Stress relaxation time, τs [s] at 685 °C 0.0018
Fig. 2. Temperature history of three different cooling rates.
SHS was placed in a plane that is a conjugate to theoutput wavefront from the specimen. The systemmagnification M is equal to −f 2=f 1.Theoptical pathdistribution through the thermally
treated glass lens is defined by
Lðx; yÞ ¼ nðx; yÞtðx; yÞ; ð5Þwherenðx; yÞ is the refractive index distribution of thesample. Since the glass lenses are flat plates in thispaper, the thickness of the specimen tðx; yÞ ¼ t.Assume the refractive index of the center of the
glass lenses is nc, then the reference optical pathLr is defined by
Lr ¼ nct: ð6ÞThe wavefront variation is the optical path differencethat can be defined by
ΔLvðx; yÞ ¼ Lðx; yÞ − Lr ¼ nðx; yÞt − nct: ð7ÞThe wavefront variation ΔLvðx; yÞ could be recon-structed by using the SHS to measure the positionof spots. So when the ΔLvðx; yÞ, and thickness t ofthe specimen are known, the refractive index varia-tion Δnvðx; yÞ can be calculated from the followingequation:
Δnvðx; yÞ ¼ nðx; yÞ − nc ¼ ΔLvðx; yÞ=t: ð8Þ
4. Results and Discussion
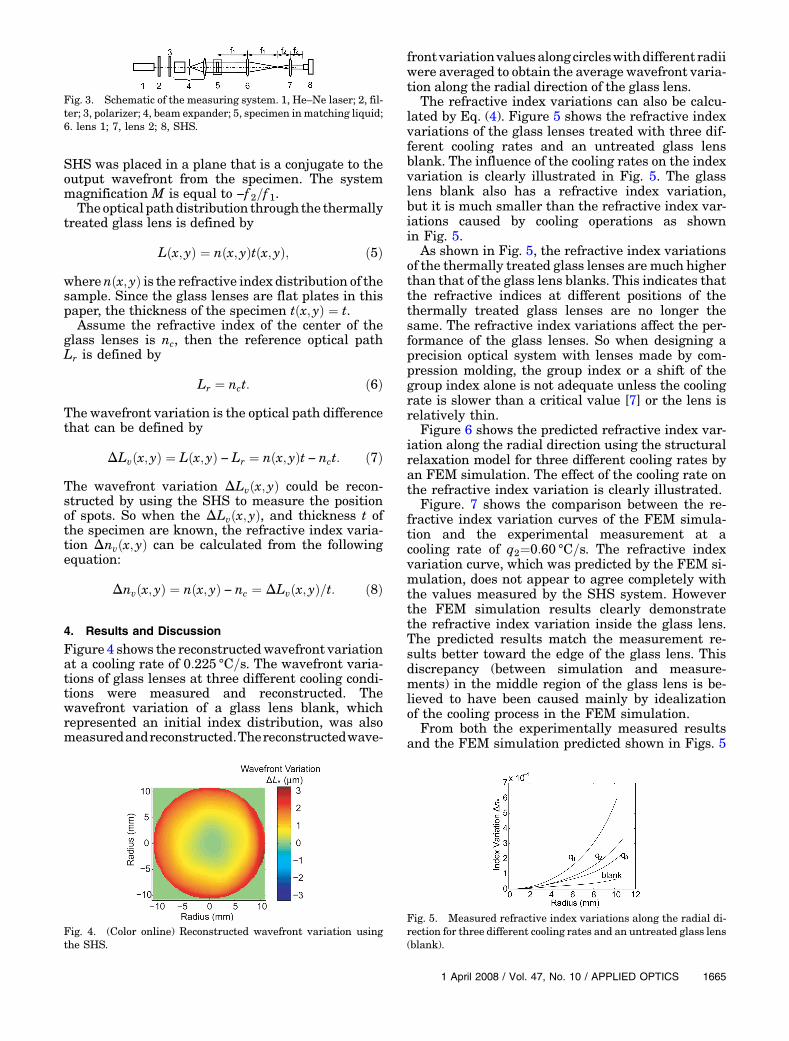
Figure 4 shows the reconstructedwavefront variationat a cooling rate of 0:225 °C=s. The wavefront varia-tions of glass lenses at three different cooling condi-tions were measured and reconstructed. Thewavefront variation of a glass lens blank, whichrepresented an initial index distribution, was alsomeasuredandreconstructed.Thereconstructedwave-
frontvariationvaluesalongcircleswithdifferent radiiwere averaged to obtain the average wavefront varia-tion along the radial direction of the glass lens.
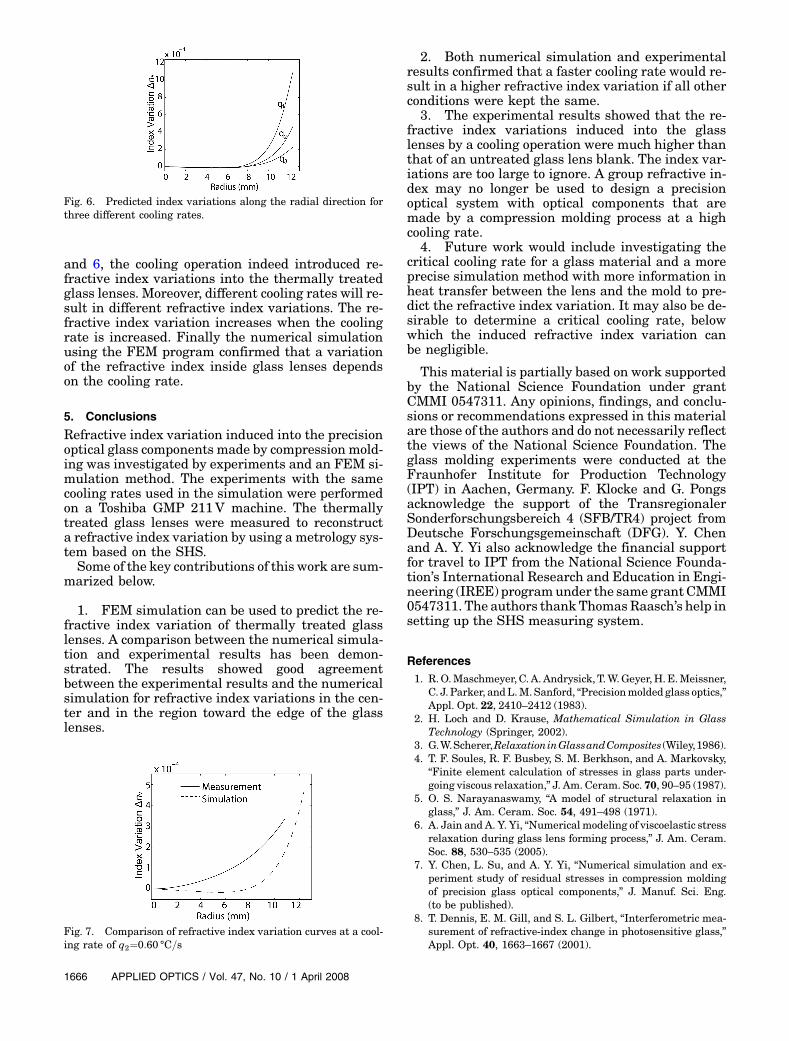
The refractive index variations can also be calcu-lated by Eq. (4). Figure 5 shows the refractive indexvariations of the glass lenses treated with three dif-ferent cooling rates and an untreated glass lensblank. The influence of the cooling rates on the indexvariation is clearly illustrated in Fig. 5. The glasslens blank also has a refractive index variation,but it is much smaller than the refractive index var-iations caused by cooling operations as shownin Fig. 5.
As shown in Fig. 5, the refractive index variationsof the thermally treated glass lenses are much higherthan that of the glass lens blanks. This indicates thatthe refractive indices at different positions of thethermally treated glass lenses are no longer thesame. The refractive index variations affect the per-formance of the glass lenses. So when designing aprecision optical system with lenses made by com-pression molding, the group index or a shift of thegroup index alone is not adequate unless the coolingrate is slower than a critical value [7] or the lens isrelatively thin.
Figure 6 shows the predicted refractive index var-iation along the radial direction using the structuralrelaxation model for three different cooling rates byan FEM simulation. The effect of the cooling rate onthe refractive index variation is clearly illustrated.
Figure. 7 shows the comparison between the re-fractive index variation curves of the FEM simula-tion and the experimental measurement at acooling rate of q2¼0:60 °C=s. The refractive indexvariation curve, which was predicted by the FEM si-mulation, does not appear to agree completely withthe values measured by the SHS system. Howeverthe FEM simulation results clearly demonstratethe refractive index variation inside the glass lens.The predicted results match the measurement re-sults better toward the edge of the glass lens. Thisdiscrepancy (between simulation and measure-ments) in the middle region of the glass lens is be-lieved to have been caused mainly by idealizationof the cooling process in the FEM simulation.
From both the experimentally measured resultsand the FEM simulation predicted shown in Figs. 5
and 6, the cooling operation indeed introduced re-fractive index variations into the thermally treatedglass lenses. Moreover, different cooling rates will re-sult in different refractive index variations. The re-fractive index variation increases when the coolingrate is increased. Finally the numerical simulationusing the FEM program confirmed that a variationof the refractive index inside glass lenses dependson the cooling rate.
5. Conclusions
Refractive index variation induced into the precisionoptical glass components made by compression mold-ing was investigated by experiments and an FEM si-mulation method. The experiments with the samecooling rates used in the simulation were performedon a Toshiba GMP 211V machine. The thermallytreated glass lenses were measured to reconstructa refractive index variation by using a metrology sys-tem based on the SHS.Some of the key contributions of this work are sum-
marized below.
1. FEM simulation can be used to predict the re-fractive index variation of thermally treated glasslenses. A comparison between the numerical simula-tion and experimental results has been demon-strated. The results showed good agreementbetween the experimental results and the numericalsimulation for refractive index variations in the cen-ter and in the region toward the edge of the glasslenses.
2. Both numerical simulation and experimentalresults confirmed that a faster cooling rate would re-sult in a higher refractive index variation if all otherconditions were kept the same.
3. The experimental results showed that the re-fractive index variations induced into the glasslenses by a cooling operation were much higher thanthat of an untreated glass lens blank. The index var-iations are too large to ignore. A group refractive in-dex may no longer be used to design a precisionoptical system with optical components that aremade by a compression molding process at a highcooling rate.
4. Future work would include investigating thecritical cooling rate for a glass material and a moreprecise simulation method with more information inheat transfer between the lens and the mold to pre-dict the refractive index variation. It may also be de-sirable to determine a critical cooling rate, belowwhich the induced refractive index variation canbe negligible.
This material is partially based on work supportedby the National Science Foundation under grantCMMI 0547311. Any opinions, findings, and conclu-sions or recommendations expressed in this materialare those of the authors and do not necessarily reflectthe views of the National Science Foundation. Theglass molding experiments were conducted at theFraunhofer Institute for Production Technology(IPT) in Aachen, Germany. F. Klocke and G. Pongsacknowledge the support of the TransregionalerSonderforschungsbereich 4 (SFB/TR4) project fromDeutsche Forschungsgemeinschaft (DFG). Y. Chenand A. Y. Yi also acknowledge the financial supportfor travel to IPT from the National Science Founda-tion’s International Research and Education in Engi-neering (IREE) programunder the same grantCMMI0547311. The authors thankThomasRaasch’s help insetting up the SHS measuring system.
References1. R.O.Maschmeyer, C. A. Andrysick, T.W.Geyer,H.E.Meissner,
C. J. Parker, andL.M. Sanford, “Precisionmolded glass optics,”Appl. Opt. 22, 2410–2412 (1983).
2. H. Loch and D. Krause, Mathematical Simulation in GlassTechnology (Springer, 2002).
3. G.W.Scherer,RelaxationinGlassandComposites (Wiley,1986).4. T. F. Soules, R. F. Busbey, S. M. Berkhson, and A. Markovsky,
“Finite element calculation of stresses in glass parts under-going viscous relaxation,” J. Am. Ceram. Soc. 70, 90–95 (1987).
5. O. S. Narayanaswamy, “A model of structural relaxation inglass,” J. Am. Ceram. Soc. 54, 491–498 (1971).
6. A. Jain and A. Y. Yi, “Numerical modeling of viscoelastic stressrelaxation during glass lens forming process,” J. Am. Ceram.Soc. 88, 530–535 (2005).
7. Y. Chen, L. Su, and A. Y. Yi, “Numerical simulation and ex-periment study of residual stresses in compression moldingof precision glass optical components,” J. Manuf. Sci. Eng.(to be published).
8. T. Dennis, E. M. Gill, and S. L. Gilbert, “Interferometric mea-surement of refractive-index change in photosensitive glass,”Appl. Opt. 40, 1663–1667 (2001).
Fig. 7. Comparison of refractive index variation curves at a cool-ing rate of q2¼0:60 °C=s
Fig. 6. Predicted index variations along the radial direction forthree different cooling rates.
9. S. A. Alexandrov and I. V. Chenyh, “Interference method fordetermination of refractive index and thickness,” Opt. Eng.39, 2480–2486 (2000).
10. H. Maruyama, S. Inoue, T. Mitsuyama, M. Ohmi, and M.Haruna, “Low-coherence interferometer system for the si-multaneous measurement of refractive index and thickness,”Appl. Opt. 41, 1315–1322 (2002).
11. G. Coppola, P. Ferraro, M. Iodice, and S. D. Nicola, “Methodfor measuring the refractive index and the thickness of trans-parent plates with a lateral-shear, wavelength-scanninginterferometer,” Appl. Opt. 42, 3882–3887 (2003).
12. M. Ohmi, H. Nishi, Y. Konishi, Y. Yamada, and M. Haruna“High-speed simultaneous measurement of refractive indexand thickness of transparent plates by low-coherence inter-ferometry and confocal optics,” Meas. Sci. Technol., 15,1531–1535 (2004).
13. B. C. Platt and R. Shack, “Lenticular Hartmann-screen,” Opt.Sci. Cent. Newsl. Univ. Ariz. 5, 15–16 (1971).
14. B. C. Platt and R. Shack, “History and principles of Shack–Hartmann wavefront sensing,” J. Refract. Surg. 17, 573–577 (2001).
15. B. M. Welsh, B. L. Ellerbroek, M. C. Roggemann, andT. L. Pennington, “Fundamental performance comparison ofa Hartmann and shearing interferometer wave-front sensor,”Appl. Opt. 34, 4186–4195 (1995).
16. J. A. Koch, R. W. Presta, R. A. Sacks, R. A. Zacharias, E. S.Bliss, M. J. Dailey, M. Feldman, A. A. Grey, F. R. Holdener,
J. T. Salmon, L. G. Seppala, J. S. Toeppen, L. V. Atta, B. M.V. Wonterghem, W. T. Whistler, S. E. Winter, and B. W. Woods,“Experimental comparison of a Shack–Hartmann sensor anda phase-shifting interferometer for large-optics metrology ap-plications,” Appl. Opt. 39, 4540–4546 (2000).
17. H. N. Ritland, “Relation between refractive index and densityof a glass at a constant temperature,” J. Am. Ceram. Soc. 3886–88 (1955).
18. G. Joos, “Change of refractive index, density, and molecularrefraction in tempering of glasses,” Optik (Jena) 1, 320–323 (1946).
19. A. Jain, “Experimental Study andNumerical Analysis of Com-pression Molding Process for Manufacturing Precision Asphe-rical Glass Lenses,” Ph. D. dissertation (The Ohio StateUniversity, 2006).
20. A. Y. Yi, “Optical fabrication,” in The Optics Encyclopedia, T.G. Brown, K. Kreath, H. Kogelnik, M. A. Kriss, J. Schmit, andM. J. Weber, eds. (Academic, 2003), pp. 1945–1959.
21. A. Y. Yi and A. Jain, “Compression molding of aspherical glasslenses—a combined experimental and numerical analysis,” J.Am. Ceram. Soc., 88, 579–586 (2005)
22. A. Y. Yi, Y. Chen, F. Klocke, G. Pongs, A. Demmer, D. Grewell,and A. Benatar, “A high volume precision compression mold-ing process of glass diffractive optics by use of micromachinedfused silica wafer mold and low Tg optical glass,” J. Micro-mech. Microeng. 16, 2000–2005 (2006).