+ All Categories
Home > Documents > Regi Regional Focusonal Focus - European Commission...

Regi Regional Focusonal Focus - European Commission...

Date post: 03-May-2018
Category:
Upload: hoangngoc
View: 214 times
Download: 0 times
Share this document with a friend
10
1 The European regional Human Development and Human Poverty Indices n° 02/2011 1. Introduction This Regional Focus analyses the regional Human Development Index (HDI) and Human Poverty Index (HPI) as published in the Fifth Cohesion Report (EC 2010). They are based on a slight variation of the methodology developed by the United Nations Development Programme (UNDP). This Regional Focus shows that a high level of human development is no guarantee of a low level of human poverty or vice versa. Several regions in the UK, Spain, France, Belgium and Italy combine a high level of human development with a high level of human poverty. Estonia, Slovenia, the Czech Republic, Slovakia and Poland show that a low level of human development can still be combined with a low level of human poverty. The three Nordic Member States as well as Germany, Austria and the Netherlands are most successful at combining a high level of human development with a low level of human poverty. Many regions in Portugal, Spain, Italy, Greece, Romania, Bulgaria and Hungary scored poorly on both indices (see Map 4). This paper is structured as follows: first, the description of the United Nations (UN) national HDI and HPI indicators; second, the results of the application to European regions; third, the conclusions which can be drawn from this analysis. The detailed methodology and indicator definition is included in the annex. The data can be downloaded here: https://circabc.europa. eu/d/a/workspace/SpacesStore/16b1d1b9-5f7b-4a3b-b60a- 6fa35187bed5/hdi_hpi.xls 2. The United Nations Development Programme Approach 2.1. Human Development Index Since 1990, the United Nations Development Programme (UNDP) has calculated the HDI and included it in its Human Development Report. It measures the average achievements in three basic dimensions: a long and healthy life, access to knowledge and a decent standard of living. It underlines the multidimensional nature of development in the policy debate by going beyond the traditional economic perspective based on GDP or income (Sagar and Najam 1998). The HDI emphasises that aspects other than economic activities and their growth (namely GDP and its growth rate) are important for development, including life expectancy, literacy and enrolment rates. This approach argues that income, commodities and wealth are means to an end. They do not constitute a direct measure of the living standard itself. Development should benefit people, and therefore should consider the life that people lead: their achievements, freedoms and capabilities (Anand and Sen 1994). GDP per head fails to capture some basic features of people's standards of living, as well as the quality and quantity of public and publicly-provided goods and amenities. However, looking at HDIs in Europe from a global perspective reveals little variation in Europe. For example, in 2009, HDIs 1 for all EU Member States were classified as 'high or very high human development' 2 . Furthermore, within the EU, the HDI is highly correlated with GDP per head; primarily because literacy, enrolment and life expectancy are all high compared to the rest of the world. A series of short papers on regional research and indicators produced by the Directorate-General for Regional Policy By Rocco L. Bubbico and Lewis Dijkstra 1 Based on 2007 data. 2 With the new 2010 methodology, all EU Member States are classified as 'very high human development' with the exception of Bulgaria ('high human development'). Regional Focus Regional Focus Contents 1. Introduction......................................................................................................... 1 2. The United Nations Development Programme Approach ............................................................................................................... 1 3. Regional Human Development and Poverty in Europe .......... 3 4. Conclusions.......................................................................................................... 8 5. Methodology ...................................................................................................... 8 References.......................................................................................................... 10
Transcript

1

The European regional Human Development and Human Poverty Indices

n° 02/2011

1.Introduction

ThisRegionalFocusanalysestheregionalHumanDevelopmentIndex(HDI)andHumanPoverty Index(HPI)aspublished intheFifthCohesionReport(EC2010).TheyarebasedonaslightvariationofthemethodologydevelopedbytheUnitedNationsDevelopmentProgramme(UNDP).

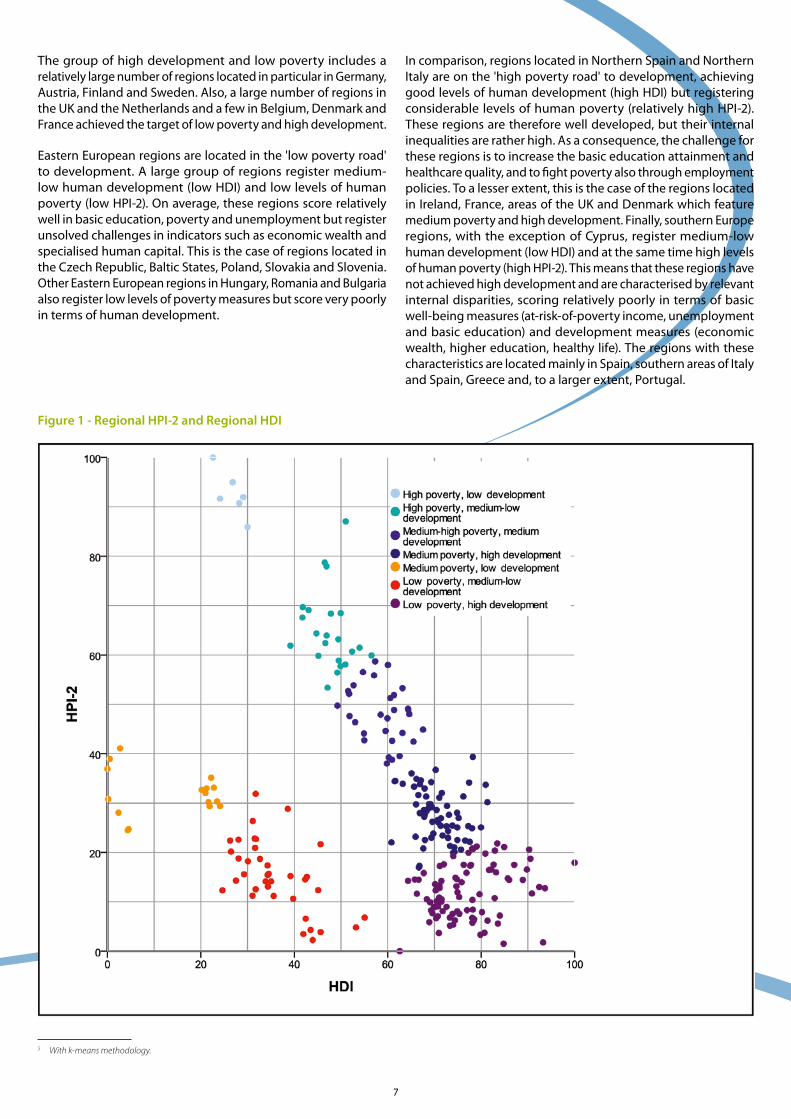
ThisRegionalFocusshowsthatahighlevelofhumandevelopmentisnoguaranteeofalowlevelofhumanpovertyorviceversa.Several regions in the UK, Spain, France, Belgium and Italycombineahighlevelofhumandevelopmentwithahighlevelofhumanpoverty.Estonia,Slovenia,theCzechRepublic,SlovakiaandPolandshowthatalowlevelofhumandevelopmentcanstillbecombinedwithalowlevelofhumanpoverty.ThethreeNordic Member States as well as Germany, Austria and theNetherlandsaremostsuccessfulatcombiningahighlevelofhumandevelopmentwithalowlevelofhumanpoverty.ManyregionsinPortugal,Spain,Italy,Greece,Romania,BulgariaandHungaryscoredpoorlyonbothindices(seeMap4).

Thispaperisstructuredasfollows:first,thedescriptionoftheUnitedNations(UN)nationalHDIandHPIindicators;second,theresultsoftheapplicationtoEuropeanregions;third,theconclusionswhichcanbedrawnfromthisanalysis.Thedetailedmethodologyandindicatordefinitionisincludedintheannex.

The data can be downloaded here: https://circabc.europa.eu/d/a/workspace/SpacesStore/16b1d1b9-5f7b-4a3b-b60a-6fa35187bed5/hdi_hpi.xls

2.TheUnitedNationsDevelopmentProgrammeApproach

2.1. Human Development Index

Since1990,theUnitedNationsDevelopmentProgramme(UNDP)hascalculatedtheHDIandincludeditinitsHumanDevelopmentReport.Itmeasurestheaverageachievementsinthreebasicdimensions:alongandhealthylife,accesstoknowledgeandadecentstandardofliving.ItunderlinesthemultidimensionalnatureofdevelopmentinthepolicydebatebygoingbeyondthetraditionaleconomicperspectivebasedonGDPorincome(SagarandNajam1998).TheHDIemphasisesthataspectsotherthaneconomicactivitiesandtheirgrowth(namelyGDPanditsgrowthrate)areimportantfordevelopment,includinglifeexpectancy,literacyandenrolmentrates.

Thisapproacharguesthatincome,commoditiesandwealtharemeanstoanend.Theydonotconstituteadirectmeasureofthelivingstandarditself.Developmentshouldbenefitpeople,andthereforeshouldconsiderthelifethatpeoplelead:theirachievements,freedomsandcapabilities(AnandandSen1994).GDPperheadfailstocapturesomebasicfeaturesofpeople'sstandardsofliving,aswellasthequalityandquantityofpublicandpublicly-providedgoodsandamenities.

However,lookingatHDIsinEuropefromaglobalperspectiverevealslittlevariationinEurope.Forexample,in2009,HDIs1forallEUMemberStateswereclassifiedas'highorveryhighhumandevelopment'2.Furthermore,withintheEU,theHDIishighlycorrelatedwithGDPperhead;primarilybecauseliteracy,enrolmentandlifeexpectancyareallhighcomparedtotherestoftheworld.

AseriesofshortpapersonregionalresearchandindicatorsproducedbytheDirectorate-GeneralforRegionalPolicy

By Rocco L. Bubbico and Lewis Dijkstra

1 Based on 2007 data.2 With the new 2010 methodology, all EU Member States are classified as 'very high human development' with the exception of Bulgaria ('high human development').

Regional FocusRegional Focus

Contents1. Introduction .........................................................................................................1

2. The United Nations Development Programme Approach ...............................................................................................................1

3. Regional Human Development and Poverty in Europe ..........3

4. Conclusions ..........................................................................................................8

5. Methodology ......................................................................................................8

References ..........................................................................................................10

2

3 For instance, the 2010 version introduces relevant changes in the calculation of HDI.

TheHDIhassparkedadebateontheappropriatemethodology,thelimitationsandsignificanceofasyntheticindicator,andthelackofrelevantdataanditstechnicalqualities(Noorbakhsh1998).Yet,theHDIhasbeenacceptedasarelevantindicatorofhumandevelopment,inpartthankstoconstantmethodologicalrefinements3.Nevertheless,asingleindexcannotsynthesisethefullspectrumofhumandevelopmentissues(Streeten1994),whichiswhyanothermeasuresuchastheHumanPovertyIndexwasadded.

2.2. Human Poverty Index

The1997HumanDevelopmentReportintroducedanindexofpoverty(HumanPovertyIndex-HPI).WhiletheHDIfocusesontheaverageofthreedimensionsofwell-being,theHPItargetsthedistributionofdimensionsofqualityoflife.Itcapturesthedisparitiesinasocietybyfocussingonpeoplewithalowerlifeexpectancy,lowerincome,loweducationandthelong-termunemployed.Furthermore,theformulausedtoaggregatethesefourissuespenalisescountrieswithhighvaluesforonedimension.Ifasimpleaveragewasused,acountrywith5%foreachofthefourdimensionswouldscorethesameasacountrywith37%forlowlifeexpectancy,but1%forthethreeotherdimensions.Theformulausedheregivehigherweightstoextremescores,givingthecountrywith5%forallfourdimensionsabetterscoreforhumanpovertythanthecountrywithanextremevalueforonedimension.

Map 1 - 2009 Human Development Index

3

3.RegionalHumanDevelopmentandPovertyinEurope

DespitetheveryhighHDIscoresinEurope,thereissignificantvariationbetweenEUcountriesandregionsintermsofhumandevelopment and poverty (see EC 2010). For instance, loweducationattainmentinEuropeanregionsrangesfrom3.3%to81.4%4;healthylifeexpectancyrangesbetween52and78years.TogainabetterperspectiveofregionaldisparitieswithintheEU,anEUregionalHDIandHPIwascalculatedwithamodifiedsetofindicators(seeannex).

3.1. EU regional human development

TheregionswithahighHDIareconcentratedinsouthernEngland,southernGermany,theNetherlands,ScotlandandSweden(seeMap1).AllFrenchregions,exceptPicardieandCorse,areabovetheEUaverage.MostEU-12regionsandthoseinPortugal,GreeceandItalyhaveanHDIbelowtheEUaverage,exceptPraha(CZ),Attiki(EL)andfourItalianregions.InSpain,eightregionsarebelowandeightabovetheEUaverage,withhighscoresinMadrid,NavarraandPaisVasco.

Thetop10HDIregionsincludefiveEnglishregions,thecapitalcityregionsofSwedenandFrance,andtworegionssurroundingBrussels(seeMap1).AlthoughtheEUregionalHDIiscorrelatedwithGDP,onlyafewregionsregisterhighlevelsofbothGDPperheadandHDI.Ofthetop10regions,onlythreeappearinthetop10basedonGDPperhead.ThefirstinbothrankingsofHDIandGDPpercapitaisInnerLondon.However,thesecondregionintheHDIranking(Surrey,EastandWestSussex,UK)isonly45thintherankingofGDPpercapitainEurope.Similarly,OuterLondonis8thforHDIand95thforGDP.

3.2. EU human poverty

Thehighestlevelsofhumanpoverty(HPI-2)areregisteredinsouthernEurope,inparticularinPortugal,Spain,Italy,GreeceandMalta(seeMap2).Thelowestlevelsofhumanpovertycanbefoundinhighly,moderatelyandlessdevelopedMemberStates–inparticularintheCzechRepublic,Sweden,Germany,SloveniaandSlovakia.Humanpovertyiscloselycorrelatedwithloweducationattainment,whichisthemostcommonsourceofalowHPI-2score.HPI-2isalsopositivelycorrelatedwithat-risk-of-povertyincome.

Thetop10HPI-2regionsincludesixPortugueseregions,Malta,twoSpanishregions(CeutaandExtremadura)andoneItalianregion (Campania). All these regions, except Campania, arealsointhetop10intermsofloweducationattainment.Ceuta,ExtremaduraandCampaniaarethetopthreeintermsofat-risk-of-povertyincome.

The10regionswiththelowestlevelofHPI-2includefiveCzechregions,threeSwedishregions,oneAustrianandoneGerman.Fouroftheseregionsareamongthosewiththe10lowestat-risk-of-povertyincomerates,whilethreeregionsareamongthosewiththe10lowestsharesofpeoplewithaloweducationattainment.

Long-termunemploymenthas,instead,nocorrelationwiththeperformanceinHPI-2.The10regionswiththehighestlong-termunemploymentconsistoftwoSlovakregions,sixGermanregions,BrusselsandCeuta(ES).Onlyoneoftheseregions(Ceuta)isalsoamongthe10regionswiththehighestHPI-2.

RegionsperformingsignificantlybetterinGDPperheadthaninHDIarecapitalregionssuchasPraha(CZ),Bratislava(SK)andBrussels(BE).Thismaybepartiallyduetocommuting,whichinflatesGDPperheadfigures.Ifthemoreaffluentprefertoliveoutsidethecapitalregion,thiswouldalsoexplainapartofthegapbetweenGDPperhead(basedonwherepeoplework)andnetadjustedhouseholdincome(basedonwherepeoplelive).

Thebottom10regionsforHDIcomprisesevenregionsinRomania,twoinHungaryandoneinBulgaria.Halfofthemarealsointhebottom10regionsintermsofGDPperhead.

4 Population aged 25-64, year 2007.

4

Map 2 - Human Development Index at NUTS 2 level

5

Map 3 - Human Poverty Index-2 at NUTS 2 level

6

3.3. Combining human development and poverty scores

TheregionalHPIandHDIareonlyweaklycorrelated.Onlyafewregionsscoreparticularlywellonboth,suchasStockholm,orpoorlyonboth,suchasAçores.Alargenumberofregionscombineahighscoreononeindexandalowoneontheother.SomeexamplesareBrussels,Luxembourg,NavarraandPaisVasco,wheretheHumanPovertyIndexismuchhigherthantheHumanDevelopmentIndexwouldimply.

Figure1reportsthedistributionofregionsbyHDIandHPI-2,showingtwocleardifferentiatedroadstotheidealsituationofhighdevelopmentandlowpoverty:a'highpovertyroad',withrelativelyhighHPI-2incomparisontoHDIlevels,anda'lowpovertyroad',withrelativelylowHPI-2incomparisontoHDI.Aclusteranalysishasbeenconductedtoidentifygroupswithcommoncharacteristicsanddifferentlevelsofpovertyanddevelopment5,alsomappedinmap4.

Map 4 - Regional HDI and HPI-2

7

ThegroupofhighdevelopmentandlowpovertyincludesarelativelylargenumberofregionslocatedinparticularinGermany,Austria,FinlandandSweden.Also,alargenumberofregionsintheUKandtheNetherlandsandafewinBelgium,DenmarkandFranceachievedthetargetoflowpovertyandhighdevelopment.

EasternEuropeanregionsarelocatedinthe'lowpovertyroad'todevelopment.Alargegroupofregionsregistermedium-lowhumandevelopment(lowHDI)andlowlevelsofhumanpoverty(lowHPI-2).Onaverage,theseregionsscorerelativelywellinbasiceducation,povertyandunemploymentbutregisterunsolvedchallengesinindicatorssuchaseconomicwealthandspecialisedhumancapital.ThisisthecaseofregionslocatedintheCzechRepublic,BalticStates,Poland,SlovakiaandSlovenia.OtherEasternEuropeanregionsinHungary,RomaniaandBulgariaalsoregisterlowlevelsofpovertymeasuresbutscoreverypoorlyintermsofhumandevelopment.

Incomparison,regionslocatedinNorthernSpainandNorthernItalyareonthe'highpovertyroad'todevelopment,achievinggoodlevelsofhumandevelopment(highHDI)butregisteringconsiderablelevelsofhumanpoverty(relativelyhighHPI-2).Theseregionsarethereforewelldeveloped,buttheirinternalinequalitiesareratherhigh.Asaconsequence,thechallengefortheseregionsistoincreasethebasiceducationattainmentandhealthcarequality,andtofightpovertyalsothroughemploymentpolicies.Toalesserextent,thisisthecaseoftheregionslocatedinIreland,France,areasoftheUKandDenmarkwhichfeaturemediumpovertyandhighdevelopment.Finally,southernEuroperegions,withtheexceptionofCyprus,registermedium-lowhumandevelopment(lowHDI)andatthesametimehighlevelsofhumanpoverty(highHPI-2).Thismeansthattheseregionshavenotachievedhighdevelopmentandarecharacterisedbyrelevantinternaldisparities,scoringrelativelypoorlyintermsofbasicwell-beingmeasures(at-risk-of-povertyincome,unemploymentandbasiceducation)anddevelopmentmeasures(economicwealth,highereducation,healthylife).TheregionswiththesecharacteristicsarelocatedmainlyinSpain,southernareasofItalyandSpain,Greeceand,toalargerextent,Portugal.

Figure 1 - Regional HPI-2 and Regional HDI

5 With k-means methodology.

8

OneofthemainreasonsforthedifferenceinthetwoindicesisthattheHDIisbasedonapercapitaaverageofanabsolutemeasureofincome(netadjustedhouseholdincome),whileHPI-2includesarelativemeasure(theportionofpopulationbelowthenationalpovertythreshold).Accordingly,aregionwithanunequaldistributionofahighlevelofincomecanhavebothahighaveragelevelofhumandevelopmentandahighlevelofpoverty.Aregionwithlowincome,butrelativelyequaldistributionofit,willhavealowHDIandalowHPI-2.

The increases in average income in the five less developedcountriesdid,infact,leadtohigherlevelsoflifesatisfactionandhappiness,despitetheat-risk-of-povertyrateremainingunchanged.Itcouldbeargued,therefore,thatimprovingwell-being,especiallyinlessdevelopedMemberStatesdependsonimprovingthefactorsbehindtheHDIandotherabsolutemeasuresofwell-being.Relativemeasuresofpovertyaddnuanceandcanguidepolicychoicesinsituationswherecircumstancesaresimilar.Forexample,inregionswithsimilarlevelsofHDI,averagewell-beingislikelytobehigherintheregionwithalowerHPI-2.Relativemeasures,however,aredifficulttocompareinradicallydifferentsituations.Forexample,StockholmandBratislavahaveaverysimilarHPI-2,yetresidentsinStockholmreportbeingmuchmoresatisfiedwiththeirlifeandhappierthanthoseinBratislava(EC2010).

4.Conclusions

ThispaperhashighlightedthewidevarietyofhumandevelopmentwithinEuropeanditsregions.Fromaglobalperspective,Europeappearstobeuniformlyhighlydeveloped.Bynarrowingdowntheanalysis,awidevarietyofhumandevelopmentlevelsemergeacrossandwithinEuropeancountries,targetingbothelementsforoverallwell-being(HDI)andthedistributionoftheseelementsacrosssociety(HPI-2).Fromapolicyperspective,theanalysisshowsthatmostEuropeanregionsfacechallengesintheareaofhumandevelopmentorpoverty.Inlessdevelopedregions,improvementsintheHDIcanhaveastrongimpactonwell-being,whileinthemoredevelopedregionsareductioninHPI-2andinequalitiesismorelikelytoincreasetheoverallwell-being.

5.Methodology

5.1. UNDP methodology for Human Development Index (HDI)

The 2009 methodology for HDI is to take the average ofthreenormalisedindices,oneineach'dimension'ofhumandevelopment.Theseindices(Life,EducationandIncome)measurethe achievements in each area, considering the followingindicators:

• Lifeexpectancyatbirth;

• Knowledgeandeducation(combiningadultliteracyrateandtotalgrossenrolmentratio);

• GDPpercapita(PPPUS$).

Theformulausedisthefollowing:

(1)

Wherethesub-indexofeducationisthecombinationofgrossenrolmentandliteracyrates,asshowninthefollowingformula:

= 1/3 ( ) + 2/3 ( ) (2)

Eachsub-index(I)isnormalisedtakingintoaccounttheminimumandmaximumvalueobserved:

(3)

TheincomeindicatorofGDPperheadistransformedthroughthenaturallogarithmoftheactualminimumandmaximumvaluesused.

Theindexhasavaluebetween0and100,where0isequaltolowlevelsofhumandevelopmentand100tohighlevelsofhumandevelopment.

5.2. EU methodology for regional HDI

Thisindexisthemeanofthenormaliseddimensionsub-indiceswhicharecalculatedthroughtheformula(6)andiscalculatedinthesamewayastheUNDPHDI:

(6)

TheindicatorsconsideredfortheregionalHDIare:yearsofhealthylifeexpectancy;netadjusteddisposablehouseholdincomepercapita6(asanindexofEU-27average);lowandhigheducationattainmentforpeopleaged25–64(%ofpopulation25-64withlowand%withhigheducationattainment). Inparticular, iscombinedasshownbelow.

= 1/3 (1- ) + 2/3 ( ) (7)

AllindicatorsareavailableatNUTS2levelfor2007andpublishedbyEurostatoraretheDirectorate-Generalforregionalpolicy(DGREGIO)estimatesbasedonEurostatdata.Thetwomain

6 These figures have been estimated using regional disposable household income figures and the difference between disposable household income and net adjusted disposable household income at the national level where available. For Romania, the difference between disposable and net adjusted disposable household income was not available. For Cyprus, Malta and Luxembourg, household income estimates from the 2nd European Quality of Life Survey have been used.

9

differenceswiththeUNDPindexare(1)theuseofthelowandhigheducationattainmentinsteadofliteracy,sincethelatterisnotavailableattheregionalleveland(2)theuseofnetadjustedhousehold income in the purchasing power consumptionstandard(PPCS)insteadofGDPinPPP.TheuseofnetadjustedhouseholdincomeinsteadofGDPperheadinPPSbringstheindicatorclosertothehouseholdperspectiveasadvocatedbytheStiglitz-Sen-Fitoussireport(2009).AsthedifferencesinnetadjustedhouseholdincomeintheEUareconsiderablysmallerthanGDPperheadworldwide,normalisationwithoutanaturallogarithmwasused.

Inordertoobtainvaluesbetween0and100,normalisationiscarriedoutfollowingtheformula:

(8)

5.3. UNDP methodology for Human Poverty Index 2 (HPI-2)

Theindexiscalculatedusingthefollowingformula7:

(9)

First, relatestosurvivalprobabilityandthelikelihoodofnotsurvivingtoage60.Second, correspondstobeing excluded from reading and communication, and ismeasuredbytheadultilliteracyrate.Finally, ismeasuredbythepercentageofthepopulationbelowtheincomepoverty line (50%ofmedianhouseholddisposableincome).Socialexclusionisthefourthdimensionoftheindex( LONG T UNEMPLOYMENT ) and is measured as the long-termunemploymentrate(over12months).Theindexisexpressedasapercentage,wherehigherpercentagesequalhigherlevelsofhumanpoverty.Inthe2010report,theHPIhasbeenreplacedbytheMultidimensionalPovertyIndex(MPI)whichincludesalargersetofstandardoflivingindicators.

5.4. EU methodology for regional HPI-2

TodeveloptheregionalHPI,thestartingpointhasbeentoadaptthemethodologybehindtheindexofdevelopedcountries(HPI-2).Inthiscase,thefollowingindicatorshavebeenconsidered:

• Probabilityofnotlivingto65atbirth( );

• Shareofpopulationaged25-64withloweducationattainment( );

• Shareofpopulationwithanat-risk-of-povertyincome,i.e.60% below the national median income after transfers( );

• Long-term unemployed as a share of the labour force( ).

AlltheindicatorsareavailableatNUTS2levelfortheyear2007andpublishedbyEurostat8.AlsointhiscasethedifferenceswiththeUNmethodologyarerelatedtothechoiceofavailableormoremeaningfulindicatorswithintheEUcontext.Inparticular,the

differencesare:ahigherthresholdforthelongevityprobabilityrate(65yearsinsteadof60);adifferentindicatorforloweducation(lowattainmentinsteadofilliteracy);andadifferentpovertyline(theat-risk-of-povertyincomeisequalto60%ofthenationalmedianinsteadof50%usedintheUNDPmethodology).TheformulaisidenticaltotheHPI-2formula(9).

Toobtainvaluesbetween0and100,normalisationiscarriedoutfollowingthesameformulausedfortheHDI(8).

Acknowledgements

The authors would like to thank Beatriz Torighelli, AngelaWinkelhorst,HugoPoelmanandCécileHuletfortheirsupportinthepreparationofthispaper.

References

Anand,S.,Sen,A.K.,Human Development Index: Methodology and Measurement,OccasionalPapers–HumanDevelopmentReportOffice,1994

Fifth report on economic, social and territorial cohesion,EuropeanCommission, 2010, available online at http://ec.europa.eu/regional_policy/sources/docoffic/official/reports/cohesion5/index_en.cfm

Sagar,A.D.,Najam,A.,'TheHumanDevelopmentIndex:acriticalreview',EcologicalEconomics,Volume25,Issue3,June1998,pp.249-264

Stiglitz,J.,Sen,A.K.,Fitoussi,J.,Report of the Commission on the measurement of economic performance and social progress,2009,availableonlineathttp://www.stiglitz-sen-fitoussi.fr/en/index.htm

Streeten,P., 'HumanDevelopment:Meansandends',American Economic Review,PapersandProceedings84,1994,pp.2132-2237

Human Development Report 1997,UNDP,1997,availableonlineathttp://hdr.undp.org/en/reports/global/hdr1997/

Human Development Report 2010,UNDP,2010,availableonlineathttp://hdr.undp.org/en/reports/global/hdr2010/chapters/en/

7 Calculating HPI is less complex than calculating HDI, since the indicators used are already expressed as percentages, so it is not necessary to create dimension indices for normalisation as for the HDI.8 The data is available for all NUTS 2 except French outermost regions;

Editor:EricVONBRESKA©EuropeanCommission,RegionalPolicyThetextsofthispublicationdonotbindtheCommission

Any questions, comments or contributions should be sent to the following address:

[email protected]

Consult this website for further information:http://ec.europa.eu/regional_policy/index_en.htm


Recommended