Region 7 Southwest Washington WDA – Clark, Cowlitz, Skamania and Wahkiakum Counties On the following pages, readers will find two bubble charts, one including a cluster labeled “Federal Electric Utilities,” and a second excluding this cluster which has a very high location quotient, but including the remaining clusters in this region bit with a more restricted scale for the location quotient dimension that permits readers to discern variations among the remaining clusters. The bubble chart for this region does not show federal electric utilities; this industry has an extremely high location quotient of nearly 72. Readers familiar with this region will recognize this “industry” as the Bonneville Power Administration and its Ross Complex located within the city limits of Vancouver, WA in Clark County. The Ross Complex is a major distribution facility for power generated at BPA dams; it also houses a research facility for testing and evaluating power distribution equipment. 1 The employment level in this sector is also large (1,565) but well below the largest clusters in this region. Going on to the clusters shown on the bubble chart for this region, construction and forest products are also prominent clusters, the two largest in the region, and forest products also has a high location quotient. Industrial machinery, semiconductors, and food products also have fairly high location quotients and each of these clusters employs more than 1,000 workers. Ambulatory health care, personal care, gambling and other entertainment, and auto rental are large industries with lower location quotients. Looking at the growth trends, we do not have a growth projection for the federal electric utilities sector. Forest products employment declined in recent years, and this trend is expected to continue in the years ahead. The construction cluster contracted in the immediate past but is projected to grow in the years ahead. Substantial expansion was seen in the service clusters (personal care, other ambulatory health care, and auto rental) in recent years, and expansion at a more modest pace is projected in the years ahead. Substantial expansion of the gambling and other entertainment cluster is projected. In this region, 7 of 9 clusters for which occupational data are available have a higher percentage of middle wage jobs, and 5 have a higher percentage of high wage jobs. The strategic value scores suggest that federal electric utilities and forest products are the highest value clusters. These two key clusters are followed by other ambulatory health care, industrial machinery, and semiconductors. This region is heavily dependent upon Forest Products activities, and these firms are highly clustered in the greater Kelso and Longview areas to the north, along Highway 4 to the northwest, and in the greater Vancouver area as well. Semiconductor and Service clusters are evident in the Vancouver region. Firms in the Manufacturing Specialties cluster and the Food Products cluster are relatively dispersed across the region. 1 See http://www.atsdr.cdc.gov/hac/PHA/bonneville/bpa_p1.html (October 2008). 1
Transcript
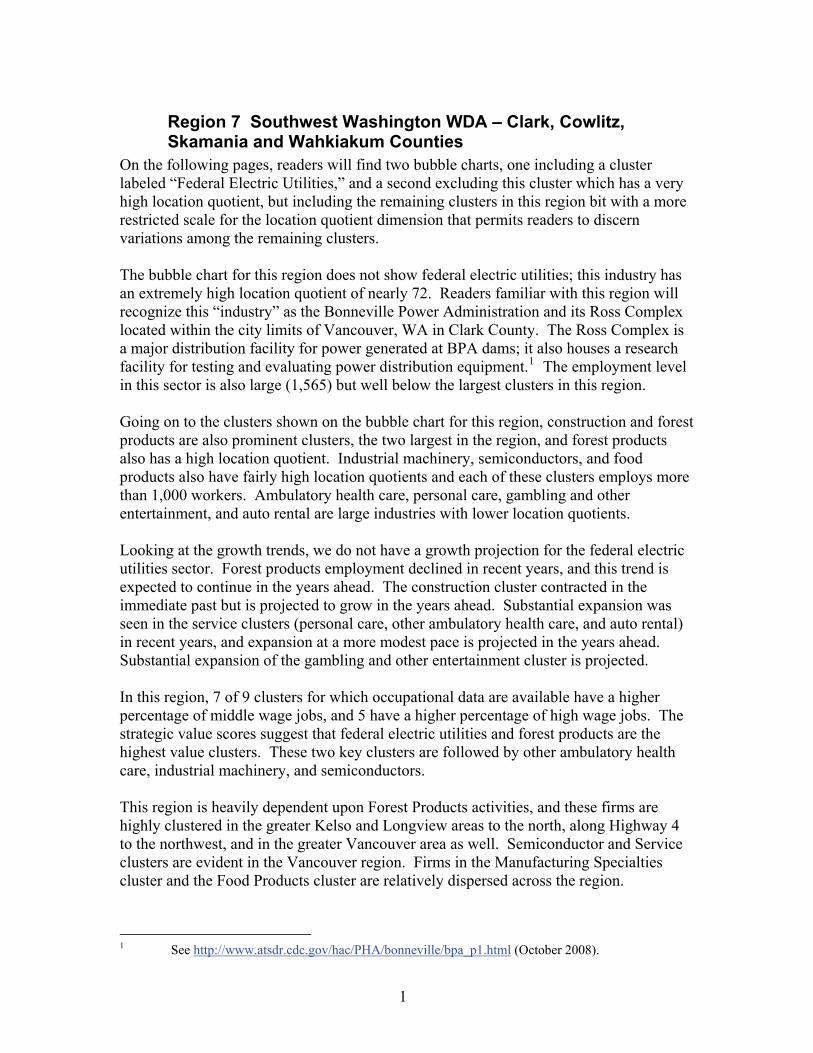
Region 7 Southwest Washington WDA – Clark, Cowlitz, Skamania and Wahkiakum Counties
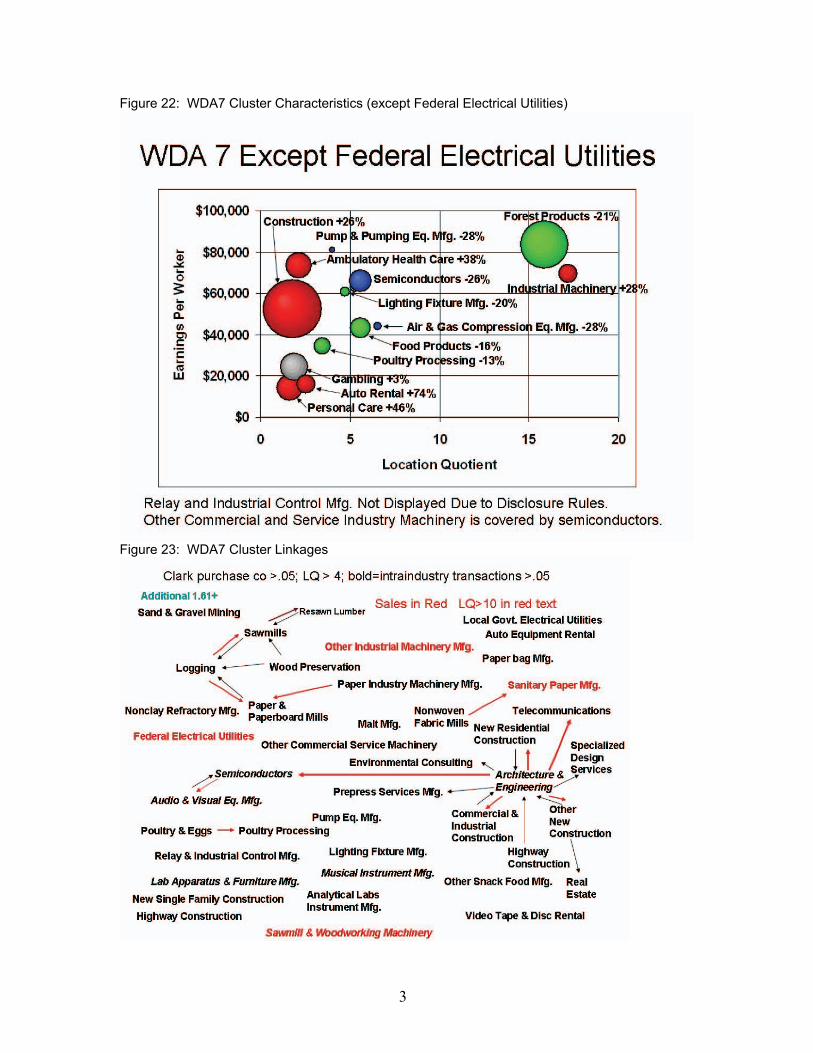
On the following pages, readers will find two bubble charts, one including a cluster labeled “Federal Electric Utilities,” and a second excluding this cluster which has a very high location quotient, but including the remaining clusters in this region bit with a more restricted scale for the location quotient dimension that permits readers to discern variations among the remaining clusters. The bubble chart for this region does not show federal electric utilities; this industry has an extremely high location quotient of nearly 72. Readers familiar with this region will recognize this “industry” as the Bonneville Power Administration and its Ross Complex located within the city limits of Vancouver, WA in Clark County. The Ross Complex is a major distribution facility for power generated at BPA dams; it also houses a research facility for testing and evaluating power distribution equipment.1 The employment level in this sector is also large (1,565) but well below the largest clusters in this region. Going on to the clusters shown on the bubble chart for this region, construction and forest products are also prominent clusters, the two largest in the region, and forest products also has a high location quotient. Industrial machinery, semiconductors, and food products also have fairly high location quotients and each of these clusters employs more than 1,000 workers. Ambulatory health care, personal care, gambling and other entertainment, and auto rental are large industries with lower location quotients. Looking at the growth trends, we do not have a growth projection for the federal electric utilities sector. Forest products employment declined in recent years, and this trend is expected to continue in the years ahead. The construction cluster contracted in the immediate past but is projected to grow in the years ahead. Substantial expansion was seen in the service clusters (personal care, other ambulatory health care, and auto rental) in recent years, and expansion at a more modest pace is projected in the years ahead. Substantial expansion of the gambling and other entertainment cluster is projected. In this region, 7 of 9 clusters for which occupational data are available have a higher percentage of middle wage jobs, and 5 have a higher percentage of high wage jobs. The strategic value scores suggest that federal electric utilities and forest products are the highest value clusters. These two key clusters are followed by other ambulatory health care, industrial machinery, and semiconductors. This region is heavily dependent upon Forest Products activities, and these firms are highly clustered in the greater Kelso and Longview areas to the north, along Highway 4 to the northwest, and in the greater Vancouver area as well. Semiconductor and Service clusters are evident in the Vancouver region. Firms in the Manufacturing Specialties cluster and the Food Products cluster are relatively dispersed across the region.
1 See http://www.atsdr.cdc.gov/hac/PHA/bonneville/bpa_p1.html (October 2008).
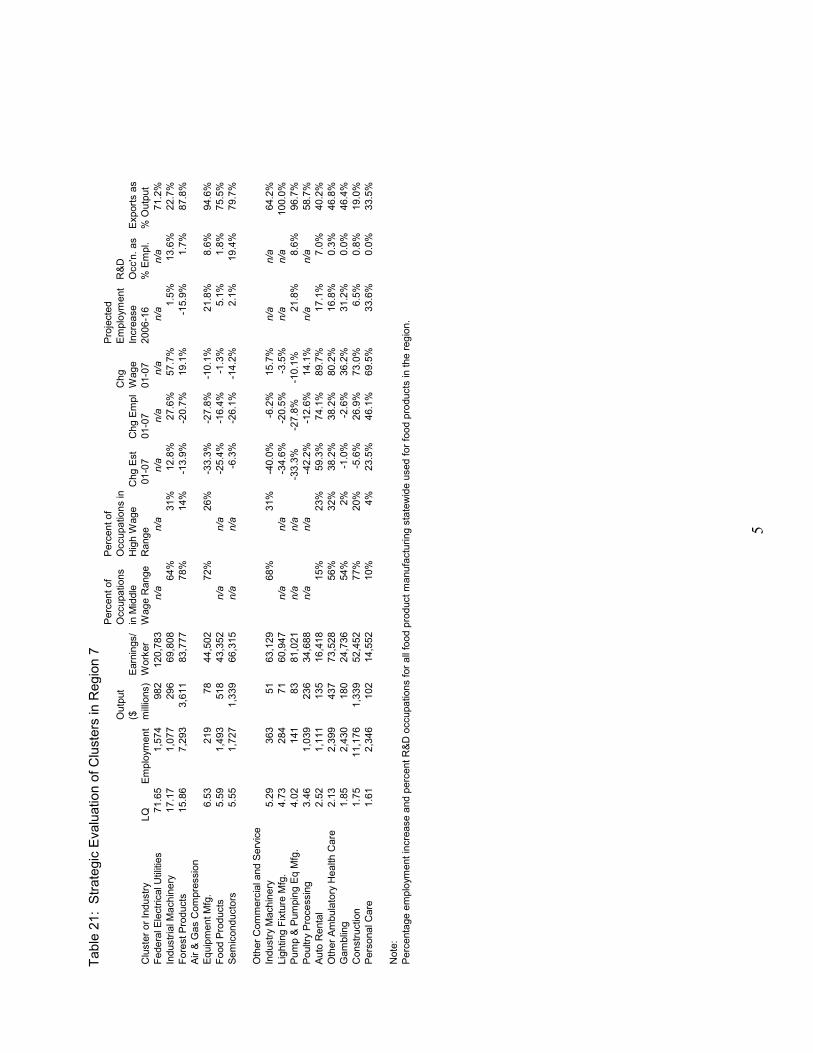
Note: Labels and change in employment for other sectors in WDA 7 are shown on the next figure.
2
Figure 22: WDA7 Cluster Characteristics (except Federal Electrical Utilities)
Figure 23: WDA7 Cluster Linkages
3
4
Table 19: Distribution of Occupational Median Wages in WDA 7 Wage Type Annual
Wages
Mean Wages $41,422
Pct25 Wages $23,649
Median Wages $33,754
Pct75 Wages $50,894
Table 20: Middle and High Wage Jobs by Cluster in WDA 7 Cluster All
EmploymentMiddle Wage Jobs
Percent Middle Wage Jobs
High Wage Jobs
Percent High Wage Jobs
Industrial Machinery 984 630 64% 301 31% Forest Products 7402 5785 78% 1057 14% Air & Gas Compression Equipment Mfg.
257 184 72% 68 26%
Other Commercial and Service Industry Machinery
2825 1921 68% 862 31%
Auto Rental 158 23 15% 36 23% Other Ambulatory Health Care 1882 1061 56% 608 32% Gambling 2711 1467 54% 46 2% Construction 4091 3169 77% 834 20% Personal Care 96 1003 10% 37 4% Cluster Total 20406 15243 75% 3849 19% All Industries 170994 89080 52% 38302 22% Clusters as % of All Industries
12% 17%
Tabl
e 21
: S
trate
gic
Eva
luat
ion
of C
lust
ers
in R
egio
n 7
Clu
ster
or I
ndus
tryLQ
Empl
oym
ent
Out
put
($
milli
ons)
Earn
ings
/ W
orke
r
Perc
ent o
f O
ccup
atio
ns
in M
iddl
e W
age
Ran
ge
Perc
ent o
f O
ccup
atio
ns in
H
igh
Wag
e R
ange
Chg
Est
01-
07C
hg E
mpl
01-0
7
Chg
W
age
01-0
7
Proj
ecte
d Em
ploy
men
t In
crea
se
2006
-16
R&D
O
cc'n
. as
% E
mpl
.Ex
ports
as
% O
utpu
tFe
dera
l Ele
ctric
al U
tiliti
es71
.65
1,57
4
98
2
120,
783
n/a
n/a
n/a
n/a
n/a
n/a
n/a
71.2
%In
dust
rial M
achi
nery
17.1
71,
077
296
69
,808
64%
31%
12.8
%27
.6%
57.7
%1.
5%13
.6%
22.7
%Fo
rest
Pro
duct
s15
.86
7,29
3
3,
611
83,7
77
78
%14
%-1
3.9%
-20.
7%19
.1%
-15.
9%1.
7%87
.8%
Air &
Gas
Com
pres
sion
Eq
uipm
ent M
fg.
6.53
219
78
44
,502
72%
26%
-33.
3%-2
7.8%
-10.
1%21
.8%
8.6%
94.6
%Fo
od P
rodu
cts
5.59
1,49
3
51
8
43,3
52
n/a
n/a
-25.
4%-1
6.4%
-1.3
%5.
1%1.
8%75
.5%
Sem
icon
duct
ors
5.55
1,72
7
1,
339
66,3
15
n/a
n/a
-6.3
%-2
6.1%
-14.
2%2.
1%19
.4%
79.7
%
Oth
er C
omm
erci
al a
nd S
ervi
ce
Indu
stry
Mac
hine
ry5.
2936
3
51
63,1
29
68
%31
%-4
0.0%
-6.2
%15
.7%
n/a
n/a
64.2
%Li
ghtin
g Fi
xtur
e M
fg.
4.73
284
71
60
,947
n/a
n/a
-34.
6%-2
0.5%
-3.5
%n/a
n/a
100.
0%Pu
mp
& Pu
mpi
ng E
q M
fg.
4.02
141
83
81
,021
n/a
n/a
-33.
3%-2
7.8%
-10.
1%21
.8%
8.6%
96.7
%Po
ultry
Pro
cess
ing
3.46
1,03
9
23
6
34,6
88
n/a
n/a
-42.
2%-1
2.6%
14.1
%n/a
n/a
58.7
%Au
to R
enta
l2.
521,
111
135
16
,418
15%
23%
59.3
%74
.1%
89.7
%17
.1%
7.0%
40.2
%O
ther
Am
bula
tory
Hea
lth C
are
2.13
2,39
9
43
7
73,5
28
56
%32
%38
.2%
38.2
%80
.2%
16.8
%0.
3%46
.8%
Gam
blin
g1.
852,
430
180
24
,736
54%
2%-1
.0%
-2.6
%36
.2%
31.2
%0.
0%46
.4%
Con
stru
ctio
n1.
7511
,176
1,
339
52,4
52
77
%20
%-5
.6%
26.9
%73
.0%
6.5%
0.8%
19.0
%Pe
rson
al C
are
1.61
2,34
6
10
2
14,5
52
10
%4%
23.5
%46
.1%
69.5
%33
.6%
0.0%
33.5
%
Not
e:Pe
rcen
tage
em
ploy
men
t inc
reas
e an
d pe
rcen
t R&D
occ
upat
ions
for a
ll fo
od p
rodu
ct m
anuf
actu
ring
stat
ewid
e us
ed fo
r foo
d pr
oduc
ts in
the
regi
on.
5
6
Tabl
e 21
con
tinue
d R
a
Clu
ster
or I
ndus
tryLQ
Empl
oym
ent
Out
put
($
milli
ons)
Earn
ings
/ W
orke
r
Perc
ent o
f O
ccup
atio
ns
in M
iddl
e W
age
Ran
ge
Perc
ent o
f O
ccup
atio
ns in
H
igh
Wag
e R
ange
Chg
Est
01-
07C
h01
Fede
ral E
lect
rical
Util
ities
17
41
55
7.5
6In
dust
rial M
achi
nery
210
75
52
450
Fore
st P
rodu
cts
32
12
17
856
Air &
Gas
Com
pres
sion
Eq
uipm
ent M
fg.
414
1310
34
28Fo
od P
rodu
cts
58
511
55
93
Sem
icon
duct
ors
66
36
55
41
Oth
er C
omm
erci
al a
nd S
ervi
ce
Indu
stry
Mac
hine
ry7
1215
74
324
Ligh
ting
Fixt
ure
Mfg
.8
1314
85
512
1Pu
mp
& Pu
mpi
ng E
q M
fg.
915
123
55
113
Poul
try P
roce
ssin
g10
118
125
514
7Au
to R
enta
l11
910
148
51
8O
ther
Am
bula
tory
Hea
lth C
are
124
64
61
255
Gam
blin
g13
39
137
95
26C
onst
ruct
ion
141
29
26
642
Pers
onal
Car
e15
511
159
83
Not
e:M
issi
ng v
alue
s as
sign
ed th
e m
edia
n ra
nk v
alue
.
g Em
pl-0
7
Chg
W
age
01-0
7
Proj
ecte
d Em
ploy
men
t In
crea
se
2006
-16
R&D
O
cc'n
. as
% E
mpl
.Ex
ports
as
% O
utpu
tSu
m o
fR
anks
*
Inde
x(1
20-
Sum
med
Sc
ores
)7.
57.
56
67
655
45
102
1470
117
117
464
1013
123
33
929
108
66
873
712
149
15
79
137
86
68
9610
116
61
992
1413
44
297
28
96
69
103
11
15
512
823
32
69
1065
66
210
1194
53
78
1578
32
41
1113
972
nkin
gs
Figure 24: WDA7 Cluster Map
7
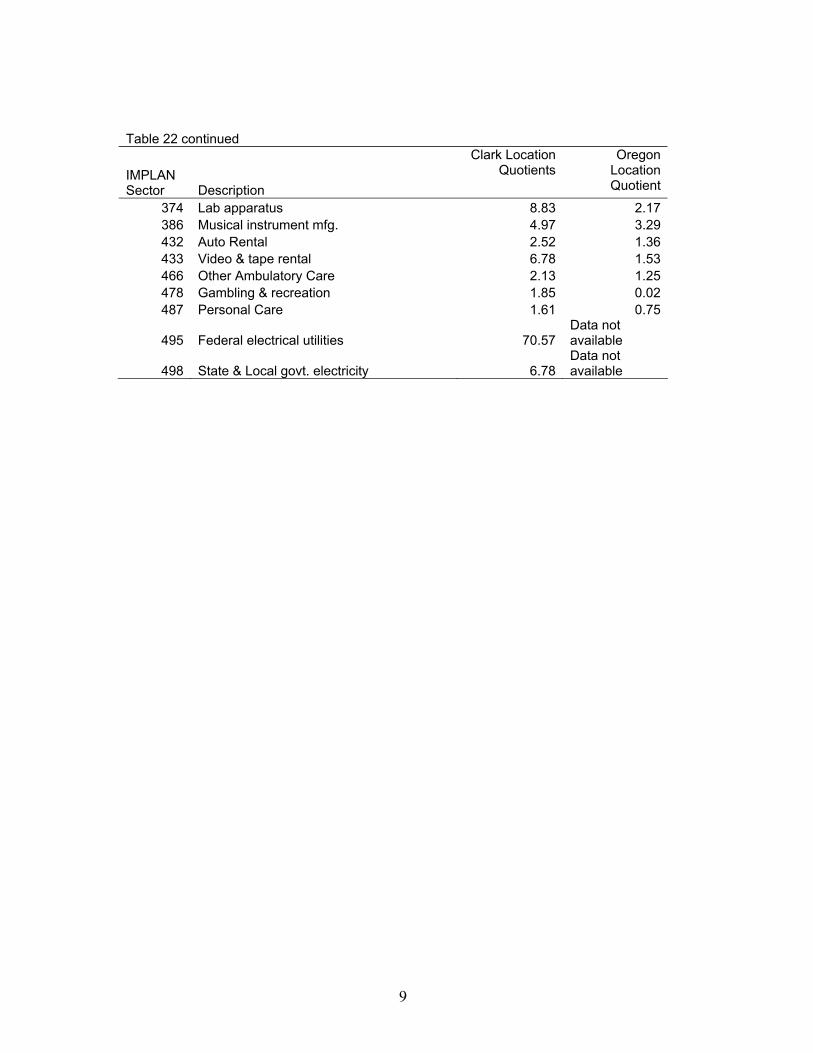
Clark County & Adjacent Oregon Counties Data for three counties in Oregon adjacent to Clark County were estimated. These are Multnomah, Clackamas, and Washington counties. In many instances, sectors that show strong concentration in Clark county have very low location quotients in the Oregon Counties. However, there are several cases where there are strong location quotients in both Clark County and in the Portland metro area. These include sawmill machinery (262), Cut wood stock manufacturing (118), paper industry machinery (264), semiconductors (311), laboratory apparatus manufacturing (374), and musical instrument manufacture (386). Lesser concentrations are found in Oregon in Other Industry Machinery (269), pump and pump equipment manufacturing (288), audio and video equipment manufacturing (309), video & tape rental (433), auto rental (432), and other ambulatory care (466). In the case of semiconductors, the concentration in the Portland area is stronger than in Clark County. Table 22: Clark and Portland Metro Area Location Quotients