Published in IET Biometrics Received on 1st September 2013 Revised on 15th January 2014 Accepted on 10th February 2014 doi: 10.1049/iet-bmt.2013.0067 Special Issue: Integration of Biometrics and Forensics ISSN 2047-4938 Regional fusion for high-resolution palmprint recognition using spectral minutiae representation Ruifang Wang 1 , Daniel Ramos 1 , Raymond Veldhuis 2 , Julian Fierrez 1 , Luuk Spreeuwers 2 , Haiyun Xu 3 1 Biometric Recognition Group-ATVS, EPS, Universidad Autonoma de Madrid, Spain 2 Signals and Systems Group, EEMCS, University of Twente, The Netherlands 3 Software Improvement Group B.V., Amsterdam, The Netherlands E-mail: [email protected]Abstract: The spectral minutiae representation (SMC) has been recently proposed as a novel method to minutiae-based fingerprint recognition, which is invariant to minutiae translation and rotation and presents low computational complexity. As high-resolution palmprint recognition is also mainly based on minutiae sets, SMC has been applied to palmprints and used in full-to-full palmprint matching. However, the performance of that approach was still limited. As one of the main reasons for this is the much bigger size of a palmprint compared with a fingerprint, the authors propose a division of the palmprint into smaller regions. Then, to further improve the performance of spectral minutiae-based palmprint matching, in this work the authors present anatomically inspired regional fusion while using SMC for palmprints. Firstly, the authors consider three regions of the palm, namely interdigital, thenar and hypothenar, which have inspiration in anatomic cues. Then, the authors apply SMC to region-to-region palmprint comparison and study regional discriminability when using the method. After that, the authors implement regional fusion at score level by combining the scores of different regional comparisons in the palm with two fusion methods, that is, sum rule and logistic regression. The authors evaluate region-to-region comparison and regional fusion based on spectral minutiae matching on a public high-resolution palmprint database, THUPALMLAB. Both manual segmentation and automatic segmentation are performed to obtain the three palm regions for each palm. Essentially using the complex SMC, the authors obtain results on region-to-region comparison which show that the hypothenar and interdigital regions outperform the thenar region. More importantly, the authors achieve significant performance improvements by regional fusion using regions segmented both manually and automatically. One main advantage of the approach the authors took is that human examiners can segment the palm into the three regions without prior knowledge of the system, which makes the segmentation process easy to be incorporated in protocols such as in forensic science. 1 Introduction Recently, the spectral minutiae representation (SMC) [1, 2] has shown its power in minutiae-based fingerprint recognition, which can handle minutiae translation and rotation with good computational efficiency at the matching stage, satisfying the requirements of high-resolution palmprint recognition as well. As defined in [1], the method uses the minutiae locations in spatial domain and takes Fourier transform of the coded locations and obtains the magnitude of its Fourier spectrum in frequency domain. The three types of SMCs are the location-based SMC (SML), the orientation-based SMC and the complex SMC, among which the enhanced SMC method [2] performs best for fingerprints with the EER of 3.05% on FVC2002 DB2A database [3] and a matching speed of 8000 comparisons per second. Inspired by matching accuracy and efficiency of SMC, we applied it to high-resolution palmprints captured at 500 ppi at least and implemented full-to-full palmprint comparison in a previous work [4], as high-resolution palmprint recognition is also mainly based on minutiae sets. However, the performance of SMC for full-to-full palmprint comparison is not satisfying compared with either its use in fingerprint matching or state-of-the-art in high-resolution palmprint recognition [5–8]. This is partly because of the big size of palmprints compared with fingerprints. This motivates us to improve the performance of spectral minutiae-based high-resolution palmprint recognition by using unique properties of high-resolution palmprint images. Different from a fingerprint image, a high-resolution palmprint image, as shown in Fig. 1, is deemed to have rich types of features beyond minutiae, such as principal lines (major creases), and minor creases. Also, a palmprint can be divided into three regions by the three major creases, that is, interdigital, thenar and hypothenar, which is a typical division used in forensic anthropology for instance (see Fig. 1). As indicated in [9], the three palm regions divided by three major creases, have different performance according to matching accuracy, with the thenar region having much lower accuracy than interdigital and hypothenar regions. This property can be considered as a unique aspect of palmprints while it does not exist in fingerprints. www.ietdl.org 94 & The Institution of Engineering and Technology 2014 IET Biom., 2014, Vol. 3, Iss. 2, pp. 94–100 doi: 10.1049/iet-bmt.2013.0067
Transcript
www.ietdl.org
9&
Published in IET BiometricsReceived on 1st September 2013Revised on 15th January 2014Accepted on 10th February 2014doi: 10.1049/iet-bmt.2013.0067
Special Issue: Integration of Biometrics and Forensics
4The Institution of Engineering and Technology 2014
ISSN 2047-4938
Regional fusion for high-resolution palmprintrecognition using spectral minutiae representationRuifang Wang1, Daniel Ramos1, Raymond Veldhuis2, Julian Fierrez1, Luuk Spreeuwers2,
Haiyun Xu3
1Biometric Recognition Group-ATVS, EPS, Universidad Autonoma de Madrid, Spain2Signals and Systems Group, EEMCS, University of Twente, The Netherlands3Software Improvement Group B.V., Amsterdam, The Netherlands
Abstract: The spectral minutiae representation (SMC) has been recently proposed as a novel method to minutiae-basedfingerprint recognition, which is invariant to minutiae translation and rotation and presents low computational complexity. Ashigh-resolution palmprint recognition is also mainly based on minutiae sets, SMC has been applied to palmprints and used infull-to-full palmprint matching. However, the performance of that approach was still limited. As one of the main reasons forthis is the much bigger size of a palmprint compared with a fingerprint, the authors propose a division of the palmprint intosmaller regions. Then, to further improve the performance of spectral minutiae-based palmprint matching, in this work theauthors present anatomically inspired regional fusion while using SMC for palmprints. Firstly, the authors consider threeregions of the palm, namely interdigital, thenar and hypothenar, which have inspiration in anatomic cues. Then, the authorsapply SMC to region-to-region palmprint comparison and study regional discriminability when using the method. After that,the authors implement regional fusion at score level by combining the scores of different regional comparisons in the palmwith two fusion methods, that is, sum rule and logistic regression. The authors evaluate region-to-region comparison andregional fusion based on spectral minutiae matching on a public high-resolution palmprint database, THUPALMLAB. Bothmanual segmentation and automatic segmentation are performed to obtain the three palm regions for each palm. Essentiallyusing the complex SMC, the authors obtain results on region-to-region comparison which show that the hypothenar andinterdigital regions outperform the thenar region. More importantly, the authors achieve significant performanceimprovements by regional fusion using regions segmented both manually and automatically. One main advantage of theapproach the authors took is that human examiners can segment the palm into the three regions without prior knowledge ofthe system, which makes the segmentation process easy to be incorporated in protocols such as in forensic science.
1 Introduction
Recently, the spectral minutiae representation (SMC) [1, 2]has shown its power in minutiae-based fingerprintrecognition, which can handle minutiae translation androtation with good computational efficiency at the matchingstage, satisfying the requirements of high-resolutionpalmprint recognition as well. As defined in [1], the methoduses the minutiae locations in spatial domain and takesFourier transform of the coded locations and obtains themagnitude of its Fourier spectrum in frequency domain.The three types of SMCs are the location-based SMC(SML), the orientation-based SMC and the complex SMC,among which the enhanced SMC method [2] performs bestfor fingerprints with the EER of 3.05% on FVC2002 DB2Adatabase [3] and a matching speed of 8000 comparisons persecond. Inspired by matching accuracy and efficiency ofSMC, we applied it to high-resolution palmprints capturedat 500 ppi at least and implemented full-to-full palmprintcomparison in a previous work [4], as high-resolutionpalmprint recognition is also mainly based on minutiae sets.
However, the performance of SMC for full-to-full palmprintcomparison is not satisfying compared with either its use infingerprint matching or state-of-the-art in high-resolutionpalmprint recognition [5–8]. This is partly because of thebig size of palmprints compared with fingerprints. Thismotivates us to improve the performance of spectralminutiae-based high-resolution palmprint recognition byusing unique properties of high-resolution palmprint images.Different from a fingerprint image, a high-resolution
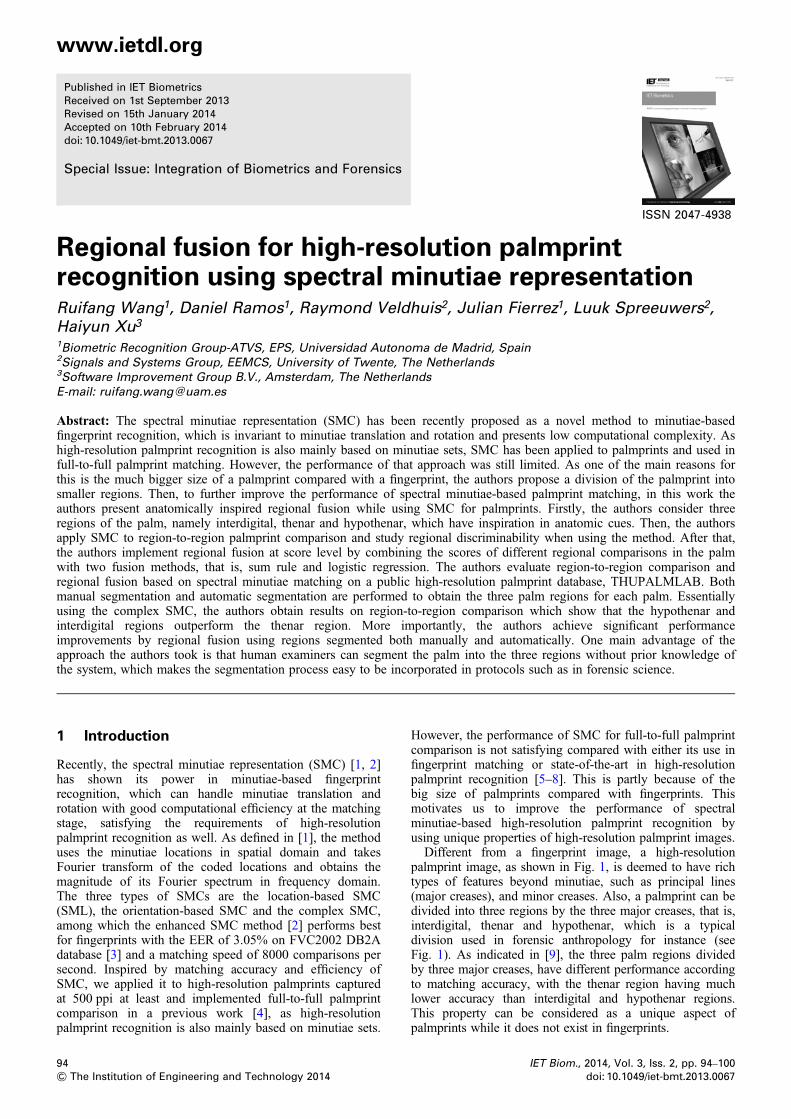
palmprint image, as shown in Fig. 1, is deemed to have richtypes of features beyond minutiae, such as principal lines(major creases), and minor creases. Also, a palmprint can bedivided into three regions by the three major creases, that is,interdigital, thenar and hypothenar, which is a typicaldivision used in forensic anthropology for instance (seeFig. 1). As indicated in [9], the three palm regions dividedby three major creases, have different performance accordingto matching accuracy, with the thenar region having muchlower accuracy than interdigital and hypothenar regions.This property can be considered as a unique aspect ofpalmprints while it does not exist in fingerprints.
IET Biom., 2014, Vol. 3, Iss. 2, pp. 94–100doi: 10.1049/iet-bmt.2013.0067
Fig. 1 A sample full palmprint with high-resolution and its featuretypes
www.ietdl.org
Moreover, available high-resolution palmprint matchingalgorithms [5–7] essentially follow the minutiae-basedfingerprint matching strategy and focus on full-to-full/partial-to-full palmprint comparison. These algorithmswould face problems when they are applied to forensicpalmprint recognition where latent marks have muchsmaller area than full palmprints, which was also argued ina recent work on forensic palmprint recognition [8]. This isan additional reason towards the division in regions of thepalmprint in order to improve the performance of palmprintrecognition in forensic applications.Owing to the motivations described above, in this work, we
present anatomically inspired regional fusion while usingSMC for palmprints. Firstly, we apply SMC toregion-to-region palmprint comparison and studydiscriminability in interdigital, thenar and hypothenarregions, respectively. Then, aimed to improve theperformance, we implement regional fusion at score leveland obtain results with two fusion methods, that is, sumrule [10, 11] and logistic regression [12, 13]. Both manualsegmentation and automatic segmentation are performed toobtain the three palm regions for each palm. We evaluateregion-to-region comparison and regional fusion based onspectral minutiae matching on a public high-resolutionpalmprint database, THUPALMLAB [14]. Essentially usingthe complex SMC, we obtain results on region-to-regioncomparison which show that the hypothenar and interdigitalregions outperform the thenar region. More importantly, weachieve significant improvements by regional fusion usingregions segmented both manually and automatically: (i) formanually segmented regions, EER of 3.64% for sum rulefusion, and 3.21% for logistic regression based fusion,showing an improvement of 10.56 and 10.99% in EER,respectively, compared with full-to-full palmprintcomparison on the same testing dataset; and (ii) forautomatically segmented regions, EER of 2.4% for sum rulefusion, and 1.77% for logistic regression based fusion,showing an improvement of 9.24% and 9.87% in EER,respectively, compared with full-to-full palmprintcomparison on the same testing dataset.This paper is an extension of the work on full-to-full
palmprint comparison using SMC [4]. The major novelty isregional fusion using the three region-to-region palmprintcomparison scores to significantly improve the performanceof spectral minutiae matching for palmprints. The rest ofthe paper is organised as follows. Section 2 describes the
IET Biom., 2014, Vol. 3, Iss. 2, pp. 94–100doi: 10.1049/iet-bmt.2013.0067
SMC method. Section 3 shows an experimental study andanalysis of regional discriminability while performingregion-to-region palmprint comparison using SMC. Section4 describes regional fusion based on sum rule and logisticregression, respectively, for high-resolution palmprintrecognition and reports experimental results. Conclusionsare given in Section 5.
2 Spectral minutiae representation
The SMC for high-resolution palmprints is the same as forfingerprints [1, 2]. Given the minutiae set (xi, yi, ui)
{ }Zi=1
containing Z minutiae in a palmprint, the SMC consists ofthe following steps. Firstly, in spatial domain, the minutiaelocations of a palmprint are coded by Gaussian indicatorfunctions
m(x, y; s2) =∑Zi=1
1
2ps2exp − (x− xi)
2 + (y− yi)2
2s2
( ),
s = sL or sC
(1)
where m(x, y; σ2) is the summation of Gaussian indicatorfunctions at the locations of all minutiae in a palmprint andσ is the standard deviation parameter. The parameters σLand σC denote the standard deviations for the SMLrepresentation and the SMC representation, respectively.Then, we take the Fourier transform of m(x, y; σ2) andobtain the magnitude of its Fourier spectrum, that is, for theSML representation [1]
ML(vx, vy; s2L)
= exp −v2x + v2
y
2s−2L
( )∑Zi=1
exp(−j(vxxi + vyyi))
∣∣∣∣∣∣∣∣∣∣ (2)
and for the SMC representation [2],
MC(vx, vy; s2C)
= exp −v2x + v2
y
2s−2C
( )∑Zi=1
exp (−j(vxxi + vyyi)+ jui)
∣∣∣∣∣∣∣∣∣∣ (3)
In the SML representation, only the location of a minutia istransformed, whereas both the location and orientation of aminutia are transformed in the SMC representation.Especially, when σ = 0, it means each minutia is presentedby a Dirac pulse mi(x, y) = δ(x−xi, y−yi), and the SMLrepresentation becomes
ML(vx, vy; s2L) =
∑Zi=1
exp (−j(vxxi + vyyi)) (4)
and the SMC representation becomes
MC(vx, vy; s2C) =
∑Zi=1
exp (−j(vxxi + vyyi)+ jui) (5)
Finally, the continuous spectra SML or SMC is sampled on apolar-linear grid with the size M0 × N0 where M0 (set to 128)samples are located in the radial direction between λl and λh,and N0 (set to 256) samples are located in the angular
95& The Institution of Engineering and Technology 2014
Table 1 Description of parameters for SMC and comparison
Parameters Values Descriptions
M 128 number of polar samples for radiusN 256 number of polar samples for angleσL ≥ 0 Gaussian parameter for SML when 0,
denotes dirac pulse; otherwise,Gaussian pulse
σC ≥ 0 Gaussian parameter for SMC when 0,denotes Dirac pulse; otherwise,
Gaussian pulseλl ≥ 0 lower bound of frequency range in the
radial directionλh > λl upper bound of frequency range in the
radial directionq [−128,
128]shift range setting for rotation
compensation equivalent to a range[−180°, 180°] for SMC and a range
[−90°, 90°] for SML
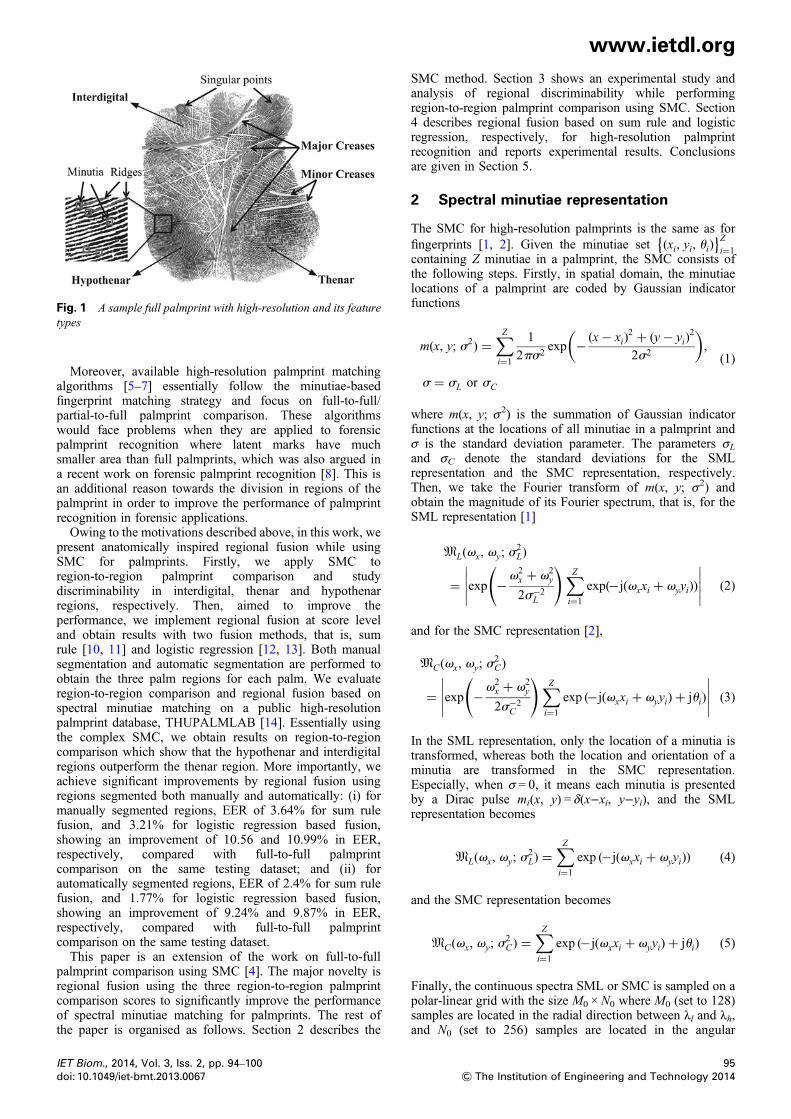
Fig. 2 Definitions of a palmprint: principal lines (1 – heart line,2 – head line and 3 – life line), palmprint regions (I – interdigitalregion, II – thenar region and III – hypothenar region) and datumpoints (a, b-endpoint, o-their midpoint) [15]. c is the intersectionpoint of the bottom boundary of a palm and the perpendicularbisector of the line segment ab. Here ab and oc are used forregion segmentation.
www.ietdl.org
direction between 0 and π for SML or between 0 and 2π forSMC. Parameters λl and λh denote frequency rangeboundaries in the radial direction, which can be tunedduring spectrum sampling.Let R and T be the two sampled minutiae spectrums of
dimensions M × N obtained from the minutiae sets in areference palmprint and a test palmprint, respectively, thematching score between them is calculated as the maximumcorrelation coefficient between R and T as follows
S(R,T ) = maxp,q
1
MN
∑m,n
R(m, n)T (m− p, n− q)
∣∣∣∣∣∣∣∣∣∣,
p = 0, q [ −N
2,N
2
[ ] (6)
where T(m− p, n− q) denotes a shift version of T(m, n) with ashift of p in the radial direction for scaling and a shift of q inthe angular direction for rotation. In practice, we set p = 0 andassume that there is no scaling difference between thepalmprints in the database we use since the database [14] iscollected using a single palmprint scanner and the sameprotocol for all palmprints. Note that in this work we usethe full angular shift range [−N/2, N/2] in steps of one unitequivalent to a range [−180°, 180°] in steps of 1.4° forSMC and a range [−90°, 90°] in steps of 0.7° for SML forpalmprint matching. This is because the palmprint imagesin the database we use have much larger rotation comparedwith previous works on fingerprints [1, 2] (e.g. in [1], arange [−15, 15] in steps of three units is used which isequivalent to a range [−10°, 10°] in steps of 2°). Theparameters in (1)–(6) are summarised in Table 1. The aboveprocedures of applying SMC to palmprints are similarwith [4].
3 Region-to-region palmprint comparison
3.1 Regional discriminability
As observed from Figs. 1 and 2, the three palm regions havedifferent feature properties: (i) the interdigital region containssignificant singular points and the heart line which couldimprove its discriminability; (ii) the thenar region containsmany more minor creases and wrinkles which deteriorate itsdiscriminability; and (iii) the hypothenar region containsmore regular ridges which improve its discriminability. To
96& The Institution of Engineering and Technology 2014
check these observations, we implemented regionsegmentation based on datum points [15] marked manually,and obtained region-to-region matching results using SMCon a subset of the database THUPALMLAB [14]. Thesubset of THUPALMLAB includes the palmprint imagesfrom the last 50 subjects with 100 palms, that is, 800( = 50 × 2 × 8) images. Moreover, automatic segmentationbased on datum points using the method proposed in [16] isalso performed on the same subset. As reported in [16],there are 702 images segmented successfully in the subsetof THUPALMLAB, among which there are 85 palmsobtaining successful segmentation for their completeeight-image sets. We then use the 680 images from the85palms and their automatically segmented regions toobtain region-to-region matching results.As both manual and automatic region segmentation
techniques are inspired anatomically, here we first give adescription of the anatomic basis of a palmprint. As shownin Fig. 2, because of the stability of the principal lines, theendpoints a and b of the life line and the heart line whichintersect both sides of the palm, and their midpoint o arealso stable according to their locations in the full palmprint.They were defined as datum points in [15]. Somesignificant properties of datum points can be used forregion segmentation: (i) the relative locations of theendpoints and their midpoint are rotation invariant in apalmprint; and (ii) a palm can be divided into three regions:interdigital region (I), thenar region (II) and hypothenarregion (III) by the connections between the endpoints andtheir perpendicular bisector, that is, line segments ab and oc(see Fig. 2).Based on the properties of the datum points, we segment
each palmprint into three regions manually andautomatically, respectively. In the manual segmentation, wemanually choose endpoints a and b according to theirdefinition and obtain their position with X and Y axisvalues. In the automatic segmentation, endpoints a and bare detected automatically based on convex hull comparisonas detailed in [16]. Then we calculate the position of theirmidpoint o. Finally we divide each palmprint into those
IET Biom., 2014, Vol. 3, Iss. 2, pp. 94–100doi: 10.1049/iet-bmt.2013.0067
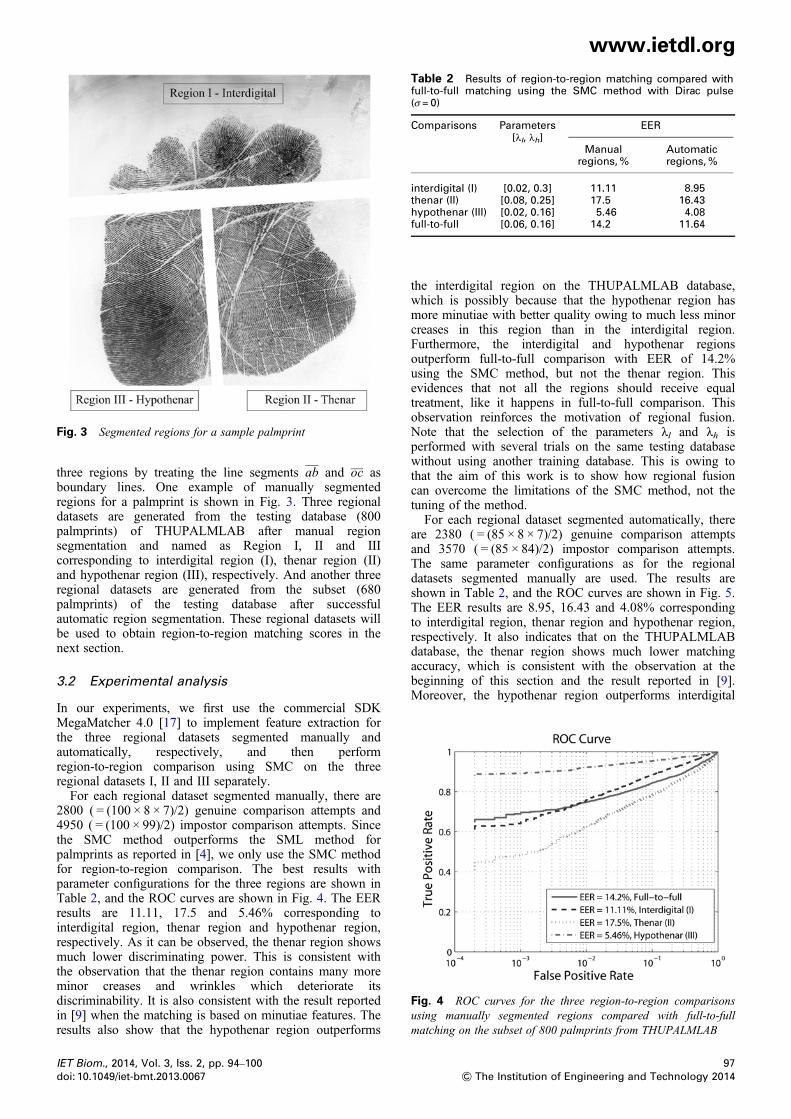
Table 2 Results of region-to-region matching compared withfull-to-full matching using the SMC method with Dirac pulse(σ = 0)
Fig. 4 ROC curves for the three region-to-region comparisonsusing manually segmented regions compared with full-to-fullmatching on the subset of 800 palmprints from THUPALMLAB
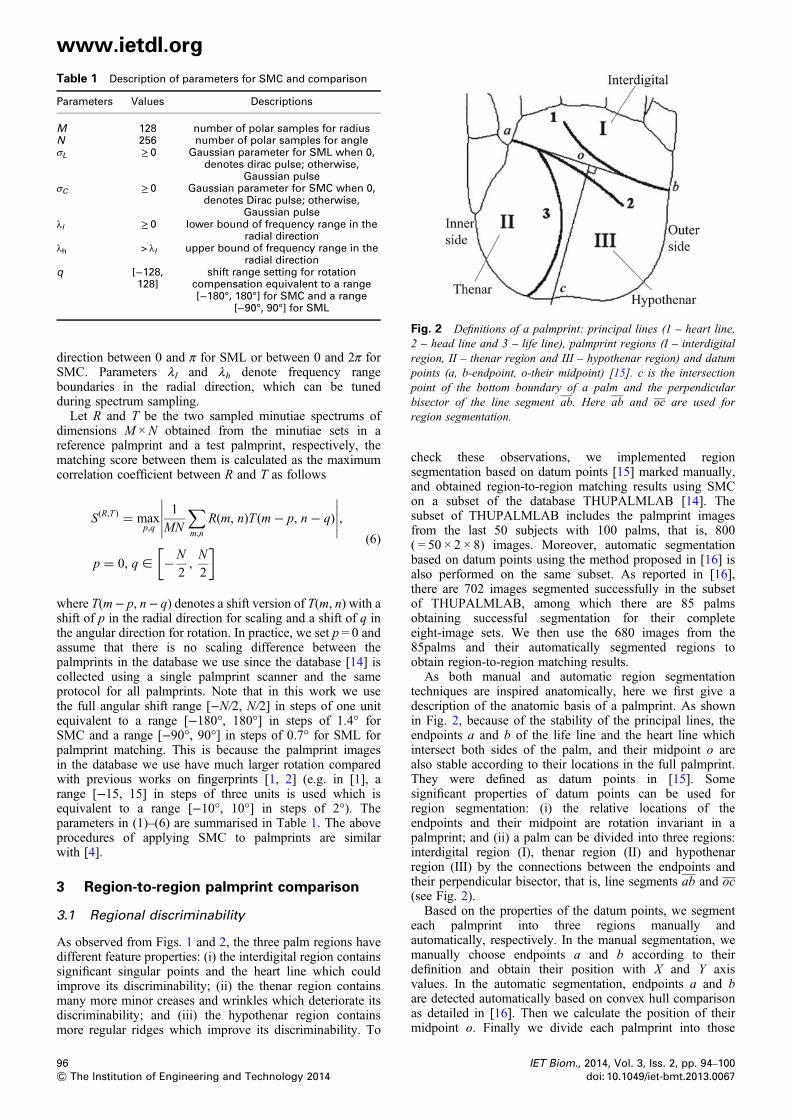
Fig. 3 Segmented regions for a sample palmprint
www.ietdl.org
three regions by treating the line segments ab and oc asboundary lines. One example of manually segmentedregions for a palmprint is shown in Fig. 3. Three regionaldatasets are generated from the testing database (800palmprints) of THUPALMLAB after manual regionsegmentation and named as Region I, II and IIIcorresponding to interdigital region (I), thenar region (II)and hypothenar region (III), respectively. And another threeregional datasets are generated from the subset (680palmprints) of the testing database after successfulautomatic region segmentation. These regional datasets willbe used to obtain region-to-region matching scores in thenext section.
3.2 Experimental analysis
In our experiments, we first use the commercial SDKMegaMatcher 4.0 [17] to implement feature extraction forthe three regional datasets segmented manually andautomatically, respectively, and then performregion-to-region comparison using SMC on the threeregional datasets I, II and III separately.For each regional dataset segmented manually, there are
2800 ( = (100 × 8 × 7)/2) genuine comparison attempts and4950 ( = (100 × 99)/2) impostor comparison attempts. Sincethe SMC method outperforms the SML method forpalmprints as reported in [4], we only use the SMC methodfor region-to-region comparison. The best results withparameter configurations for the three regions are shown inTable 2, and the ROC curves are shown in Fig. 4. The EERresults are 11.11, 17.5 and 5.46% corresponding tointerdigital region, thenar region and hypothenar region,respectively. As it can be observed, the thenar region showsmuch lower discriminating power. This is consistent withthe observation that the thenar region contains many moreminor creases and wrinkles which deteriorate itsdiscriminability. It is also consistent with the result reportedin [9] when the matching is based on minutiae features. Theresults also show that the hypothenar region outperforms
IET Biom., 2014, Vol. 3, Iss. 2, pp. 94–100doi: 10.1049/iet-bmt.2013.0067
the interdigital region on the THUPALMLAB database,which is possibly because that the hypothenar region hasmore minutiae with better quality owing to much less minorcreases in this region than in the interdigital region.Furthermore, the interdigital and hypothenar regionsoutperform full-to-full comparison with EER of 14.2%using the SMC method, but not the thenar region. Thisevidences that not all the regions should receive equaltreatment, like it happens in full-to-full comparison. Thisobservation reinforces the motivation of regional fusion.Note that the selection of the parameters λl and λh isperformed with several trials on the same testing databasewithout using another training database. This is owing tothat the aim of this work is to show how regional fusioncan overcome the limitations of the SMC method, not thetuning of the method.For each regional dataset segmented automatically, there
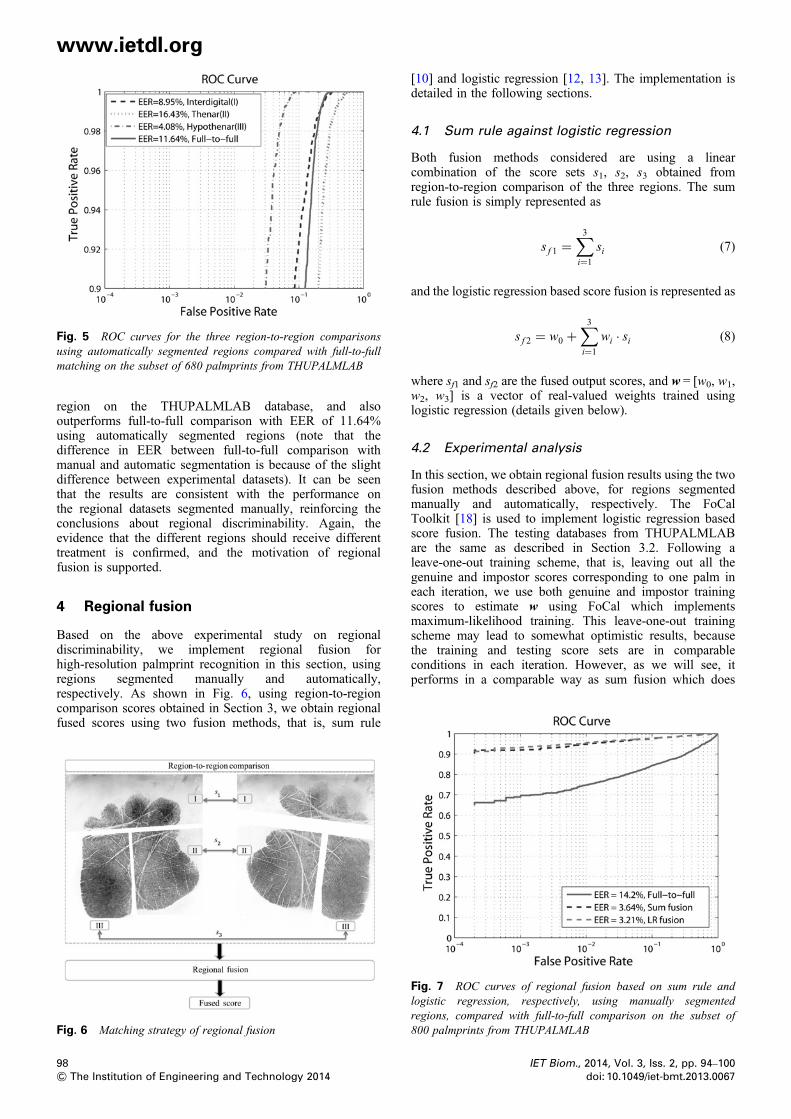
are 2380 ( = (85 × 8 × 7)/2) genuine comparison attemptsand 3570 ( = (85 × 84)/2) impostor comparison attempts.The same parameter configurations as for the regionaldatasets segmented manually are used. The results areshown in Table 2, and the ROC curves are shown in Fig. 5.The EER results are 8.95, 16.43 and 4.08% correspondingto interdigital region, thenar region and hypothenar region,respectively. It also indicates that on the THUPALMLABdatabase, the thenar region shows much lower matchingaccuracy, which is consistent with the observation at thebeginning of this section and the result reported in [9].Moreover, the hypothenar region outperforms interdigital
97& The Institution of Engineering and Technology 2014
Fig. 5 ROC curves for the three region-to-region comparisonsusing automatically segmented regions compared with full-to-fullmatching on the subset of 680 palmprints from THUPALMLAB
www.ietdl.org
region on the THUPALMLAB database, and alsooutperforms full-to-full comparison with EER of 11.64%using automatically segmented regions (note that thedifference in EER between full-to-full comparison withmanual and automatic segmentation is because of the slightdifference between experimental datasets). It can be seenthat the results are consistent with the performance onthe regional datasets segmented manually, reinforcing theconclusions about regional discriminability. Again, theevidence that the different regions should receive differenttreatment is confirmed, and the motivation of regionalfusion is supported.
4 Regional fusion
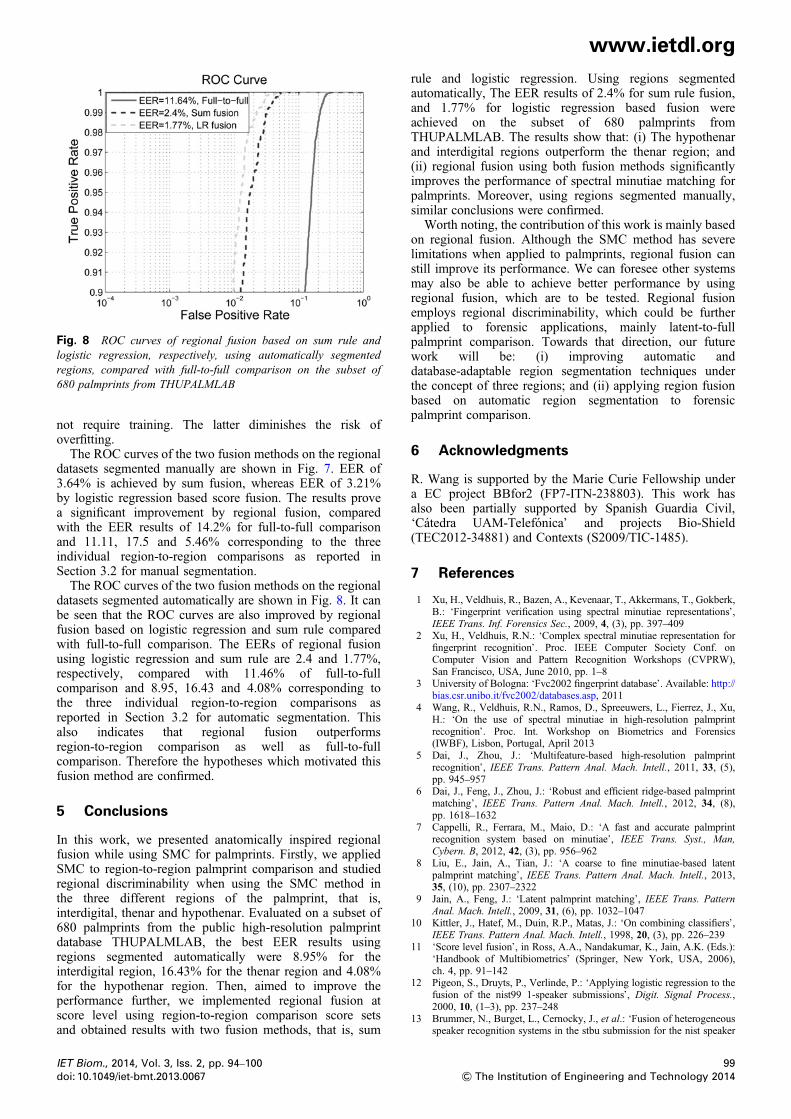
Based on the above experimental study on regionaldiscriminability, we implement regional fusion forhigh-resolution palmprint recognition in this section, usingregions segmented manually and automatically,respectively. As shown in Fig. 6, using region-to-regioncomparison scores obtained in Section 3, we obtain regionalfused scores using two fusion methods, that is, sum rule
Fig. 6 Matching strategy of regional fusion
98& The Institution of Engineering and Technology 2014
[10] and logistic regression [12, 13]. The implementation isdetailed in the following sections.
4.1 Sum rule against logistic regression
Both fusion methods considered are using a linearcombination of the score sets s1, s2, s3 obtained fromregion-to-region comparison of the three regions. The sumrule fusion is simply represented as
s f 1 =∑3i=1
si (7)
and the logistic regression based score fusion is represented as
s f 2 = w0 +∑3i=1
wi · si (8)
where sf1 and sf2 are the fused output scores, and w = [w0, w1,w2, w3] is a vector of real-valued weights trained usinglogistic regression (details given below).
4.2 Experimental analysis
In this section, we obtain regional fusion results using the twofusion methods described above, for regions segmentedmanually and automatically, respectively. The FoCalToolkit [18] is used to implement logistic regression basedscore fusion. The testing databases from THUPALMLABare the same as described in Section 3.2. Following aleave-one-out training scheme, that is, leaving out all thegenuine and impostor scores corresponding to one palm ineach iteration, we use both genuine and impostor trainingscores to estimate w using FoCal which implementsmaximum-likelihood training. This leave-one-out trainingscheme may lead to somewhat optimistic results, becausethe training and testing score sets are in comparableconditions in each iteration. However, as we will see, itperforms in a comparable way as sum fusion which does
Fig. 7 ROC curves of regional fusion based on sum rule andlogistic regression, respectively, using manually segmentedregions, compared with full-to-full comparison on the subset of800 palmprints from THUPALMLAB
IET Biom., 2014, Vol. 3, Iss. 2, pp. 94–100doi: 10.1049/iet-bmt.2013.0067
Fig. 8 ROC curves of regional fusion based on sum rule andlogistic regression, respectively, using automatically segmentedregions, compared with full-to-full comparison on the subset of680 palmprints from THUPALMLAB
www.ietdl.org
not require training. The latter diminishes the risk ofoverfitting.The ROC curves of the two fusion methods on the regional
datasets segmented manually are shown in Fig. 7. EER of3.64% is achieved by sum fusion, whereas EER of 3.21%by logistic regression based score fusion. The results provea significant improvement by regional fusion, comparedwith the EER results of 14.2% for full-to-full comparisonand 11.11, 17.5 and 5.46% corresponding to the threeindividual region-to-region comparisons as reported inSection 3.2 for manual segmentation.The ROC curves of the two fusion methods on the regional
datasets segmented automatically are shown in Fig. 8. It canbe seen that the ROC curves are also improved by regionalfusion based on logistic regression and sum rule comparedwith full-to-full comparison. The EERs of regional fusionusing logistic regression and sum rule are 2.4 and 1.77%,respectively, compared with 11.46% of full-to-fullcomparison and 8.95, 16.43 and 4.08% corresponding tothe three individual region-to-region comparisons asreported in Section 3.2 for automatic segmentation. Thisalso indicates that regional fusion outperformsregion-to-region comparison as well as full-to-fullcomparison. Therefore the hypotheses which motivated thisfusion method are confirmed.
5 Conclusions
In this work, we presented anatomically inspired regionalfusion while using SMC for palmprints. Firstly, we appliedSMC to region-to-region palmprint comparison and studiedregional discriminability when using the SMC method inthe three different regions of the palmprint, that is,interdigital, thenar and hypothenar. Evaluated on a subset of680 palmprints from the public high-resolution palmprintdatabase THUPALMLAB, the best EER results usingregions segmented automatically were 8.95% for theinterdigital region, 16.43% for the thenar region and 4.08%for the hypothenar region. Then, aimed to improve theperformance further, we implemented regional fusion atscore level using region-to-region comparison score setsand obtained results with two fusion methods, that is, sum
IET Biom., 2014, Vol. 3, Iss. 2, pp. 94–100doi: 10.1049/iet-bmt.2013.0067
rule and logistic regression. Using regions segmentedautomatically, The EER results of 2.4% for sum rule fusion,and 1.77% for logistic regression based fusion wereachieved on the subset of 680 palmprints fromTHUPALMLAB. The results show that: (i) The hypothenarand interdigital regions outperform the thenar region; and(ii) regional fusion using both fusion methods significantlyimproves the performance of spectral minutiae matching forpalmprints. Moreover, using regions segmented manually,similar conclusions were confirmed.Worth noting, the contribution of this work is mainly based
on regional fusion. Although the SMC method has severelimitations when applied to palmprints, regional fusion canstill improve its performance. We can foresee other systemsmay also be able to achieve better performance by usingregional fusion, which are to be tested. Regional fusionemploys regional discriminability, which could be furtherapplied to forensic applications, mainly latent-to-fullpalmprint comparison. Towards that direction, our futurework will be: (i) improving automatic anddatabase-adaptable region segmentation techniques underthe concept of three regions; and (ii) applying region fusionbased on automatic region segmentation to forensicpalmprint comparison.
6 Acknowledgments
R. Wang is supported by the Marie Curie Fellowship undera EC project BBfor2 (FP7-ITN-238803). This work hasalso been partially supported by Spanish Guardia Civil,‘Cátedra UAM-Telefónica’ and projects Bio-Shield(TEC2012-34881) and Contexts (S2009/TIC-1485).
7 References
1 Xu, H., Veldhuis, R., Bazen, A., Kevenaar, T., Akkermans, T., Gokberk,B.: ‘Fingerprint verification using spectral minutiae representations’,IEEE Trans. Inf. Forensics Sec., 2009, 4, (3), pp. 397–409
2 Xu, H., Veldhuis, R.N.: ‘Complex spectral minutiae representation forfingerprint recognition’. Proc. IEEE Computer Society Conf. onComputer Vision and Pattern Recognition Workshops (CVPRW),San Francisco, USA, June 2010, pp. 1–8
3 University of Bologna: ‘Fvc2002 fingerprint database’. Available: http://bias.csr.unibo.it/fvc2002/databases.asp, 2011
4 Wang, R., Veldhuis, R.N., Ramos, D., Spreeuwers, L., Fierrez, J., Xu,H.: ‘On the use of spectral minutiae in high-resolution palmprintrecognition’. Proc. Int. Workshop on Biometrics and Forensics(IWBF), Lisbon, Portugal, April 2013
7 Cappelli, R., Ferrara, M., Maio, D.: ‘A fast and accurate palmprintrecognition system based on minutiae’, IEEE Trans. Syst., Man,Cybern. B, 2012, 42, (3), pp. 956–962
8 Liu, E., Jain, A., Tian, J.: ‘A coarse to fine minutiae-based latentpalmprint matching’, IEEE Trans. Pattern Anal. Mach. Intell., 2013,35, (10), pp. 2307–2322
9 Jain, A., Feng, J.: ‘Latent palmprint matching’, IEEE Trans. PatternAnal. Mach. Intell., 2009, 31, (6), pp. 1032–1047
11 ‘Score level fusion’, in Ross, A.A., Nandakumar, K., Jain, A.K. (Eds.):‘Handbook of Multibiometrics’ (Springer, New York, USA, 2006),ch. 4, pp. 91–142
12 Pigeon, S., Druyts, P., Verlinde, P.: ‘Applying logistic regression to thefusion of the nist99 1-speaker submissions’, Digit. Signal Process.,2000, 10, (1–3), pp. 237–248
13 Brummer, N., Burget, L., Cernocky, J., et al.: ‘Fusion of heterogeneousspeaker recognition systems in the stbu submission for the nist speaker
99& The Institution of Engineering and Technology 2014
15 Zhang, D., Shu, W.: ‘Two novel characteristics in palmprint verification:datum point invariance and line feature matching’, Pattern Recognit.,1999, 32, (4), pp. 691–702
100& The Institution of Engineering and Technology 2014
16 Wang, R., Ramos, D., Fierrez, J., Krish, R.P.: ‘Automatic regionsegmentation for high-resolution palmprint recognition: Towardsforensic scenarios’. Proc. 47th Int. Carnahan Conf. on SecurityTechnology (ICCST), Medellín, Colombia, October 2013