Gliders and the science behind them Regional Math/Science Center, Frostburg State University, Frostburg, MD 21532 Introduction Discussion and Conclusion References Acknowledgements Design Figure 1. side view of fuselage Aircraft made specifically for traveling using unpowered flight are called gliders; they do not generate thrust, but instead use the initial velocity that is given to them to glide. The objective this summer was to acquire knowledge of aerodynamics and the forces that act upon aircraft, then apply that information to design a 3D printed glider that could travel further than a projectile while remaining stable in all three axes of rotation. Fuselage : long and slender design that would allow air to flow around it, which reduces form drag (Fig. 1) Wings : tapered planform reduces drag due to its minimal surface area near the wing tips (fig. 2) along with an airfoil shape that is able to generate lift (fig. 3) Tailplane : provides horizontal stabilization; relatively flat so it does not produce much lift or drag (Fig. 3) Physics Dept. Duane Miller Aili Wade RMSC Staff Brady Barnhart Dylan Boeckmann Bradley Davidson Rita Hegeman Method of Testing Testing took place in two different settings: indoors and outdoors. In each of these locations, I first threw a 3D printed fuselage as a projectile consistently 10 times, to create a data set that would be used as the control. Then I threw my glider 10 times at that same initial velocity. Distance traveled was measured while the flight was video recorded so qualitative characteristics could be closely observed later. A t-test was used to compare the distance travelled by the projectile and glider in the two environments. 4.71 3.91 0 2 4 6 Projectile Glider Outdoor Trials Figure 2. Ariel view of glider Figure 3. front elevation Results The average distance of the projectile and glider were the same during the indoor trials. For the outdoor trials, the t-test determined that the average distance of the projectile was greater than that of the glider. For the majority of the indoor trials the glider pitched upwards, often enough to completely flip over. Based on the qualitative and quantitative data recorded, my glider was deemed unsuccessful. Aerodynamics of Flight. (2013) In Glider Flying Handbook (pp. 3.1-3.19) Oklahoma City, OK: United States Department of Transportation The variables to take into consideration include how the glider was thrown, wind, and the temperature and humidity outside. This makes it hard to determine exactly what caused the glider to perform in that manner. After analyzing the data and characteristics of each flight, it appears that the glider was generating too much lift; that along with the fact that it is very lightweight, with slightly more weight in the back, might be why it almost always quickly turned upwards resulting in the shorter distance traveled outdoors. If allotted more time or a chance to modify my glider I would add more weight near the front, by making the fuselage slightly heavier or simply adding mass to the front. 3.54 3.54 0 2 4 6 Projectile Glider Distance in Meters Indoor Trials
Transcript
Gliders and the science behind them
Regional Math/Science Center, Frostburg State University, Frostburg, MD 21532
Introduction Discussion and
Conclusion
References
Acknowledgements
Design
Figure 1. side view of
fuselage
Aircraft made specifically for traveling using unpowered flight are called gliders; they do not generate thrust, but instead use the initial velocity that is given to them to glide. The objective this summer was to acquire knowledge of aerodynamics and the forces that act upon aircraft, then apply that information to design a 3D printed glider that could travel further than a projectile while remaining stable in all three axes of rotation.
Fuselage: long and slender design that would allow air to flow around it, which reduces form drag (Fig. 1)Wings: tapered planform reduces drag due to its minimal surface area near the wing tips (fig. 2) along with an airfoil shape that is able to generate lift (fig. 3)Tailplane: provides horizontal stabilization;relatively flat so it does not produce much lift or drag (Fig. 3)
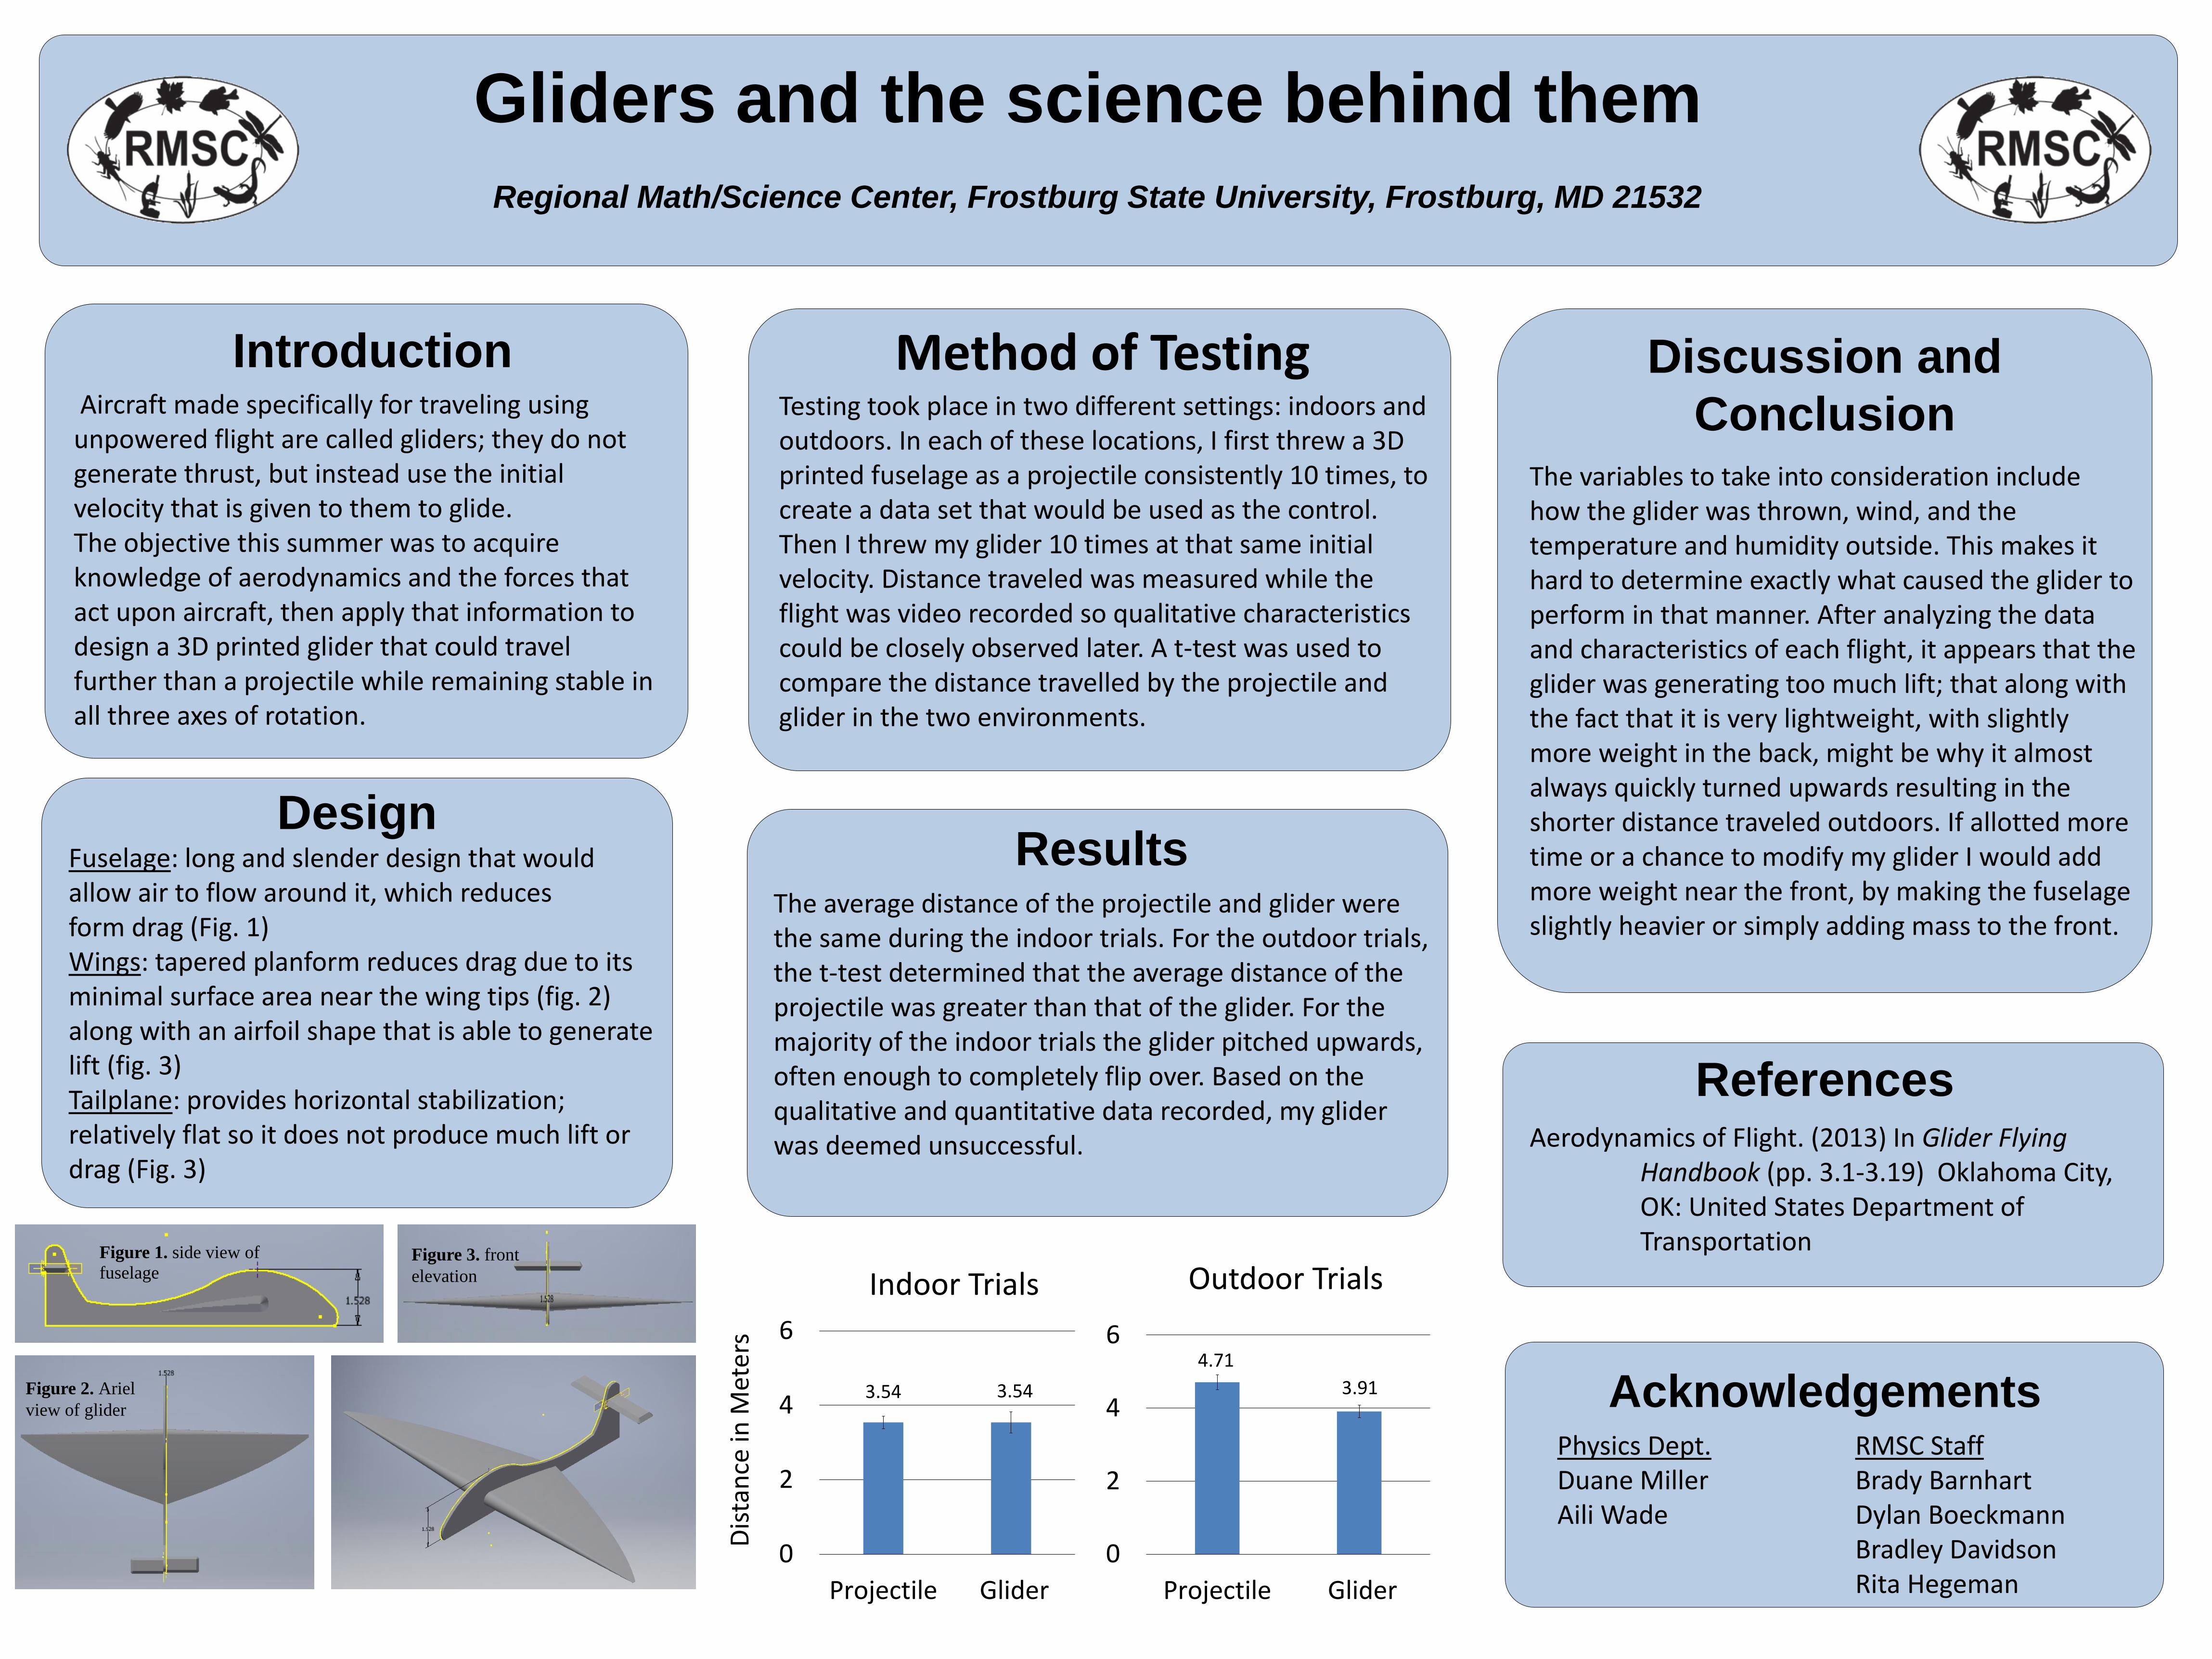
Method of TestingTesting took place in two different settings: indoors and outdoors. In each of these locations, I first threw a 3D printed fuselage as a projectile consistently 10 times, to create a data set that would be used as the control. Then I threw my glider 10 times at that same initial velocity. Distance traveled was measured while the flight was video recorded so qualitative characteristics could be closely observed later. A t-test was used to compare the distance travelled by the projectile and glider in the two environments.
4.71
3.91
0
2
4
6
Projectile Glider
Outdoor Trials
Figure 2. Ariel
view of glider
Figure 3. front
elevation
ResultsThe average distance of the projectile and glider were the same during the indoor trials. For the outdoor trials, the t-test determined that the average distance of the projectile was greater than that of the glider. For the majority of the indoor trials the glider pitched upwards, often enough to completely flip over. Based on the qualitative and quantitative data recorded, my glider was deemed unsuccessful. Aerodynamics of Flight. (2013) In Glider Flying
Handbook (pp. 3.1-3.19) Oklahoma City, OK: United States Department of Transportation
The variables to take into consideration include how the glider was thrown, wind, and the temperature and humidity outside. This makes it hard to determine exactly what caused the glider to perform in that manner. After analyzing the data and characteristics of each flight, it appears that the glider was generating too much lift; that along with the fact that it is very lightweight, with slightly more weight in the back, might be why it almost always quickly turned upwards resulting in the shorter distance traveled outdoors. If allotted more time or a chance to modify my glider I would add more weight near the front, by making the fuselage slightly heavier or simply adding mass to the front.
3.54 3.54
0
2
4
6
Projectile Glider
Dis
tan
cein
Met
ers
Indoor Trials
Glider Construction Process
Regional Math/Science Center, Frostburg State University, Frostburg, MD 21532
Introduction Discussion
References
Results
Acknowledgements
Gliders are engineless aircraft that glide
through the air. They are typically used for
recreation. The goal of this project was to
design and 3-D print a working glider that
would go farther than a projectile with no
aerodynamic design, remain stable about all
3 axes of rotation, and maintain a linear
flight path. We also took this as a chance to
study the physics and aerodynamics of
flight.
First, we threw a projectile indoors 15 times,
attempting to throw with the same velocity on
every throw. The average distance of the projectile
was used as the control. Then, we threw the glider
indoors 15 times, attempting to throw with the
same velocity as the projectile. Each of the
distances were recorded. Finally, we compared the
averages of the two sets of data (glider and
projectile) with a t-test for both indoors and
outdoors.
Indoors: On average, the glider went 0.387
meters farther than the projectile.
Outdoors: On average, the projectile went 0.94
meters farther than the glider.
Observations: Many trials ended in the glider
tipping upwards and then stalling, or simply
spinning out of control immediately after launch.
P-Values:
Indoors – 0.0015
Outdoors – 0.00025
Alpha Value – .05
Even though the p-values in comparison to
the alpha value showed a significant
difference, we do not think that the glider truly
glided. Most of the time the glider lost stability,
and outdoors, it didn’t travel as far as the
projectile. It may have gotten some lift due to
the airfoils, but the center of lift was most
likely too far forward, which would cause the
flipping. We assume that the causes for error
were inconsistency with launch, the material
used for the gliders, and/or time constraints.
Aerodynamics of flight. (2013) In Glider Flying Handbook
(pp 3.1-3.19) Oklahoma City, OK: United States
Department of Transportation.
Glider. (2016). Funk & Wagnalls New World Encyclopedia,
The average distances for the glider exceeded the average distances for the projectile as shown by Figure 5 and Figure 6. Confidence intervals, shown on the graphs, overlap for outside results, while they do not for inside results. Common flight patterns were veering to the left. The glider also landed on the right wing, not staying in equilibrium.
To test our gliders, we first threw a previously determined failed design of a fuselage 15 times as a projectile to form the muscle memory required to reach a consistent initial velocity. We then repeated this process with the gliders. We recorded the distances reached for both.These trials were conducted in two environments:
• Inside of FSU Compton building• Outside Compton Science Center
The average distances for both environments were compared with 95% confidence intervals.
Fuselage (Figure 1):The front had a rounded top to create a smooth transition for air currents and to reduce drag. The fuselage was tapered (narrowed towards the end) to reduce drag. Turbulators were indented into the side of the fuselage to avoid added drag.
Wings (Figure 2):The wings had an elliptical (rounded edged) and a tapered (narrowing thickness) wing shape which reduced the impact of air resistance on the wing. The wings were designed as an airfoil to generate lift. The wings were set to a dihedral of 15 degrees to help the glider stay balanced and not roll. Turbulators were indented on the top of the wing to avoid potentially added drag.
Tail (Figure 3):The tail was angled to offset the natural tendency to nosedive in flight. With this angle the glider should land flat instead of on its front.
Seeing aircraft, such as commercial airplanes or jets, is common. Transportation by air has advanced greatly since the 1920’s2. A glider is one example of this advancement. Gliders do not rely on an engine but on their ability to balance the forces acted upon them to continue in flight. Small scale gliders can be made with cheap, easy access materials, such as paper, and can be thrown by hand. Gliders can be used to study the basic principals of flight. Our objective was to successfully design a glider. If a glider exceeds a projectile’s distance while thrown at the same initial velocity and maintains a balanced flight, then it is considered successful.
The overlapping of the confidence intervals for outside trials indicate that there is not enough data to determine any significant difference between the averages. Inside results show significant difference between averages. The difference between inside and outside results signifies that other factors outside may have influenced the glider’s flight. Thus, partial success is concluded because there is statistical significance between distances for inside trials but, flight characteristics do not show true patterns of a glider and no significant difference was determined for outside trials. Different variables may have influenced the trials and should be further investigated, such as:
• Environment• Wind• Humidity
• How the glider is launched• Material constraints
• Weight distribution• Improvements for testing method
• Number of trials• Variety of environments
Inside averages (m): Projectile: 3.48Glider:4.03
1Aerodynamics of Flight. (2013) In Glider Flying Handbook (pp. 3.1-3.19) Oklahoma City, OK: United States Department of Transportation.
2Davies, A. (2013, April). Debate settled: flying is way more efficient than driving.Retrieved from https://www.wired.com/2015/04/debate-settled-flying-way-efficient-driving/
Figure 1
Figure 2
Figure 3
Figure 4
Turbulators
0
0.5
1
1.5
2
2.5
3
3.5
4
4.5
Dis
tan
ce (
m)
Inside
Projectile Glider0
0.5
1
1.5
2
2.5
3
3.5
4
4.5
5
5.5
6
Dis
tan
ce (
m)
Projectile Glider
Outside
Figure 5 Figure 6• The best staff ever
Design and testing of a 3-D printed glider in differing environments
Regional Math/Science Center, Frostburg State University, Frostburg, MD 21532
IntroductionDiscussion &
Conclusion
References
Acknowledgements
Testing
I would like to acknowledge a group of people for the help and resources they have provided during the makings of this study:• Brad Davidson• Aili Wade• Duane Miller• Dylan Boeckmann• Brady Barnhart
Design
Results
• Gliders are aircraft that have no engine and glide throughthe air.
• The three main parts of a glider are the fuselage, wings, andtail.
• Gliders are used for recreation and the study of forces.• The purpose of this study was to use the knowledge of
aerodynamics to construct a functional 3-D glider that glidessuccessfully based on the distance traveled.
Inventor, a computer program that creates three-dimensional printouts, was used to create the glider: • Fuselage (Figure 1):
• Conical design, helps with air flow• Rectangular holes for the insert of the wings and tail• Vertical stabilizer (rear), help to create stability
• Wings (Figure 2):• Swept forward/tapered to create lift and reduce drag• Airfoils to create lift• Dihedral (fifteen degrees) to create lateral stability• Wing tips to reduce drag
• Tail (Figure 3):• Triangular wing tips to create lateral and vertical stability
A T-test was performed, showing there was a significant difference between the distance traveled by the glider and the projectile. The graphs (Figures 5&6) show the average distance traveled by the glider and projectile indoors and outdoors. Both show the glider did travel farther
After testing the glider, the overall flight results showed that the glider did successfully glide in both indoor and outdoor environments. Although the T-test showed the glider did glide further then the projectile, the glider was affected by the wind and the initial launch velocity. The fuselage was fragile in the middle due to the sleek design; this ultimately caused the glider to break during both indoors and outdoors trials. Since the glider was thrown by hand, a significant difference in the force of the throw could have been present. The time constraint for this study had an effect on how often the design could be updated before testing and how the data was collected.
Future studies could be conducted using the information collected throughout this study to better construct the glider. Using a track to provide the initial velocity would create a more standardized launch; this could lead to less variable distances traveled between launches and reduce the amount of human error.
• Indoor and outdoor trials were conducted.
• A projectile was thrown fifteen times, to produce acontrolled launch method.
• Then the glider was thrown fifteen times and the averagedistance traveled (meters) was recorded.
• Videos were taken so the flight paths were able to beinterpreted later.
• A T-test was used to conclude if a significant differenceexisted between the average distance traveled by theprojectile and by the glider. Figure 1. Fuselage design Figure 2. Wing design
Figure 3. Tail design
Figure 5 Average distance traveled in meters by glider and projectile (Indoor) Figure 6 Average distance traveled in meters by glider and projectile (outdoor)
0
1
2
3
4
5
6
7
8
MET
ERS
TRA
VEL
ED
The Average Distance Traveled (meters) during Outdoor Flight
Trials
Projectile Glider
0
1
2
3
4
5
6
MET
ERS
TRA
VEL
ED
The Average Distance Traveled (meters) during Indoor Flight Trials
Projectile Glider
Aerodynamics of Flight. (2013). In Glider Flying Handbook (pp.3.1-3.19) Oklahoma City, OK: United States Department of Transportation
Figure 4. Assembled Glider design
3-D printed glider design, construction, and testing
Regional Math/Science Center, Frostburg State University, Frostburg, MD 21532
IntroductionThe purpose of this 5-week summer RMSC
program was to design and 3-D print gliders that
utilize principles of aerodynamics to fly farther than
a projectile. Gliders are lightweight aircraft that are
designed to fly without thrust for extended periods
of time. The gliders were designed and 3-D
modeled in the AutoCAD program, Inventor, then
3-D printed at Frostburg State University.
Results
References
Acknowledgements
Testing• Throw a projectile horizontally 15 times, to
establish a throwing baseline and to act as a
control. Calculate the average distance traveled.
• Throw the glider horizontally with the same
velocity as the projectile 15 times. Calculate the
average distance traveled.
• Conduct testing both inside and outside.
• Compare projectile and glider averages using a
t-test. I would like to thank Aili Wade, Bradley Davidson,
Brady Barnhart, Dylan Boeckmann, Duane Miller,
Rita Hegeman and the Physics Dept. of Frostburg
State University.
During the inside trials, on average, the glider
traveled farther than the projectile (Fig. 5). During
the outside trials, on average, the projectile went
farther than the glider (Fig. 6). During trials
inside, the glider would often yaw to the left, and
during trials outside, the glider would roll.
Aerodynamics of Flight. (2013). In Glider Flying Handbook.
(pp.3.1-3.19) Oklahoma City, OK; United States Department of
Transportation.
Design
• Cylindrical fuselage helps reduce drag by
providing smooth transition for airflow (Fig. 1)
• Flat tailpieces produce no lift (Fig. 2)
• Winglets reduce induced drag (Fig. 3)
• Airfoil wing shape produces lift (Fig. 3)
• Tail pieces keep plane stable (Fig. 4)
• Dihedral wings angled 20° improve roll stability
(Fig. 4)
0
0.5
1
1.5
2
2.5
3
3.5
4
Dis
tan
ce (
m)
Inside Distance
Projectile Glider
0
1
2
3
4
5
6
7
8
9
Dis
tan
ce (
m)
Outside Distance
Projectile Glider
DiscussionOverall, the glider design was met with mixed
success. The glider went farther than the projectile
when testing inside, but while testing outside, the
projectile traveled farther. The confidence intervals
of the graphs indicate that both differences were
significant. Additionally, the t-test indicated that
there was a significant difference between the
averages for testing both inside and outside. The
reason that the glider did not travel very far
outside was probably the different manner in
which the glider was thrown, resulting in it rolling
over in the air and falling to the ground. Some
improvements could be made to the glider by
thinning the wings to reduce the glider’s weight, as
well as increasing the size of the tail so that the
glider would fly straighter. An improvement that
could be made to the testing procedure would be to
create a uniform launcher to reduce error from
inconsistent launching.
Fig. 1 Fuselage Fig. 2 Tailpiece
Fig. 3 Right Wing Fig. 4 Assembled Design
Fig. 5 Average distance traveled by the glider and projectile inside.Error bars indicate 95% confidence intervals
Fig. 6 Average distance traveled by the glider and projectile outside error bars represent 95%confidence intervals