126
OPTN Regional Meetings Data Update Spring 2007
| Date post: | 31-Dec-2015 |
| Category: |
Documents |
| Upload: | maribeth-madsen |
| View: | 25 times |
| Download: | 0 times |

OPTN
Regional MeetingsData Update
Spring 2007

OPTN
2006 Donor, Transplant, and Waiting List Numbers

OPTN
Waiting List Additions 1997-2006U.S.
0
10,000
20,000
30,000
40,000
50,000
60,000
1997 1998 1999 2000 2001 2002 2003 2004 2005 2006
Year
Kidney Liver
Nu
mb
er
of
Re
gis
tra
tio
ns

OPTN
Waiting List Additions 1997-2006U.S.
0
1000
2000
3000
4000
5000
1997 1998 1999 2000 2001 2002 2003 2004 2005 2006Year
Nu
mb
er
of
Reg
istr
ati
on
s
Heart Lung PancreasHeart-Lung Kidney-Pancreas Pancreas Islet

OPTN
Waiting List Registrations 1997-2006U.S.
0
10,000
20,000
30,000
40,000
50,000
60,000
70,000
80,000
1997 1998 1999 2000 2001 2002 2003 2004 2005 2006
Year of Snapshot
Kidney Liver
Nu
mb
er
of
Re
gis
tra
tio
ns
OPTN
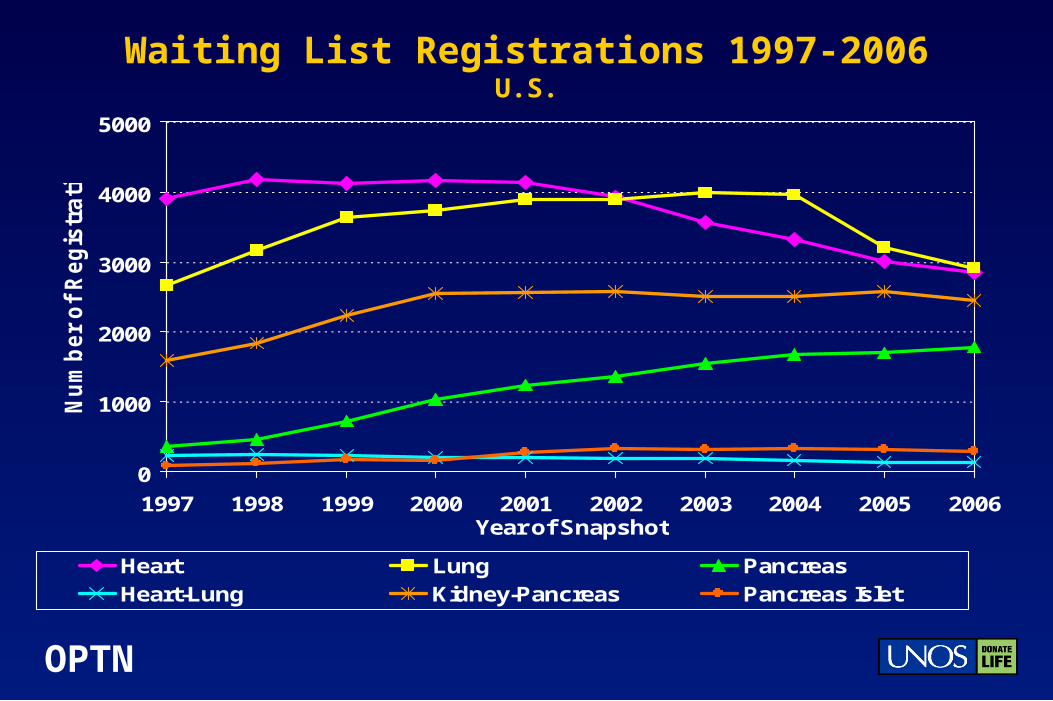
Waiting List Registrations 1997-2006U.S.
0
1000
2000
3000
4000
5000
1997 1998 1999 2000 2001 2002 2003 2004 2005 2006Year of Snapshot
Nu
mb
er
of
Reg
istr
ati
on
s
Heart Lung PancreasHeart-Lung Kidney-Pancreas Pancreas Islet

OPTN
Deceased and Living Donors1997 - 2006
0
1,000
2,000
3,000
4,000
5,000
6,000
7,000
8,000
9,000
1997 1998 1999 2000 2001 2002 2003 2004 2005 2006
Year
Nu
mb
er o
f D
on
ors
Deceased Donor
Living Donor
8022
6722
OPTN
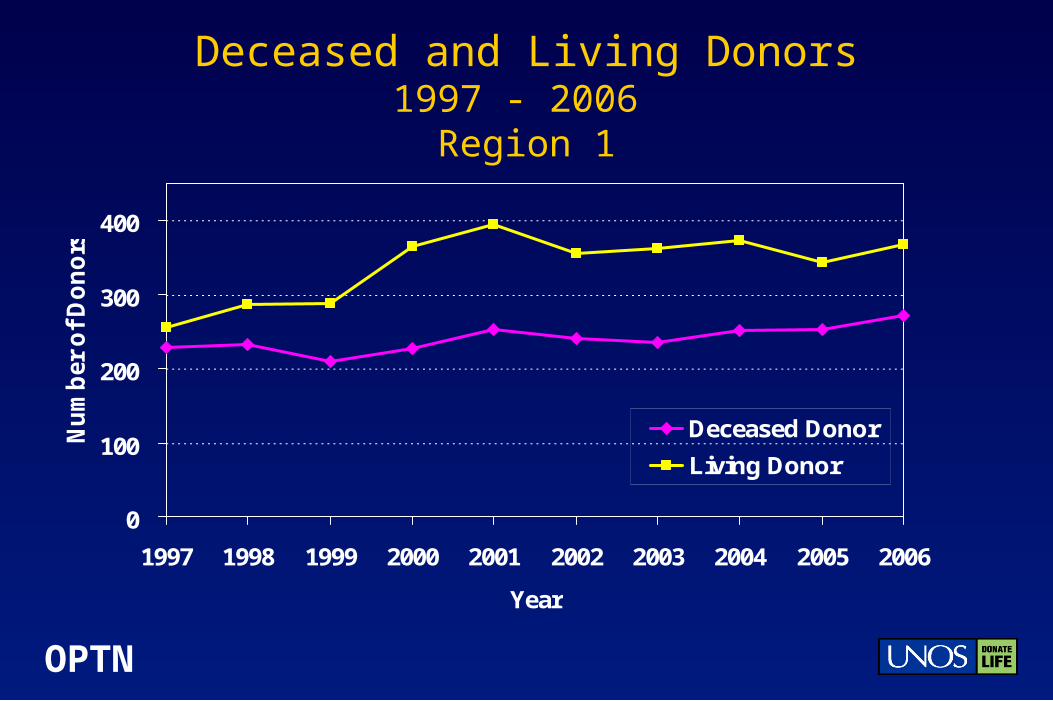
Deceased and Living Donors1997 - 2006
Region 1
0
100
200
300
400
1997 1998 1999 2000 2001 2002 2003 2004 2005 2006
Year
Nu
mb
er o
f D
on
ors
Deceased Donor
Living Donor

OPTN
Deceased and Living Donors1997 - 2006
Region 2
0
200
400
600
800
1,000
1997 1998 1999 2000 2001 2002 2003 2004 2005 2006
Year
Nu
mb
er o
f D
on
ors
Deceased Donor
Living Donor

OPTN
Deceased and Living Donors1997 - 2006
Region 3
0
200
400
600
800
1,000
1,200
1997 1998 1999 2000 2001 2002 2003 2004 2005 2006
Year
Nu
mb
er o
f D
on
ors
Deceased Donor
Living Donor

OPTN
Deceased and Living Donors1997 - 2006
Region 4
0
200
400
600
800
1997 1998 1999 2000 2001 2002 2003 2004 2005 2006
Year
Nu
mb
er o
f D
on
ors
Deceased Donor
Living Donor

OPTN
Deceased and Living Donors1997 - 2006
Region 5
0
200
400
600
800
1,000
1,200
1997 1998 1999 2000 2001 2002 2003 2004 2005 2006
Year
Nu
mb
er o
f D
on
ors
Deceased Donor
Living Donor

OPTN
Deceased and Living Donors1997 - 2006
Region 6
0
100
200
300
1997 1998 1999 2000 2001 2002 2003 2004 2005 2006
Year
Nu
mb
er o
f D
on
ors
Deceased Donor
Living Donor

OPTN
Deceased and Living Donors1997 – 2006
Region 7
0
200
400
600
800
1,000
1,200
1997 1998 1999 2000 2001 2002 2003 2004 2005 2006
Year
Nu
mb
er o
f D
on
ors
Deceased Donor
Living Donor

OPTN
Deceased and Living Donors1997 - 2006
Region 8
0
100
200
300
400
500
600
1997 1998 1999 2000 2001 2002 2003 2004 2005 2006
Year
Nu
mb
er o
f D
on
ors
Deceased Donor
Living Donor

OPTN
Deceased and Living Donors1997 - 2006
Region 9
0
100
200
300
400
500
600
700
1997 1998 1999 2000 2001 2002 2003 2004 2005 2006
Year
Nu
mb
er o
f D
on
ors
Deceased Donor
Living Donor

OPTN
Deceased and Living Donors1997 - 2006 Region 10
0
100
200
300
400
500
600
700
800
1997 1998 1999 2000 2001 2002 2003 2004 2005 2006
Year
Nu
mb
er o
f D
on
ors
Deceased Donor
Living Donor

OPTN
Deceased and Living Donors1997 - 2006 Region 11
0
200
400
600
800
1,000
1997 1998 1999 2000 2001 2002 2003 2004 2005 2006
Year
Nu
mb
er o
f D
on
ors
Deceased Donor
Living Donor

OPTN
Deceased and Living Donors2006
By Region
0
250
500
750
1,000
1,250
1,500
1 2 3 4 5 6 7 8 9 10 11
Nu
mb
er
of Do
no
rs
Deceased Living

OPTN
Deceased and Living Donors2006
Region 1
0
50
100
150
200
250
300
350
CTOP-OP1 MAOB-OP1
Nu
mb
er
of Do
no
rs
Deceased Living

OPTN
Deceased and Living Donors2006
Region 2
0
50
100
150
200
250
300
350
400
450
DCTC-OP1 MDPC-OP1 NJTO-OP1 PADV-OP1 PATF-OP1
Nu
mb
er
of Do
no
rs
Deceased Living

OPTN
Deceased and Living Donors2006
Region 3
0
50
100
150
200
250
300
ALOB AROR FLFH FLMP FLUF FLWC GALL LAOP MSOP PRLL
Deceased Living
Nu
mb
er
of
Don
ors

OPTN
Deceased and Living Donors2006
Region 4
0
50
100
150
200
250
300
OKOP-OP1 TXGC-OP1 TXSA-OP1 TXSB-OP1
Deceased Living
Nu
mb
er
of
Don
ors

OPTN
Deceased and Living Donors2006
Region 5
0
50
100
150
200
250
300
350
400
450
AZOB CADN CAGS CAOP CASD NMOP NVLV UTOP
Deceased Living
Nu
mb
er
of
Don
ors

OPTN
Deceased and Living Donors2006
Region 6
0
50
100
150
HIOP-OP1 ORUO-IO1 WALC-OP1
Deceased Living
Nu
mb
er
of
Don
ors

OPTN
Deceased and Living Donors2006
Region 7
0
50
100
150
200
250
300
350
400
450
ILIP-OP1 MNOP-OP1 WISE-IO1 WIUW-IO1
Deceased Living
Nu
mb
er
of
Don
ors
OPTN
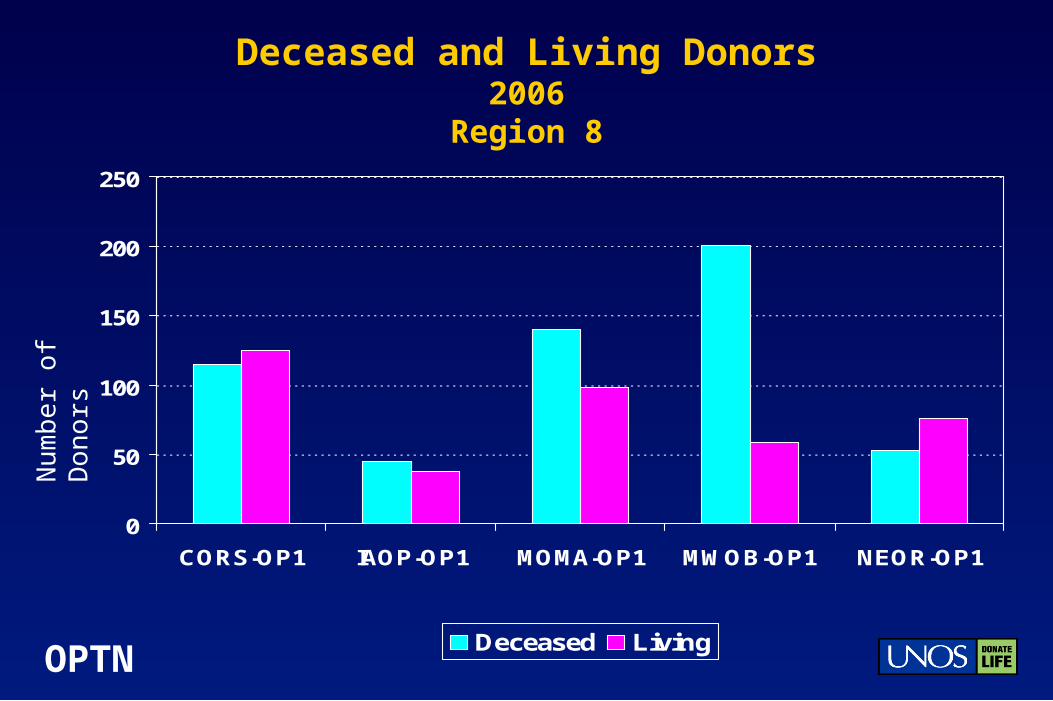
Deceased and Living Donors2006
Region 8
0
50
100
150
200
250
CORS-OP1 IAOP-OP1 MOMA-OP1 MWOB-OP1 NEOR-OP1
Deceased Living
Nu
mb
er
of
Don
ors

OPTN
Deceased and Living Donors2006
Region 9
0
50
100
150
200
250
300
350
400
450
NYAP-OP1 NYFL-IO1 NYRT-OP1 NYWN-OP1
Deceased Living
Nu
mb
er
of
Don
ors

OPTN
Deceased and Living Donors2006
Region 10
0
50
100
150
200
250
300
INOP-OP1 MIOP-OP1 OHLB-OP1 OHLC-OP1 OHLP-OP1 OHOV-OP1
Deceased Living
Nu
mb
er
of
Don
ors

OPTN
Deceased and Living Donors2006
Region 11
0
50
100
150
200
250
KYDA NCCM NCNC SCOP TNDS TNMS VATB
Deceased Living
Nu
mb
er
of
Don
ors

OPTN
Deceased Donors by Type1997 - 2006
0
1,000
2,000
3,000
4,000
5,000
6,000
1997 1998 1999 2000 2001 2002 2003 2004 2005 2006
Year
Nu
mb
er o
f D
on
ors
SCD ECD DCD
5430
1945
647

OPTN
Standard Donors2004 - 2006
0
150
300
450
600
750
900
1,050
1 2 3 4 5 6 7 8 9 10 11
Region
2004 2005 2006
Nu
mb
er
of
Don
ors

OPTN
ECD Donors2004 - 2006
0
50
100
150
200
250
300
350
1 2 3 4 5 6 7 8 9 10 11
Region
2004 2005 2006
Nu
mb
er
of
Don
ors

OPTN
DCD Donors2004 - 2006
0
20
40
60
80
100
120
140
160
1 2 3 4 5 6 7 8 9 10 11
Region
2004 2005 2006
Nu
mb
er
of
Don
ors
OPTN
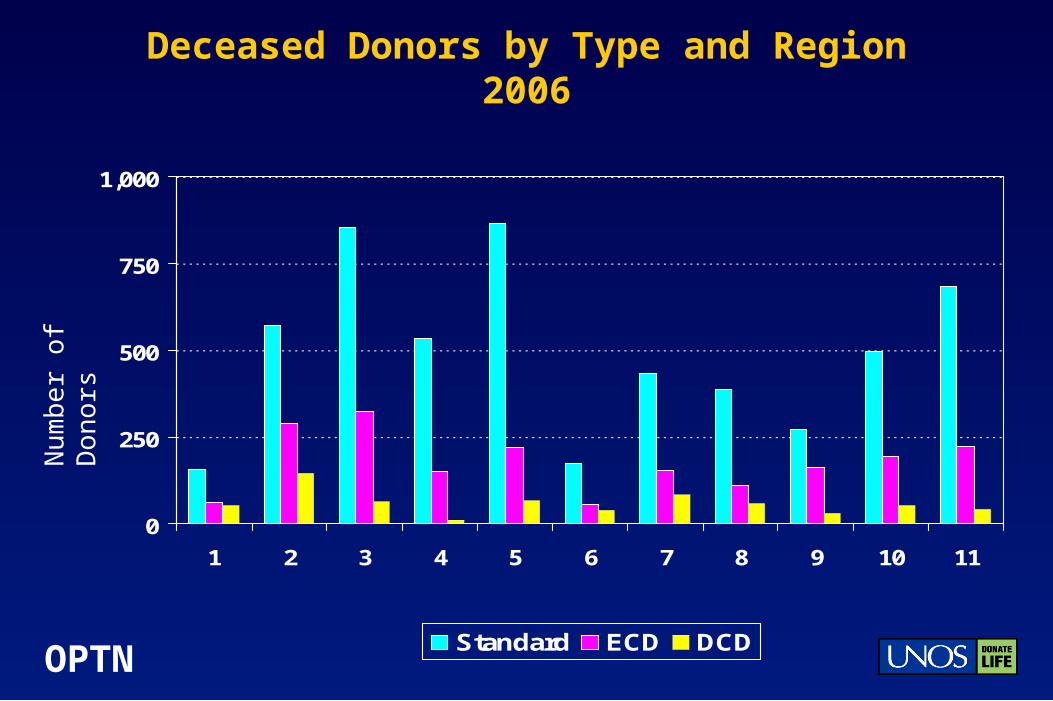
Deceased Donors by Type and Region2006
0
250
500
750
1,000
1 2 3 4 5 6 7 8 9 10 11
Standard ECD DCD
Nu
mb
er
of
Don
ors

OPTN
Deceased Donors by Type2006
Region 1
0
50
100
150
CTOP-OP1 NEOB-OP1
Standard ECD DCD
Nu
mb
er
of
Don
ors

OPTN
Deceased Donors by Type2006
Region 2
0
50
100
150
200
250
DCTC-OP1 MDPC-OP1 NJTO-OP1 PADV-OP1 PATF-OP1
Standard ECD DCD
Nu
mb
er
of
Don
ors

OPTN
Deceased Donors by Type2006
Region 3
0
50
100
150
200
ALOB AROR FLFH FLMP FLUF FLWC GALL LAOP MSOP PRLL
Standard ECD DCD
Nu
mb
er
of
Don
ors

OPTN
Deceased Donors by Type2006
Region 4
0
50
100
150
200
250
OKOP-OP1 TXGC-OP1 TXSA-OP1 TXSB-OP1
Standard ECD DCD
Nu
mb
er
of
Don
ors

OPTN
Deceased Donors by Type2006
Region 5
0
50
100
150
200
250
300
350
AZOB CADN CAGS CAOP CASD NMOP NVLV UTOP
Standard ECD DCD
Nu
mb
er
of
Don
ors

OPTN
Deceased Donors by Type2006
Region 6
0
25
50
75
100
HIOP-OP1 ORUO-IO1 WALC-OP1
Standard ECD DCD
Nu
mb
er
of
Don
ors

OPTN
Deceased Donors by Type2006
Region 7
0
50
100
150
200
250
ILIP-OP1 MNOP-OP1 WISE-IO1 WIUW-IO1
Standard ECD DCD
Nu
mb
er
of
Don
ors

OPTN
Deceased Donors by Type2006
Region 8
0
50
100
150
CORS-OP1 IAOP-OP1 MOMA-OP1 MWOB-OP1 NEOR-OP1
Standard ECD DCD
Nu
mb
er
of
Don
ors

OPTN
Deceased Donors by Type2006
Region 9
0
50
100
150
200
NYAP-OP1 NYFL-IO1 NYRT-OP1 NYWN-OP1
Standard ECD DCD
Nu
mb
er
of
Don
ors

OPTN
Deceased Donors by Type2006
Region 10
0
50
100
150
200
INOP-OP1 MIOP-OP1 OHLB-OP1 OHLC-OP1 OHLP-OP1 OHOV-OP1
Standard ECD DCD
Nu
mb
er
of
Don
ors

OPTN
Deceased Donors by Type2006
Region 11
0
50
100
150
200
KYDA NCCM NCNC SCOP TNDS TNMS VATB
Standard ECD DCD
Nu
mb
er
of
Don
ors

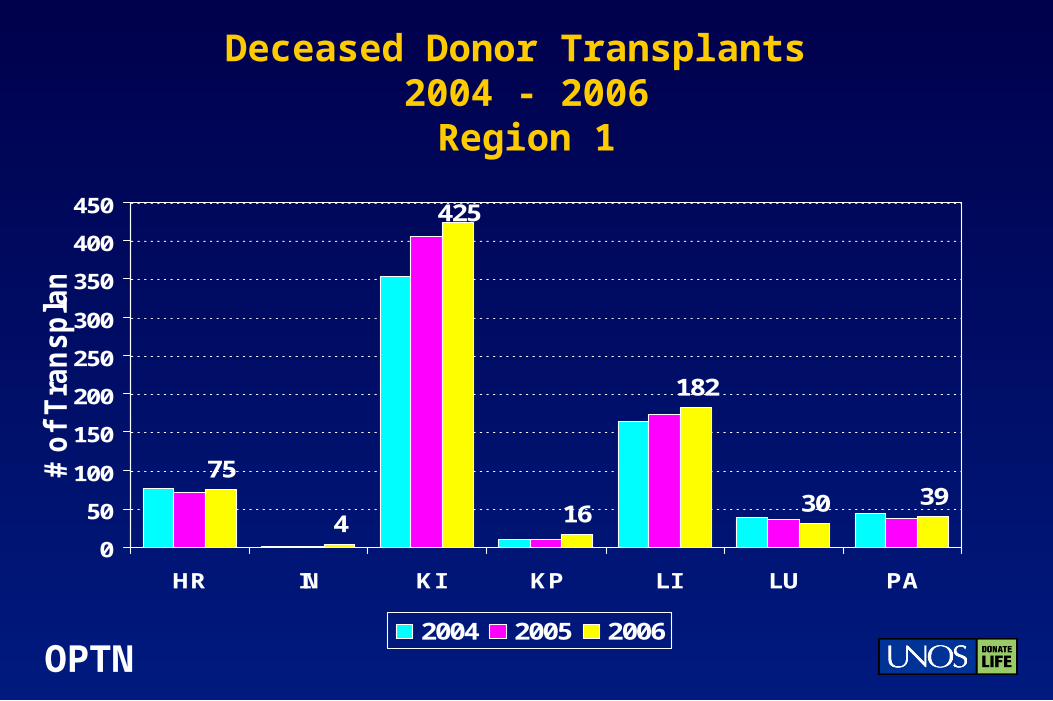
OPTN
Deceased Donor Transplants 2004 - 2006
4621401
6362
923
10659
171
2191
310
2000
4000
6000
8000
10000
12000
HL HR IN KI KP LI LU PA
# o
f T
ran
sp
lan
ts
2004 2005 2006
OPTN
Deceased Donor Transplants 2004 - 2006
Region 1
4 16
182
30 3975
425
0
50
100
150
200
250
300
350
400
450
HR IN KI KP LI LU PA
# o
f T
ran
sp
lan
ts
2004 2005 2006

OPTN
Deceased Donor Transplants 2004 - 2006
Region 2
10
312
62
1555
129
741
23473
0
200
400
600
800
1000
1200
1400
1600
1800
HL HR IN KI KP LI LU PA
# o
f T
ran
sp
lan
ts
2004 2005 2006

OPTN
Deceased Donor Transplants 2004 - 2006
Region 3
2
280
33138
938
18444
1382
0
200
400
600
800
1000
1200
1400
1600
HL HR IN KI KP LI LU PA
# o
f T
ran
sp
lan
ts
2004 2005 2006

OPTN
Deceased Donor Transplants 2004 - 2006
Region 4
2
197
2 40
575
116
12
933
0
200
400
600
800
1000
HL HR IN KI KP LI LU PA
# o
f T
ran
sp
lan
ts
2004 2005 2006

OPTN
Deceased Donor Transplants 2004 - 2006
Region 5
7
347
18159
897
18339
1623
0
200
400
600
800
1000
1200
1400
1600
1800
HL HR IN KI KP LI LU PA
# o
f T
ran
sp
lan
ts
2004 2005 2006

OPTN
Deceased Donor Transplants 2004 - 2006
Region 6
6037
205
52
9
343
0
100
200
300
400
HR KI KP LI LU PA
# o
f T
ran
sp
lan
ts
2004 2005 2006

OPTN
Deceased Donor Transplants 2004 - 2006
Region 7
0
209
5
119
575
135 110
932
0
200
400
600
800
1000
HL HR IN KI KP LI LU PA
# o
f T
ran
sp
lan
ts
2004 2005 2006

OPTN
Deceased Donor Transplants 2004 - 2006
Region 8
1
151
21 41
455
98
17
656
0
100
200
300
400
500
600
700
HL HR IN KI KP LI LU PA
# o
f T
ran
sp
lan
ts
2004 2005 2006

OPTN
Deceased Donor Transplants 2004 - 2006
Region 9
2
148
7
863
22
650
6215
0
100
200
300
400
500
600
700
800
900
1000
HL HR IN KI KP LI LU PA
# o
f T
ran
sp
lan
ts
2004 2005 2006

OPTN
Deceased Donor Transplants 2004 - 2006Region 10
6
211
18
125
576
14779
821
0
150
300
450
600
750
900
HL HR IN KI KP LI LU PA
# o
f T
ran
sp
lan
ts
2004 2005 2006

OPTN
Deceased Donor Transplants 2004 - 2006Region 11
1
201
1
1126
97
568
160
250
200
400
600
800
1000
1200
HL HR IN KI KP LI LU PA
# o
f T
ran
sp
lan
ts
2004 2005 2006
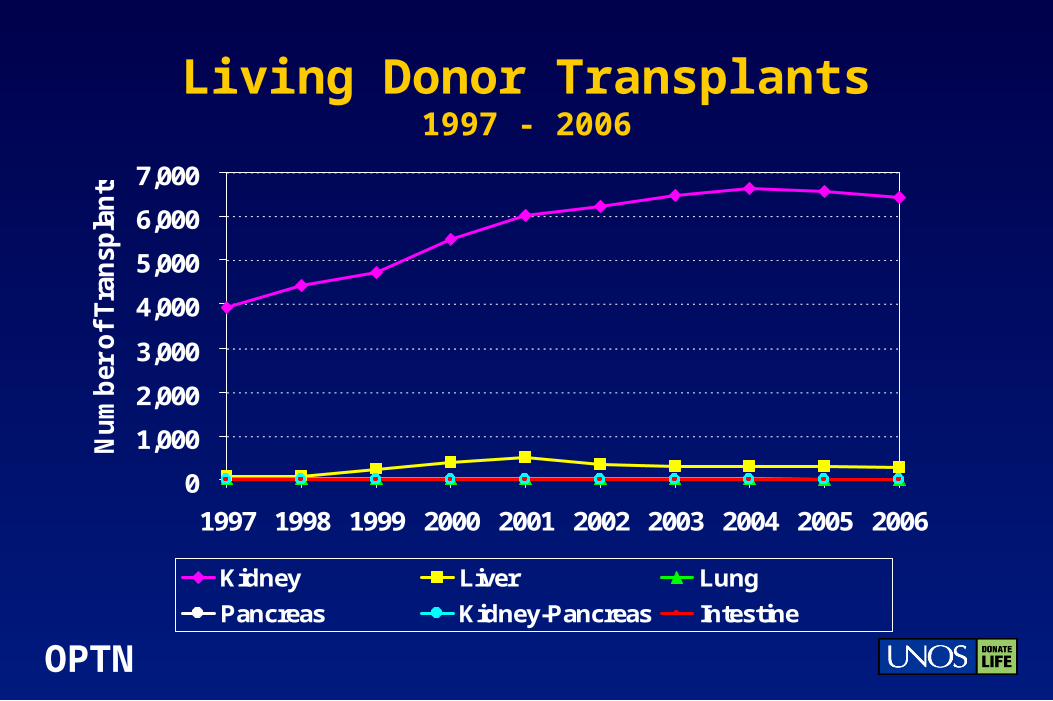
OPTN
Living Donor Transplants1997 - 2006
0
1,000
2,000
3,000
4,000
5,000
6,000
7,000
1997 1998 1999 2000 2001 2002 2003 2004 2005 2006
Nu
mb
er o
f T
ran
spla
nts
Kidney Liver Lung
Pancreas Kidney-Pancreas Intestine

OPTN
Living Donor Transplants1997 - 2006
0
100
200
300
400
500
600
1997 1998 1999 2000 2001 2002 2003 2004 2005 2006
Nu
mb
er o
f T
ran
spla
nts
Liver Lung Pancreas
Kidney-Pancreas Intestine

OPTN
Living Donor Transplants1997 - 2006
0
5
10
15
20
25
30
35
1997 1998 1999 2000 2001 2002 2003 2004 2005 2006
Nu
mb
er
of T
ran
sp
lan
ts
Lung Pancreas Kidney-Pancreas Intestine

OPTN
HRSA’s Program Goals Increase the number of deceased donor organs
transplanted each year until 42,800 are transplanted in 2013
0
10000
20000
30000
40000
50000
1990 1995 2000 2005 2010 2015
Year
Actual Program Goals
Org
ans
Txe
d
2006 Actual 24,461
2006 Goal 25,651

OPTN
HRSA’s Program GoalsDeceased Donor Organs Transplanted 2004-2006
0
1,000
2,000
3,000
4,000
1 2 3 4 5 6 7 8 9 10 11
Region
2004 2005 2006
Org
an
s Tra
nsp
lante
d

OPTN
HRSA’s Program GoalsDeceased Donor Organs Transplanted 2004-2006
Region 1
0
250
500
750
CTOP-OP1 NEOB-OP1
2004 2005 2006
Org
an
s Tra
nsp
lante
d

OPTN
HRSA’s Program GoalsDeceased Donor Organs Transplanted 2004-2006
Region 2
0
250
500
750
1000
1250
DCTC-OP1 MDPC-OP1 NJTO-OP1 PADV-OP1 PATF-OP1
2004 2005 2006
Org
an
s Tra
nsp
lante
d

OPTN
HRSA’s Program GoalsDeceased Donor Organs Transplanted 2004-2006
Region 3
0
250
500
750
ALOB AROR FLFH FLMP FLUF FLWC GALL LAOP MSOP PRLL
2004 2005 2006
Org
an
s Tra
nsp
lante
d

OPTN
HRSA’s Program GoalsDeceased Donor Organs Transplanted 2004-2006
Region 4
0
250
500
750
1000
OKOP-OP1 TXGC-OP1 TXSA-OP1 TXSB-OP1
2004 2005 2006
Org
an
s Tra
nsp
lante
d

OPTN
HRSA’s Program GoalsDeceased Donor Organs Transplanted 2004-2006
Region 5
0
250
500
750
1000
1250
AZOB CADN CAGS CAOP CASD NMOP NVLV UTOP
2004 2005 2006
Org
an
s Tra
nsp
lante
d

OPTN
HRSA’s Program GoalsDeceased Donor Organs Transplanted 2004-2006
Region 6
0
250
500
750
HIOP-OP1 ORUO-IO1 WALC-OP1
2004 2005 2006
Org
an
s Tra
nsp
lante
d

OPTN
HRSA’s Program GoalsDeceased Donor Organs Transplanted 2004-2006
Region 7
0
250
500
750
1000
ILIP-OP1 MNOP-OP1 WISE-IO1 WIUW-IO1
2004 2005 2006
Org
an
s Tra
nsp
lante
d

OPTN
HRSA’s Program GoalsDeceased Donor Organs Transplanted 2004-2006
Region 8
0
100
200
300
400
500
600
CORS-OP1 IAOP-OP1 MOMA-OP1 MWOB-OP1 NEOR
2004 2005 2006
Org
an
s Tra
nsp
lante
d

OPTN
HRSA’s Program GoalsDeceased Donor Organs Transplanted 2004-2006
Region 9
0
100
200
300
400
500
600
700
800
NYAP-OP1 NYFL-IO1 NYRT-OP1 NYWN-OP1
2004 2005 2006
Org
an
s Tra
nsp
lante
d

OPTN
HRSA’s Program GoalsDeceased Donor Organs Transplanted 2004-2006
Region 10
0
100
200
300
400
500
600
700
800
900
INOP-OP1 MIOP-OP1 OHLB-OP1 OHLC-OP1 OHLP-OP1 OHOV-OP1
2004 2005 2006
Org
an
s Tra
nsp
lante
d

OPTN
HRSA’s Program GoalsDeceased Donor Organs Transplanted 2004-2006
Region 11
0
100
200
300
400
500
600
700
KYDA NCCM NCNC SCOP TNDS TNMS VATB
2004 2005 2006
Org
an
s Tra
nsp
lante
d

OPTN
HRSA’s Program Goals Increase the number of non-DCD donors each year until
9251 is achieved in 2013
0
2000
4000
6000
8000
10000
1990 1995 2000 2005 2010 2015Year
Actual Program Goals
# N
on
-DC
D
2006 Actual 7375
2006 Goal 6920

OPTN
HRSA’s Program GoalsNon-DCD Donors Recovered 2004-2006
0
250
500
750
1,000
1,250
1 2 3 4 5 6 7 8 9 10 11
Region
2004 2005 2006
Don
ors
Reco
vere
d

OPTN
HRSA’s Program GoalsNon-DCD Donors Recovered 2004-2006
Region 1
0
50
100
150
200
CTOP-OP1 NEOB-OP1
2004 2005 2006
Don
ors
Reco
vere
d

OPTN
HRSA’s Program GoalsNon-DCD Donors Recovered 2004-2006
Region 2
0
100
200
300
DCTC-OP1 MDPC-OP1 NJTO-OP1 PADV-OP1 PATF-OP1
2004 2005 2006
Don
ors
Reco
vere
d

OPTN
HRSA’s Program GoalsNon-DCD Donors Recovered 2004-2006
Region 3
0
100
200
300
ALOB AROR FLFH FLMP FLUF FLWC GALL LAOP MSOP PRLL
2004 2005 2006
Don
ors
Reco
vere
d

OPTN
HRSA’s Program GoalsNon-DCD Donors Recovered 2004-2006
Region 4
0
100
200
300
OKOP-OP1 TXGC-OP1 TXSA-OP1 TXSB-OP1
2004 2005 2006
Don
ors
Reco
vere
d

OPTN
HRSA’s Program GoalsNon-DCD Donors Recovered 2004-2006
Region 5
0
100
200
300
400
AZOB CADN CAGS CAOP CASD NMOP NVLV UTOP
2004 2005 2006
Don
ors
Reco
vere
d

OPTN
HRSA’s Program GoalsNon-DCD Donors Recovered 2004-2006
Region 6
0
50
100
150
HIOP-OP1 ORUO-IO1 WALC-OP1
2004 2005 2006
Don
ors
Reco
vere
d

OPTN
HRSA’s Program GoalsNon-DCD Donors Recovered 2004-2006
Region 7
0
100
200
300
ILIP-OP1 MNOP-OP1 WISE-IO1 WIUW-IO1
2004 2005 2006
Don
ors
Reco
vere
d

OPTN
HRSA’s Program GoalsNon-DCD Donors Recovered 2004-2006
Region 8
0
50
100
150
200
CORS-OP1 IAOP-OP1 MOMA-OP1 MWOB-OP1 NEOR
2004 2005 2006
Don
ors
Reco
vere
d

OPTN
HRSA’s Program GoalsNon-DCD Donors Recovered 2004-2006
Region 9
0
100
200
300
NYAP-OP1 NYFL-IO1 NYRT-OP1 NYWN-OP1
2004 2005 2006
Don
ors
Reco
vere
d

OPTN
HRSA’s Program GoalsNon-DCD Donors Recovered 2004-2006
Region 10
0
100
200
300
INOP-OP1 MIOP-OP1 OHLB-OP1 OHLC-OP1 OHLP-OP1 OHOV-OP1
2004 2005 2006
Don
ors
Reco
vere
d

OPTN
HRSA’s Program GoalsNon-DCD Donors Recovered 2004-2006
Region 11
0
50
100
150
200
KYDA NCCM NCNC SCOP TNDS TNMS VATB
2004 2005 2006
Don
ors
Reco
vere
d

OPTN
HRSA’s Program GOALS Increase the number of DCD donors each year until 2018
is achieved in 2013
0
500
1000
1500
2000
2500
1993 1998 2003 2008 2013
Year
# D
CD
Actual Program Goals
2006 Actual 647
2006 Goal 793

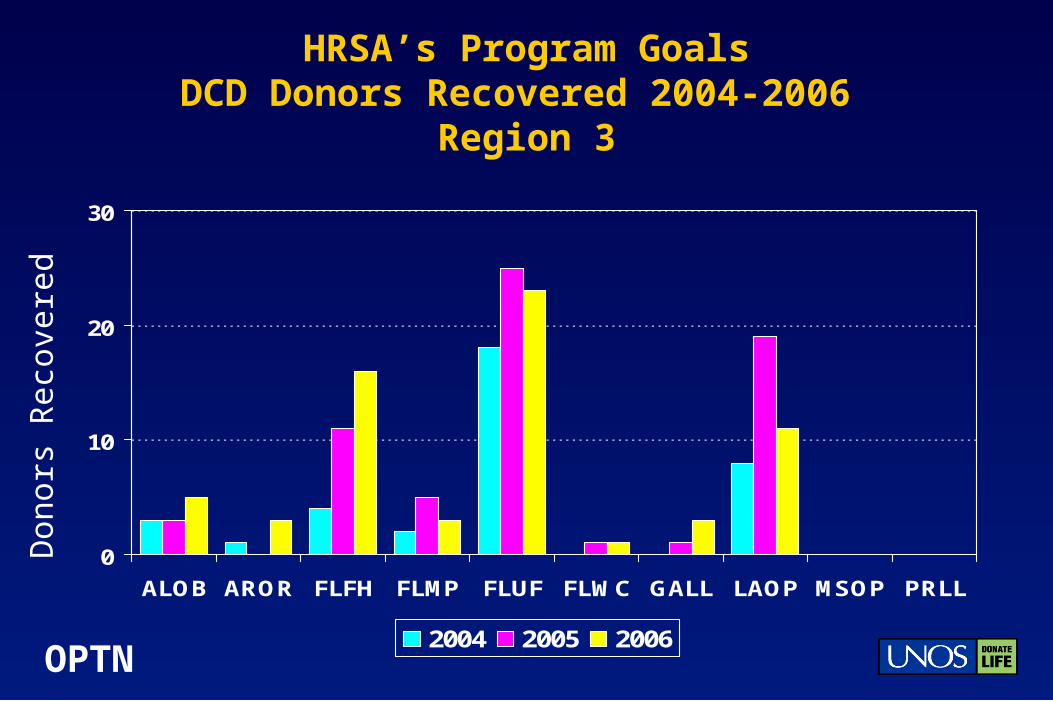
OPTN
HRSA’s Program GoalsDCD Donors Recovered 2004-2006
0
50
100
150
1 2 3 4 5 6 7 8 9 10 11
Region
2004 2005 2006
Don
ors
Reco
vere
d

OPTN
HRSA’s Program GoalsDCD Donors Recovered 2004-2006
Region 1
0
10
20
30
40
50
CTOP-OP1 NEOB-OP1
2004 2005 2006
Don
ors
Reco
vere
d

OPTN
HRSA’s Program GoalsDCD Donors Recovered 2004-2006
Region 2
0
10
20
30
40
50
60
70
80
DCTC-OP1 MDPC-OP1 NJTO-OP1 PADV-OP1 PATF-OP1
2004 2005 2006
Don
ors
Reco
vere
d
OPTN
HRSA’s Program GoalsDCD Donors Recovered 2004-2006
Region 3
0
10
20
30
ALOB AROR FLFH FLMP FLUF FLWC GALL LAOP MSOP PRLL
2004 2005 2006
Don
ors
Reco
vere
d

OPTN
HRSA’s Program GoalsDCD Donors Recovered 2004-2006
Region 4
0
1
2
3
4
5
OKOP-OP1 TXGC-OP1 TXSA-OP1 TXSB-OP1
2004 2005 2006
Don
ors
Reco
vere
d

OPTN
HRSA’s Program GoalsDCD Donors Recovered 2004-2006
Region 5
0
5
10
15
20
AZOB CADN CAGS CAOP CASD NMOP NVLV UTOP
2004 2005 2006
Don
ors
Reco
vere
d

OPTN
HRSA’s Program GoalsDCD Donors Recovered 2004-2006
Region 6
0
5
10
15
20
25
30
35
HIOP-OP1 ORUO-IO1 WALC-OP1
2004 2005 2006
Don
ors
Reco
vere
d

OPTN
HRSA’s Program GoalsDCD Donors Recovered 2004-2006
Region 7
0
10
20
30
40
50
ILIP-OP1 MNOP-OP1 WISE-IO1 WIUW-IO1
2004 2005 2006
Don
ors
Reco
vere
d

OPTN
HRSA’s Program GoalsDCD Donors Recovered 2004-2006
Region 8
0
5
10
15
20
25
30
35
CORS-OP1 IAOP-OP1 MOMA-OP1 MWOB-OP1 NEOR
2004 2005 2006
Don
ors
Reco
vere
d

OPTN
HRSA’s Program GoalsDCD Donors Recovered 2004-2006
Region 9
0
5
10
15
20
NYAP-OP1 NYFL-IO1 NYRT-OP1 NYWN-OP1
2004 2005 2006
Don
ors
Reco
vere
d

OPTN
HRSA’s Program GoalsDCD Donors Recovered 2004-2006
Region 10
0
5
10
15
20
25
30
35
INOP-OP1 MIOP-OP1 OHLB-OP1 OHLC-OP1 OHLP-OP1 OHOV-OP1
2004 2005 2006
Don
ors
Reco
vere
d

OPTN
HRSA’s Program GoalsDCD Donors Recovered 2004-2006
Region 11
0
5
10
15
KYDA NCCM NCNC SCOP TNDS TNMS VATB
2004 2005 2006
Don
ors
Reco
vere
d

OPTN
HRSA’s Program Goals
Increase the average number of organs transplanted per DCD donors each year by 0.096 to reach 3.0 in 2013
1.5
1.7
1.9
2.1
2.3
2.5
2.7
2.9
3.1
1993 1998 2003 2008 2013Year
Actual Program Goals
OT
PD
2006 Actual 2.11
2006 Goal 2.33

OPTN
HRSA’s Program GoalsOrgans Transplanted Per DCD Donor
2004 - 2006
0
1
2
3
1 2 3 4 5 6 7 8 9 10 11
Region
OT
PD
2004 2005 2006

OPTN
HRSA’s Program GoalsOrgans Transplanted Per DCD Donor 2004 - 2006
Region 1
0
0.5
1
1.5
2
2.5
3
3.5
4
4.5
CTOP-OP1 NEOB-OP1
OT
PD
2004 2005 2006

OPTN
HRSA’s Program GoalsOrgans Transplanted Per DCD Donor 2004 - 2006
Region 2
0
0.5
1
1.5
2
2.5
3
3.5
DCTC-OP1 MDPC-OP1 NJTO-OP1 PADV-OP1 PATF-OP1
OT
PD
2004 2005 2006

OPTN
HRSA’s Program GoalsOrgans Transplanted Per DCD Donor 2004 - 2006
Region 3
0
0.5
1
1.5
2
2.5
3
3.5
4
4.5
ALOB AROR FLFH FLMP FLUF FLWC GALL LAOP
OT
PD
2004 2005 2006

OPTN
HRSA’s Program Goals Organs Transplanted Per DCD Donor 2004 - 2006
Region 4
0
0.5
1
1.5
2
2.5
3
3.5
OKOP-OP1 TXGC-OP1 TXSA-OP1 TXSB-OP1
OT
PD
2004 2005 2006

OPTN
HRSA’s Program GoalsOrgans Transplanted Per DCD Donor 2004 - 2006
Region 5
0
0.5
1
1.5
2
2.5
3
3.5
AZOB CADN CAGS CAOP CASD NVLV UTOP
OT
PD
2004 2005 2006

OPTN
HRSA’s Program GoalsOrgans Transplanted Per DCD Donor 2004 - 2006
Region 6
0
0.5
1
1.5
2
2.5
3
3.5
HIOP-OP1 ORUO-IO1 WALC-OP1
OT
PD
2004 2005 2006

OPTN
HRSA’s Program GoalsOrgans Transplanted Per DCD Donor 2004 - 2006
Region 7
0
0.5
1
1.5
2
2.5
3
3.5
ILIP-OP1 MNOP-OP1 WISE-IO1 WIUW-IO1
OT
PD
2004 2005 2006

OPTN
HRSA’s Program GoalsOrgans Transplanted Per DCD Donor 2004 - 2006
Region 8
0
0.5
1
1.5
2
2.5
3
3.5
CORS-OP1 IAOP-OP1 MOMA-OP1 MWOB-OP1 NEOR
OT
PD
2004 2005 2006

OPTN
HRSA’s Program GoalsOrgans Transplanted Per DCD Donor 2004 - 2006
Region 9
0
0.5
1
1.5
2
2.5
3
3.5
4
NYAP-OP1 NYFL-IO1 NYRT-OP1 NYWN-OP1
OT
PD
2004 2005 2006

OPTN
HRSA’s Program GoalsOrgans Transplanted Per DCD Donor 2004 - 2006
Region 10
0
0.5
1
1.5
2
2.5
3
3.5
INOP-OP1 MIOP-OP1 OHLB-OP1 OHLC-OP1 OHLP-OP1 OHOV-OP1
OT
PD
2004 2005 2006

OPTN
HRSA’s Program GoalsOrgans Transplanted Per DCD Donor 2004 - 2006
Region 11
0
0.5
1
1.5
2
2.5
3
3.5
KYDA NCCM NCNC SCOP TNDS TNMS VATB
OT
PD
2004 2005 2006

OPTN
HRSA’s Program Goals
Increase the average number of organs transplanted per non-DCD donors each year by 0.080 to reach 4.0 in 2013
2.52.72.93.13.33.53.73.94.1
1990 1995 2000 2005 2010 2015
Year
Actual Program Goals
OT
PD
2006 Actual 3.13
2006 Goal 3.44

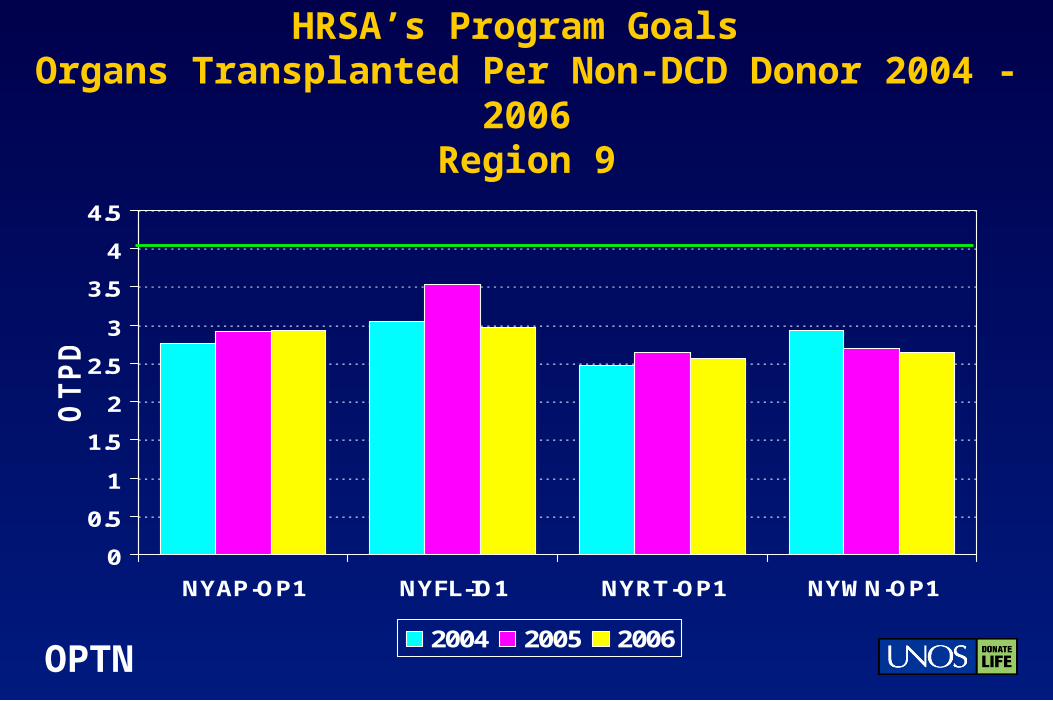
OPTN
HRSA’s Program GoalsOrgans Transplanted Per Non-DCD Donor
2004 - 2006
0
1
2
3
4
1 2 3 4 5 6 7 8 9 10 11
Region
OT
PD
2004 2005 2006

OPTN
HRSA’s Program GoalsOrgans Transplanted Per Non-DCD Donor 2004 - 2006
Region 1
0
0.5
1
1.5
2
2.5
3
3.5
4
4.5
CTOP-OP1 NEOB-OP1
OT
PD
2004 2005 2006

OPTN
HRSA’s Program GoalsOrgans Transplanted Per Non-DCD Donor 2004 - 2006
Region 2
0
0.5
1
1.5
2
2.5
3
3.5
4
4.5
DCTC-OP1 MDPC-OP1 NJTO-OP1 PADV-OP1 PATF-OP1
OT
PD
2004 2005 2006

OPTN
HRSA’s Program Goals Organs Transplanted Per Non-DCD Donor 2004 - 2006
Region 3
0
0.5
1
1.5
2
2.5
3
3.5
4
4.5
ALOB AROR FLFH FLMP FLUF FLWC GALL LAOP MSOP PRLL
OT
PD
2004 2005 2006

OPTN
HRSA’s Program Goals Organs Transplanted Per Non-DCD Donor 2004 - 2006
Region 4
0
0.5
1
1.5
2
2.5
3
3.5
4
4.5
OKOP-OP1 TXGC-OP1 TXSA-OP1 TXSB-OP1
OT
PD
2004 2005 2006

OPTN
HRSA’s Program Goals Organs Transplanted Per Non-DCD Donor 2004 - 2006
Region 5
0
0.5
1
1.5
2
2.5
3
3.5
4
4.5
AZOB CADN CAGS CAOP CASD NMOP NVLV UTOP
OT
PD
2004 2005 2006

OPTN
HRSA’s Program Goals Organs Transplanted Per Non-DCD Donor 2004 - 2006
Region 6
0
0.5
1
1.5
2
2.5
3
3.5
4
4.5
HIOP-OP1 ORUO-IO1 WALC-OP1
OT
PD
2004 2005 2006

OPTN
HRSA’s Program Goals Organs Transplanted Per Non-DCD Donor 2004 - 2006
Region 7
0
0.5
1
1.5
2
2.5
3
3.5
4
4.5
ILIP-OP1 MNOP-OP1 WISE-IO1 WIUW-IO1
OT
PD
2004 2005 2006

OPTN
HRSA’s Program Goals Organs Transplanted Per Non-DCD Donor 2004 - 2006
Region 8
0
0.5
1
1.5
2
2.5
3
3.5
4
4.5
CORS-OP1 IAOP-OP1 MOMA-OP1 MWOB-OP1 NEOR
OT
PD
2004 2005 2006
OPTN
HRSA’s Program Goals Organs Transplanted Per Non-DCD Donor 2004 - 2006
Region 9
0
0.5
1
1.5
2
2.5
3
3.5
4
4.5
NYAP-OP1 NYFL-IO1 NYRT-OP1 NYWN-OP1
OT
PD
2004 2005 2006

OPTN
HRSA’s Program Goals Organs Transplanted Per Non-DCD Donor 2004 - 2006
Region 10
0
0.5
1
1.5
2
2.5
3
3.5
4
4.5
INOP-OP1 MIOP-OP1 OHLB-OP1 OHLC-OP1 OHLP-OP1 OHOV-OP1
OT
PD
2004 2005 2006

OPTN
HRSA’s Program Goals Organs Transplanted Per Non-DCD Donor 2004 - 2006
Region 11
0
0.5
1
1.5
2
2.5
3
3.5
4
4.5
KYDA NCCM NCNC SCOP TNDS TNMS VATB
OT
PD
2004 2005 2006


