20
Regional Performance of the IPCC-AR4 Models in Simulating Present-Day Mean Climate Junsu Kim and Thomas Reichler University of Utah, Salt Lake City, USA
| Date post: | 31-Dec-2015 |
| Category: |
Documents |
| Upload: | sebastian-moore |
| View: | 32 times |
| Download: | 0 times |
Regional Performance of the
IPCC-AR4 Models
in Simulating Present-Day Mean Climate
Junsu Kim and Thomas Reichler University of Utah, Salt Lake City, USA
Introduction• Previous work
– “How well do coupled models simulate today’s climate?” (Reichler and Kim 2008, BAMS, JGR)
– 3 model generations: CMIP-1 to CMIP-3– Focus: Global performance skill
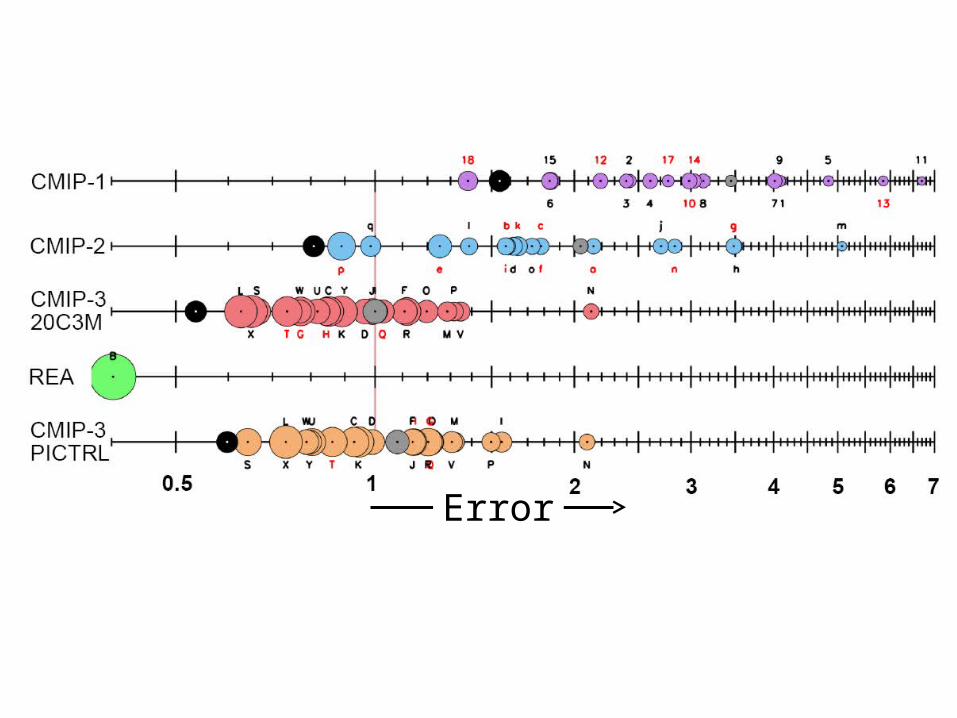
Error
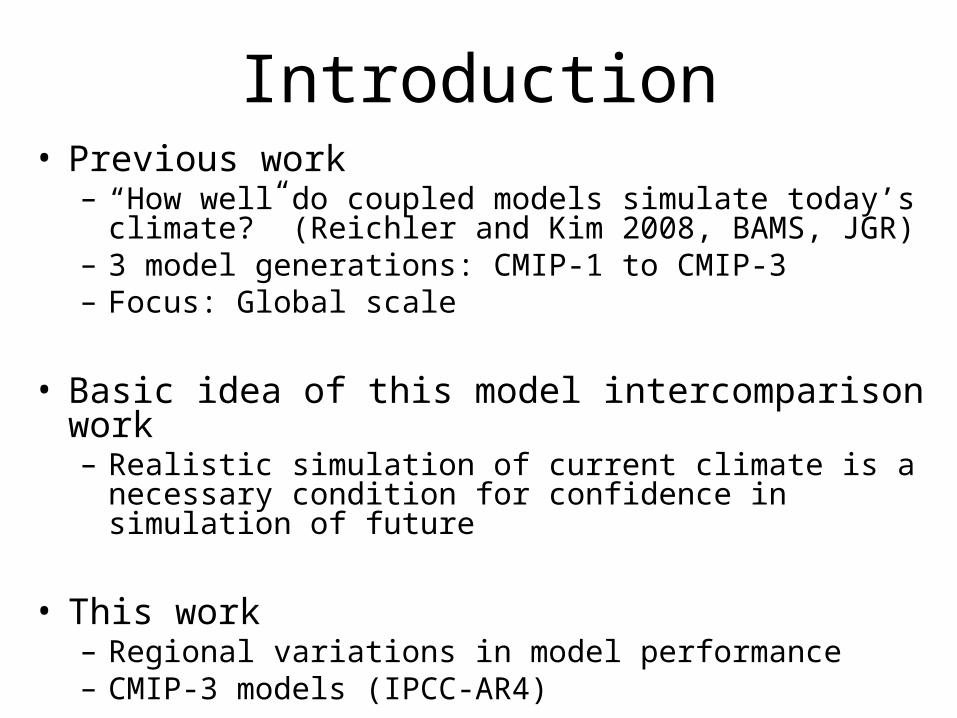
Introduction• Previous work
– “How well do coupled models simulate today’s climate?” (Reichler and Kim 2008, BAMS, JGR)
– 3 model generations: CMIP-1 to CMIP-3– Focus: Global scale
• Basic idea of this model intercomparison work– Realistic simulation of current climate is a necessary condition
for confidence in simulation of future
• This work– Regional variations in model performance– CMIP-3 models (IPCC-AR4)
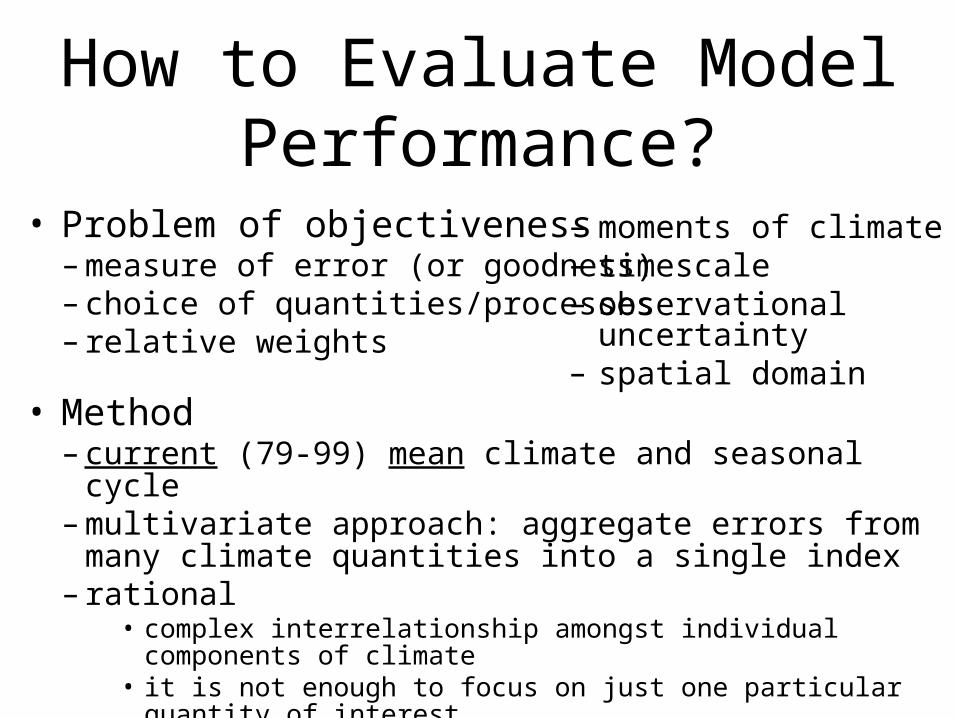
How to Evaluate Model Performance?
• Problem of objectiveness– measure of error (or goodness)– choice of quantities/processes– relative weights
• Method– current (79-99) mean climate and seasonal cycle– multivariate approach: aggregate errors from many climate
quantities into a single index– rational
• complex interrelationship amongst individual components of climate• it is not enough to focus on just one particular quantity of interest• to have confidence in a model, it must simulate every aspect of climate
well
– moments of climate– timescale– observational uncertainty– spatial domain
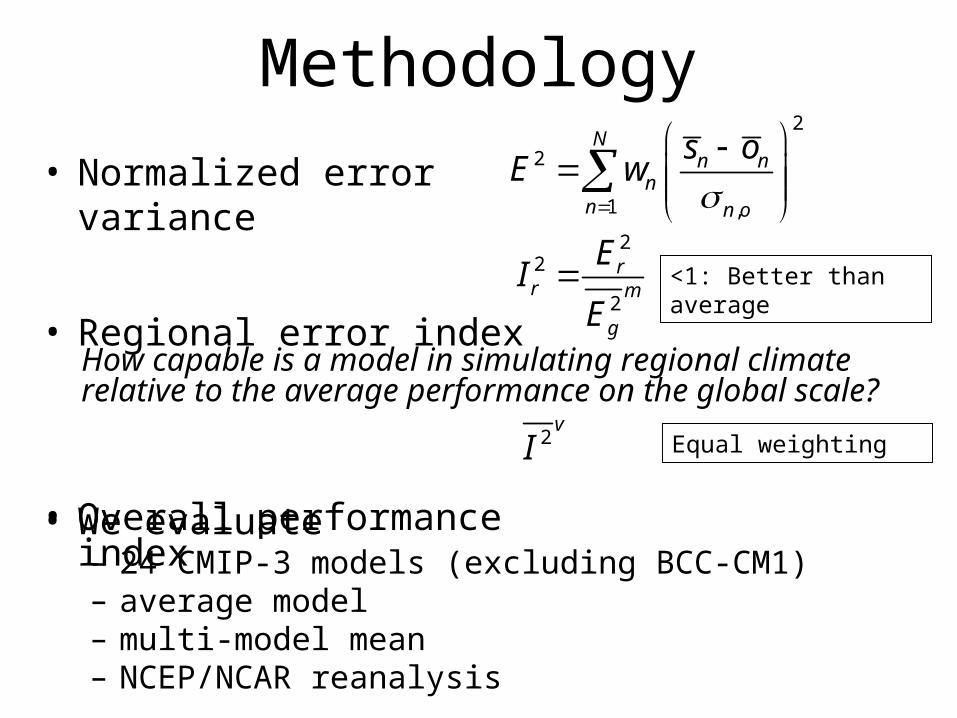
Methodology
• Normalized error variance
• Regional error index
• Overall performance index
2
2
1 ,
Nn n
nn n o
s oE w
22
2
rr m
g
EI
E <1: Better than average
2v
I Equal weighting
How capable is a model in simulating regional climate relative to the average performance on the global scale?
• We evaluate– 24 CMIP-3 models (excluding BCC-CM1)– average model– multi-model mean– NCEP/NCAR reanalysis
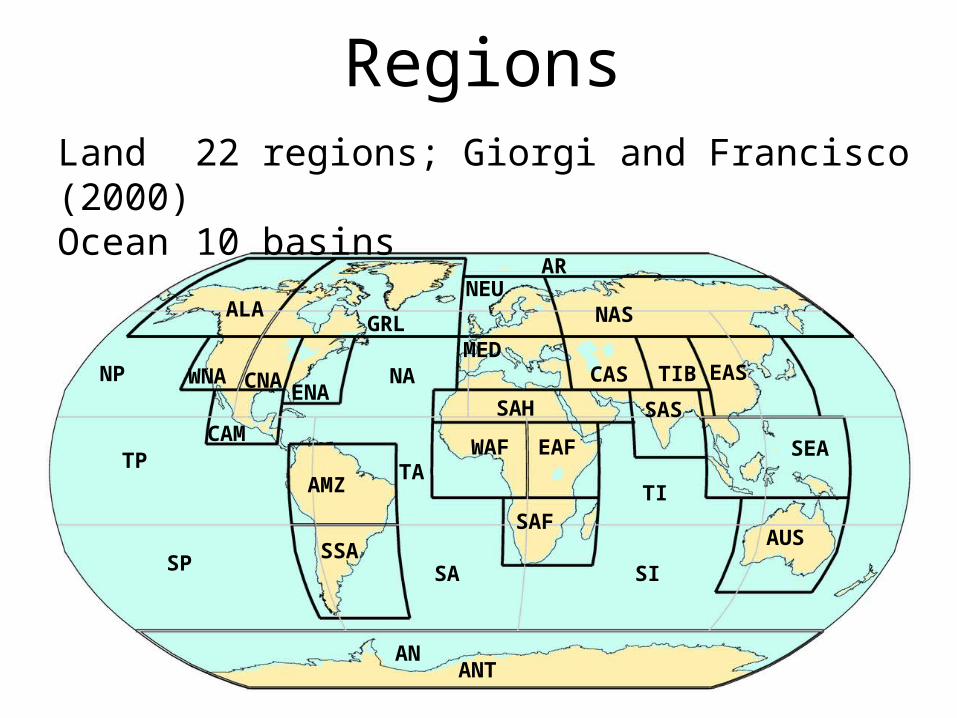
Regions
ALA
WNA CNAENA
GRL
CAM
AMZ
SSA
NEU
MED
SAH
WAF
EAF
SAF
CAS
NAS
TIB
SAS
EAS
SEA
AUS
ANT
AR
NP
TP
SP
NA
TA
SA SI
TI
AN
Land 22 regions; Giorgi and Francisco (2000)Ocean 10 basins
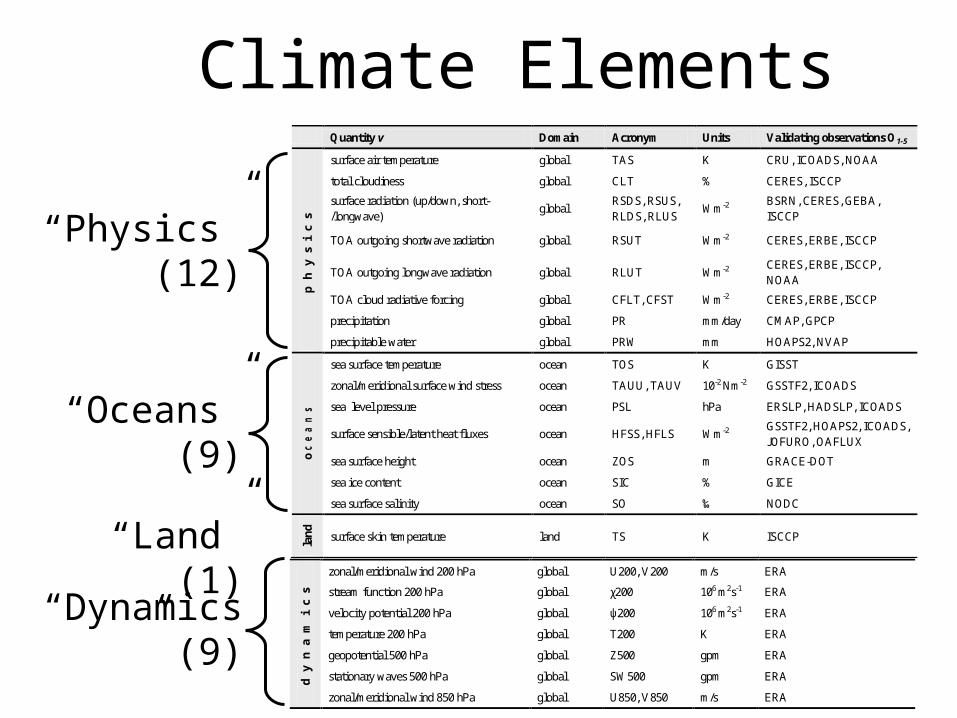
Climate Elements
8
“Physics” (12)
“Dynamics” (9)
“Oceans” (9)
“Land” (1)
dy
na
mi
cs
zonal/meridional wind 200 hPa global U200, V200 m/s ERA
stream function 200 hPa global χ200 106 m2s-1 ERA
velocity potential 200 hPa global ψ200 106 m2s-1 ERA
temperature 200 hPa global T200 K ERA
geopotential 500 hPa global Z500 gpm ERA
stationary waves 500 hPa global SW500 gpm ERA
zonal/meridional wind 850 hPa global U850, V850 m/s ERA
Quantity v Domain Acronym Units Validating observations O1-5
ph
ys
ic
s
surface air temperature global TAS K CRU, ICOADS, NOAA
total cloudiness global CLT % CERES, ISCCP
surface radiation (up/down, short-/longwave)
global RSDS, RSUS, RLDS, RLUS
Wm-2 BSRN, CERES, GEBA, ISCCP
TOA outgoing shortwave radiation global RSUT Wm-2 CERES, ERBE, ISCCP
TOA outgoing longwave radiation global RLUT Wm-2 CERES, ERBE, ISCCP, NOAA
TOA cloud radiative forcing global CFLT, CFST Wm-2 CERES, ERBE, ISCCP
precipitation global PR mm/day CMAP, GPCP
precipitable water global PRW mm HOAPS2, NVAP
o c
e a
n s
sea surface temperature ocean TOS K GISST
zonal/meridional surface wind stress ocean TAUU, TAUV 10-2 Nm-2 GSSTF2, ICOADS
sea level pressure ocean PSL hPa ERSLP, HADSLP, ICOADS
surface sensible/latent heat fluxes ocean HFSS, HFLS Wm-2 GSSTF2, HOAPS2, ICOADS, JOFURO, OAFLUX
sea surface height ocean ZOS m GRACE-DOT
sea ice content ocean SIC % GICE
sea surface salinity ocean SO ‰ NODC
lan
d
surface skin temperature land TS K ISCCP

Results
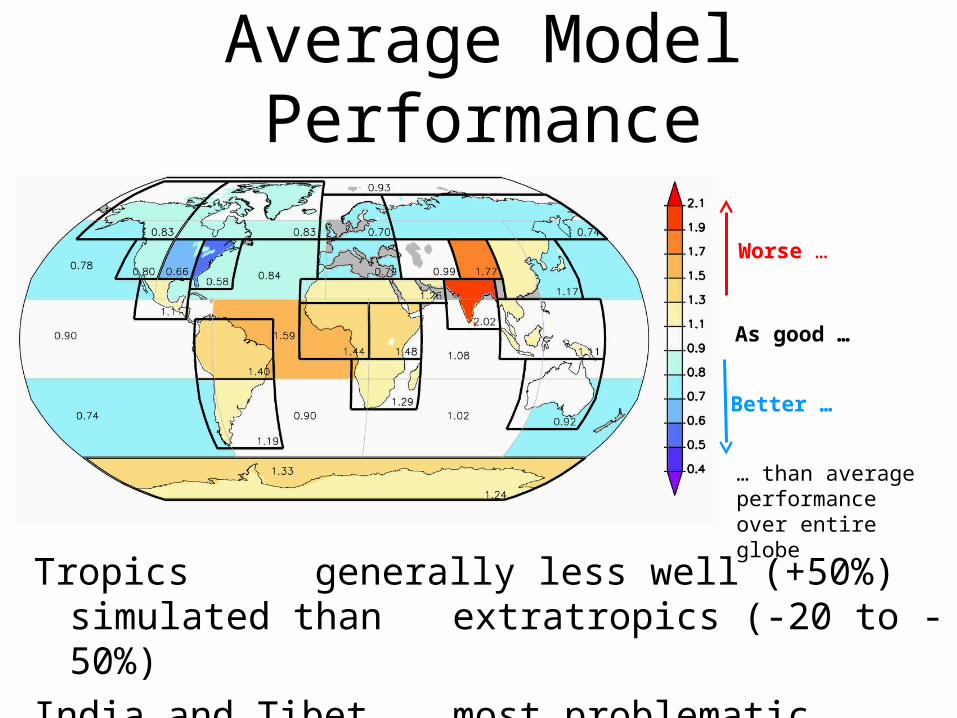
Average Model Performance
Tropics generally less well (+50%) simulated than extratropics (-20 to -50%)
India and Tibet most problematic (+100%)
… than average performance over entire globe
As good …
Better …
Worse …
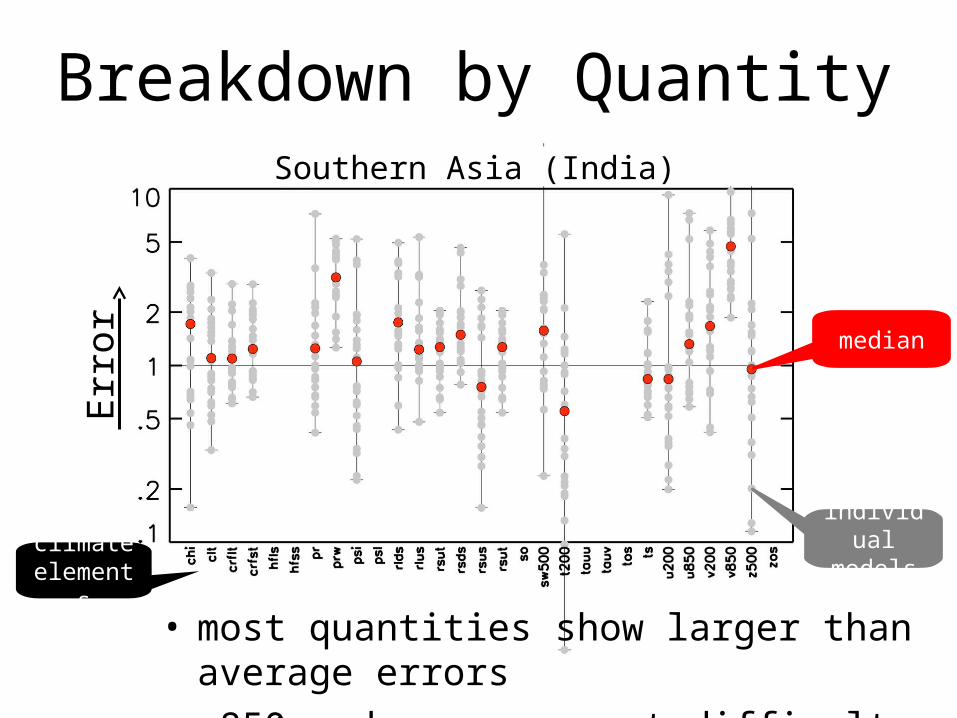
Breakdown by Quantity
individual models
median
• most quantities show larger than average errors• v850 and prw are most difficult
Southern Asia (India)
climate elements
Err
or
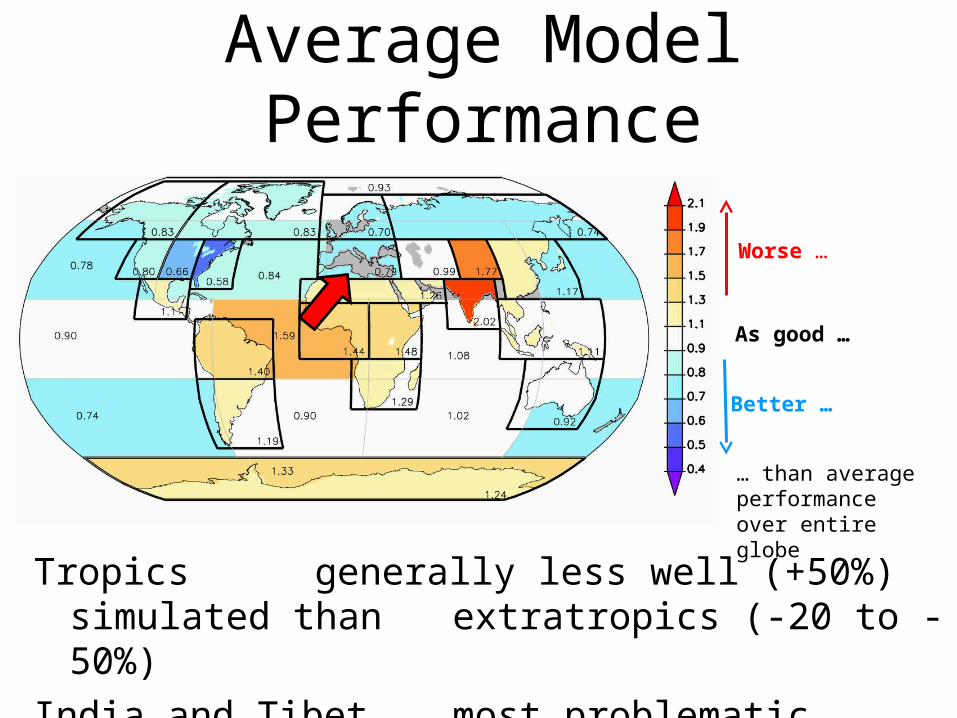
Average Model Performance
Tropics generally less well (+50%) simulated than extratropics (-20 to -50%)
India and Tibet most problematic (+100%)
… than average performance over entire globe
As good …
Better …
Worse …
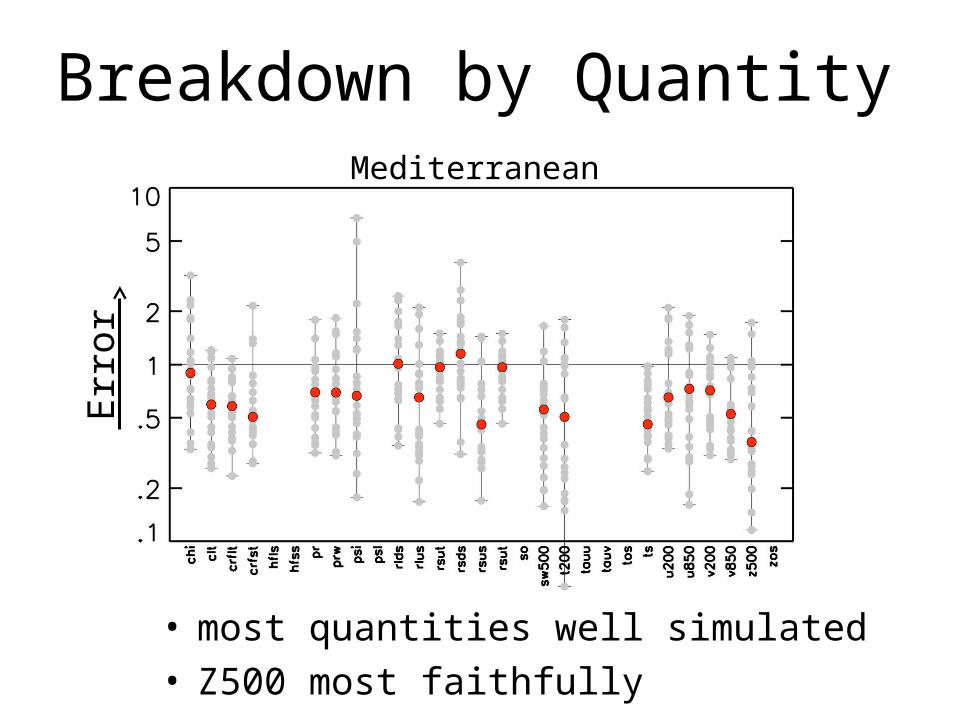
Breakdown by Quantity
• most quantities well simulated• Z500 most faithfully
Mediterranean
Err
or
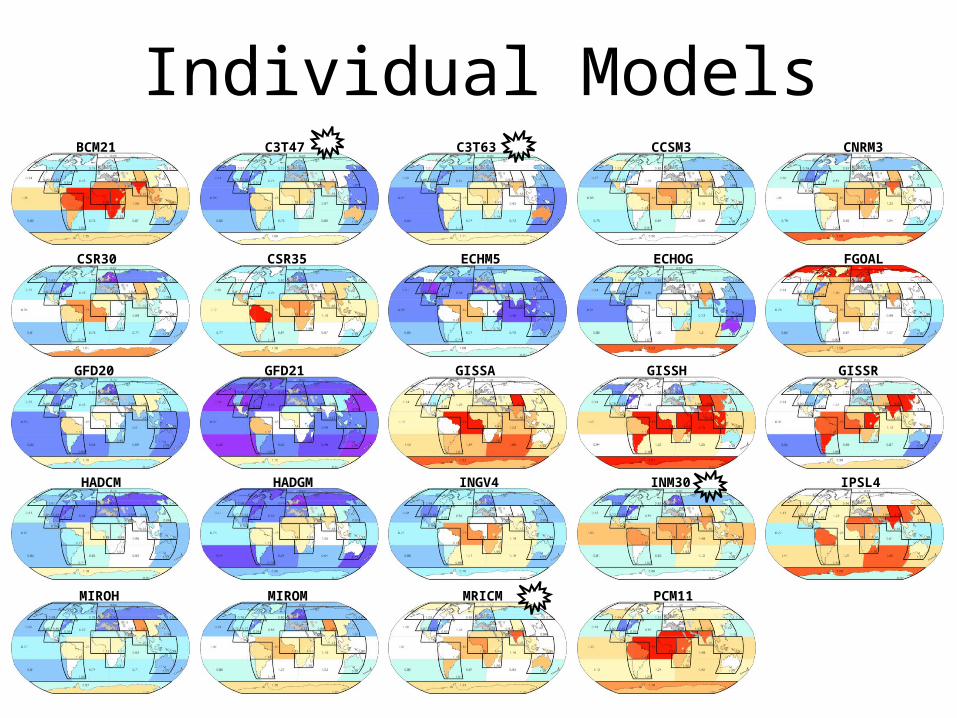
HADCM HADGM INGV4 INM30 IPSL4
MIROH MRICM PCM11MIROM
GFD20 GFD21 GISSA GISSH GISSR
CSR30 CSR35 ECHM5 ECHOG FGOAL
BCM21 C3T47 C3T63 CCSM3 CNRM3
Individual Models
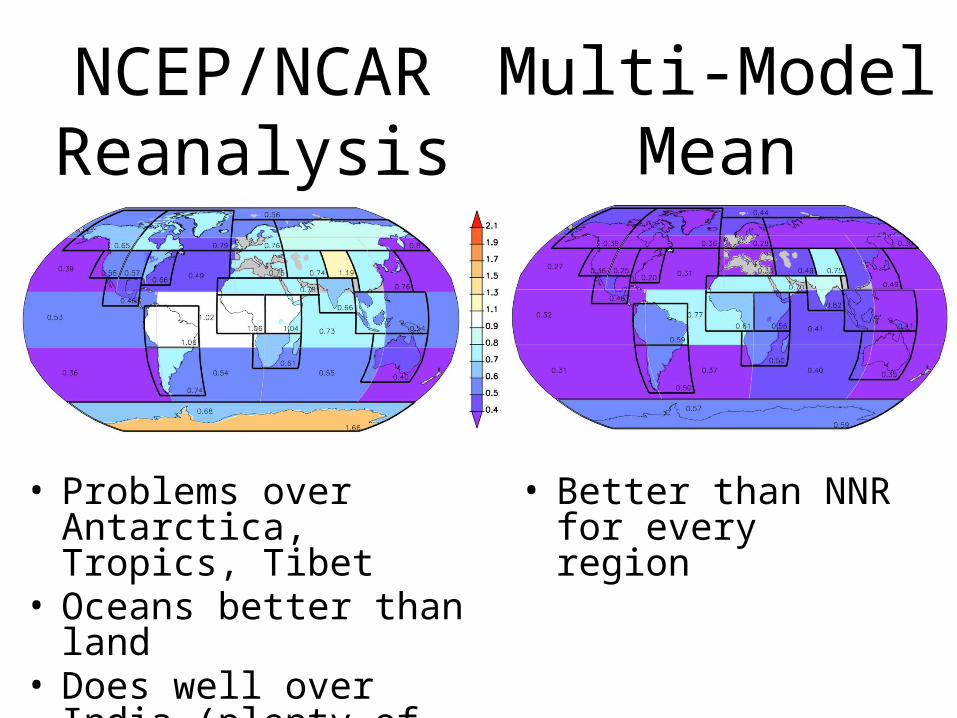
NCEP/NCAR Reanalysis
• Problems over Antarctica, Tropics, Tibet
• Oceans better than land• Does well over India
(plenty of observations)
Multi-Model Mean
• Better than NNR for every region
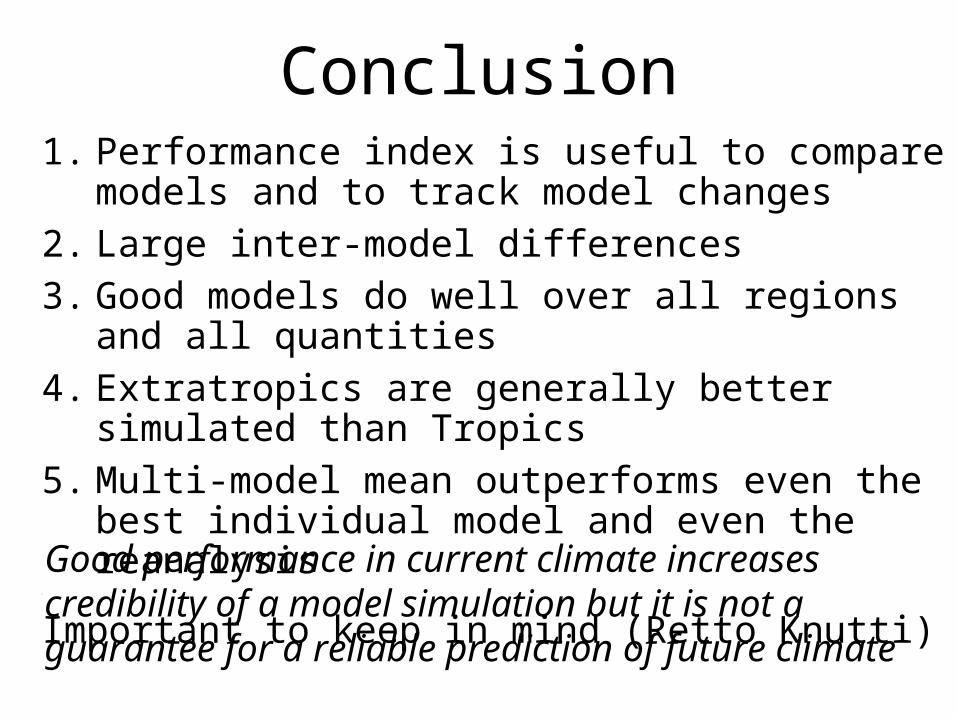
Conclusion1. Performance index is useful to compare models and to
track model changes2. Large inter-model differences3. Good models do well over all regions and all quantities4. Extratropics are generally better simulated than Tropics5. Multi-model mean outperforms even the best individual
model and even the reanalysis6.
Important to keep in mind (Retto Knutti)Good performance in current climate increases credibility of a model simulation but it is not a guarantee for a reliable prediction of future climate
Thank You
Reichler, T., and J. Kim (2008): Uncertainties in the climate mean state of global observations, reanalyses, and the GFDL climate model, J. Geophys. Res., 113
Reichler, T., and J. Kim (2008): How Well do Coupled Models Simulate Today's Climate? Bull. Amer. Meteor. Soc, 89, 303-311.
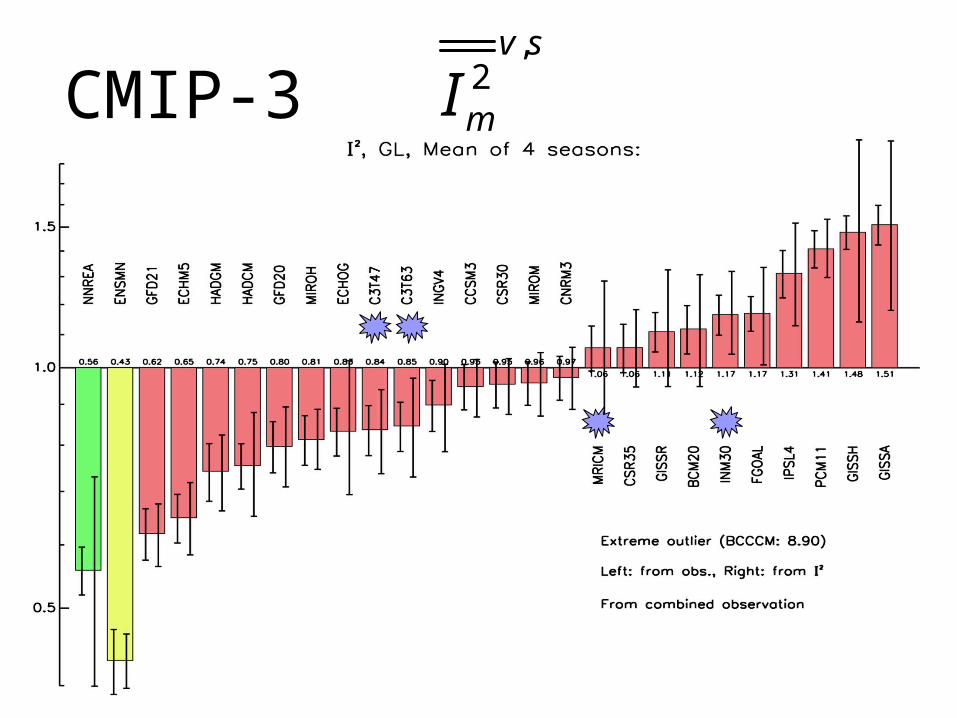
CMIP-3 ,
2v s
mI
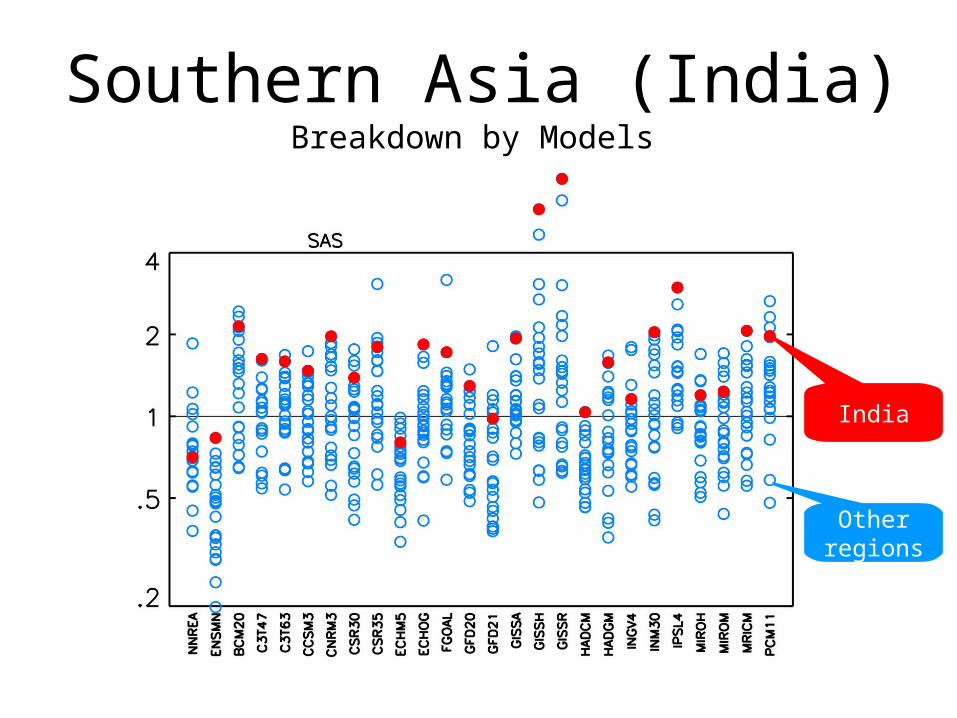
Southern Asia (India)Breakdown by Models
Other regions
India
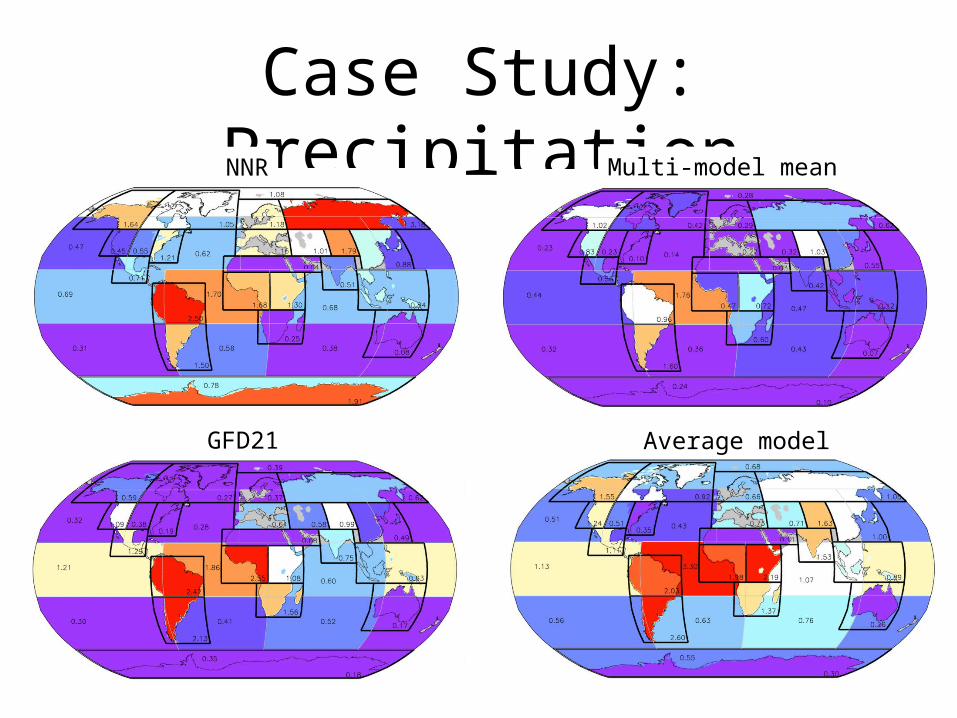
Case Study: PrecipitationNNR Multi-model mean
Average modelGFD21


