REGIONAL PROFILE ZONE 3 – ATLANTA REGIONAL COMMISSION TABLE OF CONTENTS ZONE POPULATION ........................................................................................................ 2 RACIAL/ETHNIC COMPOSITION ..................................................................................... 2 MEDIAN ANNUAL INCOME ............................................................................................. 3 EDUCATIONAL ACHIEVEMENT ...................................................................................... 4 GEORGIA COMPETITIVENESS INITIATIVE REPORT .................................................... 10 RESOURCES .................................................................................................................. 11 This document is available electronically at: http://www.usg.edu/educational_access/complete_college_georgia/summit
Transcript
REGIONAL PROFILE
ZONE 3 – ATLANTA REGIONAL COMMISSION
TABLE OF CONTENTS
ZONE POPULATION ........................................................................................................ 2 RACIAL/ETHNIC COMPOSITION ..................................................................................... 2 MEDIAN ANNUAL INCOME ............................................................................................. 3 EDUCATIONAL ACHIEVEMENT ...................................................................................... 4 GEORGIA COMPETITIVENESS INITIATIVE REPORT .................................................... 10 RESOURCES .................................................................................................................. 11
ZONE POPULATION 2011 Population 4,069,211 2025 Projected Population 5,807,337
Sources: U.S. Census, American Community Survey 2011 ACS Demographic and Housing Estimates, 5-year estimate Georgia Department of Labor, Area Labor Profile Report 2012
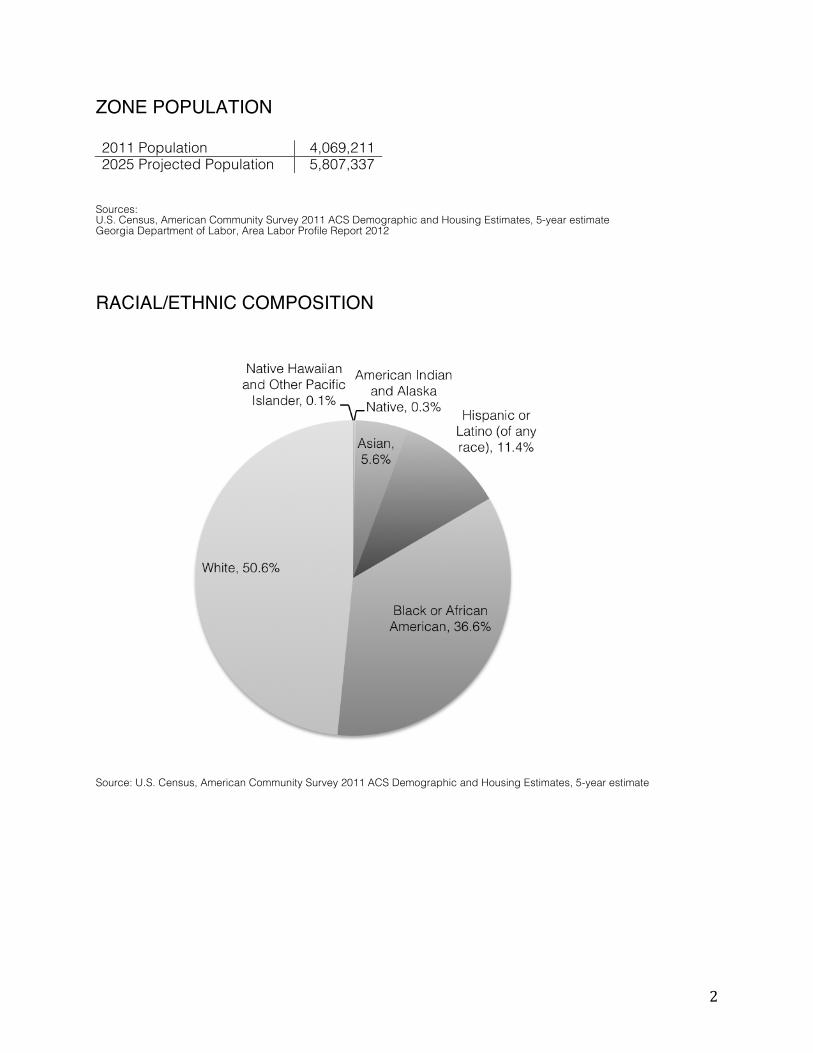
RACIAL/ETHNIC COMPOSITION
Source: U.S. Census, American Community Survey 2011 ACS Demographic and Housing Estimates, 5-year estimate
3
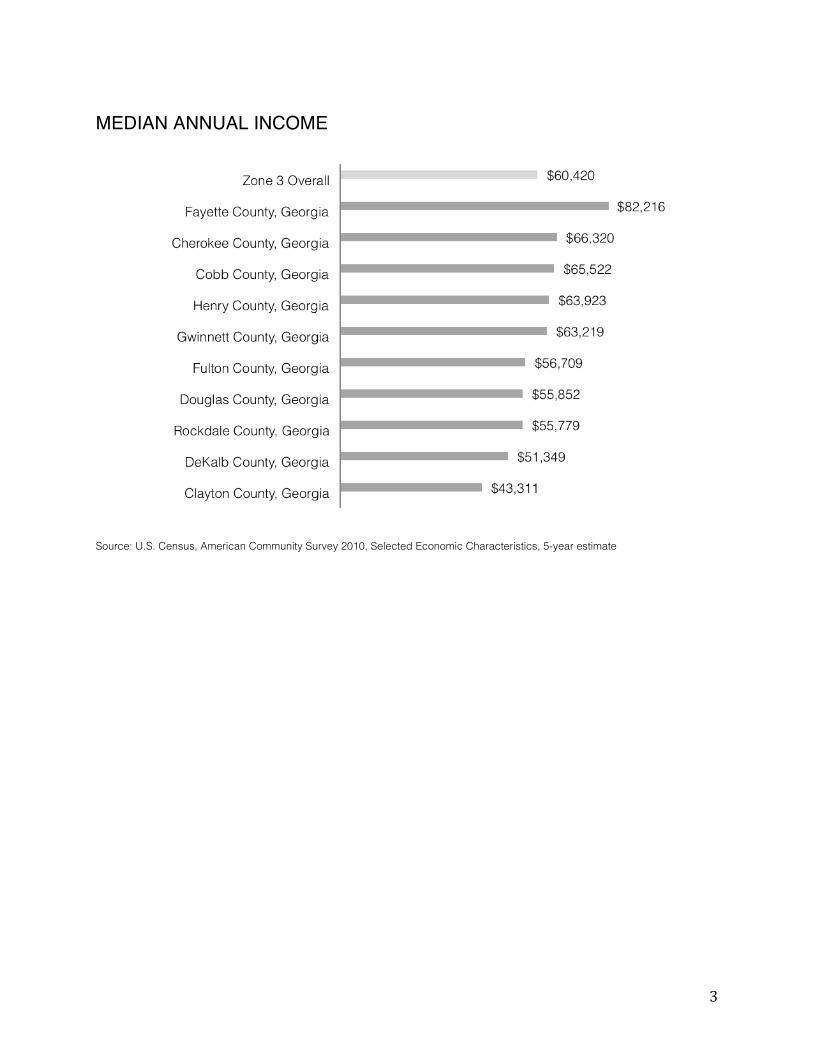
MEDIAN ANNUAL INCOME
Source: U.S. Census, American Community Survey 2010, Selected Economic Characteristics, 5-year estimate
4
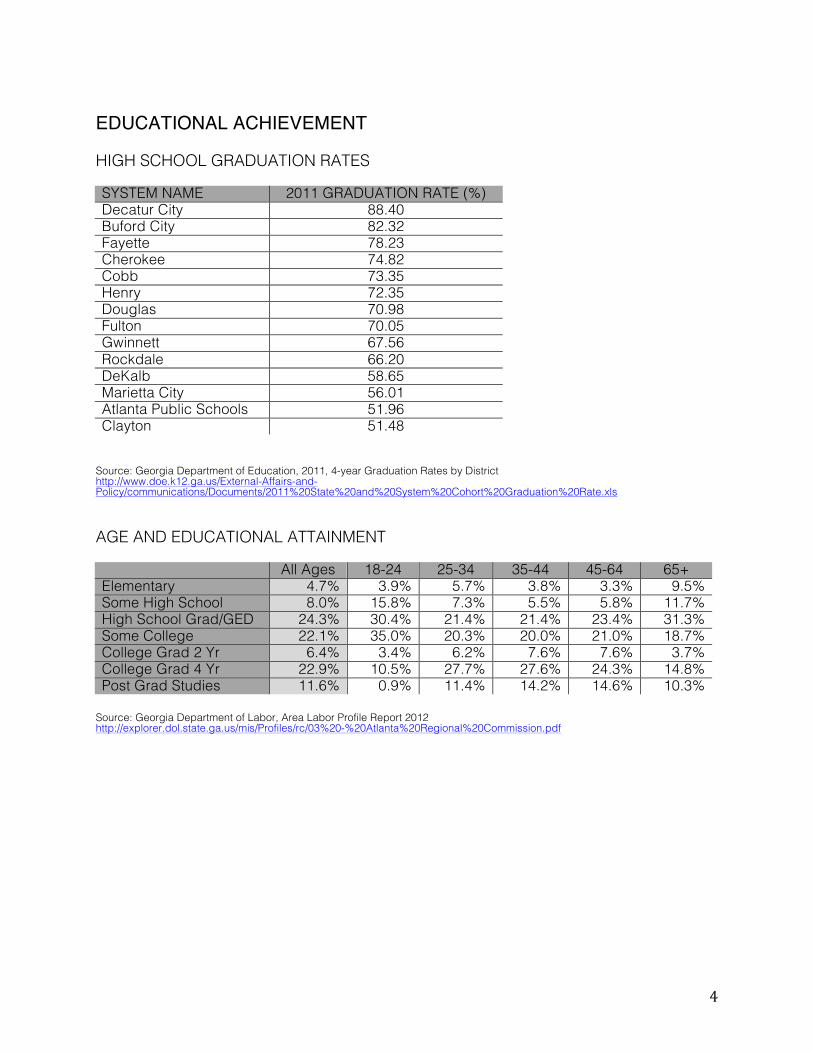
EDUCATIONAL ACHIEVEMENT HIGH SCHOOL GRADUATION RATES SYSTEM NAME 2011 GRADUATION RATE (%) Decatur City 88.40 Buford City 82.32 Fayette 78.23 Cherokee 74.82 Cobb 73.35 Henry 72.35 Douglas 70.98 Fulton 70.05 Gwinnett 67.56 Rockdale 66.20 DeKalb 58.65 Marietta City 56.01 Atlanta Public Schools 51.96 Clayton 51.48
Source: Georgia Department of Education, 2011, 4-year Graduation Rates by District http://www.doe.k12.ga.us/External-Affairs-and-Policy/communications/Documents/2011%20State%20and%20System%20Cohort%20Graduation%20Rate.xls AGE AND EDUCATIONAL ATTAINMENT All Ages 18-24 25-34 35-44 45-64 65+ Elementary 4.7% 3.9% 5.7% 3.8% 3.3% 9.5% Some High School 8.0% 15.8% 7.3% 5.5% 5.8% 11.7% High School Grad/GED 24.3% 30.4% 21.4% 21.4% 23.4% 31.3% Some College 22.1% 35.0% 20.3% 20.0% 21.0% 18.7% College Grad 2 Yr 6.4% 3.4% 6.2% 7.6% 7.6% 3.7% College Grad 4 Yr 22.9% 10.5% 27.7% 27.6% 24.3% 14.8% Post Grad Studies 11.6% 0.9% 11.4% 14.2% 14.6% 10.3%
Source: Georgia Department of Labor, Area Labor Profile Report 2012
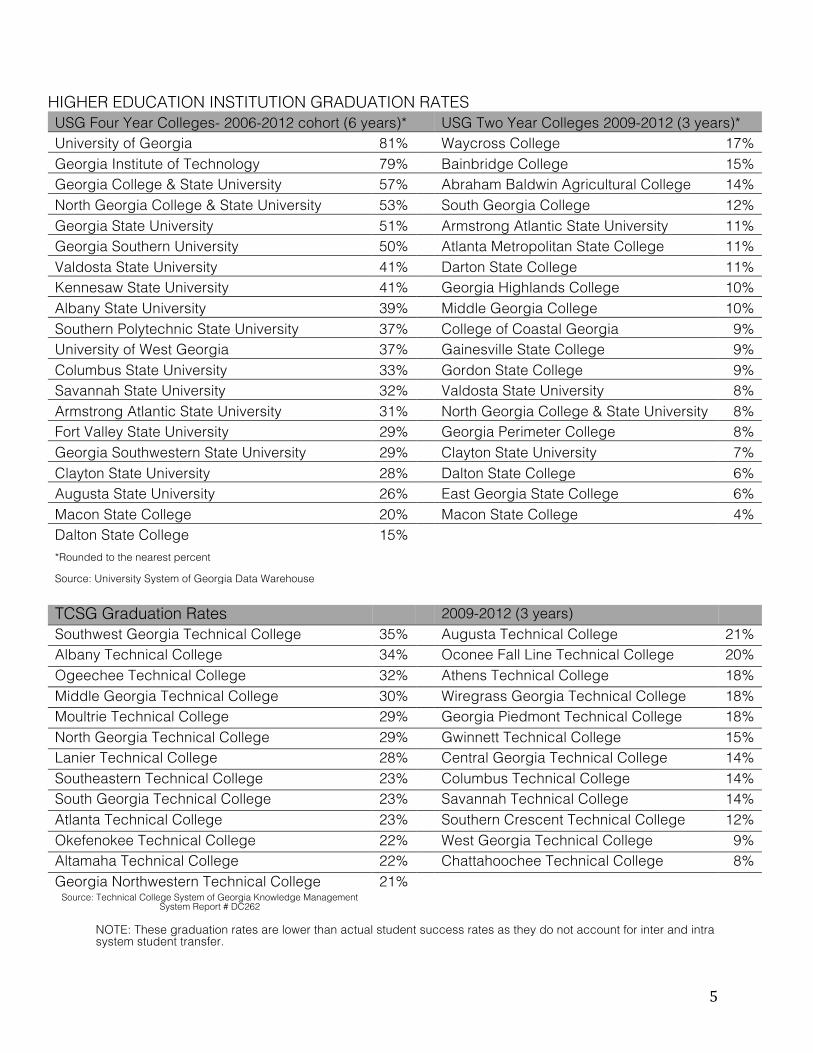
HIGHER EDUCATION INSTITUTION GRADUATION RATES USG Four Year Colleges- 2006-2012 cohort (6 years)* USG Two Year Colleges 2009-2012 (3 years)* University of Georgia 81% Waycross College 17% Georgia Institute of Technology 79% Bainbridge College 15% Georgia College & State University 57% Abraham Baldwin Agricultural College 14% North Georgia College & State University 53% South Georgia College 12% Georgia State University 51% Armstrong Atlantic State University 11% Georgia Southern University 50% Atlanta Metropolitan State College 11% Valdosta State University 41% Darton State College 11% Kennesaw State University 41% Georgia Highlands College 10% Albany State University 39% Middle Georgia College 10% Southern Polytechnic State University 37% College of Coastal Georgia 9% University of West Georgia 37% Gainesville State College 9% Columbus State University 33% Gordon State College 9% Savannah State University 32% Valdosta State University 8% Armstrong Atlantic State University 31% North Georgia College & State University 8% Fort Valley State University 29% Georgia Perimeter College 8% Georgia Southwestern State University 29% Clayton State University 7% Clayton State University 28% Dalton State College 6% Augusta State University 26% East Georgia State College 6% Macon State College 20% Macon State College 4% Dalton State College 15% *Rounded to the nearest percent
Source: University System of Georgia Data Warehouse
TCSG Graduation Rates 2009-2012 (3 years) Southwest Georgia Technical College 35% Augusta Technical College 21% Albany Technical College 34% Oconee Fall Line Technical College 20% Ogeechee Technical College 32% Athens Technical College 18% Middle Georgia Technical College 30% Wiregrass Georgia Technical College 18% Moultrie Technical College 29% Georgia Piedmont Technical College 18% North Georgia Technical College 29% Gwinnett Technical College 15% Lanier Technical College 28% Central Georgia Technical College 14% Southeastern Technical College 23% Columbus Technical College 14% South Georgia Technical College 23% Savannah Technical College 14% Atlanta Technical College 23% Southern Crescent Technical College 12% Okefenokee Technical College 22% West Georgia Technical College 9% Altamaha Technical College 22% Chattahoochee Technical College 8% Georgia Northwestern Technical College 21%
Source: Technical College System of Georgia Knowledge Management System Report # DC262
NOTE: These graduation rates are lower than actual student success rates as they do not account for inter and intra system student transfer.
6
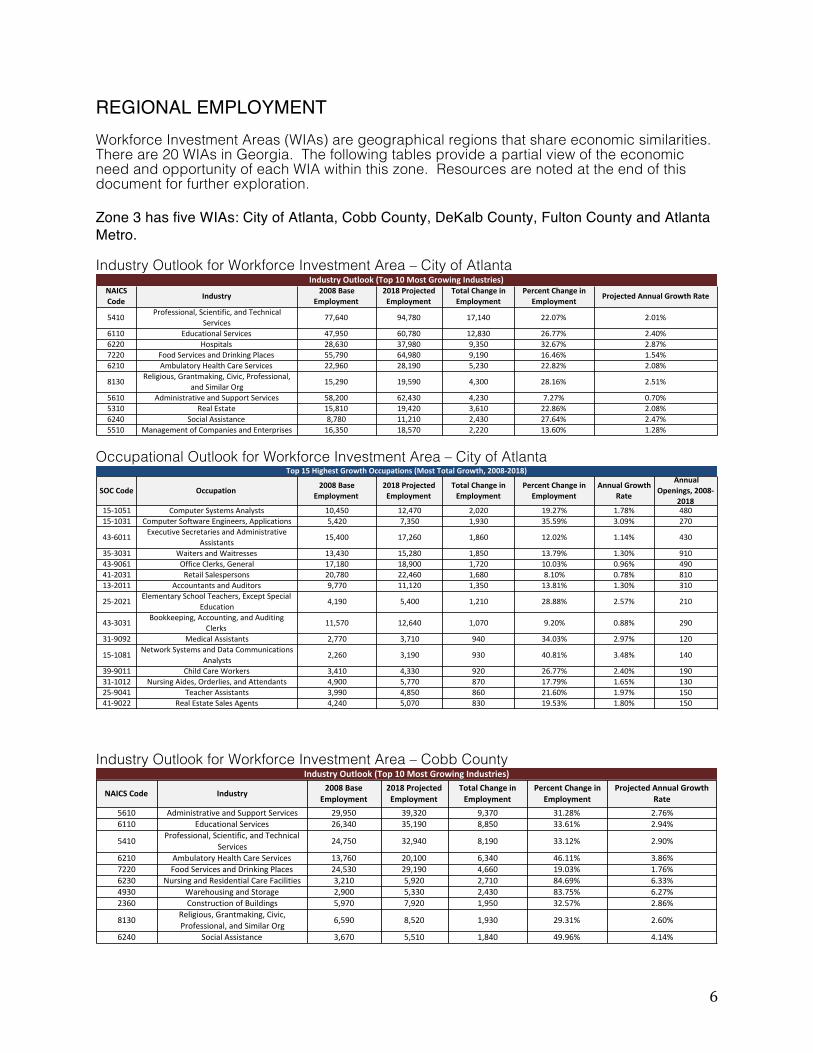
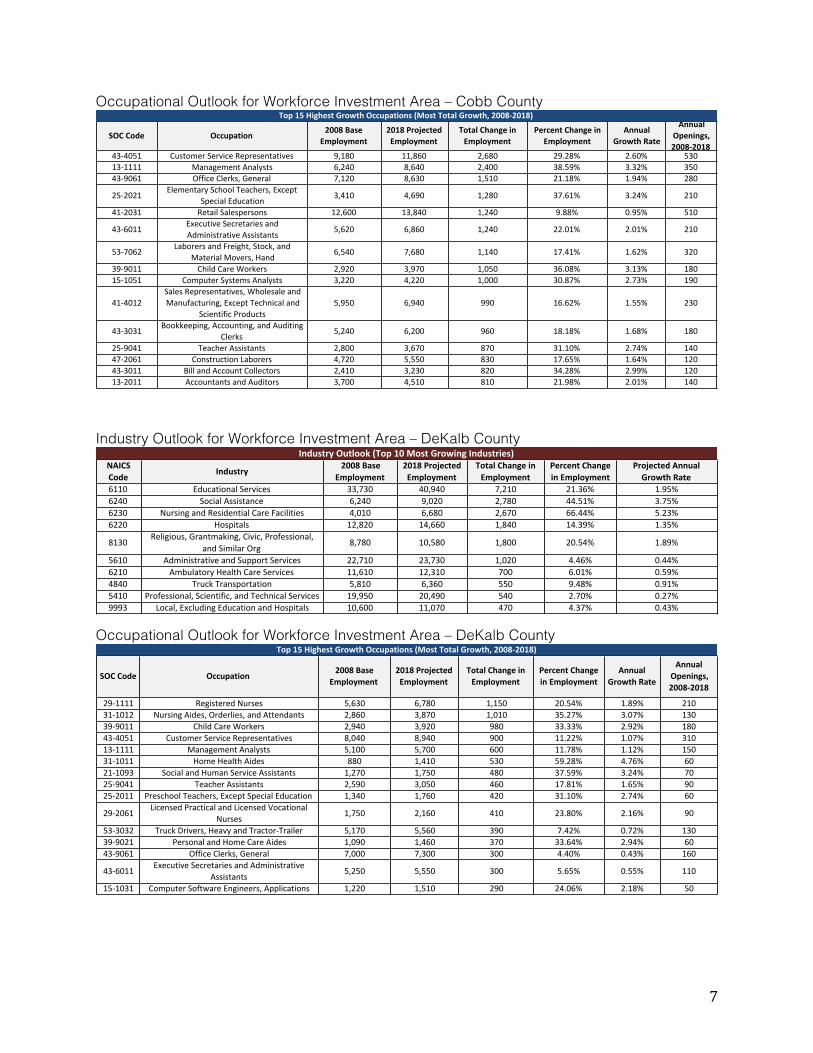
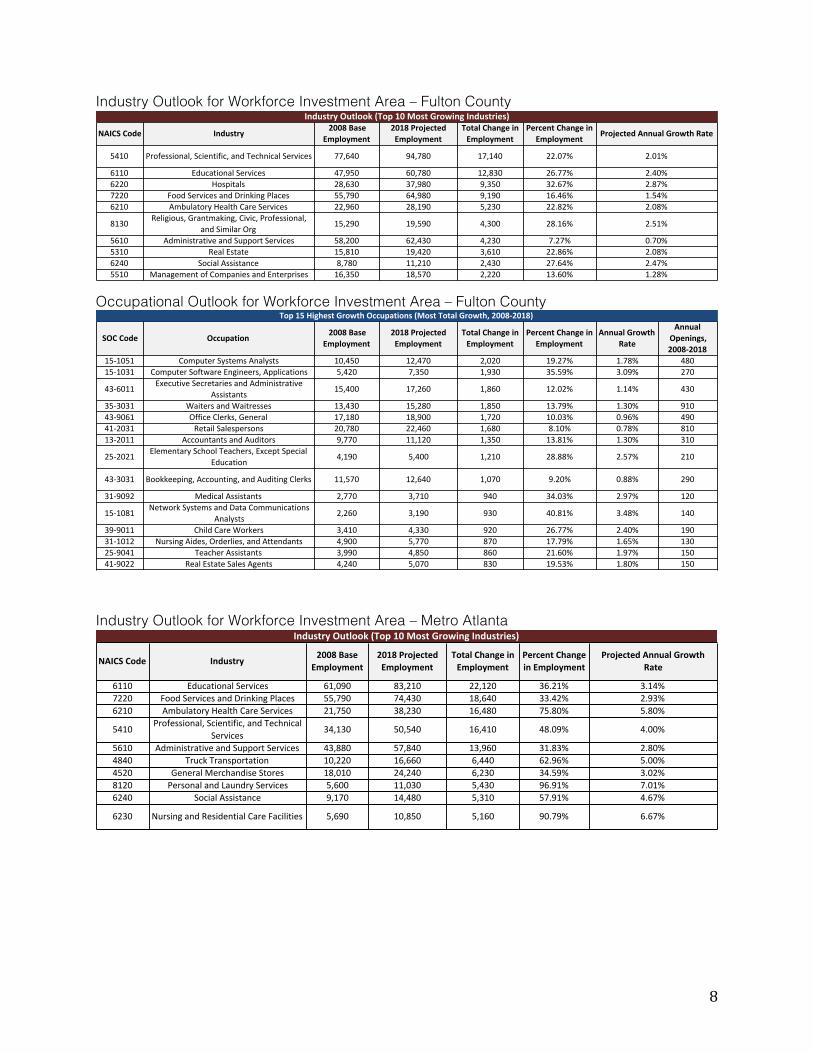
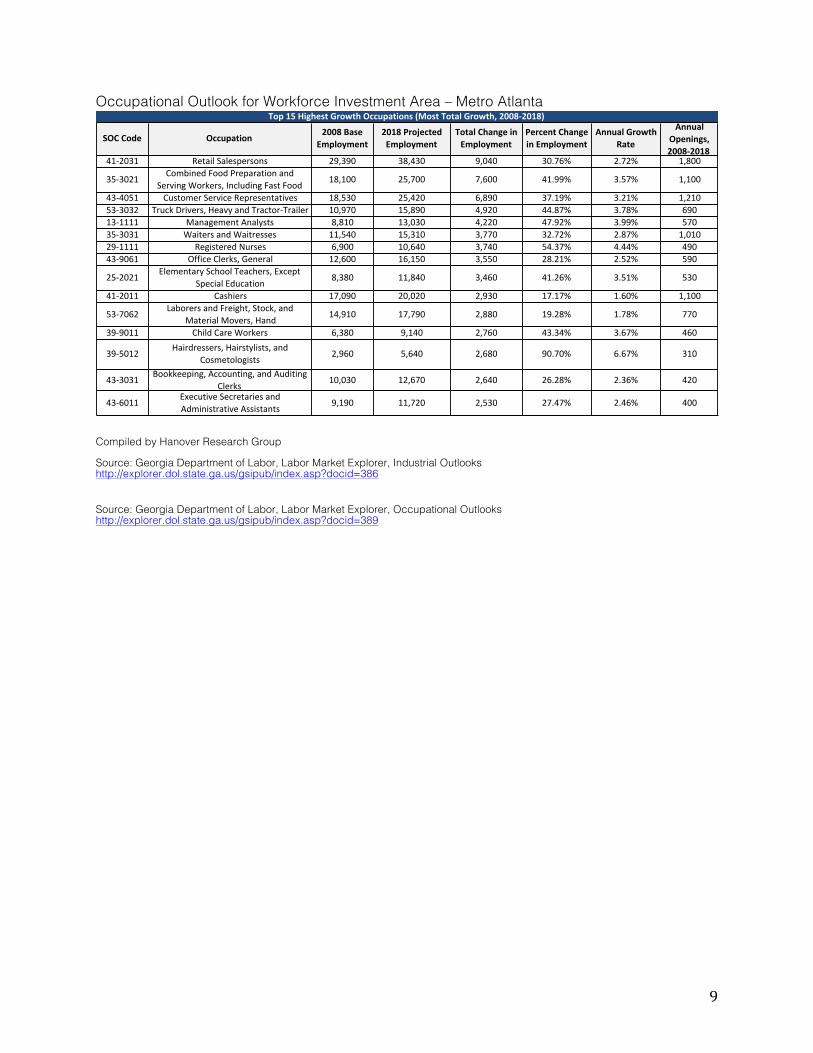
REGIONAL EMPLOYMENT Workforce Investment Areas (WIAs) are geographical regions that share economic similarities. There are 20 WIAs in Georgia. The following tables provide a partial view of the economic need and opportunity of each WIA within this zone. Resources are noted at the end of this document for further exploration. Zone 3 has five WIAs: City of Atlanta, Cobb County, DeKalb County, Fulton County and Atlanta Metro. Industry Outlook for Workforce Investment Area – City of Atlanta
Compiled by Hanover Research Group Source: Georgia Department of Labor, Labor Market Explorer, Industrial Outlooks http://explorer.dol.state.ga.us/gsipub/index.asp?docid=386 Source: Georgia Department of Labor, Labor Market Explorer, Occupational Outlooks http://explorer.dol.state.ga.us/gsipub/index.asp?docid=389
10
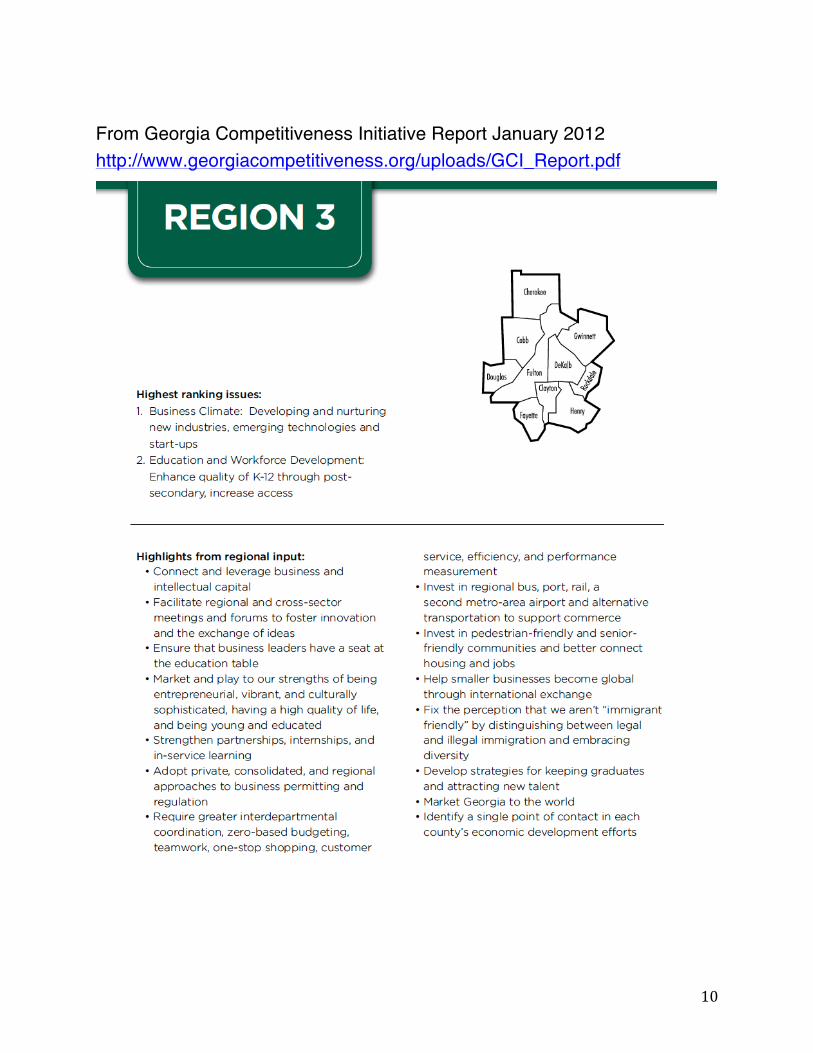
From Georgia Competitiveness Initiative Report January 2012 http://www.georgiacompetitiveness.org/uploads/GCI_Report.pdf
11
RESOURCES Georgia Department of Local Area Profile for Atlanta Region 3 http://explorer.dol.state.ga.us/mis/Profiles/rc/03%20-%20Atlanta%20Regional%20Commission.pdf Occupational Outlook Displays long-term and short-term projected occupational trends for the entire state of Georgia as well as for the Workforce Investment Areas. http://explorer.dol.state.ga.us/gsipub/index.asp?docid=389 Occupational Trend Resources http://www.dol.state.ga.us/wp/occupational_career_trends.htm Industry Outlook Displays long-term and short-term projected industry trends for the entire state of Georgia as well as for the Workforce Investment Areas. http://explorer.dol.state.ga.us/gsipub/index.asp?docid=386 Local Area Profiles by County, Workforce Investment Areas, Metropolitan Statistical Areas, and Regional Commission http://explorer.dol.state.ga.us/mis/profiles.htm Industry Cluster Analysis “With this tool, county-level industry cluster data are accessible in a user-friendly format via the Internet. This tool allows users to combine individual counties to define custom regions. Users can also use this tool to quickly compare their region with others. The industry cluster tool focuses on 17 clusters across the United States in order to provide a framework that is easy to analyze and understand. This tool can assist users in identifying the basic competitive strengths in their regional economy. The data enable a practitioner to extend and deepen the analysis of a region.” http://www.statsamerica.org/innovation/anydata/index.asp Innovation Index and Map “The ability of a regional economy to innovate drives healthy growth, but innovation is a complex concept. How can you measure innovation in order to improve it? This index provides leaders and practitioners with the first tool for comparing regional innovation performance with that of the United States, a state, or other regions. Like the cluster tool, the primary advantage of the innovation index is its flexibility. Users can design their own region and easily make comparisons across regions.” http://www.statsamerica.org/innovation/innovation_index/region-select.html http://www.statsamerica.org/innovation/index_map/ Occupational Cluster Analysis “Occupation cluster analysis is a relatively new approach in regional development. In contrast to industry clusters that focus on what businesses produce, occupation clusters focus on the knowledge, skills and abilities of the individuals who work for those businesses. Like the industrial cluster tool, this tool enables users to explore their regional economy from a different perspective. Like the other tools, its main advantage is flexibility: users can define custom regions and make comparisons easily.” http://www.statsamerica.org/innovation/anydata/index.asp?T1 Source of Descriptions:
12
A Practitioner’s Guide to Economic Development Tools for Regional Competitiveness in a Knowledge-Based Economy http://www.statsamerica.org/innovation/guide/practitioners_guide.pdf Complete College America, State Profile: Georgia http://www.completecollege.org/docs/Georgia.pdf Georgia Competitiveness Initiative Report January 2012 http://www.georgiacompetitiveness.org/uploads/GCI_Report.pdf Georgia Regional Economic Analysis Project This website features data and regional economic tools of analysis covering the 159 Georgia counties and Georgia's 15 metropolitan statistical areas (MSAs). The site contains the following:
− Comparative Trends Analysis − Comparative Economic Indicators − Major Components of Income − Shift-Share Analysis − Industry Structure and Performance − Income Structure and Growth − Leading, Slipping, Gaining and Lagging (LSGL) Analysis of Employment Industry Growth − Data Tables − Bureau of Economic Analysis Regional Fact Sheets