44
Regional Public Health Action Plan for Stroke Everybody teaches, everybody learns
Regional Public Health Action Plan
for Stroke
Everybody teaches, everybody learns
Regional Action Plan for Stroke2
Acknowledgements
We recognize the contributions of the Great Lakes Regional Stroke Network Steering Committee, Work Group members, State Stroke Task Force leaders and other “stroke champions” in developing this regional plan.
Allina Health Systems Donna Lindsey, RN
American Heart Association Heather Gavras, Vice President for Alliances and Cultural Health Peggy Jones, State Health Alliance Director for Illinois Julie Reeves, State Health Alliance Director for Indiana Sarah Poole, State Health Alliance Director for Michigan Beth Rabeneck, State Health Alliance Director for Minnesota Stephanie Reed, State Health Alliance Director for Ohio Victoria O’Brien, State Health Alliance Director for Wisconsin
American Society of Hypertension Christopher McCarthy, MD Association of Black Cardiologists Neicey Johnson, RN, BSN, JD Bedford Regional Medical Center Robert Atkins, NREMT-P, EMS Director Brain Attack Coalition
Nancy Hart
Council for the Accreditation of Rehabilitation Facilities Chris MacDonnell
GLRSN State Advisory Board
Michael Gaines, MPA, Illinois Department of Public Health Sue Percifield, RN, MSN, Indiana State Department of Health Rochelle Hurst, RN, MS, Michigan Department of Community Health Stanton Shanedling, PhD, MPH, Minnesota Department of Health Barbara Pryor, RD, LD, MS, Ohio Department of Health Catheryn Brue, MA, Wisconsin Department of Health and Family Services
Illinois CAPTURE Stroke Registry
Gulam Noorani, MBBS, MPH Illinois Department of Public Health
Lynette Shaw, MSEd, CHES
Regional Action Plan for Stroke3
Indiana State Health Department Elizabeth Hamilton Byrd, MD
Michigan Department of Community Health
Eileen Worden, RN
Minnesota Department of Health Albert Tsai, PhD, MPH
National Forum for Heart Disease and Stroke Prevention
Julie Harvill, MPH, MPA
National Stroke Association Jan Bahle Colette LaFosse Julie Haynes Michelle Murdock Michelle Menard
Ohio Department of Health
Jolene Defiore-Hyrmer, BS Janelle Edwards, MPH, CHES
State Stroke Task Forces Dr. Robert Flint, Indiana State Stroke Task Force Chair Kathleen Miller, RN, Minnesota Stroke Partnership Force Chair Dr. Michel Torbey, Wisconsin State Stroke Task Force Chair
University of Illinois at Chicago Amul Tevar, MPH Dilip Pandey, MD, PhD
Wisconsin Department of Health and Family Services
Herng-Leh (Mike) Yuan, MPH

Regional Action Plan for Stroke4
Author on behalf of the Great Lakes Regional Stroke Network Angela Bray Hedworth, MS, CHES, RHEd Program Manager, Great Lakes Regional Stroke Network The “Great Lakes Regional Stroke Network Regional Public Health Action Plan for Stroke” was created by the Great Lakes Regional Stroke Network (“GLRSN” or “The Network”). The plan represents over two years of planning by the Great Lakes Regional Stroke Network’s State Advisory Board, representing Heart Disease and Stroke Prevention Program managers from Illinois, Indiana, Michigan, Minnesota, Ohio and Wisconsin as well as the GLRSN Steering Committee, work groups and state stroke task forces. The Network’s vision for the elimination of stroke in the Great Lakes region and the desire for practical, high-impact interventions inspired countless hours of discussion, analysis and collaboration to create this plan. This document was supported through the Centers for Disease Control and Prevention (CDC) and Illinois Department of Public Health, Great Lakes Regional Stroke Network grant. The contents of this publication are solely the responsibility of the authors and do not represent the official views of CDC. For more information about the plan or to receive additional copies, please contact:
Great Lakes Regional Stroke Network 1645 W. Jackson Blvd, Suite 400
Chicago, IL 60612 Phone: (312) 355-5423 Fax: (312) 355-5444 http://glrsn.uic.edu.
2 The Great Lakes Regional Stroke Network appreciates citation and notification of use. Suggested citation: Hedworth, A. Great Lakes Regional Stroke Network Regional Public Health Action Plan for Stroke. Chicago, IL: June 2007. The Great Lakes Regional Stroke Network would like to thank the following states for sharing their experiences and state plans: Oregon, Montana, Minnesota, Washington, and Wisconsin.

Regional Action Plan for Stroke5
Table of Contents Acknowledgements 2-3 Letter from State Advisory Board 6 Executive Summary 7 Introduction 8 Partnerships 8 The Impact of Stroke in the Great Lakes Region
Prevalence of Stroke 11 Stroke Risk Factors 12
Recognition of Stroke Warning Signs and Anticipated Response 13 Stroke Hospital Discharge Data 15 Stroke Mortality Rates 15 Conclusion 18 Disparities including priority populations 18
Stroke Systems of Care 20 Healthy People 2010 20
Region Wide Action Topics, Goals, Objectives, Strategies, Surveillance, Epidemiology, Evaluation Effort Foster Key Elements of Stroke Systems of Care 22
Enhance state and network leadership and capacity 26 Increase Network effectiveness 27 Secure sustainable resources 28
Next Steps Measuring Outcomes/Evaluation 30
Circumstances in Region 31 The Challenge: A Regional Approach to Reducing the Burden of Stroke 31
Appendices 33
Appendix A: History 34 Appendix B: Structure 35 Appendix C: Strategic Map 36 Glossary 37
References 43

Regional Action Plan for Stroke6
Letter from State Advisory Board
January 2007 Dear Stroke Partner, The Great Lakes Regional Stroke Network Regional Public Health Action Plan for Stroke is a landmark achievement toward the advancement of stroke care in the Great Lakes region. While several states have created a plan to reduce the burden of heart disease and stroke in their state, this is the first time a plan has been created for a region that is specific to stroke. The plan represents an ex-traordinary level of collaboration among regional states and their partners to improve the health of Great Lakes region residents—those living with the aftermath of stroke as well as the general population at risk for stroke. Our hope is that this plan is widely embraced as a guide for each of us who work and strive to reduce the burden of stroke in the Great Lakes region. The intent of the Great Lakes Regional Stroke Network Regional Public Health Action Plan for Stroke is to: • Delineate strategies that will decrease morbidity and mortality associated with stroke • Focus partners on proven strategies that are practical, achievable and realistic • Assist all state partners in meeting objectives suggested in Healthy People 2010, Chapter 12. Many organizations in the Great Lakes region are already doing excellent work to make communi-ties stroke free, but these efforts often occur in isolation. The Great Lakes Regional Stroke Network Regional Public Health Action Plan for Stroke offers a unified vision and framework for organizations to mobilize around. It presents common goals for health promotion, advocacy and public policy, epi-demiology and surveillance, health systems and organizations and population-based community interventions. The success of this plan will require a concerted effort of many using different, crea-tive solutions to change infrastructure, personal and group behavior and policies. This is a call to action! We encourage everyone to take part in improving stroke in the Great Lakes region. The changes in our understanding and approach to preventing and treating stroke are dy-namic. There is a great deal to do. Many partners are committed to reducing stroke in the region and their efforts will continue, but others are encouraged to become involved. We need your help in spreading the message that strokes are mostly preventable. With a united effort, the states in the Great Lakes region can successfully reduce the burden of stroke. Sincerely,
The State Advisory Board of the Great Lakes Regional Stroke Network

Regional Action Plan for Stroke7
Executive Summary
Purpose
Stroke is the third leading cause of death in the Great Lakes region behind heart disease and can-cer. Stroke deaths account for over 25,000 deaths or 5.7 percent of all deaths that occurred in the total population in the Great Lakes region in 2002.1 Education and prevention programs designed to modify behavior would greatly reduce this burden of disease and death as well as the substantial costs associated with related hospitalizations and medical procedures, which now exceed $2,367,881,010 in our region annually!2 To develop a plan to reduce stroke morbidity and mortality, the Great Lakes Regional Stroke Net-work State Advisory Board sought to build on stroke systems of care for appropriate prevention and management of stroke and associated risk factors. It recognized the importance of supporting timely arrival of emergency medical services (EMS), as well as public awareness of warning signs and symptoms of stroke. The Board also drew from an Action Framework developed by the U.S. Centers for Disease Control and Prevention (CDC) that identifies major factors contributing to the progression of stroke and strategies to reduce the risk and manage the disease more effectively. As adapted for the Great Lakes Regional Stroke Network, these strategies are to: • Control high blood pressure • Control high blood cholesterol • Recognize signs and symptoms and call 9-1-1 • Improve emergency response • Improve quality of care • Eliminate disparities3 The purpose of the Great Lakes Regional Stroke Network Regional Public Health Action Plan for Stroke is to provide a blueprint and a call to action for individu-als, communities and organizations to collaborate and implement strategies that will reduce risk factors, incidence, complications and mortality rates of stroke in the Great Lakes Region. The task is too large for any one individual, organi-zation or community. The Great Lakes Regional Stroke Network Regional Public Health Action Plan for Stroke is the first of its kind to create a regional approach to specific to stroke. This blueprint is designed for years 2007-2012 and needs to be reviewed in a timely fashion to assure that policies match the ever chang-ing population we serve. Development of the Great Lakes Regional Stroke Network Regional Public Health Action Plan for Stroke The Great Lakes Regional Stroke Network Regional Public Health Action Plan for Stroke was developed by members of the Great Lakes Regional Stroke Network — over 150 people from various parts of the region meeting frequently over a two year period. Included in the planning process were leaders from state agencies in the region, network staff, state health department employees from various agencies, state affiliates of national organizations, and representatives from healthcare and aca-demic institutions. A State Advisory Board provided guidance, promotion, and will champion the Great Lakes Regional Stroke Network Regional Public Health Action Plan for Stroke and its implementa-tion.

Regional Action Plan for Stroke8
A work group of epidemiology professionals convened to determine the current status of stroke in the region. Through a strategic planning process (see Appendix C), a strategic map was created, guiding the future direction of the Network and this plan. The State Advisory Board developed the following region wide action topics for the entire net-work, basing the key elements of a stroke system of care on the American Stroke Association’s Stroke Systems of Care article.4 Region wide action topics are:
Foster Key Elements of Stroke System of Care Enhance State and Network Leadership and Capacity Secure Sustainable Resources Increase Network Effectiveness
Through all of these topics, integration of surveillance, epidemiology and evaluation into network efforts are key. Introduction The Great Lakes Regional Stroke Network Regional Public Health Ac-tion Plan for Stroke is the first of its kind to create a regional ap-proach to stroke prevention, care and treatment. You will find in this plan data on stroke in the region as well as objectives and strategies to reduce the burden of stroke in the Great Lakes Re-gion. This plan will be used to serve as a blueprint for guiding activities across the region. It is our belief that this Public Health Action Plan for Stroke will engage all whose work supports the pre-vention and management of stroke in the Great Lakes region. Partnerships This vital work depends on the contribution of partners through-out our health care system, our worksites, and in every one of our communities—including those who finance and deliver health services and the state, local, and tribal organizations that make the essential connections to people who need these services. Our goal is that this plan guides a coordinated approach to policies that support what research has shown to be the most effective methods to prevent and treat stroke. Partnerships are key to the success of a stroke system. The National Forum for Heart Disease and Stroke Prevention recently published, “A Public Health Action Plan to Prevention Heart Disease and Stroke,” a comprehensive plan to reduce the burden of stroke and heart disease. One of the five major components of the proposed action plan is to encourage “engaging in regional and global partnerships [to] multiply resources and capitaliz[e] on shared experience.”5 The American Stroke Association’s Task Force on the Development of Stroke Systems also described the need for effective interaction and collaboration among health care professionals, services, and agencies that treat stroke.4 The need for greater coordination and support mechanisms among health care professionals was also recognized as a need by the Task Force sponsored by the National Institute of Neurological Disorders and Stroke in 2002.6 The Great Lakes Regional Stroke Network strives to create partnerships within the Great Lakes Region and with national partners. Existing partners at the state level include government agencies such as diabetes and tobacco cessation programs, faith based, community based, business/industry
Building partnerships at the National Stroke Asso-ciation Stroke Team meeting. Photo provided by the National Stroke Association.

Regional Action Plan for Stroke9
for establishing a system of care for stroke. A stroke system approach involves coordination of stroke care along the entire continuum - from primary prevention through rehabilitation. A systems approach is necessary to positively impact change in the way stroke is treated so that patients have access to the most advanced treatment in medical centers that are best equipped to deal with the critical, time-sensitive needs of stroke patients.4
Nationwide partners such as the American Heart Association/American Stroke Association, the Asso-ciation of Black Cardiologists, the American Society of Hypertension Midwest Chapter, the National Stroke Association, Council for the Accreditation of Rehabilitation Facilities, American Institute of Research and others play a vital role in the Great Lakes Regional Stroke Network. Not only are they responsible for actively participating in Steering Committee meetings, they also have gone above and beyond traditional partnerships. For example, the National Stroke Association held their very first Mid-west Stroke Team Meeting in the Great Lakes Region and moved their Public Health Summit to Chi-cago as a result of Great Lakes Regional Stroke Network partnership. Partners also present on calls about their activities in the Great Lakes Region and throughout the year share activities electronically for dissemination to Great Lakes Regional Stroke Network partners and State Stroke Task Forces. Potential partners will be involved by actively participating on state stroke task forces, sharing resources and activities, and working together on state and/or regional initiatives as well as entering into memo-randum of agreement. If their schedule permits, they are encouraged to participate in the steering committee meeting and work groups.
GLRSN State Advisory Board Strategic Planning Session, 2006

Regional Action Plan for Stroke10
Heart Disease and Stroke in the Great
Lakes Region
Regional Action Plan for Stroke11
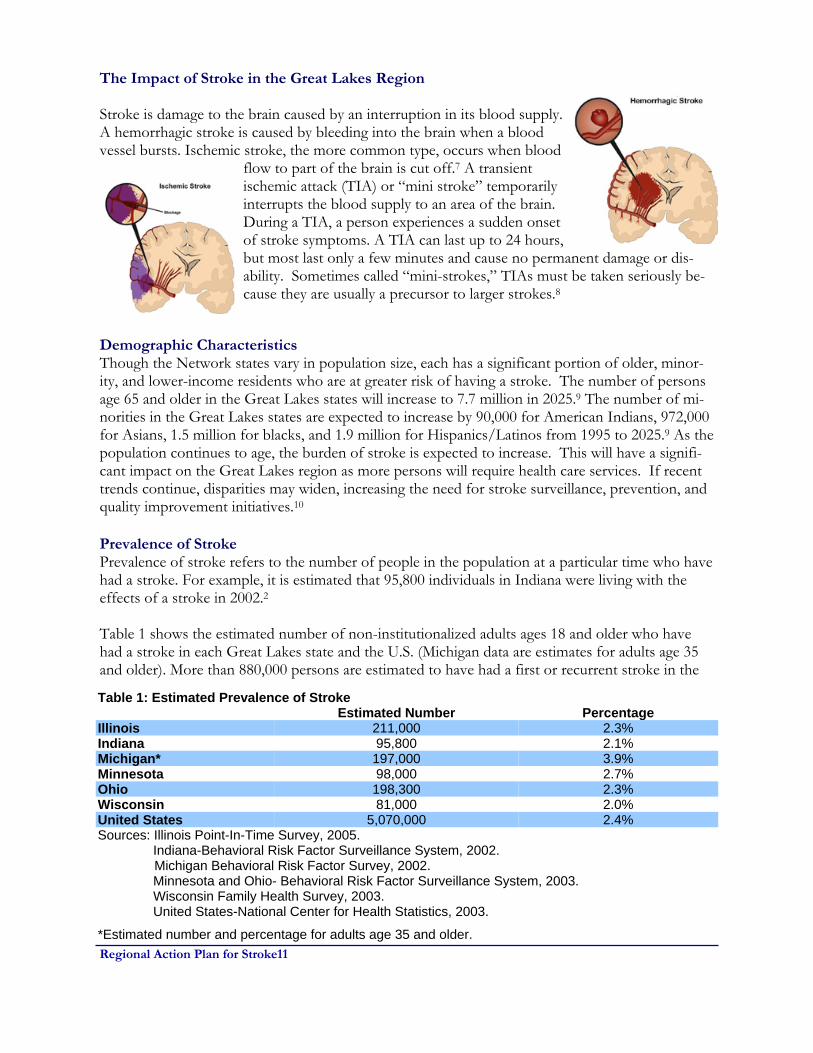
The Impact of Stroke in the Great Lakes Region Stroke is damage to the brain caused by an interruption in its blood supply. A hemorrhagic stroke is caused by bleeding into the brain when a blood vessel bursts. Ischemic stroke, the more common type, occurs when blood
flow to part of the brain is cut off.7 A transient ischemic attack (TIA) or “mini stroke” temporarily interrupts the blood supply to an area of the brain. During a TIA, a person experiences a sudden onset of stroke symptoms. A TIA can last up to 24 hours, but most last only a few minutes and cause no permanent damage or dis-ability. Sometimes called “mini-strokes,” TIAs must be taken seriously be-cause they are usually a precursor to larger strokes.8
Demographic Characteristics Though the Network states vary in population size, each has a significant portion of older, minor-ity, and lower-income residents who are at greater risk of having a stroke. The number of persons age 65 and older in the Great Lakes states will increase to 7.7 million in 2025.9 The number of mi-norities in the Great Lakes states are expected to increase by 90,000 for American Indians, 972,000 for Asians, 1.5 million for blacks, and 1.9 million for Hispanics/Latinos from 1995 to 2025.9 As the population continues to age, the burden of stroke is expected to increase. This will have a signifi-cant impact on the Great Lakes region as more persons will require health care services. If recent trends continue, disparities may widen, increasing the need for stroke surveillance, prevention, and quality improvement initiatives.10 Prevalence of Stroke Prevalence of stroke refers to the number of people in the population at a particular time who have had a stroke. For example, it is estimated that 95,800 individuals in Indiana were living with the effects of a stroke in 2002.2 Table 1 shows the estimated number of non-institutionalized adults ages 18 and older who have had a stroke in each Great Lakes state and the U.S. (Michigan data are estimates for adults age 35 and older). More than 880,000 persons are estimated to have had a first or recurrent stroke in the
Table 1: Estimated Prevalence of Stroke Estimated Number Percentage
Illinois 211,000 2.3% Indiana 95,800 2.1%
Minnesota 98,000 2.7% Ohio 198,300 2.3% Wisconsin 81,000 2.0% United States 5,070,000 2.4% Sources: Illinois Point-In-Time Survey, 2005. Indiana-Behavioral Risk Factor Surveillance System, 2002. Michigan Behavioral Risk Factor Survey, 2002. Minnesota and Ohio- Behavioral Risk Factor Surveillance System, 2003. Wisconsin Family Health Survey, 2003. United States-National Center for Health Statistics, 2003.
*Estimated number and percentage for adults age 35 and older.
Michigan* 197,000 3.9%
Regional Action Plan for Stroke12
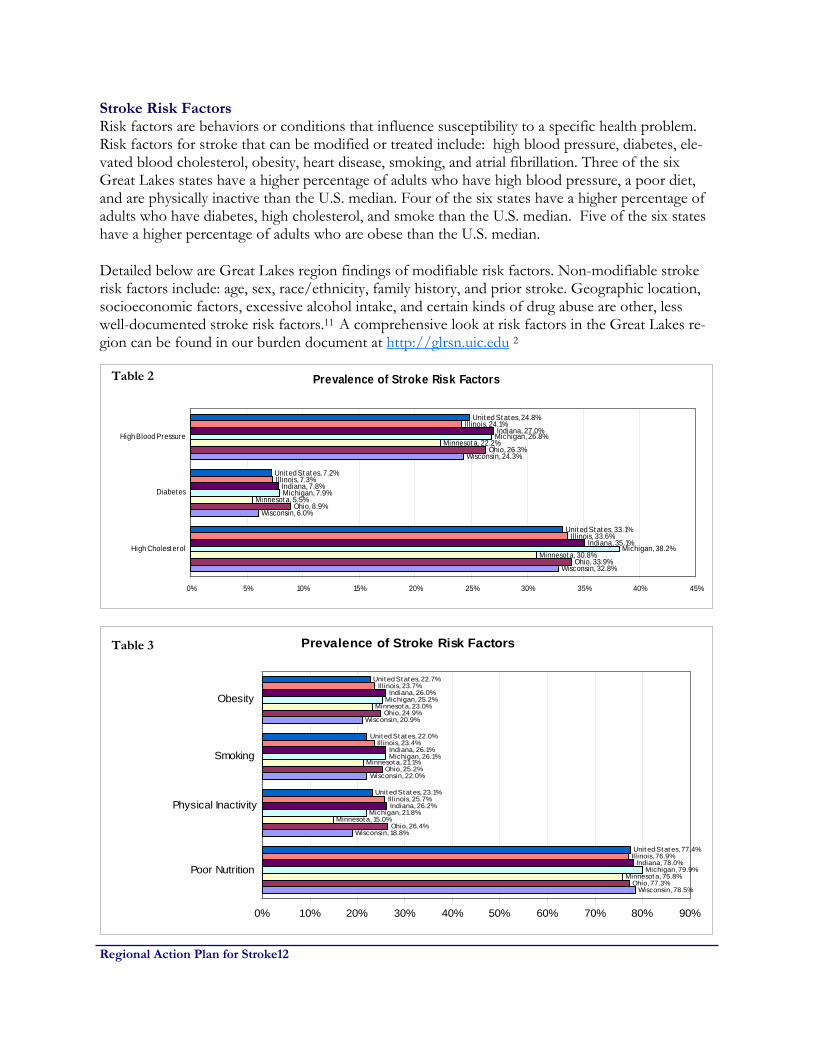
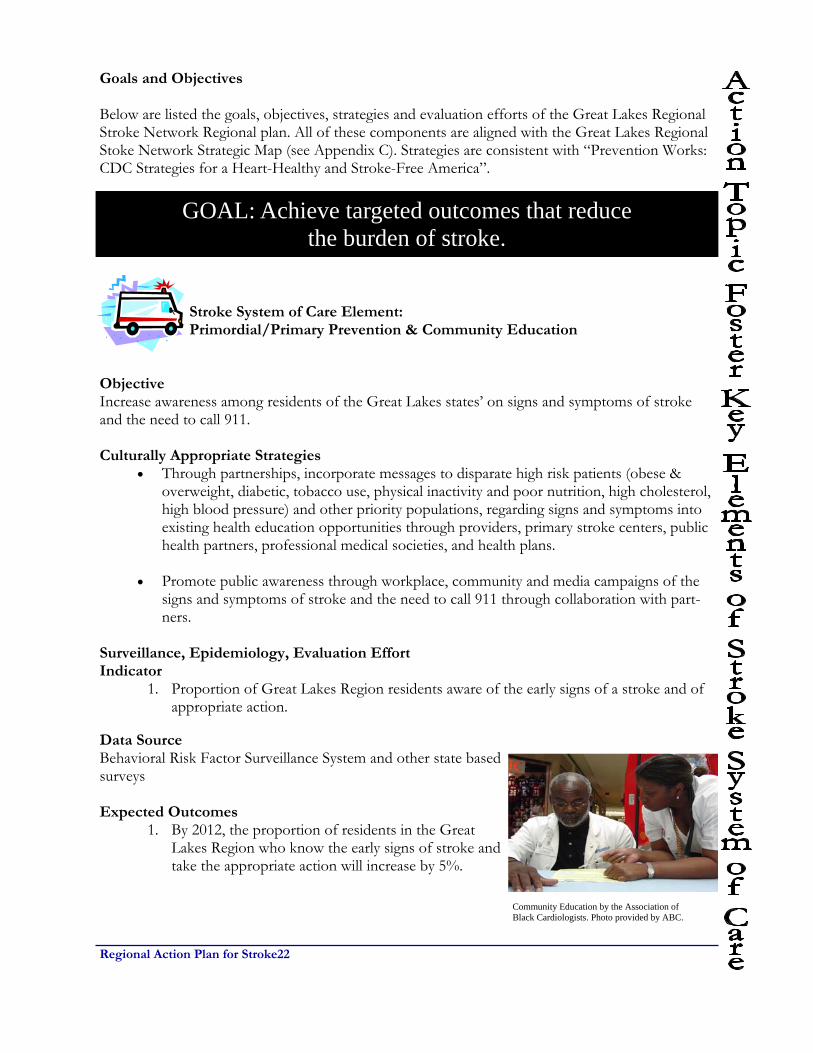
Stroke Risk Factors Risk factors are behaviors or conditions that influence susceptibility to a specific health problem. Risk factors for stroke that can be modified or treated include: high blood pressure, diabetes, ele-vated blood cholesterol, obesity, heart disease, smoking, and atrial fibrillation. Three of the six Great Lakes states have a higher percentage of adults who have high blood pressure, a poor diet, and are physically inactive than the U.S. median. Four of the six states have a higher percentage of adults who have diabetes, high cholesterol, and smoke than the U.S. median. Five of the six states have a higher percentage of adults who are obese than the U.S. median.
Detailed below are Great Lakes region findings of modifiable risk factors. Non-modifiable stroke risk factors include: age, sex, race/ethnicity, family history, and prior stroke. Geographic location, socioeconomic factors, excessive alcohol intake, and certain kinds of drug abuse are other, less well-documented stroke risk factors.11 A comprehensive look at risk factors in the Great Lakes re-gion can be found in our burden document at http://glrsn.uic.edu 2
Prevalence of Stroke Risk Factors
Wisconsin, 32.8%
Wisconsin, 6.0%
Wisconsin, 24.3%
Ohio, 33.9%
Ohio, 8.9%
Ohio, 26.3%
Minnesot a, 30.8%
Minnesot a, 5.5%
Minnesot a, 22.2%
Michigan, 38.2%
Michigan, 7.9%
Michigan, 26.8%
Indiana, 35.1%
Indiana, 7.8%
Indiana, 27.0%
Illinois, 33.6%
Illinois, 7.3%
Illinois, 24.1%
Unit ed St at es, 33.1%
Unit ed St at es, 7.2%
Unit ed St at es, 24.8%
0% 5% 10% 15% 20% 25% 30% 35% 40% 45%
High Cholest erol
Diabet es
High Blood Pressure
Prevalence of Stroke Risk Factors
Wisconsin, 78.5%
Wisconsin, 18.8%
Wisconsin, 22.0%
Wisconsin, 20.9%
Ohio, 77.3%
Ohio, 26.4%
Ohio, 25.2%
Ohio, 24.9%
Minnesot a, 75.8%
Minnesot a, 15.0%
Minnesot a, 21.1%
Minnesot a, 23.0%
Michigan, 79.9%
Michigan, 21.8%
Michigan, 26.1%
Michigan, 25.2%
Indiana, 78.0%
Indiana, 26.2%
Indiana, 26.1%
Indiana, 26.0%
Illinois, 76.9%
Illinois, 25.7%
Illinois, 23.4%
Illinois, 23.7%
Unit ed St at es, 77.4%
Unit ed St at es, 23.1%
Unit ed St at es, 22.0%
Unit ed St at es, 22.7%
0% 10% 20% 30% 40% 50% 60% 70% 80% 90%
Poor Nutrition
Physical Inactivity
Smoking
Obesity
Table 2
Table 3

Regional Action Plan for Stroke13
Recognition of Stroke Warning Signs and Anticipated Response According to the 2003 Behavioral Risk Factor Surveillance System survey and other state ad-ministered surveys, sudden severe headache and sudden vision trouble are the least recognized symptoms of stroke among adults ages 18 and older. Table 4 on the next page show the number and percentage of respondents ages 18 and older in each Great Lakes state who would respond to stroke symptoms by taking the person to the hos-pital, calling a doctor, calling 911, calling spouse/family, or doing something else. Overall, 85.8 to 89.1 percent of survey participants responded they would call 911. Table 5 shows the number and percentage of respondents ages 18 and older in each Great Lakes state who would re-spond to stroke symptoms by taking the person to the hospital, calling a doctor, calling 911, calling spouse/family, or doing something else. Overall, 85.8 to 89.1 percent of survey participants re-sponded they would call 911. Additional public education activities about stroke signs and symptoms in the Great Lakes region would increase knowledge of all stroke symptoms and of the importance of calling 911.
Table 4: Recognition of Stroke Symptoms
Illinois Minnesota Ohio Wisconsin Severe Headache 282
(52.0%) 2,558
(64.7%)
2,122 (57.2%)
1,114 (59.1%)
Severe Dizziness/Imbalance/Trouble Walking
451 (84.5%)
3,465 (89.8%)
3,072 (83.6%)
1,651 (87.5%)
Sudden Vision Trouble 345 (66.2%)
2,951 (76.3%)
2,431 (66.4%)
1,273 (67.5%)
Sudden Numbness/Weakness 487 (91.2%)
3,676 (94.9%)
3,431 (94.1%)
1,789 (94.8%)
Sudden Confusion/Trouble Speaking 469 (86.8%)
3,547 (91.1%)
3,217 (86.9%)
1,673 (88.7%)
Sources: Illinois Point-In-Time Survey (based on BRFSS methodology), 2005. Minnesota, Ohio—Behavioral Risk Factor Surveillance System, 2003. Wisconsin Family Health Survey, 2003. Indiana did not administer the optional BRFSS survey module for recognition of stroke symptoms. Michigan used a different methodology to ascertain the results to the questions about recognition of stroke symptoms. The data for Michigan are presented on page 15.

Regional Action Plan for Stroke14
Table 5: Anticipated Response to Stroke Symptoms
Illinois Minnesota Ohio
Take to Hospital 38 (7.0%)
137 (3.8%)
181 (5.2%)
Call Doctor 3 (1.2%)
33 (0.8%)
22 (0.6%)
Call 911 453 (85.8%)
3,395 (88.1%)
3,229 (89.1%)
Call Spouse/Family 3 (0.2%)
13 (0.2%)
19 (0.6%)
Do Something Else 28 (5.7%)
235 (6.1%)
149 (4.1%)
Don't Know/Not Sure 2 (0.1%)
41 (0.9%)
12 (0.5%)
Sources: Illinois Point-In-Time Survey based on BRFSS methodology, 2005. Minnesota, Ohio—Behavioral Risk Factor Surveillance System, 2003. Those who refused to answer the question were excluded from the denominator. Indiana and Wisconsin did not administer the optional BRFSS survey module for anticipated response to stroke symptoms. Michigan used a different methodology to ascertain the results to the questions about anticipated response to stroke symptoms. The data for Michigan are presented on page 15.
The question on recognition of stroke symptoms was first included in Michigan’s Behavioral Risk Factor Survey in 1999. Stroke questions were not part of the CDC BRFSS at that time. The question used was derived from a published project in the Cincinnati area and was repeated in 2004 for comparison.18 Table 6 presents the percentage of responses to the question “From anything you may have heard or read, what do you think are the three most important signs or symptoms of stroke?” Sudden vision trouble, numbness/weakness, and confusion/trouble speaking were the most identified symptoms. The question on anticipated response to health situations was added to Michigan’s BRFS in 2004 to get more specific information about responses to stroke symptoms. Table 7 presents the number and percentage of responses to the statement “I’m going to describe several health related situations. For each one, please tell me what you would be most likely to do first after you evaluated the person’s condition.” Most respondents stated they would call 911 if a person experienced trouble speaking. For numbness and trouble seeing, most respondents stated they would take the person to an emergency room. Table 6: Recognition of Stroke Symptoms, Michigan
Severe Headache 10.2%
Severe Dizziness/Imbalance/Trouble Walking 15.2%
Sudden Vision Trouble 23.3%
Sudden Numbness/Weakness 65.6%
Sudden Confusion/Trouble Speaking 46.5%
Source: Preliminary data from Michigan BRFS, 2004.

Regional Action Plan for Stroke15
Table 7: Anticipated Response to Health Situations, Michigan Response to Health Situation
Trouble Speaking Numbness Trouble seeing
911 2,586 (51.0%)
2,067 (42.0%)
1,005 (20.4%)
Go to ER 1,284 (27.2%)
2,093 (45.0%)
2,446 (51.9%)
Call physician 491 (11.7%)
408 (8.3%)
827 (17.1%)
Other 436 (9.1%)
227 (4.7%)
493 (10.3%)
Source: Preliminary data from Michigan BRFS, 2004.
Hospital Discharge Data
Administrative claims data from hospitals are a source of information about the patterns of care, the public health burden, and the cost associated with disease and injury. Data presented are for hospital discharges with a principal diagnosis of stroke (ICD-9 codes 430-438). The patient dis-charge status codes and definitions listed are used by hospitals to bill for patient services. Complete data on hospital discharge can be found in the Great Lakes Regional Stroke Network burden of stroke document at http://glrsn.uic.edu.2
Stroke Mortality Rate Mortality specifies the number of deaths in a population within a prescribed time. Mortality rates may be expressed as crude death rates (total deaths in relation to total population during a year) or as death rates specific for diseases or other attributes such as age or race.13 Stroke mortality refers to the number of deaths from stroke in a population within a certain time period. Table 9 presents the age-adjusted stroke mortality rate and number of stroke deaths for each Great Lakes state and the U.S. for 2002. The age-adjusted stroke mortality rate per 100,000 for the Great Lakes states ranges from 51.3 per 100,000 (Minnesota) to 60.1 per 100,000 (Indiana). Illinois, Indi-ana, Michigan, Ohio, and Wisconsin have a higher age-adjusted stroke mortality rate than the U.S. rate of 56.2 per 100,000. Stroke deaths account for over 25,000 deaths or 5.7 percent of all deaths that occurred in the total population in the Great Lakes region in 2002.14
Table 8: Stroke Mortality Rate* (per 100,000) by State, 2002 Stroke Mortality Rate Number of Stroke Deaths Illinois 57.2 7,183 Indiana 60.1 3,717 Michigan 58.1 5,814 Minnesota 51.3 2,706 Ohio 59.4 7,252 Wisconsin 57.7 3,479
Source: National Center for Health Statistics, 2002
*Age-adjusted to U.S. 2000 standard population.
United States 56.2 162,672

Regional Action Plan for Stroke16
Stroke Mortality Rate by Age Group The risk of having a stroke increases with age. In fact, a person’s risk of having a stroke more than doubles each decade after age 55. Table 10 shows the 2002 stroke mortality rate per 100,000 by age for each Great Lakes state and the U.S. As expected, the stroke mortality rate increases with age for each state. Despite the fact that older adults typically die from stroke, a significant portion of stroke deaths occur in adults age 64 and younger. These untimely deaths are costly to decedents’ families and to the Great Lakes states in terms of years of potential life lost.
Table 9: Stroke Mortality Rate (per 100,000) by Age, 2002 25-34 35-44 45-54 55-64 65-74 75-84 85+ Illinois 1.5 5.4 15.9 34.9 125.7 441.0 1,465.0 Indiana 1.8 4.7 14.7 40.8 125.4 445.9 1,568.4
Minnesota — 2.9 9.6 23.2 98.3 413.2 1,427.6 Ohio 2.2 4.8 13.9 37.3 125.9 455.8 1,520.8 Wisconsin 1.5 6.2 11.3 34.5 111.9 445.7 1,545.0 United States 1.4 5.4 15.1 37.2 120.3 431.0 1,445.9 Sources: Illinois Department of Public Health, Vital Statistics, 2002. Indiana State Department of Health, Vital Statistics, 2002. Michigan Department of Community Health, Vital Statistics, 2002. Minnesota Department of Health, Vital Statistics, 2002. Ohio Department of Health, Vital Statistics, 2002. Wisconsin Department of Health and Family Services, Vital Statistics, 2002. National Center for Health Statistics, 2002. —Insufficient data
Michigan 2.0 6.5 16.0 37.4 113.8 430.5 1,528.0
Stroke Mortality Rate by Gender and Race Table 10 shows the 2002 age-adjusted stroke mortality rate per 100,000 for each Great Lakes state and the U.S. by gender and race. Stroke mortality rates are higher for men than women for each state and across race categories. Black men and black women have higher stroke mortality rates than white men and white women in the Great Lakes states. Overall, black men have the highest stroke mortality rates ranging from 74.6 per 100,00 (Wisconsin) to 89.9 per 100,00(Ohio). Data on other race and ethnic groups are not available because of unreliable population estimates. Racial disparities in stroke mortality in the Great Lakes states reflect the national trend in stroke mortality. Black mortality has been highest across all stroke types in all but the oldest age catego-ries (75 years +).21 Variations among the Great Lakes states might reflect differences in lifestyle and stroke risk factors as well as socioeconomic status.22 In an analysis of the 2003 BRFSS survey, 48.7 percent of black respondents reported having two or more risk factors for stroke.23

Regional Action Plan for Stroke17
Table 10: Stroke Mortality Rate* (per 100,000) by Gender and Race, 2002
Men
Women
Black Men
Black
Women
White Men
White Women
Illinois 57.9 55.8 — — 55.8 54.0
Indiana 57.7 59.2 83.5 74.6 56.4 58.4
Michigan 59.4 55.2 80.3 65.9 57.1 53.5
Minnesota 53.3 49.2 87.9 92.8 52.4 48.1
Ohio 61.1 56.4 89.9 62.0 58.6 55.9
Wisconsin 60.7 54.1 74.6 75.3 60.0 53.3
United States 56.5 55.2 81.7 71.8 54.2 53.4
Sources: Illinois Department of Public Health, Vital Statistics, 2002. Indiana State Department of Health, Vital Statistics, 2002. Michigan Department of Community Health, Vital Statistics, 2002. Minnesota Department of Health, Vital Statistics, 2002. Ohio Department of Health, Vital Statistics, 2002. Wisconsin Department of Health and Family Services, Vital Statistics, 2002. National Center for Health Statistics, 2002. *Age-adjusted to U.S. 2000 standard population. — Illinois stroke mortality data for race/ethnicity are grouped as “white” and “non-white” and therefore data for black men and black women are not available.
For a complete account of The Burden of Stroke in the Great Lakes Region, please refer to our burden document which can be found on the Great Lakes Regional Stroke Network website at http://glrsn.uic.edu.

Regional Action Plan for Stroke18
Conclusion The Great Lakes region is significantly impacted by stroke. Stroke remains a leading cause of death and a leading cause of disability in the region. Much work is needed to reduce the burden of stroke in Illinois, Indiana, Michigan, Minnesota, Ohio, and Wisconsin. Disparities in stroke mortality between race groups in the Great Lakes states are particularly dis-turbing. In addition, the prevalence of stroke risk factors in each state are unacceptably high. Inter-ventions that address these disparities and risk factors are critical and much needed. States in the Great Lakes region have various and sometimes dissimilar data related to stroke. Spe-cifically, data for stroke prevalence, recognition of and anticipated response to stroke symptoms, and hospital discharge data are from different years or are missing for some states. These limita-tions make it difficult to compare states within the Great Lakes region, and the region with other areas in the United States. Better coordination and timely data analysis for stroke are needed and must include data on minority populations, incidence, and quality and costs of medical care. Disparities Health disparities have long been a special concern in setting national, regional, state and local ob-jectives. Healthy People 2010 identifies the elimination of such disparities as one of its overarching goals. Disparities can exist among certain populations defined by sex, race or ethnicity, education or income, disability, place of residence or sexual orientation. Based on Great Lakes Regional Stroke Network data, the following groups were identified as priority populations: minorities, rural populations, adults aged 45 and older who are at risk for stroke due to risk factors. Minorities Major disparities in the burden of stroke and their risk factors among different racial and ethnic groups are widely recognized. Based on the data presented here, in the Great Lakes region (Illinois, Indiana, Michigan, Minnesota, Ohio and Wisconsin) African-American and Hispanics stroke mor-tality rates are higher than whites. National rates are similar. Afri-can American males have the highest mortality rate in Indiana, 83.5, Michigan, 80.3, and Ohio, 89.9 (Age-adjusted mortality per 100,000). African American females have the highest stroke mor-tality rates in Minnesota, 92.8, and Wisconsin, 75.3. Data on His-panics and other minorities is difficult to quantify due to individual states’ reporting methods and small numbers.18,19 Although there are some data sources available for some of these populations, they do have limitations such as insufficient data on Asian American and Pacific Islander populations, relatively small sample sizes, lack of systematic data collection, lack of longitudinal studies, and lack of population based stroke data. These limitations of data about minority populations make it difficult to establish the true burden of stroke and its risk factors in the Great Lakes region. Multiple factors cause this disparity in stroke deaths: higher prevalence of unhealthy behavior and hypertension, inadequate knowledge of stroke signs and symptoms, lack of adequate insurance cov-erage, lower rates of calling 911, distrust of the healthcare system, and lower quality of received health care18.
Minority community education. Photo pro-vided by the ABC.

Regional Action Plan for Stroke19
Rural Populations The CDC Stroke Atlas and the Great Lakes Regional Stroke Network Atlas shows disparities between urban and rural populations in the Great Lakes region.3 Of concern is that the majority of primary stroke centers are located in these more urban areas. Additional chal-lenges facing rural areas may include the lack of a health care facility in the county, lack of training or equipment for first responders, lack of transportation to health facilities for prevention services. Distance to services can be a major factor in the outcome of emergency calls. Adults aged 45 who are at risk for stroke due to risk factors Modifiable risk factors for stroke include high blood pressure, diabetes, elevated cholesterol, obe-sity, smoking, and sedentary lifestyle. Non modifiable risk factors for stroke include race, age, pre-vious stroke or family history of stroke. As previously stated, the risk for stroke increases with age. As observed in other parts of the United States, the aging population in the Great Lakes Region is growing rapidly. Therefore, with an increased number of aging persons, the expectation would be an increase in the incidence of stroke. Clearly, data collection systems must be strengthened for disparities to be adequately addressed. The Great Lakes Regional Stroke Network recognizes that efforts in our region should focus initia-tives and efforts on disparate populations.
Pictures provided by the Ameri-can Heart Association.

Regional Action Plan for Stroke20
Stroke Systems of Care In 2005, the American Stroke Association published “Recommendations for the Establishment of Stroke Systems of Care.”4 It was acknowledged that while recent decades have seen major advances in stroke treatment and care, significant obstacles remained in translating scientific advancement into clinical practice and this was related to the fragmentation of stroke related care. The following components are key to a stroke system: • Primordial and primary prevention • Community education • Notification and response of emergency medical services (EMS) • Acute stroke treatment, including the hyperacute and emergency department phases • Subacute stroke treatment and secondary prevention • Rehabilitation • Continuous quality improvement activities Healthy People 2010
Healthy People 2010 is a comprehensive set of disease preven-tion and health promotion objectives for the United States to achieve from 2000 - 2010. Healthy People 2010 (HP 2010) iden-tifies a wide range of public health priorities and specific, meas-urable objectives (Office of Disease Prevention and Promotion http://www.healthypeople.gov/About/hpfact.htm). Two specific objectives related to stroke are found in HP 2010: • Reduce stroke deaths to 48 per 100,000 • Increase the proportion of adults who are aware of the early warning symptoms and signs of a stroke.
The objectives of the Great Lakes Regional Stroke Network Regional Action Plan for Stroke mir-rors HP 2010.

Regional Action Plan for Stroke21
Goals and
Objectives
Regional Action Plan for Stroke22
Goals and Objectives Below are listed the goals, objectives, strategies and evaluation efforts of the Great Lakes Regional Stroke Network Regional plan. All of these components are aligned with the Great Lakes Regional Stoke Network Strategic Map (see Appendix C). Strategies are consistent with “Prevention Works: CDC Strategies for a Heart-Healthy and Stroke-Free America”.
Stroke System of Care Element: Primordial/Primary Prevention & Community Education
Objective Increase awareness among residents of the Great Lakes states’ on signs and symptoms of stroke and the need to call 911. Culturally Appropriate Strategies
• Through partnerships, incorporate messages to disparate high risk patients (obese & overweight, diabetic, tobacco use, physical inactivity and poor nutrition, high cholesterol, high blood pressure) and other priority populations, regarding signs and symptoms into existing health education opportunities through providers, primary stroke centers, public health partners, professional medical societies, and health plans.
• Promote public awareness through workplace, community and media campaigns of the
signs and symptoms of stroke and the need to call 911 through collaboration with part-ners.
Surveillance, Epidemiology, Evaluation Effort Indicator
1. Proportion of Great Lakes Region residents aware of the early signs of a stroke and of appropriate action.
Data Source Behavioral Risk Factor Surveillance System and other state based surveys Expected Outcomes
1. By 2012, the proportion of residents in the Great Lakes Region who know the early signs of stroke and take the appropriate action will increase by 5%.
GOAL: Achieve targeted outcomes that reduce the burden of stroke.
Community Education by the Association of Black Cardiologists. Photo provided by ABC.

Regional Action Plan for Stroke23
Stroke System of Care Element: Notification and response of Emergency Medical Services
Objective Strengthen EMS notification and response in the Great Lakes Region by collaborating with part-ners. Strategies
• Through collaboration, strengthen partnerships between state and regional emergency medical systems, emergency departments to improve patient outcomes through educa-tion, communications (dispatch/911), data transfer and utilization of established guide-lines.
• Assess states’ EMS capacities • Encourage use of National Emergency Medical Services Information System (NEMSIS). • Support the review and revision of Great Lakes’
states emergency medical statues/policies for re-sponse to stroke including enhanced 911 and trans-port protocols.
• With partners, promote training for acute care staff
on established guidelines for stroke management. Surveillance, Epidemiology, Evaluation Effort Indicator
1. Number of states’ revising stroke emergency medical statues/policies.
Data Source Emergency Medical Service Reports Expected Outcome
1. By 2012, the number of states in the Great Lakes Region with revised emergency medical statues/policies will increase from 0 to 2.
GOAL: Achieve targeted outcomes that reduce the burden of stroke.
Photo provided by the National Stroke Association.

Regional Action Plan for Stroke24
Stroke System of Care Elements: Acute Stroke Treatment, including the hyperacute and emergency depart-ment phases; Subacute stroke treatment and secondary prevention; Continu-ous Quality Improvement
Objective Facilitate efforts to improve quality of care. Strategies
• Through partnerships, promote hospital use of data driven quality of care improvement
measures including stroke registries. • Provide state of the art stroke continuing medical education/continuing education to health
professionals via conference calls and conferences with partner organizations. • Working with partners, promote the establishment of policies to treat stroke in accordance
with the Brain Attack Coalition guidelines.
Surveillance, Epidemiology, Evaluation Effort Indicators
1. Number of Primary Stroke Centers with policies to treat stroke in accordance with Brain Attack Coalition Guidelines.
2. Number of hospitals using quality improvement tools. 3. Number of continuing medical education/continuing education efforts in the Great Lakes
Region. Data Source Individual state hospital environmental scan Expected Outcomes
1. By 2012, there will be an increase in the number of Primary Stroke Centers with policies to treat stroke in accordance with Brain Attack Coalition guidelines.
2. By 2012, there will be an increase in the number of hospitals participating in Get with the Guidelines Stroke or other quality improvement tool.
3. By 2012, there will be an increase in the number of continuing education efforts in the Great Lakes Region.
GOAL: Achieve targeted outcomes that reduce the burden of stroke.
Regional Action Plan for Stroke25
Stroke System of Care Element: Rehabilitation
Objective Facilitate efforts to integrate rehabilitation into care delivery Strategies
• Develop relationships on a state wide and region wide level with rehabilitation specialists and rehabilitation professional organizations.
• Through partners, advocate for health care coverage that includes rehabilitation services
for residents of the Great Lakes region with a history of stroke. • Support awareness of essential elements of rehabilitation services for stroke within health
plans, employer and benefits purchaser groups. • Create rehabilitation services inventory assessment tool
Surveillance, Epidemiology, Evaluation Effort Indicator: Indicator(s) will be identified. Data Source Great Lakes Regional Stroke Network Rehabilitation Services Inventory Expected Outcome: By 2012, there will be an increase in the number of regional rehabilitation data sources from 0 to 1.
GOAL: Achieve targeted outcomes that reduce the burden of stroke.
Stroke Survivors sing the National Anthem at the Minnesota Twins and National Stroke Association’s Stroke Out Stroke Day at the Dome.

Regional Action Plan for Stroke26
The following three action topics are building blocks and related to the above goal. Additionally, these areas are vital in order to reach the previous stated goals, objectives, and strategies. Objective Maintain state stroke task forces. Strategies
• Assist states in strengthening state stroke task forces by enhancing and sustaining infrastruc-ture.
• Assist states in engaging statewide leadership in targeted network priorities. • Assist states in developing region wide health care professionals as state and Network stroke
champions. • Encourage “stroke champions” and other partners to advocate for state public policy related
to stroke.
Surveillance, Epidemiology, Evaluation Effort Indicator
1. Number of states in the Great Lakes region who maintain a state stroke task force/ committee either through a specific identified committee or Statewide Heart Disease and Stroke Prevention Program Committee. Data Source Minutes of State Stroke Task Force meetings. Expected Outcome
1. By 2012, the number of state stroke task forces/committees in the Great Lakes region will maintain at six.
GOAL: Sustain a comprehensive, collaborative region wide stroke improvement initiative.

Regional Action Plan for Stroke27
Objective 1 By 2012, identify data sources to further define the burden of stroke in the Great Lakes region. Objective 2 By 2012, expand multi-state cooperative activities across state borders. Objective 3 By 2012, increase number of partnership assessments. Strategies
• Reduce gaps in state and network surveillance and epidemiology • Strengthen internal methods of communication and dissemination • Develop and implement plan to promote network value and contribution • Expand effective use of Network resources and tools
Surveillance, Epidemiology, Evaluation Effort Indicator: Indicator(s) will be identified. Data Source
1. Completed environmental scan of state Epidemiology/Surveillance efforts. 2. Completed online survey of GLRSN Listserv. 3. Completed partnership assessment.
Expected Outcomes
1. By 2012, number of data sources to define the burden of stroke in the Great Lakes region will increase from 1 to 4. 2. By 2012, number of multi-state cooperative activities across state borders will increase from 0 to 2.
GOAL: Sustain a comprehensive, collaborative region wide stroke improvement initiative.
GLRSN State Advisory Board Meeting, 2005

Regional Action Plan for Stroke28
Objective: Expand Network funding. Strategies:
• Educate potential partners about the network and joint opportunities utilizing existing com-munication tools/pieces.
• Identify and prioritize funders whose mission and priorities align with the Network. • Collaborate with partners to leverage resources and expand opportunities.
Surveillance, Epidemiology, Evaluation Effort Indicator
1. Number of funders of the Great Lakes Regional Stroke Network. Data Source: Great Lakes Regional Stroke Network Website Expected Outcome
1. By 2012, the number of funders of the Great Lakes Regional Stroke Network will increase from 1 to 2.
GOAL: Sustain a comprehensive, collaborative region wide stroke improvement initiative.
Members of the Great Lakes Regional Stroke Network Advisory Board discuss funding.

Regional Action Plan for Stroke29
Next Steps

Regional Action Plan for Stroke30
Measuring outcomes/evaluation Surveillance and evaluation are critical components of the Great Lakes Regional Stroke Network Plan for Stroke. Surveillance pro-vides information about where we are currently in our efforts to reduce stroke in the Great Lakes region. Knowing our current status allows us to make informed decisions about where to focus our efforts. Evaluation provides information about how successful those efforts have been. The Great Lakes Regional Stroke Network will continue to pursue new sources of information about clinical outcomes. Together, surveillance and evaluation allow us to better define our goals, and they allow us to identify the best ways to achieve those goals. Process evaluation involves tracking progress toward objectives and activities designed to bring about changes directly linked to the Network’s goals. Process evaluation will determine the extent to which the plan is being implemented as intended, the degree to which objectives are progressing toward completion over the course of the five-year plan, including the assessment of strengths, weaknesses and lessons learned during plan implementation; and how the Network appropriately focuses stroke efforts, especially towards priority populations. Process evaluation is noted through-out the goals and objectives sections. Evaluation of the Plan will be implemented by the epidemiol-ogy work group of the Network under the direction of the Program Director and Program Man-ager Next Steps We need active and engaged partners to implement this plan. Through partnerships with institu-tions, professional organizations and other groups, we help to guide and develop programs and focus work in our communities, worksites and health care system. Next steps include meeting objectives proposed in the Network’s application to CDC, achieving outcomes identified on our strategic plan, identifying additional funding streams, supporting each GLRSN state’s application to CDC for HDSP funding, implementation of the above key strategies and evaluation components and coordination of all states stroke task force calls. How often should this plan be updated? This blueprint is designed for years 2007-2012 and needs to be reviewed in a timely fashion to as-sure that policies match the ever changing population we serve. Resources Needed to Implement this Regional Plan Stroke is the third leading cause of death in this country and in the Great Lakes region. Therefore, stroke prevention, treatment and awareness needs to be funded at a significant level in order to achieve this ambitious plan. Significant resources are needed to accomplish the goal and objectives set forth in this plan. Each state in the Great Lakes Regional Stroke Network would need to be funded by the Centers for Disease Control and Prevention’s Heart Disease and Stroke Prevention Program at an appropriate level. Additionally, state monies provided to the Heart Disease and Stroke Prevention Program would also increase the likelihood of success. In order to maintain a coordinated regional approach, future funding of the Great Lakes Regional Stroke Network would also be necessary.

Regional Action Plan for Stroke31
The Great Lakes Regional Stroke Network acknowledges that governmental funding at a high enough level to create considerable change is unlikely and therefore recognizes the need to collabo-rate with for-profit entities such as businesses. Private foundations are another potential funding source. The importance of partnerships cannot be underestimated as many organizations are doing more with less. The number of potential partners is almost endless and could include public health agencies, health care providers, other health-sector partners, non-health sector partners, the com-munity at large and representatives of specific groups or settings and all interested parties and stakeholders. The Illinois Department of Public Health is the lead agency with fiscal responsibility for this re-gional plan. Individual states in the Network receive monies yearly to implement these strategies in conjunction with their other state related strategies. A yearly contract is required outlining fiscal responsibilities. Circumstances in Region The outcomes of gubernatorial elections in 2006 and beyond are expected to have a major influence on Heart Disease and Stroke Prevention programs in the region. Typically, if there is a change in the Gov-ernor, there will be major changes in the administra-tion, including the health department, where heart disease and stroke prevention programs are housed. The economic/funding climate of states in the re-gion will continue to affect heart disease and stroke prevention programs. For example, the Preventive Block Grant is used by many states for heart disease and stroke initiatives. There have been talks about the elimination of this grant. Federal funding deficits affect on state funding by trickle down effects. The Challenge: A Regional Approach to Reducing the Burden of Stroke During the 1990’s overall death rates to stroke declined, but the actual number of deaths increased, reflecting the growth in the population over age 65.20 Studies have shown that while a therapy ex-ists for ischemic stroke, it must be administered within 3 hours from the onset of symptoms.21 The majority of candidates do not make it to the hospital within that time frame (The Paul Cover-dell Prototype Registries Writing Group, 2005).22 Since stroke symptoms are often vague and acute therapies for stroke are only more recently available, people may not recognize the seriousness or the urgent nature of calling 911. Many people believe that stroke affects only older people and therefore may be in denial when witnessing a stroke. According to Elkins and Johnston (2003), stroke deaths are predicted to increase by 98 percent in between 2002 and 2032.23 This means that the epidemic of stroke can be expected to continue, “with an increasing burden and widening dis-parities unless unprecedented public health efforts are mounted to arrest and reverse it.”5 Besides an increase in the population 65 and older, there are other obstacles in implementing a re-gional plan. An inventory conducted by Great Lakes Regional Stroke Network staff identified many barriers facing the Great Lakes region in improving stroke risk factors and care. This inven-

Regional Action Plan for Stroke32
tory found that resources in each state in the Great Lakes Regional Stroke Network vary widely not only financially but also in personnel. The CDC reports that support for public health programs to prevent heart disease and stroke is low. State public health agencies expend less than 3% of their budgets on chronic disease programs, including heart disease and stroke prevention.20 There are two states in the Network do not receive Heart Disease and Stroke Prevention funding from the CDC and only one state receives any state specific funding for stroke. Another difficulty facing the region is that infrastructures vary widely from state to state and within each state. For example, some states do not have an Emergency Medical Services Medical Director. Not all counties have enhanced or wireless 911 services in the region including emergency medical dispatch. Some states do not have a designated heart disease and stroke prevention program (Great Lakes Regional Stroke Network Inventory, 2005). There are other circumstances that are expected to have a major influence in the Great Lakes region. Several states in the Network had a gubernato-rial election in the Fall of 2006 which may affect the political climate in the state. Also, many states are experiencing a budget crisis. Populations also vary widely between and within the states. While each state in the Network has a large metropolitan area, each state also has very rural areas. Geographical issues also impact stroke care. Standardization of messages, materials and policies is also complicated across six states with vary-ing resources and structures. A comprehensive inventory of public education activities and initia-tives across the region conducted in 2004-2005 found that while there were many public education activities among partners throughout the region (over 76 educational activities!), there was not al-ways a coordinated effort among hospitals, heart disease and stroke prevention programs and other organizations. There was no standardization of messages or materials.
Healthcare Professionals attend the National Stroke Association Stroke Team Meeting 2006. Photo provided by the National Stroke Association.

Regional Action Plan for Stroke33
Appendices
Regional Action Plan for Stroke34
Appendix A History The Great Lakes Regional Stroke Network (GLRSN) was developed by six state health department cardiovascular program staff and state stroke task force members in Illinois, Indiana, Michigan, Minnesota, Ohio and Wisconsin to increase stroke awareness and prevention and control activities within and across the region. The Great Lakes Regional Stroke Network works through a State Advisory Board, Steering Com-mittee, Work Groups and individual state Stroke Task Forces/Committees to share experiences and resources across the six states to implement a common public health plan for stroke. By pro-viding funds to each of the six State Health Departments in the Great Lakes Region, Heart Disease and Stroke Prevention Programs along with their state stroke task forces are able to implement ac-tivities and initiatives within their states based on the Network’s recommendations. These recom-mendations are based on the CDC’s Program Announcement 02045 and Supplemental Program Announcement 02045. These recommendations allow for a unified approach across the region to stroke. Attachment A is a summary of individual state activities during the reporting period. The University of Illinois (UIC), Center for Stroke Research has been contracted by the Illinois Department of Public Health to facilitate the Network. Each state received a grant from the Illi-nois Department of Public Health for state stroke activities.
Inaugural meeting of the Great Lakes Regional Stroke Network Advisory Board
Regional Action Plan for Stroke35
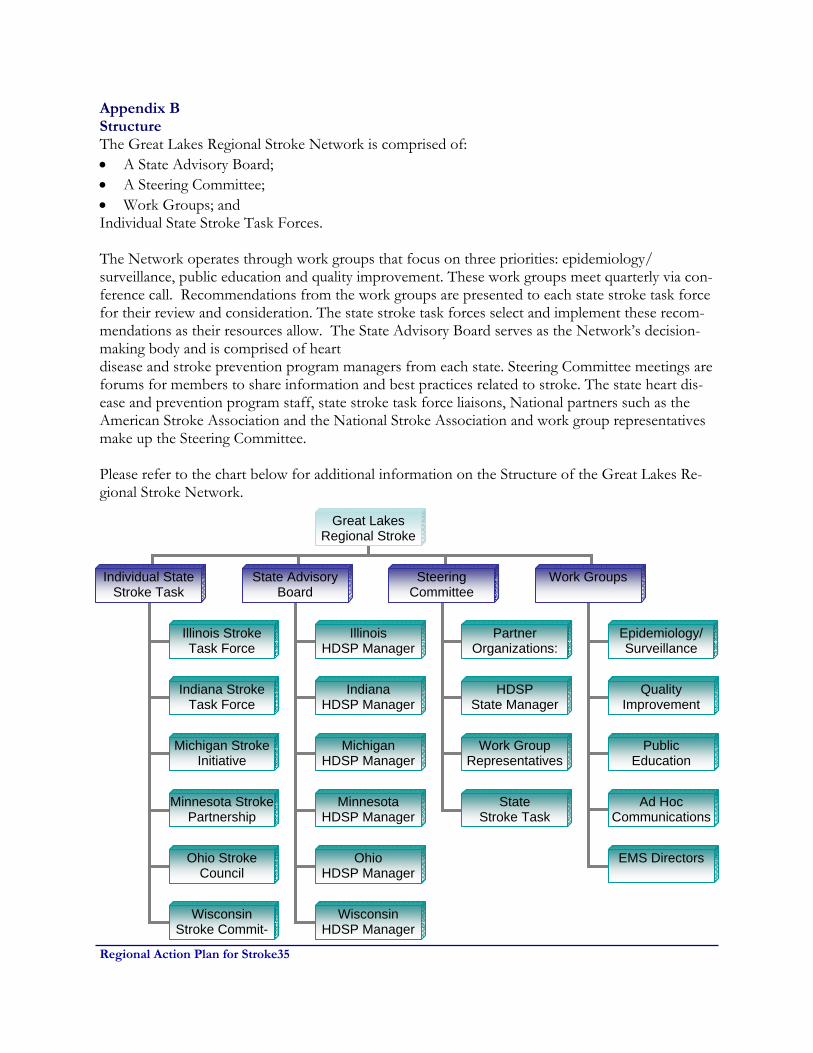
Appendix B Structure The Great Lakes Regional Stroke Network is comprised of: • A State Advisory Board; • A Steering Committee; • Work Groups; and Individual State Stroke Task Forces. The Network operates through work groups that focus on three priorities: epidemiology/surveillance, public education and quality improvement. These work groups meet quarterly via con-ference call. Recommendations from the work groups are presented to each state stroke task force for their review and consideration. The state stroke task forces select and implement these recom-mendations as their resources allow. The State Advisory Board serves as the Network’s decision-making body and is comprised of heart disease and stroke prevention program managers from each state. Steering Committee meetings are forums for members to share information and best practices related to stroke. The state heart dis-ease and prevention program staff, state stroke task force liaisons, National partners such as the American Stroke Association and the National Stroke Association and work group representatives make up the Steering Committee. Please refer to the chart below for additional information on the Structure of the Great Lakes Re-gional Stroke Network.
Great Lakes Regional Stroke
Individual State Stroke Task
State Advisory Board
Steering Committee
Work Groups
Illinois Stroke Task Force
Indiana Stroke Task Force
Michigan Stroke Initiative
Minnesota Stroke Partnership
Ohio Stroke Council
Wisconsin Stroke Commit-
Partner Organizations:
Illinois HDSP Manager
Indiana HDSP Manager
Michigan HDSP Manager
Minnesota HDSP Manager
Ohio HDSP Manager
Wisconsin HDSP Manager
Epidemiology/ Surveillance
Quality Improvement
Public Education
HDSP State Manager
Work Group Representatives
State Stroke Task
Ad Hoc Communications
EMS Directors

Regional Action Plan for Stroke36
Rev.
SecureSustainableResources
IncreaseNetwork
Effectiveness
Enhance Stateand NetworkLeadership
and Capacity
Great Lakes Regional Stroke NetworkStrategic Map: 2006-2008
Achieve Targeted OutcomesThat Reduce the Burden of Stroke
Foster KeyElements of
Stroke Systemof Care
PromotePublic Education
on Signs, Symptomsand 911
Facilitate Effortsto Improve
Quality of Care
StrengthenEMS Notificationand Response
Identify and PrioritizeFunders Whose
Mission and PrioritiesAlign with GLRSN
Educate PotentialPartners about the
Network andJoint Opportunities
Collaborate withPartners to Leverage
Resources andExpand Opportunities
Facilitate Effortsto Integrate
Rehabilitationinto Care Delivery
StrengthenInternal Methods of
Communicationand Dissemination
Engage StatewideLeadership in
Targeted NetworkPriorities
Encourage Partnersto Advocate for
State Public PolicyRelated to Stroke
Develop Health CareProfessionals as
State and NetworkStroke Champions
Develop andImplement Plan toPromote Network
Value and Contribution
Expand and Diversify
Network Funding
Expand EffectiveUse of Network
Resources and Tools
Integrate Surveillance, Epidemiology and Evaluation into Network Efforts
Continue to Strengthen State
Stroke Taskforces
Reduce Gaps inState and NetworkSurveillance and
Epidemiology
Appendix C Strategic Map In January, 2006, the decision making body of the Great Lakes Regional Stroke Network participated in a strategic planning session. The end result of this session was the creation of a Strategic Map found below.
Regional Action Plan for Stroke37
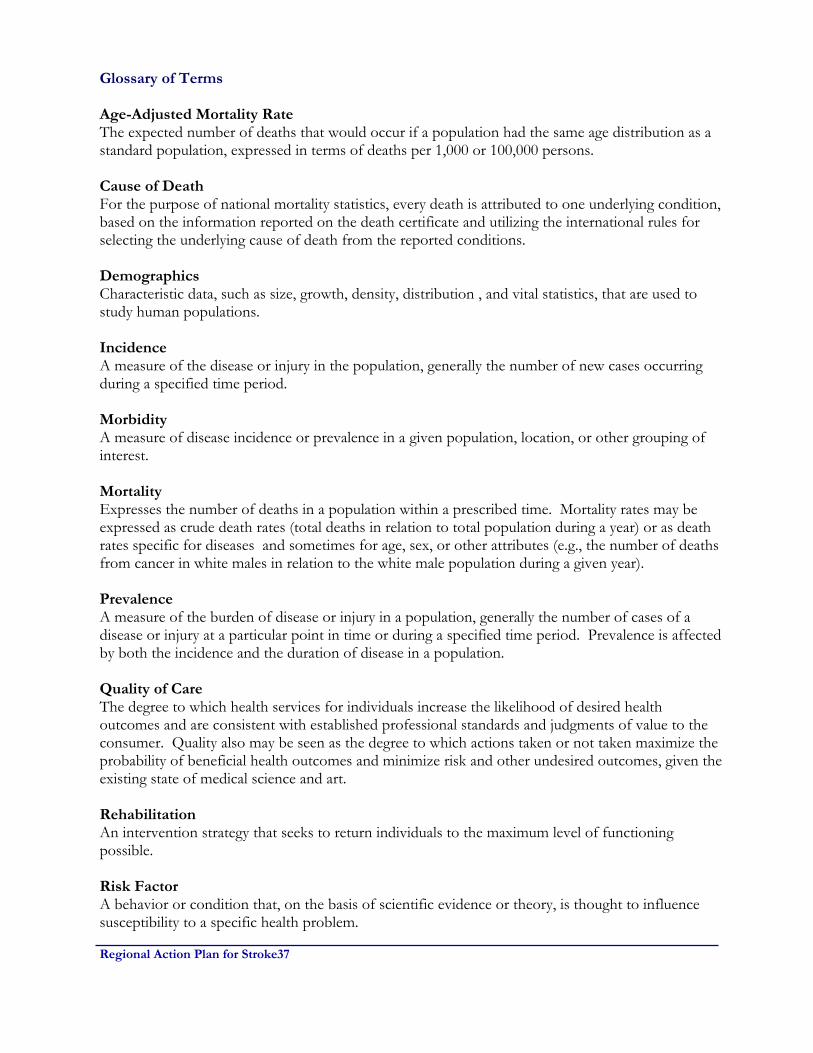
Glossary of Terms
Age-Adjusted Mortality Rate The expected number of deaths that would occur if a population had the same age distribution as a standard population, expressed in terms of deaths per 1,000 or 100,000 persons. Cause of Death For the purpose of national mortality statistics, every death is attributed to one underlying condition, based on the information reported on the death certificate and utilizing the international rules for selecting the underlying cause of death from the reported conditions. Demographics Characteristic data, such as size, growth, density, distribution , and vital statistics, that are used to study human populations. Incidence A measure of the disease or injury in the population, generally the number of new cases occurring during a specified time period. Morbidity A measure of disease incidence or prevalence in a given population, location, or other grouping of interest. Mortality Expresses the number of deaths in a population within a prescribed time. Mortality rates may be expressed as crude death rates (total deaths in relation to total population during a year) or as death rates specific for diseases and sometimes for age, sex, or other attributes (e.g., the number of deaths from cancer in white males in relation to the white male population during a given year). Prevalence A measure of the burden of disease or injury in a population, generally the number of cases of a disease or injury at a particular point in time or during a specified time period. Prevalence is affected by both the incidence and the duration of disease in a population. Quality of Care The degree to which health services for individuals increase the likelihood of desired health outcomes and are consistent with established professional standards and judgments of value to the consumer. Quality also may be seen as the degree to which actions taken or not taken maximize the probability of beneficial health outcomes and minimize risk and other undesired outcomes, given the existing state of medical science and art. Rehabilitation An intervention strategy that seeks to return individuals to the maximum level of functioning possible. Risk Factor A behavior or condition that, on the basis of scientific evidence or theory, is thought to influence susceptibility to a specific health problem.
Regional Action Plan for Stroke38
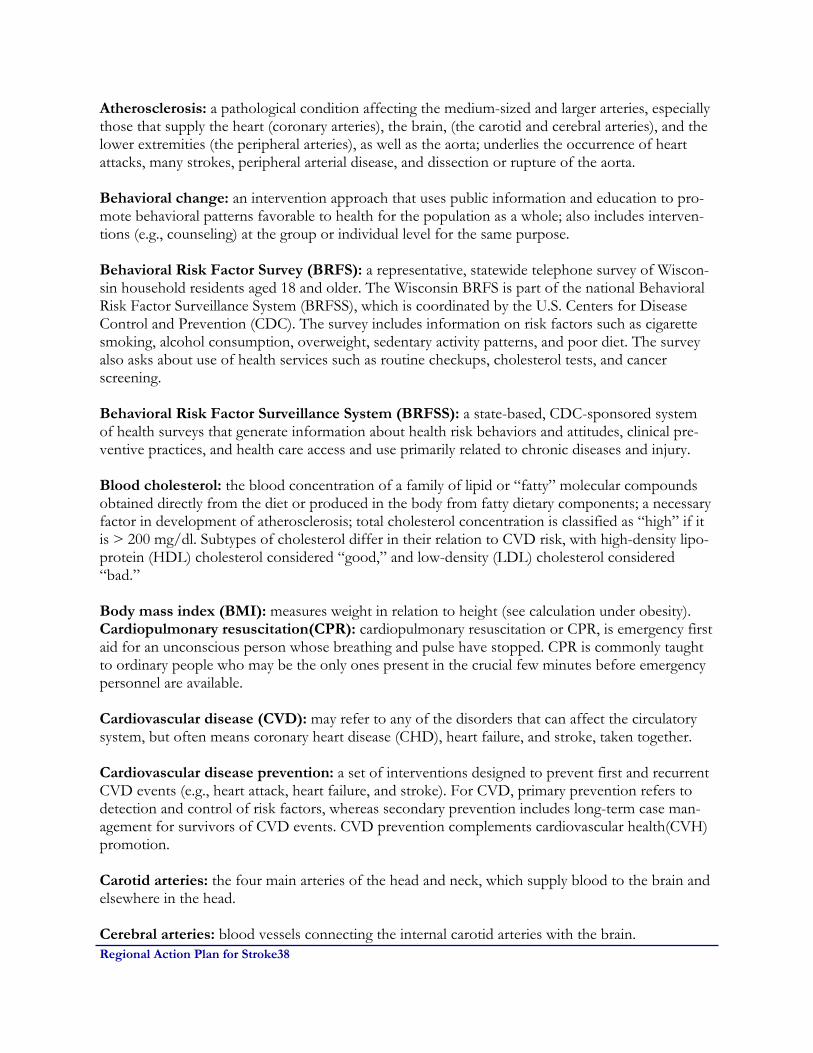
Atherosclerosis: a pathological condition affecting the medium-sized and larger arteries, especially those that supply the heart (coronary arteries), the brain, (the carotid and cerebral arteries), and the lower extremities (the peripheral arteries), as well as the aorta; underlies the occurrence of heart attacks, many strokes, peripheral arterial disease, and dissection or rupture of the aorta. Behavioral change: an intervention approach that uses public information and education to pro-mote behavioral patterns favorable to health for the population as a whole; also includes interven-tions (e.g., counseling) at the group or individual level for the same purpose. Behavioral Risk Factor Survey (BRFS): a representative, statewide telephone survey of Wiscon-sin household residents aged 18 and older. The Wisconsin BRFS is part of the national Behavioral Risk Factor Surveillance System (BRFSS), which is coordinated by the U.S. Centers for Disease Control and Prevention (CDC). The survey includes information on risk factors such as cigarette smoking, alcohol consumption, overweight, sedentary activity patterns, and poor diet. The survey also asks about use of health services such as routine checkups, cholesterol tests, and cancer screening. Behavioral Risk Factor Surveillance System (BRFSS): a state-based, CDC-sponsored system of health surveys that generate information about health risk behaviors and attitudes, clinical pre-ventive practices, and health care access and use primarily related to chronic diseases and injury. Blood cholesterol: the blood concentration of a family of lipid or “fatty” molecular compounds obtained directly from the diet or produced in the body from fatty dietary components; a necessary factor in development of atherosclerosis; total cholesterol concentration is classified as “high” if it is > 200 mg/dl. Subtypes of cholesterol differ in their relation to CVD risk, with high-density lipo-protein (HDL) cholesterol considered “good,” and low-density (LDL) cholesterol considered “bad.” Body mass index (BMI): measures weight in relation to height (see calculation under obesity). Cardiopulmonary resuscitation(CPR): cardiopulmonary resuscitation or CPR, is emergency first aid for an unconscious person whose breathing and pulse have stopped. CPR is commonly taught to ordinary people who may be the only ones present in the crucial few minutes before emergency personnel are available. Cardiovascular disease (CVD): may refer to any of the disorders that can affect the circulatory system, but often means coronary heart disease (CHD), heart failure, and stroke, taken together. Cardiovascular disease prevention: a set of interventions designed to prevent first and recurrent CVD events (e.g., heart attack, heart failure, and stroke). For CVD, primary prevention refers to detection and control of risk factors, whereas secondary prevention includes long-term case man-agement for survivors of CVD events. CVD prevention complements cardiovascular health(CVH) promotion. Carotid arteries: the four main arteries of the head and neck, which supply blood to the brain and elsewhere in the head. Cerebral arteries: blood vessels connecting the internal carotid arteries with the brain.

Regional Action Plan for Stroke39
Chronic Care Model: The Chronic Care Model identifies the essential elements of a health care system that encourage high-quality chronic disease care. These elements are the community, the health system, self-management support, delivery system design, decision support and clinical in-formation systems. Evidence-based change concepts under each element, in combination, foster productive interactions between informed patients who take an active part in their care, and pro-viders who have resources and expertise. The model can be applied to a variety of chronic illnesses, health care settings and target populations. The bottom line is healthier patients, more satisfied providers, and cost savings. See www.improvingchroniccare.org/change/model/components.html. Comprehensive public health strategy: an approach to a major health problem in the popula-tion that identifies and employs the full array of potential public health interventions, including health promotion and disease prevention. Congestive heart failure (CHF): impairment of the pumping functions of the heart as the result of heart disease; heart failure often causes physical disability and increased risk for other cardiovas-cular events. Coronary arteries: the arteries that supply blood to the heart muscle and whose narrowing or oc-clusion constitutes coronary heart disease and can precipitate a heart attack. Coronary heart disease: heart disease caused by impaired circulation in one or more coronary arteries; often manifests as chest pain (angina pectoris) or heart attack. Diabetes (or diabetes mellitus): a metabolic disorder resulting from insufficient production or utilization of insulin, commonly leading to cardiovascular complications. Dyslipidemia: Disorders in the lipoprotein metabolism; classified as high cholesterol, high triglyc-erides, combined hyperlipidemia, and low levels of high-density lipoprotein (HDL) cholesterol. All of the dyslipidemias can be primary or secondary. Both elevated levels of low-density lipoprotein (LDL) cholesterol and low levels of HDL cholesterol predispose one to premature atherosclerosis. Emergency care: treatment for people who have experienced a first or recurrent acute cardiovas-cular event (e.g., heat attack, heart failure, and stroke) designed to increase their probability of sur-vival and to minimize associated damage or disability. Evidence-based medicine: the use of agreed-upon standards of evidence in making clinical deci-sions for treating individual patients or categories of patients. Federally Qualified Health Center (FQHC): A Federally Qualified Health Center (FQHC) is an American community based health organization. An FQHC provides comprehensive primary health, oral, and mental health/substance abuse services to persons in all stages of the life cycle. Health care systems: the community health centers, health care clinics, hospitals, and health in-surance plans that deliver or pay for health services. Health disparities: differences in the burden and impact of disease among different populations, defined for example, by sex, race or ethnicity, education or income, disability, place of residence, or

Regional Action Plan for Stroke40
sexual orientation. Healthy People 2010: a national document that presents the most important health-related goals and objectives to be achieved in the the United States to be achieved by the year 2010. HEDIS® (Health Plan Employer Data and Information Set): Healthcare systems’ evaluation of the effectiveness of their care in managing blood pressure, cholesterol, diabetes, and smoking cessation in their constituencies. Heart disease: any affliction that impairs the structure or function of the heart (e.g., atheroscle-rotic and hypertensive diseases, congenital heart disease, rheumatic heart disease, and cardio-myopathies). Heart Disease and Stroke Prevention Program: a CDC program initiated in 1998 that supports states in their efforts to prevent heart disease and stroke; for more information see www.cdc.gov/cvh/stateprogram.htm. High blood pressure (hypertension): a condition in which the pressure in the arterial circulation is greater than desired; associated with increased risk for heart disease, stroke, chronic kidney dis-ease, and other conditions; blood pressure is considered “high” if systolic pressure (measured at the peak of contraction of the heart) is > 140 mm Hg or if diastolic pressure (measured at the fullest relaxation of the heart) is > 90 mm Hg. High-density Lipoprotein (HDL): A form of cholesterol that circulates in the blood commonly called “good” cholesterol. High HDL lowers the risk of heart disease. An HDL of 60 mg/dL or greater is considered high and protects against heart disease. An HDL less than 40 mg/dL is con-sidered low and increases the risk for developing heart disease. Incidence: the number of new cases of disease occurring in a population of given size within a specified time interval (e.g., the average annual incidence of stroke for women in Rochester, Min-nesota during 1985-1989 was approximately 120/100,000 population). Low-density Lipoprotein (LDL): A complex of lipids and proteins, with greater amounts of lipid than protein that transports cholesterol in the blood. High levels are associated with an increased risk of atherosclerosis and coronary heart disease. See blood cholesterol. Mortality: rate of death expressed as the number of deaths occurring in a population of given size within a specified time interval (e.g., 265 annual deaths from heart disease per 100,000 U.S. His-panic women, 1991-1995). Obesity: usually defined in terms of body mass index (BMI) which is calculated as body weight in kilograms (1 kg=2.2lbs) divided by height in meters (1 m=39.37 in) squared; adults with a BMI greater than 30.0 kg/m2 are considered “obese,” and those with a BMI of 25-29.9 kg/m2 are con-sidered “overweight.” In children, overweight is defined as BMI greater than the 95th percentile value for the same age and sex group. Peripheral arteries: arteries in the upper and lower extremities (arms and legs).

Regional Action Plan for Stroke41
Physical inactivity: lack of habitual activity sufficient to maintain good health, resulting in an un-favorable balance between energy intake and expenditure and fostering the development of over-weight or obesity and other risk factors for heart disease and stroke. Policy and environmental change: an intervention approach to reducing the burden of chronic disease that focuses on enacting effective policies (e.g., laws, regulations, formal and informal rules) or promoting environmental change (e.g., changes to economic, social, or physical environment). Prevalence: the frequency of a particular condition within a defined population at a designated time (e.g., 12.6 million Americans living with heart disease in 1999). Primary CVD prevention: a set of interventions, including the detection and control of risk fac-tors, designed to prevent the first occurrence of heart attack, heart failure, or stroke among people with identifiable risk factors. Primordial CVD prevention: a set of interventions targeting people without risk factors or CVD (including promotion of healthy behavior patterns) to prevent development of risk factors. Priority Populations: groups at especially high risk for CVD, (e.g., those identified by sex, race or ethnicity, education, income, disability, place of residence, or sexual orientation). Rehabilitation: an intervention approach designed to limit disability among survivors of CVD events and reduce their risk for subsequent events. Risk behavior: a behavioral pattern associated with increased frequency of specified health prob-lems; for example, high salt intake, smoking, and binge drinking are all associated with CVD. Risk factor: an individual characteristic associated with increased frequency of specified health problems; for example, high LDL cholesterol, high blood pressure, and diabetes are all associated with CVD. Risk factor detection and control: an intervention approach that targets people with identifiable risk factors; includes both screening or other methods of detection and long-term disease manage-ment through changes in lifestyle, behavior, and medication (when necessary). Secondary prevention: a set of interventions aimed at survivors of acute CVD events (e.g., heart attack, heart failure and stroke) or others with known CVD in which long-term case management is used to reduce disability and risk for subsequent CVD events. Stroke: sudden interruption of blood supply to the brain caused by an obstruction or the rupture of a blood vessel. Survival: remaining alive for a specified period (e.g., beyond the 28-day definition of case fatality) after a CVD event. Tertiary CVD prevention: an intervention approach included in secondary prevention, sometimes distinguished as reducing disability among survivors of CVD events through rehabilitation. Collaborative_Improvement_Project.htm.
Regional Action Plan for Stroke42
Years of Potential Life Lost (YPLL) A measure of the impact of disease or injury in a population that calculates years of life lost before a specific age (often age 65 or age 75). This approach places additional value on deaths that occur at earlier ages. (Source: Turnock BJ. Public Health: What It Is and How It Works. Maryland. Aspen Publishers. 2001.) Youth Risk Behavior Surveillance System (YRBSS): the national system that monitors priority health risk behaviors that contribute to the leading causes of death, disability, and social problems among youth and adults in the United States. Youth Risk Behavior Survey (YRBS): a survey conducted by states as part of the national Youth Risk Behavior Surveillance System (YRBSS). The national YRBS is administered every two years during the spring semester and provides data representative of 9th through 12th grade students in public and private schools throughout the United States. (Source for Glossary expect for noted citations: Department of Health and Family Services, Divi-sion of Public Health, Cardiovascular Health Program, Cardiovascular Health Alliance, Wisconsin Plan for Heart Disease and Stroke Prevention, 2005-2009. March 2005.)

Regional Action Plan for Stroke43
References
1. Kochanek KD, Murphy SL, Anderson RN, Scott C. Deaths: Final Data for 2002. National Vital Statistics Reports;Vol.53 No5. Hyattsville, Maryland: National Center for Health Statistics. 2004.
2. Great Lakes Regional Stroke Network. Burden Document. 3. Prevention Works: CDC Strategies for a Heart Healthy and Stroke Free America. 4. Schwamm, et al. Recommendations for the establishment of stroke systems of care. Stroke.
2005; 36: 1-14. 5. US Department of Health and Human Services. A Public Health Action Plan to Prevent Heart
Disease and Stroke. Atlanta, GA: US Department of Health and Human Services, Centers for Disease Control and Prevention; 2003.
6. National Institute of Neurological Disorders and Stroke Symposium. Improving the chain of
recovery for acute stroke in your community task force reports. 2002 NIH Publication No. 03-5348,
7. American Heart Association website: www.americanheart.org. 8. National Stroke Association. Learning the Language of Stroke, 2005. 9. Campbell, Paul R. Population Projections for States, by Age, Sex, Race and Hispanic Origin:
1995 to 2025. U.S. Bureau of the Census, Population Division, 1996. 10. Cooper R, Cutler J, Desvigne-Nickens P, et al. Trends and Disparities in Coronary Heart
Disease, Stroke, and Other Cardiovascular Diseases in the United States. Findings of the National Conference on Cardiovascular Disease Prevention. Circulation. 2000;102:3137-47.
11. Howard VJ, Cushman M, Pulley V, Gomez CR, Go RC, Prineas RJ, Grahm A, Moy CS, and
Howard G. The Reasons for Geographic and Racial Differences in Stroke Study: Objectives and Design. Neuroepidemiology. 2005;25:135-143.
12. Greenlund KJ, Neff LJ, Zheng ZJ, Keenan NL, Giles WH, Ayala CA, Croft JB, Mensah GA.
Low Public Recognition of Major Stroke Symptoms. American Journal of Preventive Medicine. 2003; 25(4):315-319.
13. Turnock BJ. Public Health: What It Is and How It Works. Maryland. Aspen Publishers. 2001. 14. Kochanek KD, Murphy SL, Anderson RN, Scott C. Deaths: Final Data for 2002. National
Vital Statistics Reports;Vol.53 No5. Hyattsville, Maryland: National Center for Health Statistics. 2004.
15. Ayala C, Croft JB, Greenlund KJ, Keenan NL, Donehoo RS, Malarcher AM, Mensah GA. Sex
Differences in U.S. Mortality Rates for Stroke and Stroke Subtypes by Race/Ethnicity and
Regional Action Plan for Stroke44
Age, 1995-1998. Stroke. 2002; 33:1197-1201. 16. Centers for Disease Control and Prevention. Disparities in Deaths from Stroke Among Persons
Aged <75 Years, United States, 2002. Morbidity and Mortality Weekly Report. 2005; 54(19):477-481.
17. Centers for Disease Control and Prevention. Racial/Ethnic and Socioeconomic Disparities in
Multiple Risk Factors for Heart Disease and Stroke, United States, 2003. Morbidity and Mortality Weekly Report. 2005; 54(05):113-117.
18. Pandey, D. and Gorelick, P. Epidemiology of Stroke in African Americans and Hispanic
Americans. Medical Clinics of North America. 2005; 89(4). 19. Lanska, D. Geographic Distribution of Stroke Mortality Among Immigrants to the United
States. Stroke.1997; 28: 53-57. 20. Centers for Disease Control and Prevention. Unrealized Prevention Opportunities: Reducing
the Health and Economic Burden of Chronic Disease. Atlanta, GA: US Department of Health and Human Services, Centers for Disease Control and Prevention; 2000.
21. Chiu D, Krieger D, Villa-Cordova C, Kasner SE, Morgenstern LB, Bratina PL, Yatsu FM,
Grotta JC. Intravenous tissue plasminogen activator for acute ischemic stroke: feasibility, safety, and efficacy in the first year of clinical practice. Stroke. 1998; 29: 18-22.
22. Paul Coverdell Prototype Registries Writing Group. Acute Stroke Care in the US: Results from
4 Prototypes of the Paul Coverdell Acute Stroke Registry. Stroke. 2005; 36: 1232-1240. 23. Elkins J and Johnston C. Thirty-year projections for deaths from ischemic stroke in the United
States. Stroke. 2003; 34: 2109-2113. 24. Centers for Disease Control and Prevention. Heart-healthy and stroke-free states: A
communication guide for policy and environmental change. Atlanta, GA: US Department of Health and Human Services, Centers for Disease Control and Prevention, 2004.
25. U.S. Department of Health and Human Services. Healthy People 2010: Understanding and
Improving Health. 2nd ed. Washington, DC: U.S. Government Printing Office, November 2000.


