Regional Resource Flow Model Project 2014/2015 Synthesis Report Analysing the carbon and resource intensity of the Western Cape economy March 2015 Authors: Catherine Pineo Pieter Frederik Janse van Vuuren Prepared for: Department of Economic Development and Tourism Western Cape Government Contact: Lauren Basson Manager: Strategic Initiatives [email protected]
Transcript
Regional Resource Flow
Model Project
2014/2015
Synthesis Report
Analysing the carbon and resource intensity of the Western Cape economy
Signature page For the GreenCape Sector Development Agency
Name & Surname: Lauren Basson
Position: Strategic Initiatives Manager
––––––––––––––––––––––––––––
Signature:
––––––––––––––––––––––––––––
Date:
Name & Surname: Evan Rice
Position: Chief Executive Officer
––––––––––––––––––––––––––––
Signature:
––––––––––––––––––––––––––––
Date:
RRFM 2014/15: Synthesis Report Page 2
Acknowledgments
Project funding:
The Regional Resource Flow Model project is funded by the Western Cape Department of Economic Development and Tourism
Members of the project team:
Name Organisation Role
Catherine Pineo GreenCape Sector Development Agency Analyst
Pieter Frederik Janse van Vuuren GreenCape Sector Development Agency Analyst
Chris Millson GreenCape Sector Development Agency Project Manager
Lauren Basson GreenCape Sector Development Agency GreenCape Projects Manager
Jim Petrie Department of Economic Development and Tourism, Western Cape Government
Technical Advisor
Project steering committee:
Details of the steering committee members are provided below. The contributions from the steering committee throughout the year have been much appreciated by the project team.
Name Organisation
Leann Cloete-Beets Department of Agriculture, Western Cape Government
Bongiswa Matoti Department of Agriculture, Western Cape Government
Thami Vilakazi Department of Economic Development and Tourism, Western Cape Government
Lise Jennings-Boom Department of Environmental Affairs and Development Planning, Western Cape Government
Karen Shippey Department of Environmental Affairs and Development Planning, Western Cape Government
Lauren Hermanus Department of Environmental Affairs and Development Planning, Western Cape Government
Table 2: Summary of the total direct GHG emissions (in Giga grams CO2 equivalents per year)
emitted from animal production systems in the Western Cape and South Africa. ........................ 26
RRFM 2014/15: Synthesis Report Page 6
Executive Summary The goal of the RRFM project is to provide a strategic analysis of the provincial economy and identify possible resource constraints that may limit the competitiveness and resource productivity of key sectors. This report provides a summary of key results and conclusions from phase one and two of the project, and provides an outline of planned work for phase three, should continuation funding be secured. The full project deliverables are comprised of five individual reports (Janse van Vuuren, 2015a-c; Pineo, 2015a-b).
Phase One
The first phase of the project (2013/15) examined the provincial economy at a macro-economic level. The provided quantitative evidence that:
■ The agricultural sector has a high labour absorption, particularly in terms of low skilled labour.
■ The agro-processing sector is associated with some of the highest output multipliers, highlighting it as a key sector to promote economic growth.
■ Agriculture is as a major source of non-fuel greenhouse gas emissions, with a strong linkage to the food, beverages and tobacco sector.
As a result, the project focused on the food value chain, with the second phase (2014/2015) focusing on the agricultural sector.
Phase Two
The bottom-up approach analysed the carbon intensity of key agricultural sub-sectors (i.e. grain, fruit, livestock and game) using carbon footprints provided by Confronting Climate Change (CCC), a collaborative venture by industry associations and other stakeholders, as well as provincial livestock and game GHG inventories. Furthermore, the feasibility of using water footprinting and life cycle assessments to examine the regional resource intensity and environmental impacts of key agricultural products was assessed, using wheat as a case study.
Key outputs from the agricultural analysis include:
■ Western Cape carbon intensity estimates for wheat, wine and fruit, as well as partial carbon intensity estimates for livestock and game.
■ Carbon intensity benchmarks for wine, wheat and other agricultural products in relation to international studies.
■ A regional approach for the assessment of resource use and impacts related to grain production.
■ Recommendations to improve the Department of Agriculture’s Commercial Enterprise Budgets (Combuds) in terms of informing regional analyses.
■ Recommended follow up actions for strategies and interventions to improve the resource intensity and carbon footprints of the analysed agricultural value chains.
Phase Three
Building on this analysis, it is proposed that phase three of the RRFM project (2015/2016) focus on key value chains within agro-processing and highlight resource use, constraints and possible economic and environmental trade-offs within key sub-sectors. Furthermore, areas for intervention to improve resource efficiency (energy and water) and reduce carbon intensity as well as waste beneficiation will also be explored to inform their practical implementation through GreenCape’s agricultural sector desk.
RRFM 2014/15: Synthesis Report Page 7
1. Introduction
The Western Cape faces significant (and regionally differentiated) developmental challenges. These include energy security, water security, climate change impacts and the associated risks to agricultural exports, as well as maintaining the region’s status as a globally attractive tourism destination. In conjunction, the provincial government has committed to a development strategy which is resource efficient, low carbon and socially inclusive, whilst simultaneously promoting significant value addition to its primary resources and productive economic sectors and aiming to become the green economic hub of Africa (WCG, 2013).
1.1. Goal and purpose
The goal of the Regional Resource Flow Model (RRFM) project1 is to provide a strategic analysis of the provincial economy and identify possible resource constraints that may limit the competitiveness and resource productivity of key sectors. This aligns with the Provincial Strategic Goals (PSG), specifically PSG1: to create opportunities for growth and jobs, and PSG4: to enable a resilient, sustainable, quality and inclusive living environment (WCG, 2015).
The purpose of this synthesis report is to provide an overview of the work done in the RRFM project, with reference to detailed information provided in additional reports (available on request). This report is divided into three components:
■ An analysis of the provincial economy and indications of carbon intensities per sector.
■ Detailed analyses of key agricultural sub-sectors (e.g. grain, fruit, livestock and game) and commodities (e.g. wheat and wine).
■ Insight on the next phase of the project, which will move down the value chain to agro-processing and examine the resource intensity of products in the agricultural value chain.
1.2. Outline of approach
Given that the goal of the project is to identify possible resource constraints that may limit the competitiveness and resource productivity of key sectors, an understanding of the resource intensity of various sectors and sub-sectors is fundamental. This was developed using two approaches: a broad “top-down” approach and a more detailed “bottom-up” approach.
Top-down and bottom-up approaches utilise different strategies to order and process information. The first phase of the project applied a top-down approach, using an economic model2 to provide a broad overview of the provincial economy and an understanding of the interconnectedness of sub-sectors. Although it provides some understanding of this complex system, this approach lacks detail and requires validation.
The second phase of the RRFM project made use of a bottom-up approach. This approach specifies and provides details for base components; e.g. for key commodities and sub-sectors. This can be used to develop complex sub-systems and provide a more accurate estimate of the system as a whole; e.g. for a sector as a whole. Given the complexity and intensive data requirements of this approach only key sub-sectors were considered. These contrasting strategies complement one another, as shown in Figure 1.
1 For most recently released reports see RRFM webpage on GreenCape’s website: http://green-cape.co.za/what-we-do/projects/regional-resource-flow-model/ 2 Western Cape Social Accounting Matrix (SAM) (DBSA, 2008).
RRFM 2014/15: Synthesis Report Page 8
Figure 1: Project overview indicating the complimentary approaches used in the RRFM project
The different approaches and their results are discussed in detail in the additional project reports. These include:
■ The economic report, which provides the top-down analysis of the Western Cape and the carbon
intensity of sectors using a macro-economic model3 (Janse van Vuuren, 2015a).
■ The grain, wine, fruit and livestock / game reports, which provide a detailed bottom-up analysis of
key agricultural sub-sectors (Janse van Vuuren, 2015b-c; Pineo, 2015a-b).
Key insights from the two approaches are summarised and discussed in this synthesis report.
3 Western Cape Social Accounting Matrix (SAM)
RRFM 2014/15: Synthesis Report Page 9
2. Economic analysis of the Western Cape using a top-down approach
2.1. Overview of the Western Cape economy
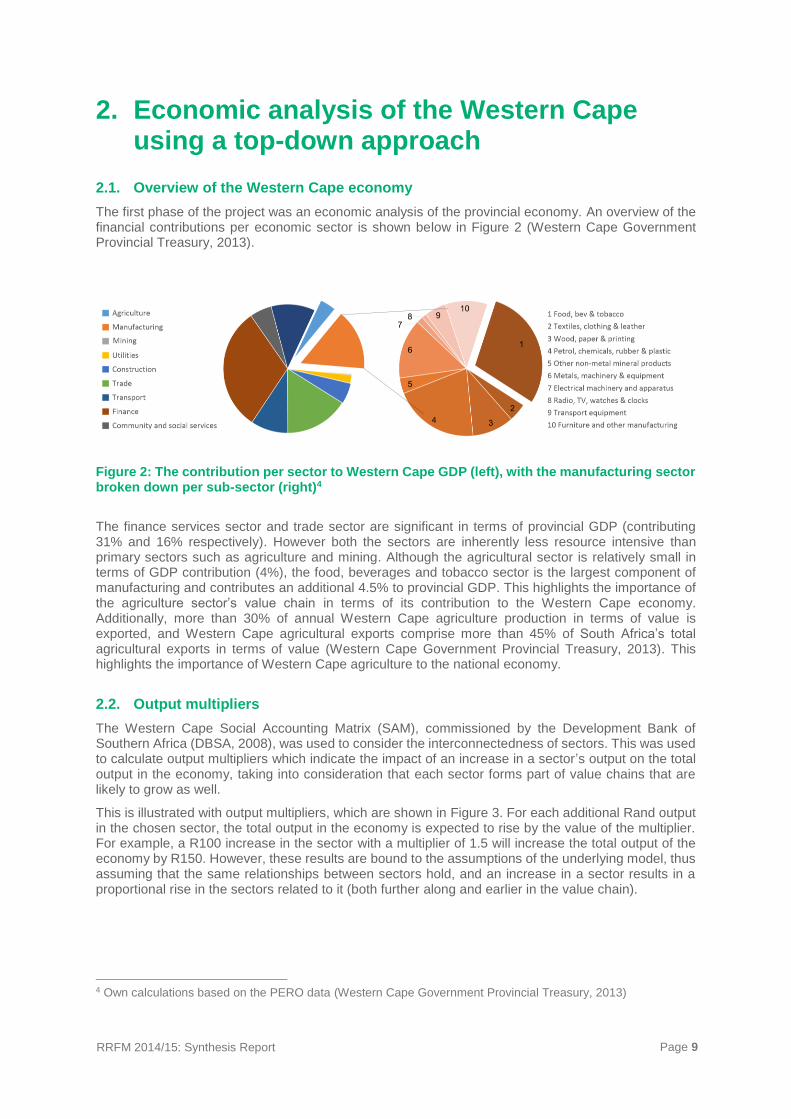
The first phase of the project was an economic analysis of the provincial economy. An overview of the financial contributions per economic sector is shown below in Figure 2 (Western Cape Government Provincial Treasury, 2013).
Figure 2: The contribution per sector to Western Cape GDP (left), with the manufacturing sector broken down per sub-sector (right)4
The finance services sector and trade sector are significant in terms of provincial GDP (contributing 31% and 16% respectively). However both the sectors are inherently less resource intensive than primary sectors such as agriculture and mining. Although the agricultural sector is relatively small in terms of GDP contribution (4%), the food, beverages and tobacco sector is the largest component of manufacturing and contributes an additional 4.5% to provincial GDP. This highlights the importance of the agriculture sector’s value chain in terms of its contribution to the Western Cape economy. Additionally, more than 30% of annual Western Cape agriculture production in terms of value is exported, and Western Cape agricultural exports comprise more than 45% of South Africa’s total agricultural exports in terms of value (Western Cape Government Provincial Treasury, 2013). This highlights the importance of Western Cape agriculture to the national economy.
2.2. Output multipliers
The Western Cape Social Accounting Matrix (SAM), commissioned by the Development Bank of Southern Africa (DBSA, 2008), was used to consider the interconnectedness of sectors. This was used to calculate output multipliers which indicate the impact of an increase in a sector’s output on the total output in the economy, taking into consideration that each sector forms part of value chains that are likely to grow as well.
This is illustrated with output multipliers, which are shown in Figure 3. For each additional Rand output in the chosen sector, the total output in the economy is expected to rise by the value of the multiplier. For example, a R100 increase in the sector with a multiplier of 1.5 will increase the total output of the economy by R150. However, these results are bound to the assumptions of the underlying model, thus assuming that the same relationships between sectors hold, and an increase in a sector results in a proportional rise in the sectors related to it (both further along and earlier in the value chain).
4 Own calculations based on the PERO data (Western Cape Government Provincial Treasury, 2013)
RRFM 2014/15: Synthesis Report Page 10
Figure 3: Output multipliers for all 46 sectors of the Western Cape SAM with agricultural sub sectors indicated in red and agro-processing indicated in blue5
5 Source: (Janse van Vuuren, 2015a, p. 20)
RRFM 2014/15: Synthesis Report Page 11
The multipliers for the agriculture and the agro-processing sectors are highlighted by using red and blue text respectively. These multipliers emphasise the relative significance of agro-processing sectors to grow the economy as a whole; the top two multipliers are from agro-processing sectors and four agro-processing sectors are in the top 10. The largest multiplier is for the “meat, fish, fruit, vegetables, oil and fat products” sub-sector which makes up the majority of the foods, beverages and tobacco sector (73%), which is the largest manufacturing sector in the province (Figure 2).
The results provides further supporting evidence for the identification of agro-processing as a so-called “game changer” for the province through Project Khulisa (Ministry of Economic Opportunities, 2014). While the agricultural sectors’ output multipliers are less prominent, the fact that they are primary inputs into the agro-processing sectors strengthens the argument to start at the agricultural stage when considering resource needs for the economy and its growth.
2.3. Labour intensity
Unemployment is a key issue in South Africa, with official unemployment at 24% at the end of 2014 (Statistics South Africa, 2015). Employment creation is therefore a top priority that is explicitly targeted by the government (e.g. through PSG 1), thus understanding the different sectors’ impact on employment is key for policy making and strategy.
Using a similar methodology to the output multipliers, labour multipliers were calculated to consider the impacts on employment creation of the advancement of different sectors. To make the results more intuitive, the Quarterly Labour Force Survey Data (Statistics South Africa, 2007) was used to consider labour multipliers in terms of job numbers, as opposed to Rands spent on labour. This may result in sectors that pay higher wages to similarly skilled labour being overemphasised. For example, professionals working in the agricultural sector are likely to earn less than those in the financial sector; hence the employment generation potential as a result of growth in the financial sector may be relatively overemphasised compared to the agricultural sector.
The results for the top 20 sectors are shown in Figure 4, with agricultural sectors highlighted in red. The employment multipliers are subdivided into three components: skilled, semi-skilled and unskilled, with the numbers being in terms of million Rand output of the sector.
The labour multipliers are dominated by the agricultural sectors (Figure 4) especially when considering the employment of unskilled labour. It is noted that the community, social & personal services sector may have the highest multiplier, but this is likely driven by the sector paying higher wages rather than employing more people.
RRFM 2014/15: Synthesis Report Page 12
Figure 4: Top 20 employment multipliers (jobs per million Rand output) with agricultural sub-sectors indicated in red6
2.4. Carbon footprint of sectors
2.4.1. Global trends
The consideration of greenhouse gas (GHG) emissions has become increasingly important for competitiveness, as consumers in developing countries are increasingly interested in the sustainability of products and services. This has resulted in: (a) the development of eco-labels, generally based on life cycle-based analyses such as carbon footprints; and (b) the implementation of delivery agreements, whereby the supplier is required to demonstrate their environmental sustainability and implement on-going programmes to improve their performance. Although this has been driven primarily by global and regional organisations (e.g. UN, IPCC, EU) and developed countries (e.g. USA, Australia and New Zealand), less developed countries such as South Africa have, and will continue to be, impacted due to their role in global supply chains. This is especially important with respect to Western Cape agriculture, as a significant portion of its total production is exported (as highlighted above in the provincial economic overview).
2.4.2. The provincial strategy
The Western Cape has developed a climate change response strategy in line with national objectives. This aims to reduce GHG emissions and highlights the need to develop benchmarks (WCG, 2014). One of the instruments to drive mitigation efforts at a national level is a proposed carbon tax, the implications of which have already been explored for agriculture using a macro-economic model (Partridge, et al., 2014). Results indicate that indirect taxation effects, such as higher energy costs, will have the greatest impact on agricultural producers.
As the carbon footprint correlates strongly with fossil-based energy inputs, understanding the carbon footprint of sectors (and the commodities within them) is thus of strategic and practical importance. This
6 Reference: Economic report (Janse van Vuuren, 2015a, p. 18)
RRFM 2014/15: Synthesis Report Page 13
understanding may enable the identification of points of intervention, to reduce energy and carbon intensity. This achieves two objectives; firstly maintaining the viability of the Western Cape agricultural sector and the economy more broadly, and secondly mitigates against the potential loss of export markets to lower carbon producers elsewhere in the world.
2.4.3. Analysing GHG emissions per sector
Using the macro-economic model developed by the RRFM project to consider multiplier effects7, GHG emissions per sector were considered for the production of goods within the Western Cape. Figure 5 and Figure 6 on pages 14 and 15 indicate the relationships between sectors. In these diagrams, the thickness of each line is proportional to the size of the GHG emissions related to the sectors. It is important to note that these figures do not take into consideration imports and exports. For example, the significance of the mining sector is driven by its linkage to the electricity sector which is clearly driven by coal use. However, the coal and to some extent the electricity, is imported to the province. Thus, the mining sector, although of apparent significance in the diagrams, should not be interpreted as being a sector of significance in the Western Cape.
Figure 5 indicates that the transport sector is a significant contributor to energy-related GHG emissions, with strong linkages to the petroleum and real estate sectors. When contrasting the results of Figure 5 (which considers fuel emissions) and Figure 6 (which considers total emissions8), the impact of non-fuel GHG emissions is clearly shown to be concentrated in the agricultural sector. As agriculture is strongly linked to the food, beverages and tobacco sector, as well as the chemical products (e.g. fertiliser) and transport sectors, this suggests that these value chains are key areas to consider in the Western Cape.
2.5. Key conclusions from the economic analysis
The first phase macro-economic analysis highlighted the importance of the agriculture and agro-processing sectors of the Western Cape economy. It was significant in terms of GDP contributions, labour intensity, output multipliers and carbon intensity. Taking all these components together it was decided to focus on the agricultural component for the second phase of the project, as it would allow value chain analysis starting from a primary sector.
7 This refers Western Cape Social Accounting Matrix (SAM) analysis report which was described earlier in the report. 8 This includes emissions not linked to fuel use, such as emissions associated with livestock, fertiliser use, land use practices, etc.
RRFM 2014/15: Synthesis Report Page 14
Figure 5: Strength of emissions relationship using Western Cape SAM and scaled Eora9 multi regional input output energy emissions10
9 A group of indigenous people in Australia after which the MRIO system was named. 10 Source: RRFM economic report (Janse van Vuuren, 2015a, p. 34)
RRFM 2014/15: Synthesis Report Page 15
Figure 6: Strength of emissions relationship using Western Cape SAM and scaled Eora multi regional input output total emissions11
11 Source: RRFM economic report (Janse van Vuuren, 2015a, p. 13)
RRFM 2014/15: Synthesis Report Page 16
3. Assessing resource needs using a bottom-up approach
3.1. Overview of the provincial agriculture sector
Having identified the agricultural sector as an area of focus, the second phase of the project examined the resource intensity of key sub-sectors within agriculture, namely the grain, grape, fruit, livestock, dairy, ostrich and game sub-sectors. These sub-sectors contribute nearly 60% of agricultural production in terms of GDP, as shown in Figure 7. Vegetable farming was not considered within the timeframe of this project due to limited information.
Figure 7: Agricultural subsectors' contribution to agriculture in terms of GDP12
3.2. Grain analysis
The grain sector is highly complex as productivity and resource use can vary both temporally and geographically, even within homogenous farming areas. As a result there is a lack of high-level information regarding the total consumption of resources (e.g. the average land, water and energy use) and associated environmental impacts (e.g. contribution to climate change and eutrophication). Thus, the RRFM project focused on developing a method to provide bottom-up estimates, rather than assessing the sub-sector as a whole, in order to support the development of regional analyses and identification of intervention points for improvement in resource efficiency.
12 Calculations based on data from the Western Cape Social Accounting Matrix (DBSA, 2008).
Table Grape Farming
7%
Wine Grape Farming
11%
Other Fruit & Citrus Farming
15%
Vegetable Farming
10%Grain
(Cereal Farming)11%
Livestock Farming
16%
Ostrich & Game Farming
2%
Dairy Farming6%
Fishing3%
Other Agriculture19%
RRFM 2014/15: Synthesis Report Page 17
3.2.1. Analysing wheat using life cycle assessments
Over the last decade there has been a shift within companies, governments and global organisations to examine the environmental impact of products and services across the economy. Life cycle assessments provide a holistic view of a system and provide insight into the inputs, emissions and impacts associated with various stages of a value chain or life cycle of a product. As a result, they are useful in identifying resource intensity hotspots and potential interventions.
In this project, the feasibility and application of using life cycle assessments (LCAs) for a regional analysis was examined using wheat production as a case study. Wheat is a key grain in the province and encompasses 42 – 47% of Western Cape field crop production and land use (Stats SA, 2011).
LCAs are composed of four phases: goal and scope, inventory analysis, impact assessment and interpretation. A brief overview of how these phases were implemented is provided below, with further details provided in the grain sector report (Pineo, 2015a). A detailed methodology report has also been developed and is available on request post the outcome of formal LCA peer review process.
3.2.2. Goal and scope
LCAs were conducted for four representative wheat farms from the West Coast, covering a variety of production and farming practices (i.e. examining dry land and irrigated production systems and conventional and minimum tillage practices). Each LCA included two stages:
■ A pre-farm stage which provides an indication of indirect impacts: e.g. impacts associated with the production and transport of fertilisers to the farm.
■ An on-farm stage which provides an indication of the direct impacts associated with wheat production: e.g. impacts associated with GHG emissions from applied fertilisers and fuel combustion.
The West Coast region was selected as it encompasses areas which produce a significant portion of Western Cape wheat (i.e. Swartland). The representative wheat farms comprised of three Swartland-based farms that utilized dry land production (with differing rotation systems and farming practices) and one North West-based farm that utilized irrigated production. In terms of total planted area and tonnages produced, the study covers an estimated 53 - 56% of wheat production in West Coast district and 27 - 35% of wheat production in the province (Stats SA, 2011; DOA, 2013).
3.2.3. Inventory analysis
Detailed data on inputs for wheat production were primarily provided using commercial enterprise budgets (Combuds) from the Western Cape Government (WCG) Department of Agriculture (DOA), in conjunction with regional water footprints developed by the project13. Combuds are representative farming budgets that are publically available and have significant potential for regional analyses of resource use and environmental impact. This has been demonstrated in Australia, where similar farming budgets have been used to develop regional life cycle inventories (LCIs) for LCAs as a means of examining supply chains and supporting the primary producers (Grant, 2014). Knowledge sharing with researchers who developed these inventories from Australia contributed substantially to the approach and progress of the RRFM project work and was enabled by the presentation of a methodological paper at the New Zealand Life Cycle Assessment Conference in August 2014 (Pineo, et al., 2014).
3.2.4. Impact assessment
The potential impacts relating to climate change, terrestrial acidification, freshwater eutrophication and water depletion were examined and expressed per tonne of wheat (Pineo, 2015a). Climate change
13 Wheat water footprints were calculated using 2007 production data from the Stats SA Census of Commercial Agriculture (Stats SA, 2011) and the standardised assessment methodology provided by the Water Footprinting Network (Hoekstra, et al., 2011). These water footprints were used to estimate the freshwater required for irrigated wheat. Details are provided in the grain sector report (Pineo, 2015a).
RRFM 2014/15: Synthesis Report Page 18
impacts (i.e. change in global or regional climate patterns due to the increased levels of atmospheric carbon dioxide) were examined using global warming potentials, which use carbon dioxide equivalents (CO2e) as a proxy indicator. Terrestrial acidification impacts (i.e. increased deposition of acidifying compounds on land) were examined using acidification potentials, which use sulphur dioxide equivalents (SO2e) as a proxy indicator. Freshwater eutrophication (i.e. increased nutrient loads in freshwater systems such as rivers and lakes) were examined using acidification potentials, which use phosphorus equivalents (Pe) as a proxy indicator, while water depletion was measured in cubic metres of freshwater consumed (m3). The analysis also included an area component (i.e. impacts expressed per hectare). This last indicator was selected as it accounts for productivity and LCAs of Western Cape pork have suggested that the province may be internationally competitive when regional impacts (e.g. acidification and eutrophication) are expressed in relation to the land required for production (Devers, et al., 2012).
3.2.4.1. Comparison of LCAs
A summary of the impacts per tonne and per hectare of wheat is shown in Table 1. Please note that the results are considered to be in draft form and not cited until they have been externally reviewed and verified as part of the formal LCA peer review process.
Table 1: Potential impacts of Western Cape wheat production per tonne and per hectare14
Potential impact Functional
unit
Wheat LCA
Dry land
Minimum tillage
Dry land Conventional* Irrigated
Climate change
(kg CO2e)
Per tonne 330 420 – 550 2340
Per hectare 990 1050 – 1210 9360
Terrestrial acidification
(kg SO2e)
Per tonne 2.0 2.4 - 3.1 19.3
Per hectare 6.0 6.0 - 6.9 77
Freshwater eutrophication
(kg Pe)
Per tonne 0.6 0.8 - 0.9 0.5
Per hectare 1.9 2.0 - 2.1 2.1
Water depletion
(m3)
Per tonne 0.23 0.53 - 0.84 515**
Per hectare 0.65 1.26 - 1.75 1953***
*Results for the two dry land conventional wheat LCAs were similar and thus expressed as a range within the table. ** Sum of wheat irrigation consumption (510 m3/t) + water depletion from pre-farm stage (4.63 m3/t) ***Sum of wheat irrigation consumption (1940 m3/t) + water depletion from pre-farm stage (13.15 m3/t)
In terms of global benchmarking, the carbon intensities for wheat production lie within the range reported by other countries, such as Australia, New Zealand, Canada, USA, Denmark, France, Chile and Iran. Carbon intensities were reported as 270 – 790 kg CO2e per tonne of dry land wheat and 1070 - 4590 kg CO2e per tonne of irrigated wheat (see Table 3 in Pineo, 2015a).
3.2.4.2. Major contributing activities
The impact assessment also provided an indication of the major contributing activities for various impacts. This is indicated in Figure 8 for climate change (i.e. linked to carbon intensity of production) and indicates which impacts are indirect (pre-farm) and direct (on-farm). This can provide direction to
14 Details provided in the grain sector report (Pineo, 2015a).
RRFM 2014/15: Synthesis Report Page 19
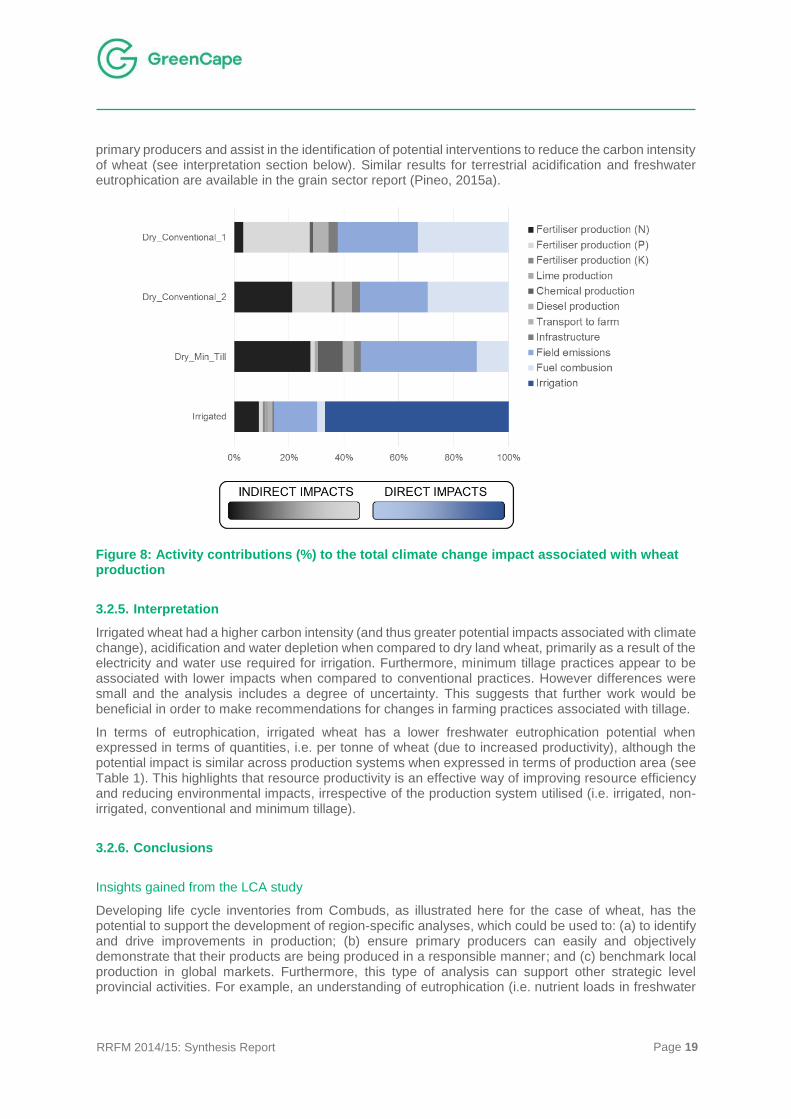
primary producers and assist in the identification of potential interventions to reduce the carbon intensity of wheat (see interpretation section below). Similar results for terrestrial acidification and freshwater eutrophication are available in the grain sector report (Pineo, 2015a).
Figure 8: Activity contributions (%) to the total climate change impact associated with wheat production
3.2.5. Interpretation
Irrigated wheat had a higher carbon intensity (and thus greater potential impacts associated with climate change), acidification and water depletion when compared to dry land wheat, primarily as a result of the electricity and water use required for irrigation. Furthermore, minimum tillage practices appear to be associated with lower impacts when compared to conventional practices. However differences were small and the analysis includes a degree of uncertainty. This suggests that further work would be beneficial in order to make recommendations for changes in farming practices associated with tillage.
In terms of eutrophication, irrigated wheat has a lower freshwater eutrophication potential when expressed in terms of quantities, i.e. per tonne of wheat (due to increased productivity), although the potential impact is similar across production systems when expressed in terms of production area (see Table 1). This highlights that resource productivity is an effective way of improving resource efficiency and reducing environmental impacts, irrespective of the production system utilised (i.e. irrigated, non-irrigated, conventional and minimum tillage).
3.2.6. Conclusions
Insights gained from the LCA study
Developing life cycle inventories from Combuds, as illustrated here for the case of wheat, has the potential to support the development of region-specific analyses, which could be used to: (a) to identify and drive improvements in production; (b) ensure primary producers can easily and objectively demonstrate that their products are being produced in a responsible manner; and (c) benchmark local production in global markets. Furthermore, this type of analysis can support other strategic level provincial activities. For example, an understanding of eutrophication (i.e. nutrient loads in freshwater
RRFM 2014/15: Synthesis Report Page 20
systems) for various regions and production systems can be used to identify potential hotspots within the Berg River management area and so contribute to the provincial Berg River Improvement Plan.
Although this study indicated that Combuds could be useful in the development of LCAs to examine the benefits of different production and farming practices, a sensitivity analysis highlighted several issues with the availability and quality of the Combud data (details on the analysis is provided in the grain sector report; Pineo 2015a). This included a lack of transparency and sufficient detail regarding fertiliser and other chemical inputs, as well as the lack of data for machinery and energy use. As a result, GreenCape will continue to communicate with DOA as it re-establishes this division to ensure that the work done can support the information needs of the wider community as best possible.
GHG emission benchmark for the grain sector
The LCAs provided GHG emission estimates for dry land and irrigated wheat. Assuming the carbon intensity is similar for wheat produced across the province and is similar to the carbon intensity of other grain crops, a crude GHG emission benchmark was provided using these LCA estimates. The GHG emission benchmark for the Western Cape grain sector is currently 820-1180 Gg CO2e per annum. Details are provided in the grain sector report (Pineo, 2015a). In the future, incorporating LCAs or carbon footprints done for other wheat production regions in the Western Cape and for other grain crops will improve the accuracy of the estimate and is recommended for updating the benchmarks.
3.3. Wine grapes analysis15
South Africa’s wine industry is a key player in the global industry; 60% of South African wine is exported and comprises of 4% of the world’s wine (van Niekerk, 2014). The Western Cape produces 95% of South African wine16 (SAWIS, 2014) and the industry is an important source of employment in the province, accounting for 8.8% of total employment as well as 2.2% nationally (Conningarth Economists, 2009). This is reflected in its financial share of the agriculture and the food, beverage and tobacco sectors (Figure 7 and Figure 12). The sector has also seen growth, with turnover increasing by 38% from 2008 - 2013 (Conningrath Economists, 2015). This clearly makes it a key sub-sector of agriculture to consider.
3.3.1. Benchmarking the carbon footprint of wine
The wine industry has been on the forefront of sustainability in many aspects, including the uptake of sustainability auditing processes and eco-labelling. This has been done through the Integrated Production of Wine (IPW), a voluntary environmental sustainability scheme established by the South African wine industry in 1998. The industry is seeing increasing participation in the carbon footprint tool developed by Confronting Climate Change (CCC), driven in part by international retailers’ growing emphasis on sustainability issues. Likewise, participation also results in higher IPW scores. CCC released national benchmark reports (Confronting Climate Change, 2014a) based on individual carbon footprints calculated over two years. The reports have been used to provide an indication of the provincial carbon intensity of the wine sector and a comparison done with international information for benchmarking as shown in Figure 9.
15 Wine grapes are considered in isolation in Janse van Vuuren (2015b) as wine grapes feed into the wine beverage sector of the SAM, as shown in Figure 12. While the production and value of table grapes is significant, they are associated with similar agro-processing to other fruit and are thus considered as part of the other fruit analysis (Janse van Vuuren, 2015c). 16 According to hectares and excluding Sultana, with 4.67% being in the Northern Cape.
RRFM 2014/15: Synthesis Report Page 21
Figure 9: Comparison of international and Western Cape carbon footprints17
The results are positive at the farming level, as the Western Cape farming sector is within the lower range18 of global carbon footprints. Although there is no consideration of vineyard establishment in the CCC carbon footprints (as LCA best-practice would suggest), they do account for productive and non-productive hectares. However, given that the carbon footprints are voluntary, and may well be done by those with good energy management and/or efficiency practices, the results may not be broadly representative across the sector. It is however important to note that with regard to the agro-processing elements (i.e. wine processing and bottling), South Africa does not compare as favourably to international benchmarks.
3.3.2. Major contributing activities
Based on CCC’s industry reports in conjunction with a wider literature review a number of key activities contributing to the carbon footprints of production are identified at different stages of production
3.3.2.1. Farming
One of the key drivers of wine grape carbon footprints is irrigation (as was the case for wheat production discussed earlier). A key driver of increased efficiency is the threat of water shortages with some catchments under stress already and water rights to agriculture being restricted. The drive for efficiency has been significant, shown by an uptake of drip irrigation as well as the development of innovative tools that make use of satellite imagery to increase water use efficiency. (For more details see Janse van Vuuren (2015b))
17 Reference: Wine sector report (Janse van Vuuren, 2015b, p. 9) 18 It is noteworthy that the farming sector indicated here excludes establishment of the vineyard.
RRFM 2014/15: Synthesis Report Page 22
Another key driver of wine grape carbon footprints is herbicide and pesticide use, as the drive for uniform wines resulted in decreased genetic variation as artificial propagation is the norm. This inhibited the evolution that would allow natural resistance to develop, making vineyards more reliant of herbicides and pesticides. Although organic farming, which do not use synthetic herbicides and pesticides, have been shown to have lower potential environmental impacts per hectare, the higher yields obtained using conventional techniques have shown that the practises are similar in terms of the carbon footprints per tonne of grapes.
Additionally, intelligent use of cover crops have been shown to reduce weeds that require chemical control as well increasing soil organic matter, in some instances removing the need for nitrogen fertiliser completely.
All of the above suggest that, as was the case for wheat, farming practices can have a significant impact on resource use and carbon emissions. In order to make recommendations for changes in farming practices more detailed work to examine these systems would be beneficial as this analysis is a meta-analysis only. However, the fact that there is such large variability in carbon footprints, resulting from a data set which is already expected to reflect the better achieving farms due to the voluntary nature of CCC’s carbon footprints, suggests there could be significant room to for improvement - both to retain the economic viability of the industry and its competitiveness internationally.
3.3.2.2. Processing
While wine grapes were in the lower range of estimated carbon footprints, winery carbon footprints were in the upper range, with some observations for processing being higher than the range of international studies’ results. One of the key drivers of South Africa’s emissions is the high carbon intensity of the grid electricity. The largest energy requirements for a winery is for cooling, with significant demand arising from pumping and lighting activities. Coupled with the high cost of energy this has already driven some farms to implement alternative renewable energy systems such as installing rooftop photovoltaics.
There have been studies to consider anaerobic digestion (AD) of winery wastes and waste waters to manage the wastes and generate energy. These found that the found that the carbon content may be too high which could result in an unattractive environment for the required reactions. However, co-mingling with other waste streams (e.g. nitrogen rich manure) is an area for consideration.
Winery waste water has high organic concentration and pollution loads19 that can be detrimental if it enters rivers or reaches the water table. Other studies are considering the bio-remediation of these waters and the potential for key valuable chemicals to be extracted from the wastewater. Organic chemicals are already being extracted from some winery wastes. These types of initiatives, although not directly contributing to reducing the carbon footprint of the wine value chain, have potential for value add to the wine supply chain, sustaining its viability and potentially increasing the GDP for this sector as a whole.
3.3.2.3. Bottling
Within the wine value chain, the component with the highest intensity is bottling driven to a large extent by the packaging materials, with glass production requiring high temperatures and thus energy. There have been drives to use alternative packaging with lower quality products packed in plastic bottles, although the perception of lower quality of alternatively packaged wine has limited uptake of non-glass packaging. This also suggests that decarbonisation of the energy mix for bottling activities is a key area for the improvement of the carbon footprint of South African wines. This could be an area of collaboration between the wine industry and the major bottle manufacturers.
19 Common inorganic pollutants are Phosphorus, Sodium, Potassium and sometimes Boron (Mulidzi, 2006)
RRFM 2014/15: Synthesis Report Page 23
3.3.3. Key conclusions for wine
Overall, the South African wine production seems to have a larger carbon footprint than its international competitors. This is especially true if additional emissions from transport to international markets are added in as well. As the farming component is actually within the lower range, this seems to be driven largely by the carbon intensity of the South African energy mix. If international consumers of wine demand low carbon wine, more wineries will switch to alternative energy sources and possibly alternatively packaged products.
It is noteworthy that carbon-conscious wine sellers, especially those that wish to establish their own labels (e.g. major overseas wholesalers and retailers) may drive the bulk export of unbottled wine. This is of potential benefit for South Africa in terms of the overall carbon footprint of its wines, however, this could have significant knock on the bottle production and wine bottling industries, resulting in job losses and loss of value add for the Western Cape. The relative merits / trade-offs of bulk export and bottling require consideration with due understanding that this may or may not be of relevance to wines which target different markets. An evidence base is required for any strategies to suggest particular shifts of practices if the goal is to grow the wine sub-sector in a labour absorptive manner.
3.4. Other fruit analysis
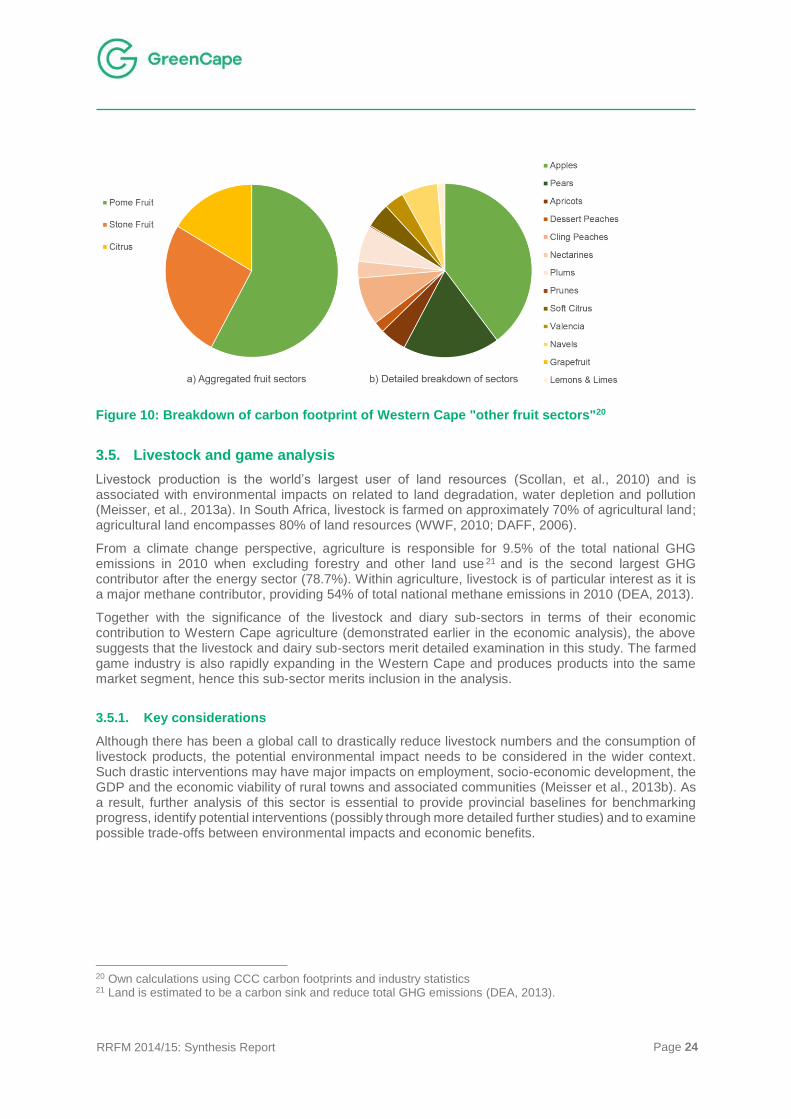
As part of the bottom-up analysis, GHG emissions estimates for fruit farming sub-sectors (including wine grapes, table grapes, pome fruit, stone fruit and citrus) was done using CCC industry reports (Confronting Climate Change, 2014a-d). The carbon footprint data was aggregated to provide a Western Cape average and then the first and third quartile results were used to provide an estimated range of carbon intensities per fruit type. To validate and update the sector benchmarks provided by the top-down analysis, industry production figures were used to get total GHG emissions estimates per fruit sub-sector (Janse van Vuuren, 2015b-c).
3.4.1. GHG emission benchmarks for the fruit sectors
The total GHG emission estimates for the fruit sectors are as follows: 285-460 Gg CO2e per annum for wine grapes, 62-140 Gg CO2e per annum for table grapes and 250-470 Gg CO2e per annum for other fruit. At a provincial level, when not considering grapes, the carbon footprint of the pome fruit sub-sector clearly dominates, with the citrus and stone fruit having similar shares, as shown in Figure 10 overleaf. Details of this analysis is available in the report (Janse van Vuuren, 2015cc).
3.4.2. Key conclusions
When considering the contributions to carbon footprints, the packaging material was significant, as seen in the wine analysis for bottling. As packing requirements varied between fruit types, harder fruits, which require less packaging, have lower carbon footprints. When considering the entire value chain, transport costs dominated, especially when air travel was used.
As with wine grapes, the consideration of establishment inputs need to be taken into consideration to align with best practice in terms of reporting on carbon footprints. Additionally, the variation within fruit was shown to be significant as, for example, water needs have been shown to differ between cultivars of apples by a factor of three (Gush & Taylor, 2014, p. 35), and this is expected to be the case across other fruit types and other inputs as well
RRFM 2014/15: Synthesis Report Page 24
Figure 10: Breakdown of carbon footprint of Western Cape "other fruit sectors"20
3.5. Livestock and game analysis
Livestock production is the world’s largest user of land resources (Scollan, et al., 2010) and is associated with environmental impacts on related to land degradation, water depletion and pollution (Meisser, et al., 2013a). In South Africa, livestock is farmed on approximately 70% of agricultural land; agricultural land encompasses 80% of land resources (WWF, 2010; DAFF, 2006).
From a climate change perspective, agriculture is responsible for 9.5% of the total national GHG emissions in 2010 when excluding forestry and other land use 21 and is the second largest GHG contributor after the energy sector (78.7%). Within agriculture, livestock is of particular interest as it is a major methane contributor, providing 54% of total national methane emissions in 2010 (DEA, 2013).
Together with the significance of the livestock and diary sub-sectors in terms of their economic contribution to Western Cape agriculture (demonstrated earlier in the economic analysis), the above suggests that the livestock and dairy sub-sectors merit detailed examination in this study. The farmed game industry is also rapidly expanding in the Western Cape and produces products into the same market segment, hence this sub-sector merits inclusion in the analysis.
3.5.1. Key considerations
Although there has been a global call to drastically reduce livestock numbers and the consumption of livestock products, the potential environmental impact needs to be considered in the wider context. Such drastic interventions may have major impacts on employment, socio-economic development, the GDP and the economic viability of rural towns and associated communities (Meisser et al., 2013b). As a result, further analysis of this sector is essential to provide provincial baselines for benchmarking progress, identify potential interventions (possibly through more detailed further studies) and to examine possible trade-offs between environmental impacts and economic benefits.
20 Own calculations using CCC carbon footprints and industry statistics 21 Land is estimated to be a carbon sink and reduce total GHG emissions (DEA, 2013).
RRFM 2014/15: Synthesis Report Page 25
3.5.2. Key insights and conclusions
3.5.2.1. GHG emission benchmark for the livestock and game sectors
This analysis provided the total direct GHG emissions for three animal production sub-sectors in the Western Cape and South Africa; namely the livestock, dairy and ostrich and game sub-sectors (see Table 2 overleaf). The analysis specifically focused on the direct methane and nitrous oxide emissions from enteric digestion processes and manure management, and was based on the national GHG inventories developed for beef and dairy cattle, small stock (i.e. sheep and goats), monogastric livestock (i.e. pigs, horses, chickens and ostriches) and game (du Toit et al., 2013a-d respectively).
The total direct GHG emissions contributed by animal production in the Western Cape is 2320 Gg CO2e per year, with livestock, dairy and ostrich and game contributing with 1400 Gg, 780 Gg and 140 Gg CO2e per year respectively. Detailed values for Western Cape GHG emissions per livestock category (cattle, sheep, poultry, etc.), animal type (e.g. Merino, other wool, non-wool and Karakul sheep) and production system (e.g. commercial and communal) are available in the report (Pineo, 2015b).
When considering the proportional contributions from the animal production sub-sectors, the province has a profile that differs from that for South Africa as a whole. This is highlighted in Figure 11 on page 21 (Pineo, 2015b). The GHG emissions from the Western Cape sub-sectors are largely related to cattle (similar to the national profile), although the share from dairy cattle is more significant. Furthermore the ostrich sector makes up a significantly larger proportion of total GHG emissions (as the majority of ostrich farming occurs in the Western Cape), while game farming is less significant, highlighting different focus areas for national and provincial strategies.
3.5.2.2. Relative carbon intensity of products
Although the project provided a carbon-intensity baseline for the province for animal production sectors in terms of total emissions of each sector for a baseline year, it is important to note that expressing the GHG emissions relative to production (kg CO2e per kg of wool, meat etc.) or to contribution to the provincial GDP (kg CO2e per GDP contribution from wool, meat, etc.) is a better measure of productivity and provides information that may assist policy-makers in developing mitigation strategies. This is discussed in the detailed report on livestock, dairy and game (Pineo, 2015b) and the need to consider the entire value chain from production to consumption of agricultural products is emphasised.
Furthermore, the report provides a summary of the carbon intensity and environmental impacts associated with the commercial production of pork and milk in the Western Cape (Notten & Mason-Jones, 2011; Devers, et al., 2012) and outlines the resource-based information available to support a meta-analysis for agro-processing related to animal production, in order to examine trade-offs between value-add, job creation and environmental impacts for growth in these different sub-sectors.
RRFM 2014/15: Synthesis Report Page 26
Table 2: Summary of the total direct GHG emissions (in Giga grams CO2 equivalents per year) emitted from animal production systems in the Western Cape and South Africa.
Agricultural sector
Animal Type
GHG emissions 1
(Gg CO2e / year)
Western Cape South Africa
Dairy Cattle 2 Dairy 777 3091
Goat 2 Milk 1.1 4.0
TOTAL 779 3094
Livestock
Cattle 2 Beef 813 19236
Sheep 2
Merino 205 1872
Other wool 91 830
Non-wool 123 1127
Karakul 0.41 4.6
Goats 2 Meat-type 31 865
Angora 0.78 67
Pigs 2 - 32 932
Other livestock
Donkeys 3 - 35
Mules 3 - 3.3
Horses 2 19 137
Chickens 2 Broilers 82 796
Layers 5.0 52
Other poultry 3
Ducks - 0.32
Geese - 0.12
Turkeys - 1.2
TOTAL 1403 25959
Ostrich & Game
Ostriches 2 - 110 184
Game 4
Grazers 17 -
Mixed feeders 7.4 -
Browsers 0.92 -
Total 26 3034
TOTAL 136 3218
1 The GHG emissions include direct enteric methane emissions, as well as direct methane and nitrous oxide emissions from manure (where relevant). The IPCC 100 year GWPs for methane and nitrous oxide were used (IPCC, 2001) in order to compare totals with the top-down estimates. GHG emissions using updated GWPs are available on request. 2 GHG emissions calculated using 2010 population data (du Toit et al., 2013a-c). 3 GHG emissions calculated using FAO national data (du Toit et al., 2013c). 4 GHG emissions calculated from the estimated large stock units (LSU) per province, using surface area data from 2000. Land area used for game farming has not changed significantly between 2000 and 2010 (du Toit et al., 2013d).
RRFM 2014/15: Synthesis Report Page 27
Figure 11: Proportion of GHG emissions from different animal production sub-sectors for the Western Cape (outer circle) and South Africa (inner circle) based on GHG inventory data from 201022
3.6. Consolidation of bottom-up carbon footprints for agricultural sectors
Bottom-up carbon footprints for the grain, fruit (wine grapes, table grapes, pome fruit, stone fruit and citrus), livestock, dairy and ostrich/game sectors have been provided by the analyses described in this report. The final phase of this work is to obtain estimates of all the other for the agricultural sectors as broken down in the Western Cape SAM (see Figure 7). This is further work to be undertaking in 2015/2016 should funding for this continuation be secured.
22 The total direct GHG emissions was calculated based on provincial methane and nitrous oxide emissions provided by du Toit et al. (2013a-d) using the IPCC GWP values for a 100 year time-frame (IPCC, 2001), as done in the national GHG inventory (DEA, 2013).
RRFM 2014/15: Synthesis Report Page 28
4. Conclusions and recommendations
4.1. Significance of the work done to date
The project has successfully demonstrated approaches to analyse the carbon and resource intensity of the provincial economy. This included:
■ An analysis of the provincial economy at a macro-economic level using a Western Cape Social Accounting Matrix.
■ An analysis of the carbon intensity of key agricultural sub-sectors using carbon footprinting.
■ An analysis of resource intensity and environmental impacts of wheat, demonstrating the feasibility of using water footprinting and life cycle assessments to examine key agricultural products.
The outcomes of these analyses include an indication of labour, output and GHG emissions multipliers for Western Cape sectors, as well as defendable GHG emission benchmarks for several agricultural sectors (specifically grain, wine, fruit and livestock/game), with key areas for intervention highlighted.
4.2. Key considerations
The large variation within agriculture has shown that more refined work is required to consider regional variation and individual characteristics (such as different fruit cultivars, etc.). Specifically, key export products, such as wine, seem unable to compete globally in terms of carbon footprints, especially when processing is included. Results indicate that this is driven by the high carbon intensity of South Africa’s energy mix, which could provide a motivation for increased carbon efficiency measures (e.g. improved energy efficiency and utilisation of low-carbon renewable energy).
4.3. Follow up work for consideration by Western Cape Government
The wheat LCAs demonstrated that the Combuds produced by the DOA were useful for regional analyses. However improvements in the detail and transparency of the Combuds is required to unlock this potential, with details provided in the grain sector report (Pineo, 2015a).
Combuds could be used to development regional life cycle inventories, as done in countries such as USA and Australia. These inventories provide underlying information to a variety of stakeholders and has several strategic benefits (ALCAS, 2013; Grant, 2014). These benefits include: Supporting agri-businesses and industries:
■ Identify and drive improvements in production by providing a better understanding of the inefficiencies and impacts related to farming systems.
■ Provide an evidence base for the benefits of various production systems and farming practices, such as conservation farming.
■ Improve competitiveness by enabling local producers to gain access to international markets that require primary producers to demonstrate that their products are being produced in an environmentally responsible manner.
■ Provide a centralised source of data to assist research organisations and industry bodies in terms of the time and money required to collect data and conduct LCAs.
■ Provides intensity and impact benchmarks for key commodities and sub-sectors.
There is however currently no body with a mandate or funding to provide the framework for a database to develop. This presents an opportunity for a private of public body to step into this space.
RRFM 2014/15: Synthesis Report Page 29
4.4. Future work for the RRFM project (2015/16)
Building on this analysis, it is proposed that phase three of the RRFM project (2015/2016) focus on key value chains within agro-processing and highlight resource use, constraints and possible economic and environmental trade-offs within key sub-sectors.
The macro-economic model23 provides limited breakdown of the agro-processing sector as shown in Figure 12. While not greatly disaggregated, Figure 12 highlights the significance of: (a) the meat, fish, fruit, vegetable, oil and fat products; (b) the grain mill, bakery and animal feed products; and (c) wine, all of which are associated with the sub-sectors examined in phase two (2014/2015) of this this project.
Figure 12: Agro-processing breakdown from macro-economic analysis24
The significance of wine in particular has been emphasised in work done by Conningrath Economists (2015), which highlighted that the wine industry’s turnover increased by 37.5% from 2008 to 2013. Thus the sub-sector is not only significant, but is also growing.
Grain mill, bakery and animal feed products are significant in terms of local consumption. Furthermore, animal feed is responsible for a significant portion of indirect environmental impacts related to livestock production and thus examining the composition and processing of feed may be important for the reduction of the carbon and water intensity associated with meat and dairy-based products.
The meat, fish, fruit, vegetable, oil and fat products still makes up the dominant share and needs to be unpacked more to get a better understanding of the important sub-sectors. This reiterates the importance of analysing agriculture at a sub-sector level, as has been done in phase 2 of the work reported here, to provides a solid foundation for the analysis of these value chains within agro-processing.
Unpacking this sector could be done using data from National Cleaner Production Centre’s Resource Efficiency and Cleaner Production (RECP) audits. The project is working in collaboration with the NCPC to examine the data and its application.
23 Western Cape Social Accounting Matrix (DBSA, 2006)
Meat, Fish, Fruit, Vegetables, Oil &
Fat Products73%
Dairy Products4%
Grain Mill, Bakery & Animal Feed
8%
Other Food Products
2%
Wine8%
Other Beverages & Tobacco5%
RRFM 2014/15: Synthesis Report Page 30
5. References Confronting Climate Change, 2014a. Industry Level Trends report: Year 2 - 2013 Carbon footprint
results for the CCC South African fruit and wine sample group. [Online] Available at: http://www.climatefruitandwine.co.za/Documents/CCC_Industry%20Level%20Trends%20Report_2013.pdf [Accessed 25 February 2015].
Confronting Climate Change, 2014b. Stone fruit Industry Report - Year 2: 2013 Carbon footprint benchmark report. [Online] Available at: http://www.climatefruitandwine.co.za/Documents/CCC_Stone%20fruit%20Industry%20Report_2013.pdf [Accessed February 25 2015].
Confronting Climate Change, 2014c. Table Grape Industry Report - Year 2: 2013 Carbon footprint benchmark report. [Online] Available at: http://www.climatefruitandwine.co.za/Documents/CCC_Table%20Grape%20Industry%20Report_2013.pdf [Accessed 25 February 2015].
Confronting Climate Change, 2014d. Pome fruit Industry Report - Year 2: 2013 Carbon footprint benchmark report. [Online] Available at: http://www.climatefruitandwine.co.za/Documents/CCC_Pome%20fruit%20Industry%20Report_2013.pdf [Accessed 25 February 2015].
Conningarth Economists, 2009. Macro-economic Impact of the Wine Industry on the South African Economy (also with reference to the Impacts on the Western Cape). [Online] Available at: http://www.sawis.co.za/info/macro_study2009.php [Accessed 8 December 2014].
Conningrath Economists, 2015. Macro-economic Impact of the Wine Industry on the South African Economy (also with reference to the Impacts on the Western Cape). [Online] Available at: http://www.sawis.co.za/info/download/Macro-economic_impact_study_-_Final_Report_Version_4_30Jan2015.pdf [Accessed 19 February 2015].
DAFF, 2006. Livestock Development Strategy for South Africa 2006-2015. Investing in the potential of the livestock sector resource base for lasting animal agriculture, s.l.: s.n.
DBSA, 2006. Development Bank of Southern Africa: Social Accounting Matrices (SAMs). [Online] Available at: http://www.dbsa.org/EN/DBSA-Operations/Proj/Tools/Pages/SAMS.aspx [Accessed 26 June 2014].
DBSA, 2008. Development Bank of Southern Africa: Social Accounting Matrices (SAMs). [Online] Available at: http://www.dbsa.org/EN/DBSA-Operations/Proj/Tools/Pages/SAMS.aspx [Accessed 26 June 2014].
DEA, 2013. GHG National Inventory Report, South Africa, 2000 - 2010, Pretoria, South Africa: Department of Environmental Affairs.
Devers, L., Kleynhans, T. & Mathijs, E., 2012. Comparitive life cycle assessment of Flemish and Western Cape pork production. Agrekon: Agricultural Economics Research, Policy and Practise in Southern Africa, 51(4), pp. 105-128.
du Toit, C., Meissner, H. & van Niekerk, W., 2013d. Direct greenhouse gas emissions of the game industry in South Africa. South African Journal of Animal Science, 43(3), pp. 376-393.
du Toit, C., van Niekerk, W. & Meissner, H., 2013a. Direct methane and nitrous oxide emissions of South African dairy and beef cattle. South African Journal of Animal Science, 43(4), pp. 320-339.
du Toit, C., van Niekerk, W. & Meissner, H., 2013b. Direct greenhouse gas emissions of the South African small stock sectors. South African Journal of Animal Science, 43(3), pp. 340-361.
RRFM 2014/15: Synthesis Report Page 31
du Toit, C., van Niekerk, W. & Meissner, H., 2013c. Direct methane and nitrous oxide emissions of monogastric livestock in South Africa. South African Journal of Animal Science, 43(3), pp. 362-375.
Grant, T. C. H. E. S. a. M. G., 2014. AusAgLCI methodology for developing Life Cycle Inventory, Australia: Rural Industries Research and Development Corporation (RIRDC).
Gush, M. B. & Taylor, N. J., 2014. The water use of selected fruit tree orchards (Volume 2): Technical report on measurements and modelling. WRC Report No. 1770/2/14.
IPCC, 2007. Climate Change 2007: Synthesis Report. A Contribution of Working Groups I, II, and III to the Fourth Assessment Report of the Intergovernmental Panel on Climate Change (IPCC)., Geneva, Switzerland: IPCC.
Janse van Vuuren, P. F., 2015a. Regional Resource Flow Model: Social Accounting Matrix Analysis,
Cape Town: GreenCape. Janse van Vuuren, P. F., 2015b. Regional Resource Flow Model: Wine Sector Report, Cape Town:
GreenCape. Janse van Vuuren, P. F., 2015c. Regional Resource Flow Model: Fruit Sector Report, 2015:
GreenCape. Meisser, H., Scholtz, M. & Palmer, A., 2013a. Sustainability of the South African livestock sector
toward 2050 - Part 1: Worth and impact of the sector. S. Afr. J. Anim. Sci., 43(3), pp. 283-297. Ministry of Economic Opportunities, 2014. Report on the first phase, October-December 2014: Setting
the baseline, focusing our efforts, and defining roadmaps for growth, Cape Town: Ministry of Economic Opportunities, Western Cape Government.
Mulidzi, A. R., 2006. Determining the pollution extent of organic components of winery effluent on irrigated sites, http://www.sawislibrary.co.za/dbtw-wpd/exec/dbtwpub.dll?TN=Publications&RF=WebProjects&BU=http://www.sawislibrary.co.za/textbase/winetech_search.htm&AC=QBE_QUERY&MR=&RF=WebProjects&QY=find%20%22project%20No%22=WW%2019-06: Winetech: WW 19-06.
Notten, P. & Mason-Jones, K., 2011. Life Cycle Assessment of Milk Production in the Western Cape,
Cape Town: The Green House. Partridge, A., Cloete-Beets, L. & Barends, V., 2014. The Real Cost of a Carbon Tax: Estimating the
Impact of South Africa's Carbon Tax with an Applicatino to the Agricultural Sector of the Western Cape. [Online] Available at: http://www.bfap.co.za/images/documents/academic/Partridge_Cloete-Beets_Barends_The%20Real%20Cost%20of%20a%20Carbon%20Tax_AEASA.pdf [Accessed 24 February 2015].
GreenCape. Pineo, C., Janse van Vuuren, P. F., Basson, L. & Petrie, J., 2014. Western Cape Regional Resource
Flow Model: Using a Life Cycle Assessment approach to analyse resource intensity of the agricultural sector. Wellington, New Zealand Life Cycle Assessment Conference 2014.
SAWIS, 2014. South African Wine Industry Statistics. Issue 38. Scollan, N., Moran, D., Joong Kim, E. & Thomas, C., 2010. The Environmental Impact of Meat
Production Systems, s.l.: Report to the International Meat Secretariat, 2 July 2010. Statistics South Africa, 2007. Nesstar. [Online]
Available at: http://interactive.statssa.gov.za:8282/webview/ [Accessed 3 September 2014].
Statistics South Africa, 2015. Quarterly Labour Force Survey: Quater 4, 2014. [Online] Available at: http://beta2.statssa.gov.za/publications/P0211/P02114thQuarter2014.pdf [Accessed 24 February 2015].
van Niekerk, P., 2014. Level Playing Fields? The International Wine Market. Wineland, Volume November, p. 80.
RRFM 2014/15: Synthesis Report Page 32
WCG, 2013. Green Is Smart – Western Cape Green Economy Strategy Framework, Cape Town. [Online] Available at: http://www.elsenburg.com/press/2014/green_is_smart-4th_july_2013_for_web.pdf [Accessed 23 February 2015].
WCG, 2014. Western Cape Government: Western Cape Climate Change Response Strategy. [Online] Available at: http://www.elsenburg.com/trd/globalwarm/downloads/WCCCRS%20FINAL%2021022014.pdf [Accessed 24 February 2015].
WCG, 2015. The Western Cape Government's Provincial Strategic Goals. [Online] Available at: https://www.westerncape.gov.za/general-publication/western-cape-governments-provincial-strategic-goals [Accessed 20 03 2015].
Western Cape Government Provincial Treasury, 2013. Provincial Economic Review & Outlook 2012 (PERO). Cape Town: s.n.
WWF, 2010. WWF, 2010. Agriculture in South Africa: Facts and Trends., Stellenbosch: World Wildlife Fund.