15
DRAFT Regional Shift-Share Analysis Identifying Engines for Economic Growth

DRAFT
Regional Shift-Share Analysis
Identifying Engines for Economic Growth

Prepared By:
Department of Business Intelligence
November 2016

Overview
The process of identifying the comparative and competitive advantages of various industry sectors
within a regional economy is an essential step in crafting effective economic development strategies.
To identify strategic industries which have strong implications for future economic growth, the
Department of Business Intelligence utilizes a regional analysis methodology known as shift-share. Shift-
share analysis is the process of examining a regional economy while considering both national growth
trends across all industries and national growth trends related to a specific industry. The theory behind
this methodology is similar to location quotients in that it highlights the unique industries within a
regional economy. However, it explains the specialization of these industries in terms of job growth
rather than total jobs.
In the analysis that follows, Business Intelligence examines the industry clusters defined by the Reinvent
Hampton Roads: Industry Cluster Mapping Project. These industries play a fundamental role in the
strength and resilience of our community and have the ability to enhance the business environment
from which they operate. As such, with the appropriate resources and encouragement, these industries
can provide accelerated opportunities of growth and innovation within Hampton Roads.
When attempting to define industry movements within a regional economy, it is important to consider
the movements within the national economy and understand how those movements may be influencing
local industry growth. For example, if the national economy is performing well collectively, one could
theorize that industries within local communities are experiencing growth as well. Shift-share analysis
incorporates national growth trends into the equation and adjusts employment accordingly. This is
known as the National Growth Effect.
Similar to the national growth effect, the Industrial Mix Effect represents how much of the industry’s
regional growth can be attributed to the growth of the industry on the national level. Both of these
effects are an important step in the computation of shift-share analysis and represent macroeconomic
forces that, unless drawn out, can overemphasize unique regional employment growth. By identifying
the two national forces that may influence regional industry growth, we can draw a more realistic
conclusion about how well an industry has performed or will perform over a specified timeline.

The summation of the national growth effect and the industrial mix effect is what we would anticipate
the increase or decrease to be within a particular industry due to the national trends. This summation is
known as the Expected Change. The expected change serves as the baseline from which we compare
the actual or forecasted job change over the defined time period.
If a regions job change was greater than the expected job change, the region is experiencing a
Competitive Effect or Local Effect. A positive competitive effect indicates that the regional industry is
outperforming national trends. In other words, the competitive effect explains how much of the change
in employment in a given industry is due to some unique regional characteristic.
Note: It is important to highlight that employment within an industry over a defined time period
may be forecasted to decline both nationally and regionally; for example, industries within
Advanced Manufacturing. While a decrease in employment is not generally viewed
enthusiastically, it is important to understand that if an industry maintains a lower percent
decrease in employment within the region compared to the nation, the industry’s relative
concentration would increase and show a positive competitive effect.
Shift-share analysis, along with employment growth projections, can prove to be a powerful regional
planning methodology. This process can identify investment targets so that local stakeholders can help
high-performing regional industries continue to outperform national trends or “catch up” with national
trends so that the regional economy is not left behind in those sectors.
Within the analysis to follow, individual industries have been extracted from within each industry
cluster. The industries displayed have been analyzed at a 6-digit NAICS level and are forecasted to either
maintain positive competitive positioning within the region or underperform national growth within the
region over the next ten years (2016-2026). It is important to note that the shift-share projections are
drawn from historical data. As with any forecasted data, the shift-share data is operating under the
assumption that what has happened in the past will continue into the future.
Additionally, there exist limitations and shortcomings of the capabilities within shift-share analysis.
Before drawing any conclusions, it is important to recognize that shift-share analysis is a descriptive
model by which practitioners can use inductive reasoning to direct targeting efforts in a particular
direction. By focusing attention on the strengths and weaknesses that exist within a region’s economic
base; practitioners are able to draw more appropriate conclusions about the industrial needs and
requirements that may exist within the region of Hampton Roads.

Analysis
Before conducting granular community analysis, it is important to identify the projected growth rates
and competitive effects from a regional macroeconomic perspective. By charting the various effects for
each broad cluster on a regional level, we can understand how the cluster is forecasted to perform after
extracting the forecasted national growth trends.
The chart below depicts the relative strength in each defined industry cluster on a regional level.
Additionally, to break out sub-regional cluster strengths, the Southside and the Peninsula have been
highlighted. “Strength” in this context is shaded in green and shows the industry clusters that are
projected to experience both a positive percent growth rate from 2016 to 2026 & a positive competitive
effect over the same time period. Clusters highlighted in yellow are projected to maintain positive
growth from 2016 to 2026 but this growth is to a lesser degree than that of national trends; therefore,
the cluster holds a negative competitive effect. Clusters shaded in red indicate that the industry cluster
is projected to underperform national growth rates and hold a negative competitive effect.
Cluster Regional Southside Peninsula
Advanced Manufacturing
Aerospace, Aviation & Defense
Bio-Science & Bio-Medical
Business & Financial Services
Cross Cutting Industries
Maritime, Distribution & Logistics
Food Processing
Info, Analytics, & Security
As we can see in the first shaded column, 63% of the defined industry clusters are projected to
experience positive growth over the next ten years as well as hold competitive advantages compared to
the nation. The Cross Cutting Industries cluster, largely driven downward by regional managing offices, is
projected to grow, but that growth is less than the nation and therefore holds negative competitive
advantages. Industries tailored towards manufacturing are currently projected to underperform national
trends.

It is important to note that within each cluster, even those shaded red, there are specialty operations
that hold a significant regional presence. Some of these industries have thrived within the community
and are projected to outpace national growth from 2016 to 2026. However, it is important to realize
that one industry employing 1,000 people cannot pull the regional weight of the entire sector.
As an example, we will first highlight the Advanced Manufacturing cluster. The industries listed in the
table below, have been identified as the top ranked Advanced Manufacturing industries within Hampton
Roads. Many of these industries are projected to outpace national growth over the next ten years, hold
a positive competitive effect, and pay an average salary higher than the regional average of $45,460.
Within the table there are some important distinctions to highlight. First, the industrial mix effect; if
you’ll recall, the industrial mix effect represents how much of the industry’s regional growth can be
attributed to the growth of the industry on the national level. These negative industrial mix values give
testament to the overall weakness of these industries on a national level as we would in turn expect
decreases in employment regionally. Second, there are two industries which have negative employment
projections over the next ten years but still hold a competitive advantage. These industries include:
power driven hand tool & glass container manufacturing. As mentioned in earlier text, while a decrease
in employment is not generally viewed enthusiastically, these industries are buffered from a nationally
declining industry due to some region competitive advantage.
Finally, note the bottom row. After filtration, this particular mix of advanced manufacturing industries
turns green; with a projected growth percentage of 9% from 2016 to 2026 and a competitive effect of
214 jobs. This mix of industries proves to have been prosperous within the region and additional
measures to enhance this cluster mix may be taken to increase its relative footprint within the
manufacturing super sector.

Hampton Roads, Virginia
Advanced Manufacturing
NAICS Description 2016 Jobs 2026 Jobs2016 - 2026
Change
2016 - 2026 %
Change
Nat'l Growth
EffectInd. Mix Effect
Expected
Change
Competitive
EffectCheck Current Wages
333991 Power-Driven Handtool Manufacturing 1,753 1,707 (46) (3%) 175 (523) (348) 302 (46) 63,357$
333911 Pump and Pumping Equipment Manufacturing 616 746 130 21% 62 (41) 20 110 130 70,146$
333612 Speed Changer, Industrial High-Speed Drive, and Gear Manufacturing 246 325 80 32% 25 (31) (6) 86 80 63,934$
335314 Relay and Industrial Control Manufacturing 340 400 59 17% 34 (34) (0) 60 59 65,774$
333243 Sawmill, Woodworking, and Paper Machinery Manufacturing 96 113 17 18% 10 (25) (15) 32 17 63,291$
333249 Other Industrial Machinery Manufacturing 127 163 36 29% 13 (4) 9 27 36 50,652$
333999 All Other Miscellaneous General Purpose Machinery Manufacturing 119 143 24 21% 12 (9) 3 22 24 56,444$
333922 Conveyor and Conveying Equipment Manufacturing 74 94 20 28% 7 (4) 4 17 20 51,814$
327999 All Other Miscellaneous Nonmetallic Mineral Product Manufacturing 65 82 17 26% 7 (5) 1 16 17 52,164$
325120 Industrial Gas Manufacturing 58 69 11 18% 6 (10) (4) 15 11 79,483$
332812 Metal Coating and Allied Services to Manufacturers 85 109 24 29% 8 2 11 14 24 58,420$
333517 Machine Tool Manufacturing 233 247 14 6% 23 (20) 3 11 14 76,542$
327213 Glass Container Manufacturing 238 219 (19) (8%) 24 (52) (28) 9 (19) 72,777$
333912 Air and Gas Compressor Manufacturing 351 366 15 4% 35 (19) 16 (1) 15 50,467$
332322 Sheet Metal Work Manufacturing 465 527 62 13% 46 21 67 (5) 62 47,037$
4,866 5,311 445 9% 487 (255) 232 214 445
Aerospace, Aviation & Defense
NAICS Description 2016 Jobs 2026 Jobs2016 - 2026
Change
2016 - 2026 %
Change
Nat'l Growth
EffectInd. Mix Effect
Expected
Change
Competitive
EffectCheck Current Wages
488190 Other Support Activities for Air Transportation 1,076 1,327 251 23% 108 19 126 125 251 60,434$
481111 Scheduled Passenger Air Transportation 1,015 1,088 73 7% 102 (87) 15 58 73 45,723$
336413 Other Aircraft Parts and Auxiliary Equipment Manufacturing 93 156 63 68% 9 2 11 52 63 48,047$
517410 Satellite Telecommunications 12 53 40 335% 1 2 3 37 40 90,606$
334511 Search, Navigation, Aeronautical, and Instrument Manufacturing 351 337 (14) (4%) 35 (78) (43) 29 (14) 79,003$
488111 Air Traffic Control 17 19 2 10% 2 (3) (2) 3 2 73,859$
334290 Other Communications Equipment Manufacturing 30 35 5 16% 3 (1) 2 3 5 91,488$
237130 Power and Communication Line and Related Structures Construction 375 376 1 0% 38 135 173 (172) 1 53,380$
2,968 3,391 422 14% 297 15 312 111 422
Bio-Science & Bio-Medical
NAICS Description 2016 Jobs 2026 Jobs2016 - 2026
Change
2016 - 2026 %
Change
Nat'l Growth
EffectInd. Mix Effect
Expected
Change
Competitive
EffectCheck Current Wages
423450 Medical, Dental, and Hospital Equipment and Supplies Wholesalers 896 1,174 278 31% 90 45 135 143 278 54,972$
334517 Irradiation Apparatus Manufacturing 90 133 43 48% 9 1 10 33 43 78,421$
325414 Biological Product (except Diagnostic) Manufacturing 33 61 28 85% 3 3 7 21 28 47,055$
325412 Pharmaceutical Preparation Manufacturing 64 83 19 30% 6 (7) (1) 20 19 108,685$
541711 Research and Development in Biotechnology 131 168 37 28% 13 11 24 12 37 54,803$
339113 Surgical Appliance and Supplies Manufacturing 134 155 21 15% 13 (3) 10 11 21 49,572$
562211 Hazardous Waste Treatment and Disposal 61 61 (0) (0%) 6 (16) (10) 10 (0) 40,311$
339114 Dental Equipment and Supplies Manufacturing 5 5 0 0% 1 (0) 0 (0) 0 No Data
333314 Optical Instrument and Lens Manufacturing 0 5 5 #DIV/0! 0 0 0 #DIV/0! #DIV/0! -$
325411 Medicinal and Botanical Manufacturing 0 0 0 #DIV/0! 0 0 0 #DIV/0! #DIV/0! -$
325413 In-Vitro Diagnostic Substance Manufacturing 0 0 0 #DIV/0! 0 0 0 #DIV/0! #DIV/0! -$
334516 Analytical Laboratory Instrument Manufacturing 5 5 0 0% 1 0 1 (1) 0 No Data
339112 Surgical and Medical Instrument Manufacturing 5 5 0 0% 1 0 1 (1) 0 No Data
339115 Ophthalmic Goods Manufacturing 15 0 (15) (100%) 1 (2) (1) (14) (15) 49,750$
423460 Ophthalmic Goods Merchant Wholesalers 72 64 (7) (10%) 7 (1) 7 (14) (7) 131,415$
1,510 1,919 409 27% 151 (3) 148 260 409
Hampton Roads, Virginia
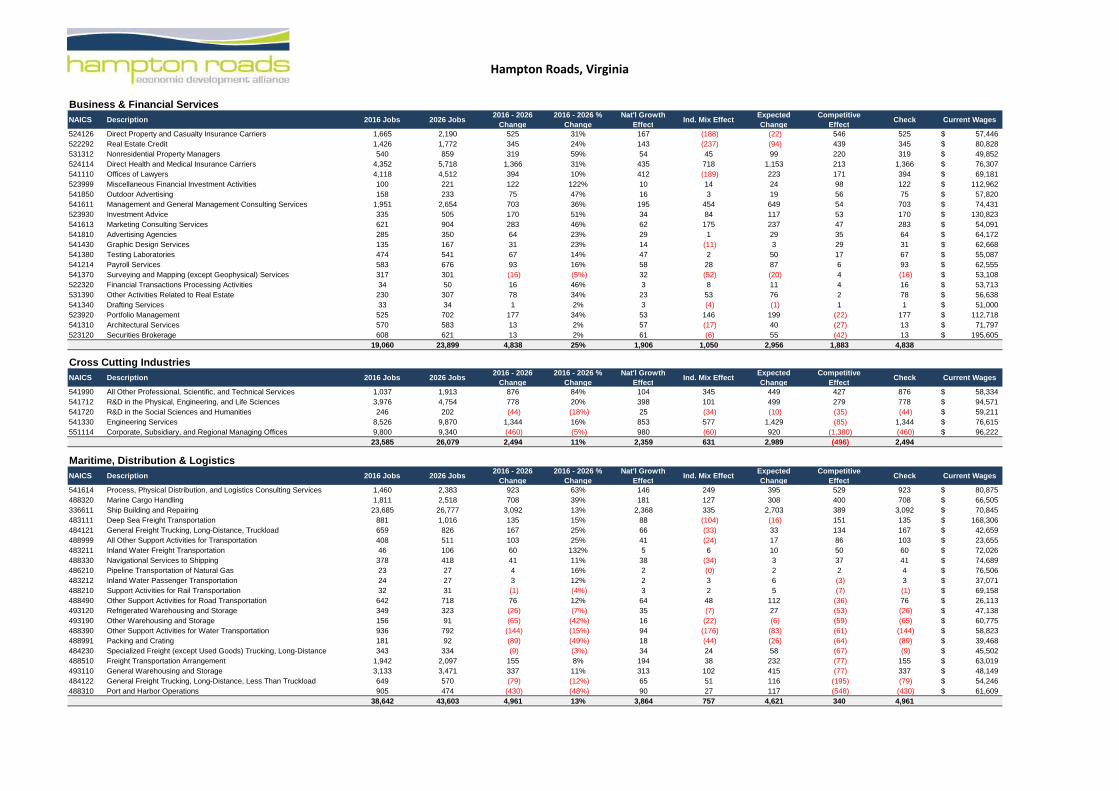
Business & Financial Services
NAICS Description 2016 Jobs 2026 Jobs2016 - 2026
Change
2016 - 2026 %
Change
Nat'l Growth
EffectInd. Mix Effect
Expected
Change
Competitive
EffectCheck Current Wages
524126 Direct Property and Casualty Insurance Carriers 1,665 2,190 525 31% 167 (188) (22) 546 525 57,446$
522292 Real Estate Credit 1,426 1,772 345 24% 143 (237) (94) 439 345 80,828$
531312 Nonresidential Property Managers 540 859 319 59% 54 45 99 220 319 49,852$
524114 Direct Health and Medical Insurance Carriers 4,352 5,718 1,366 31% 435 718 1,153 213 1,366 76,307$
541110 Offices of Lawyers 4,118 4,512 394 10% 412 (189) 223 171 394 69,181$
523999 Miscellaneous Financial Investment Activities 100 221 122 122% 10 14 24 98 122 112,962$
541850 Outdoor Advertising 158 233 75 47% 16 3 19 56 75 57,820$
541611 Management and General Management Consulting Services 1,951 2,654 703 36% 195 454 649 54 703 74,431$
523930 Investment Advice 335 505 170 51% 34 84 117 53 170 130,823$
541613 Marketing Consulting Services 621 904 283 46% 62 175 237 47 283 54,091$
541810 Advertising Agencies 285 350 64 23% 29 1 29 35 64 64,172$
541430 Graphic Design Services 135 167 31 23% 14 (11) 3 29 31 62,668$
541380 Testing Laboratories 474 541 67 14% 47 2 50 17 67 55,087$
541214 Payroll Services 583 676 93 16% 58 28 87 6 93 62,555$
541370 Surveying and Mapping (except Geophysical) Services 317 301 (16) (5%) 32 (52) (20) 4 (16) 53,108$
522320 Financial Transactions Processing Activities 34 50 16 46% 3 8 11 4 16 53,713$
531390 Other Activities Related to Real Estate 230 307 78 34% 23 53 76 2 78 56,638$
541340 Drafting Services 33 34 1 2% 3 (4) (1) 1 1 51,000$
523920 Portfolio Management 525 702 177 34% 53 146 199 (22) 177 112,718$
541310 Architectural Services 570 583 13 2% 57 (17) 40 (27) 13 71,797$
523120 Securities Brokerage 608 621 13 2% 61 (6) 55 (42) 13 195,605$
19,060 23,899 4,838 25% 1,906 1,050 2,956 1,883 4,838
Cross Cutting Industries
NAICS Description 2016 Jobs 2026 Jobs2016 - 2026
Change
2016 - 2026 %
Change
Nat'l Growth
EffectInd. Mix Effect
Expected
Change
Competitive
EffectCheck Current Wages
541990 All Other Professional, Scientific, and Technical Services 1,037 1,913 876 84% 104 345 449 427 876 58,334$
541712 R&D in the Physical, Engineering, and Life Sciences 3,976 4,754 778 20% 398 101 499 279 778 94,571$
541720 R&D in the Social Sciences and Humanities 246 202 (44) (18%) 25 (34) (10) (35) (44) 59,211$
541330 Engineering Services 8,526 9,870 1,344 16% 853 577 1,429 (85) 1,344 76,615$
551114 Corporate, Subsidiary, and Regional Managing Offices 9,800 9,340 (460) (5%) 980 (60) 920 (1,380) (460) 96,222$
23,585 26,079 2,494 11% 2,359 631 2,989 (496) 2,494
Maritime, Distribution & Logistics
NAICS Description 2016 Jobs 2026 Jobs2016 - 2026
Change
2016 - 2026 %
Change
Nat'l Growth
EffectInd. Mix Effect
Expected
Change
Competitive
EffectCheck Current Wages
541614 Process, Physical Distribution, and Logistics Consulting Services 1,460 2,383 923 63% 146 249 395 529 923 80,875$
488320 Marine Cargo Handling 1,811 2,518 708 39% 181 127 308 400 708 66,505$
336611 Ship Building and Repairing 23,685 26,777 3,092 13% 2,368 335 2,703 389 3,092 70,845$
483111 Deep Sea Freight Transportation 881 1,016 135 15% 88 (104) (16) 151 135 168,306$
484121 General Freight Trucking, Long-Distance, Truckload 659 826 167 25% 66 (33) 33 134 167 42,659$
488999 All Other Support Activities for Transportation 408 511 103 25% 41 (24) 17 86 103 23,655$
483211 Inland Water Freight Transportation 46 106 60 132% 5 6 10 50 60 72,026$
488330 Navigational Services to Shipping 378 418 41 11% 38 (34) 3 37 41 74,689$
486210 Pipeline Transportation of Natural Gas 23 27 4 16% 2 (0) 2 2 4 76,506$
483212 Inland Water Passenger Transportation 24 27 3 12% 2 3 6 (3) 3 37,071$
488210 Support Activities for Rail Transportation 32 31 (1) (4%) 3 2 5 (7) (1) 69,158$
488490 Other Support Activities for Road Transportation 642 718 76 12% 64 48 112 (36) 76 26,113$
493120 Refrigerated Warehousing and Storage 349 323 (26) (7%) 35 (7) 27 (53) (26) 47,138$
493190 Other Warehousing and Storage 156 91 (65) (42%) 16 (22) (6) (59) (65) 60,775$
488390 Other Support Activities for Water Transportation 936 792 (144) (15%) 94 (176) (83) (61) (144) 58,823$
488991 Packing and Crating 181 92 (89) (49%) 18 (44) (26) (64) (89) 39,468$
484230 Specialized Freight (except Used Goods) Trucking, Long-Distance 343 334 (9) (3%) 34 24 58 (67) (9) 45,502$
488510 Freight Transportation Arrangement 1,942 2,097 155 8% 194 38 232 (77) 155 63,019$
493110 General Warehousing and Storage 3,133 3,471 337 11% 313 102 415 (77) 337 48,149$
484122 General Freight Trucking, Long-Distance, Less Than Truckload 649 570 (79) (12%) 65 51 116 (195) (79) 54,246$
488310 Port and Harbor Operations 905 474 (430) (48%) 90 27 117 (548) (430) 61,609$
38,642 43,603 4,961 13% 3,864 757 4,621 340 4,961
Hampton Roads, Virginia
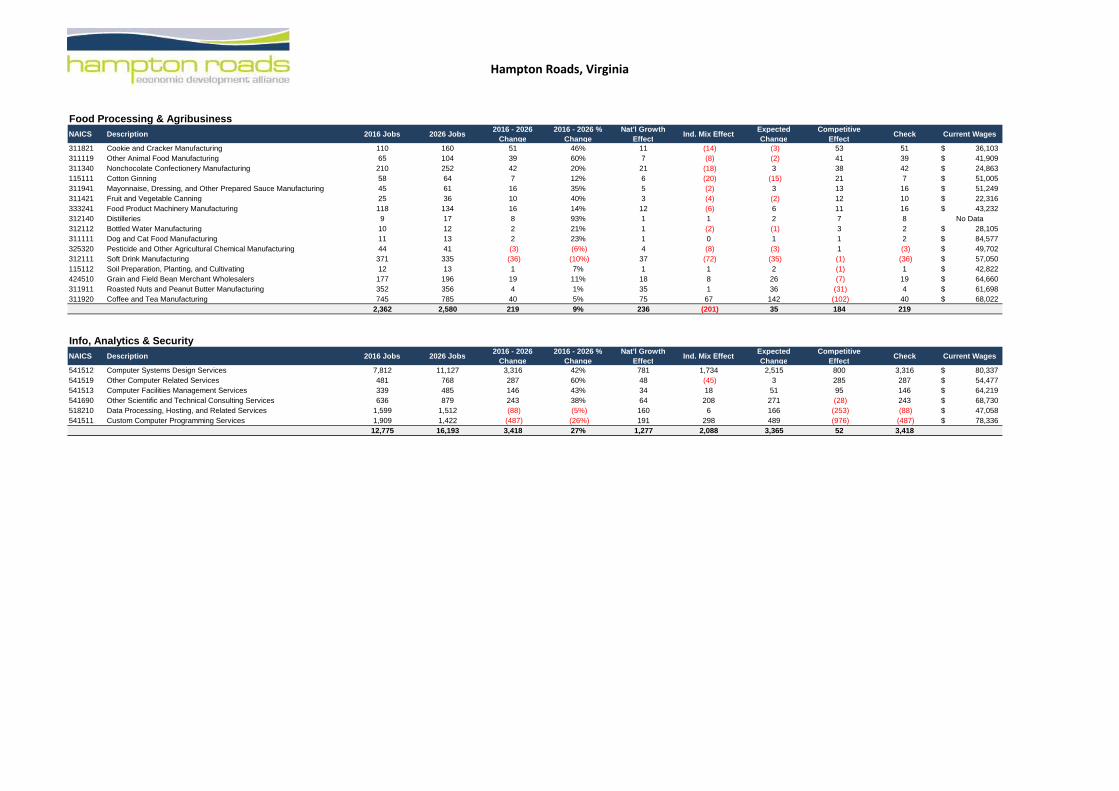
Food Processing & Agribusiness
NAICS Description 2016 Jobs 2026 Jobs2016 - 2026
Change
2016 - 2026 %
Change
Nat'l Growth
EffectInd. Mix Effect
Expected
Change
Competitive
EffectCheck Current Wages
311821 Cookie and Cracker Manufacturing 110 160 51 46% 11 (14) (3) 53 51 36,103$
311119 Other Animal Food Manufacturing 65 104 39 60% 7 (8) (2) 41 39 41,909$
311340 Nonchocolate Confectionery Manufacturing 210 252 42 20% 21 (18) 3 38 42 24,863$
115111 Cotton Ginning 58 64 7 12% 6 (20) (15) 21 7 51,005$
311941 Mayonnaise, Dressing, and Other Prepared Sauce Manufacturing 45 61 16 35% 5 (2) 3 13 16 51,249$
311421 Fruit and Vegetable Canning 25 36 10 40% 3 (4) (2) 12 10 22,316$
333241 Food Product Machinery Manufacturing 118 134 16 14% 12 (6) 6 11 16 43,232$
312140 Distilleries 9 17 8 93% 1 1 2 7 8 No Data
312112 Bottled Water Manufacturing 10 12 2 21% 1 (2) (1) 3 2 28,105$
311111 Dog and Cat Food Manufacturing 11 13 2 23% 1 0 1 1 2 84,577$
325320 Pesticide and Other Agricultural Chemical Manufacturing 44 41 (3) (6%) 4 (8) (3) 1 (3) 49,702$
312111 Soft Drink Manufacturing 371 335 (36) (10%) 37 (72) (35) (1) (36) 57,050$
115112 Soil Preparation, Planting, and Cultivating 12 13 1 7% 1 1 2 (1) 1 42,822$
424510 Grain and Field Bean Merchant Wholesalers 177 196 19 11% 18 8 26 (7) 19 64,660$
311911 Roasted Nuts and Peanut Butter Manufacturing 352 356 4 1% 35 1 36 (31) 4 61,698$
311920 Coffee and Tea Manufacturing 745 785 40 5% 75 67 142 (102) 40 68,022$
2,362 2,580 219 9% 236 (201) 35 184 219
Info, Analytics & Security
NAICS Description 2016 Jobs 2026 Jobs2016 - 2026
Change
2016 - 2026 %
Change
Nat'l Growth
EffectInd. Mix Effect
Expected
Change
Competitive
EffectCheck Current Wages
541512 Computer Systems Design Services 7,812 11,127 3,316 42% 781 1,734 2,515 800 3,316 80,337$
541519 Other Computer Related Services 481 768 287 60% 48 (45) 3 285 287 54,477$
541513 Computer Facilities Management Services 339 485 146 43% 34 18 51 95 146 64,219$
541690 Other Scientific and Technical Consulting Services 636 879 243 38% 64 208 271 (28) 243 68,730$
518210 Data Processing, Hosting, and Related Services 1,599 1,512 (88) (5%) 160 6 166 (253) (88) 47,058$
541511 Custom Computer Programming Services 1,909 1,422 (487) (26%) 191 298 489 (976) (487) 78,336$
12,775 16,193 3,418 27% 1,277 2,088 3,365 52 3,418

Subregion - Southside
Advanced Manufacturing
NAICS Description 2016 Jobs 2026 Jobs2016 - 2026
Change
2016 - 2026 %
Change
Nat'l Growth
EffectInd. Mix Effect
Expected
Change
Competitive
EffectCheck Current Wages
333991 Power-Driven Handtool Manufacturing 1,753 1,707 (46) (3%) 175 (523) (348) 302 (46) 63,357$
333612 Speed Changer, Industrial High-Speed Drive, and Gear Manufacturing 246 325 80 32% 25 (31) (6) 86 80 63,934$
335314 Relay and Industrial Control Manufacturing 290 352 62 21% 29 (29) (0) 62 62 69,543$
327999 All Other Miscellaneous Nonmetallic Mineral Product Manufacturing 36 64 28 78% 4 (3) 1 27 28 63,067$
333249 Other Industrial Machinery Manufacturing 127 163 36 29% 13 (4) 9 27 36 50,652$
333999 All Other Miscellaneous General Purpose Machinery Manufacturing 117 143 25 22% 12 (9) 3 23 25 56,136$
424610 Plastics Materials and Basic Forms and Shapes Merchant Wholesalers 39 58 20 52% 4 (2) 1 19 20 63,039$
333517 Machine Tool Manufacturing 227 244 17 7% 23 (20) 3 14 17 76,935$
332812 Metal Coating and Allied Services to Manufacturers 83 107 24 30% 8 2 11 14 24 59,808$
333911 Pump and Pumping Equipment Manufacturing 283 305 22 8% 28 (19) 9 12 22 64,758$
333912 Air and Gas Compressor Manufacturing 351 366 15 4% 35 (19) 16 (1) 15 50,467$
327910 Abrasive Product Manufacturing 177 173 (4) (2%) 18 (15) 2 (7) (4) 47,929$
334513 Instruments Manufacturing for Measuring Industrial Process Variables 53 49 (4) (8%) 5 (0) 5 (9) (4) 39,101$
333413 Industrial and Commercial Fan and Air Purification Equipment Manufacturing 49 39 (10) (20%) 5 3 8 (18) (10) 83,985$
3,830 4,095 264 7% 383 (173) 210 55 264
Aerospace, Aviation & Defense
NAICS Description 2016 Jobs 2026 Jobs2016 - 2026
Change
2016 - 2026 %
Change
Nat'l Growth
EffectInd. Mix Effect
Expected
Change
Competitive
EffectCheck Current Wages
481111 Scheduled Passenger Air Transportation 949 1,031 82 9% 95 (81) 14 68 82 46,222$
336413 Other Aircraft Parts and Auxiliary Equipment Manufacturing 60 110 50 84% 6 1 7 43 50 45,318$
517410 Satellite Telecommunications 12 53 40 335% 1 2 3 37 40 90,606$
488111 Air Traffic Control 17 19 2 10% 2 (3) (2) 3 2 73,859$
334290 Other Communications Equipment Manufacturing 9 11 2 20% 1 (0) 0 1 2 No Data
488190 Other Support Activities for Air Transportation 485 539 53 11% 49 8 57 (4) 53 74,895$
336992 Military Armored Vehicle, Tank, and Tank Component Manufacturing 5 5 0 0% 1 (1) (1) 1 0 No Data
334511 Search, Guidance, Aeronautical, Instrument Manufacturing 19 9 (10) (54%) 2 (4) (2) (8) (10) 123,615$
488119 Other Airport Operations 331 322 (10) (3%) 33 23 56 (65) (10) 43,607$
1,889 2,098 209 11% 189 (119) 70 140 209
Bio-Science & Bio-Medical
NAICS Description 2016 Jobs 2026 Jobs2016 - 2026
Change
2016 - 2026 %
Change
Nat'l Growth
EffectInd. Mix Effect
Expected
Change
Competitive
EffectCheck Current Wages
325414 Biological Product (except Diagnostic) Manufacturing 33 61 28 85% 3 3 7 21 28 47,055$
541711 Research and Development in Biotechnology 116 159 43 37% 12 10 22 21 43 55,901$
325412 Pharmaceutical Preparation Manufacturing 64 83 19 30% 6 (7) (1) 20 19 108,685$
339113 Surgical Appliance and Supplies Manufacturing 133 153 20 15% 13 (3) 10 10 20 49,433$
562211 Hazardous Waste Treatment and Disposal 61 61 (0) (0%) 6 (16) (10) 10 (0) 40,311$
339114 Dental Equipment and Supplies Manufacturing 5 6 1 20% 1 (0) 0 1 1 No Data
333314 Optical Instrument and Lens Manufacturing 1 3 2 200% 0 (0) 0 2 2 No Data
325413 In-Vitro Diagnostic Substance Manufacturing 0 0 0 0% 0 0 0 0 0 No Data
334517 Irradiation Apparatus Manufacturing 0 0 0 0% 0 0 0 0 0 No Data
325411 Medicinal and Botanical Manufacturing 0 0 0 0% 0 0 0 0 0 No Data
334516 Analytical Laboratory Instrument Manufacturing 5 6 1 20% 1 0 1 0 1 No Data
339112 Surgical and Medical Instrument Manufacturing 5 6 1 20% 1 0 1 0 1 No Data
339115 Ophthalmic Goods Manufacturing 13 0 (13) (100%) 1 (2) (1) (12) (13) 51,276$
423460 Ophthalmic Goods Merchant Wholesalers 71 64 (7) (10%) 7 (1) 6 (14) (7) 132,126$
423450 Medical, Dental, and Hospital Equipment and Supplies Wholesalers 286 315 29 10% 29 14 43 (14) 29 86,355$
793 917 123 16% 79 (2) 78 45 123

Subregion - Southside
Business & Financial Services
NAICS Description 2016 Jobs 2026 Jobs2016 - 2026
Change
2016 - 2026 %
Change
Nat'l Growth
EffectInd. Mix Effect
Expected
Change
Competitive
EffectCheck Current Wages
524126 Direct Property and Casualty Insurance Carriers 1,631 2,154 523 32% 163 (184) (21) 544 523 57,662$
522292 Real Estate Credit 1,389 1,768 379 27% 139 (230) (91) 470 379 81,237$
524114 Direct Health and Medical Insurance Carriers 4,142 5,429 1,287 31% 414 684 1,098 189 1,287 76,690$
541110 Offices of Lawyers 3,333 3,652 319 10% 333 (153) 181 138 319 71,625$
541611 Administrative Management and General Management Consulting Services 1,541 2,160 619 40% 154 359 513 106 619 70,404$
523999 Miscellaneous Financial Investment Activities 96 216 119 124% 10 13 23 96 119 112,572$
531312 Nonresidential Property Managers 300 443 143 48% 30 25 55 88 143 51,729$
541850 Outdoor Advertising 153 228 75 49% 15 3 18 56 75 58,340$
522220 Sales Financing 388 469 81 21% 39 6 45 36 81 43,390$
541810 Advertising Agencies 271 335 64 24% 27 1 28 36 64 63,785$
541430 Graphic Design Services 92 120 28 30% 9 (7) 2 26 28 64,815$
523930 Investment Advice 209 308 98 47% 21 52 73 25 98 174,300$
523130 Commodity Contracts Dealing 44 81 37 83% 4 11 15 22 37 39,217$
541613 Marketing Consulting Services 397 562 164 41% 40 112 152 13 164 47,701$
541380 Testing Laboratories 268 305 37 14% 27 1 28 9 37 54,912$
541340 Drafting Services 27 29 2 7% 3 (3) (1) 3 2 53,455$
522320 Financial Transactions Processing, Reserve, and Clearinghouse Activities 32 45 13 40% 3 7 10 2 13 56,098$
541310 Architectural Services 482 516 33 7% 48 (14) 34 (1) 33 73,672$
531390 Other Activities Related to Real Estate 186 237 51 27% 19 43 61 (11) 51 60,005$
523920 Portfolio Management 507 677 170 34% 51 141 192 (22) 170 115,313$
541214 Payroll Services 225 235 10 5% 22 11 33 (23) 10 62,037$
519130 Internet Publishing and Broadcasting and Web Search Portals 233 252 19 8% 23 34 58 (38) 19 76,867$
15,948 20,218 4,270 27% 1,595 1,031 2,626 1,644 4,270
Cross Cutting Industries
NAICS Description 2016 Jobs 2026 Jobs2016 - 2026
Change
2016 - 2026 %
Change
Nat'l Growth
EffectInd. Mix Effect
Expected
Change
Competitive
EffectCheck Current Wages
541712 R&D in the Physical, Engineering, and Life Sciences 2,276 2,904 629 28% 228 58 286 343 629 98,317$
541990 All Other Professional, Scientific, and Technical Services 531 960 430 81% 53 177 230 200 430 67,765$
541720 R&D in the Social Sciences and Humanities 79 13 (66) (83%) 8 (11) (3) (63) (66) 31,292$
541330 Engineering Services 6,347 7,292 945 15% 635 429 1,064 (119) 945 76,522$
551114 Corporate, Subsidiary, and Regional Managing Offices 6,248 5,511 (738) (12%) 625 (38) 586 (1,324) (738) 84,344$
15,480 16,680 1,200 8% 1,548 414 1,962 (762) 1,200
Maritime, Distribution & Logistics
NAICS Description 2016 Jobs 2026 Jobs2016 - 2026
Change
2016 - 2026 %
Change
Nat'l Growth
EffectInd. Mix Effect
Expected
Change
Competitive
EffectCheck Current Wages
488320 Marine Cargo Handling 1,628 2,271 643 39% 163 114 277 366 643 70,946$
541614 Process, Physical Distribution, and Logistics Consulting Services 1,048 1,684 636 61% 105 178 283 353 636 84,014$
483111 Deep Sea Freight Transportation 881 1,016 135 15% 88 (104) (16) 151 135 168,306$
484121 General Freight Trucking, Long-Distance, Truckload 647 762 115 18% 65 (33) 32 83 115 39,904$
488999 All Other Support Activities for Transportation 336 425 89 26% 34 (20) 14 75 89 25,990$
484110 General Freight Trucking, Local 729 861 132 18% 73 8 81 51 132 44,320$
483211 Inland Water Freight Transportation 46 106 60 132% 5 6 10 50 60 72,026$
488330 Navigational Services to Shipping 373 412 39 11% 37 (34) 3 36 39 73,453$
488210 Support Activities for Rail Transportation 32 31 (1) (4%) 3 2 5 (7) (1) 69,158$
493130 Farm Product Warehousing and Storage 56 41 (15) (26%) 6 (2) 4 (19) (15) 52,942$
488490 Other Support Activities for Road Transportation 598 671 73 12% 60 45 105 (31) 73 26,712$
493120 Refrigerated Warehousing and Storage 297 288 (9) (3%) 30 (6) 23 (32) (9) 44,865$
493110 General Warehousing and Storage 2,250 2,490 240 11% 225 73 298 (58) 240 51,238$
488991 Packing and Crating 181 92 (89) (49%) 18 (44) (26) (64) (89) 39,468$
493190 Other Warehousing and Storage 118 38 (80) (68%) 12 (16) (4) (75) (80) 69,513$
488510 Freight Transportation Arrangement 1,899 2,048 149 8% 190 37 227 (78) 149 63,561$
484230 Specialized Freight (except Used Goods) Trucking, Long-Distance 244 200 (44) (18%) 24 17 42 (85) (44) 47,568$
336611 Ship Building and Repairing 4,106 4,438 332 8% 411 58 469 (137) 332 64,478$
15,468 17,874 2,407 16% 1,547 202 1,749 658 2,407

Subregion - Southside
Food Processing & Agribusiness
NAICS Description 2016 Jobs 2026 Jobs2016 - 2026
Change
2016 - 2026 %
Change
Nat'l Growth
EffectInd. Mix Effect
Expected
Change
Competitive
EffectCheck Current Wages
312120 Breweries 70 144 74 105% 7 13 20 54 74 27,389$
311821 Cookie and Cracker Manufacturing 104 153 48 46% 10 (13) (3) 51 48 35,602$
311340 Nonchocolate Confectionery Manufacturing 178 229 51 28% 18 (15) 3 48 51 26,114$
115111 Cotton Ginning 60 65 5 9% 6 (21) (15) 21 5 47,208$
115116 Farm Management Services 26 42 15 58% 3 (0) 2 13 15 28,492$
311941 Mayonnaise, Dressing, and Other Prepared Sauce Manufacturing 45 61 16 35% 5 (2) 3 13 16 51,249$
311421 Fruit and Vegetable Canning 25 36 10 40% 3 (4) (2) 12 10 22,316$
333241 Food Product Machinery Manufacturing 118 134 16 14% 12 (6) 6 11 16 43,232$
311119 Other Animal Food Manufacturing 25 34 8 33% 3 (3) (1) 9 8 58,736$
312140 Distilleries 9 17 8 93% 1 1 2 7 8 No Data
112000 Animal Production and Aquaculture 99 106 7 7% 10 (7) 3 5 7 34,982$
312112 Bottled Water Manufacturing 10 12 2 21% 1 (2) (1) 3 2 28,105$
311111 Dog and Cat Food Manufacturing 11 13 2 23% 1 0 1 1 2 84,577$
325320 Pesticide and Other Agricultural Chemical Manufacturing 44 41 (3) (6%) 4 (8) (3) 1 (3) 49,702$
333111 Farm Machinery and Equipment Manufacturing 11 9 (2) (15%) 1 (0) 1 (3) (2) 137,197$
424590 Other Farm Product Raw Material Merchant Wholesalers 100 93 (7) (7%) 10 (5) 5 (12) (7) 80,739$
311999 All Other Miscellaneous Food Manufacturing 25 14 (11) (46%) 2 (1) 1 (12) (11) 27,040$
311911 Roasted Nuts and Peanut Butter Manufacturing 397 394 (3) (1%) 40 1 40 (43) (3) 60,029$
311612 Meat Processed from Carcasses 609 587 (22) (4%) 61 6 67 (89) (22) 48,663$
311920 Coffee and Tea Manufacturing 745 785 40 5% 75 67 142 (102) 40 68,022$
2,713 2,970 257 9% 271 (120) 151 105 257
Info, Analytics & Security
NAICS Description 2016 Jobs 2026 Jobs2016 - 2026
Change
2016 - 2026 %
Change
Nat'l Growth
EffectInd. Mix Effect
Expected
Change
Competitive
EffectCheck Current Wages
541512 Computer Systems Design Services 6,511 9,430 2,919 45% 651 1,445 2,096 822 2,919 77,774$
541519 Other Computer Related Services 439 728 290 66% 44 (41) 3 287 290 52,564$
541513 Computer Facilities Management Services 316 437 122 39% 32 16 48 74 122 63,374$
541690 Other Scientific and Technical Consulting Services 392 539 147 38% 39 128 167 (20) 147 72,650$
518210 Data Processing, Hosting, and Related Services 1,532 1,456 (76) (5%) 153 5 159 (235) (76) 45,563$
541511 Custom Computer Programming Services 1,380 1,026 (353) (26%) 138 215 353 (706) (353) 76,493$
10,569 13,617 3,048 29% 1,057 1,727 2,784 264 3,048

Subregion - Peninsula
Advanced Manufacturing
NAICS Description 2016 Jobs 2026 Jobs2016 - 2026
Change
2016 - 2026 %
Change
Nat'l Growth
EffectInd. Mix Effect Expected Change
Competitive
EffectCheck Current Wages
333911 Pump and Pumping Equipment Manufacturing 252 307 55 22% 25 (17) 8 47 55 69,478$
333243 Sawmill, Woodworking, and Paper Machinery Manufacturing 63 83 20 31% 6 (16) (10) 30 20 58,158$
326199 All Other Plastics Product Manufacturing 89 104 15 17% 9 (13) (4) 19 15 61,931$
333922 Conveyor and Conveying Equipment Manufacturing 74 94 20 28% 7 (4) 4 17 20 51,814$
325120 Industrial Gas Manufacturing 58 69 11 18% 6 (10) (4) 15 11 79,483$
332322 Sheet Metal Work Manufacturing 76 101 25 33% 8 3 11 14 25 36,672$
335314 Relay and Industrial Control Manufacturing 51 48 (3) (6%) 5 (5) (0) (3) (3) 44,362$
334513 Instruments Mfg. for Measuring Industrial Process Variables 79 5 (74) (94%) 8 (0) 8 (81) (74) 28,846$
741 811 69 9% 74 (64) 10 59 69
Aerospace, Aviation & Defense
NAICS Description 2016 Jobs 2026 Jobs2016 - 2026
Change
2016 - 2026 %
Change
Nat'l Growth
EffectInd. Mix Effect Expected Change
Competitive
EffectCheck Current Wages
488190 Other Support Activities for Air Transportation 556 735 179 32% 56 10 65 114 179 46,893$
334511 Search, Detection,Aeronautical and Instrument Manufacturing 323 322 (1) (0%) 32 (72) (39) 38 (1) 76,236$
336413 Other Aircraft Parts and Auxiliary Equipment Manufacturing 32 45 13 40% 3 1 4 9 13 53,095$
334290 Other Communications Equipment Manufacturing 22 24 2 9% 2 (1) 1 1 2 110,269$
481111 Scheduled Passenger Air Transportation 66 57 (9) (13%) 7 (6) 1 (9) (9) 38,482$
237130 Power and Communication Line and Related Structures Construction 20 5 (15) (76%) 2 7 9 (25) (15) 38,634$
561621 Security Systems Services 37 5 (32) (87%) 4 3 7 (39) (32) 36,497$
1,056 1,192 136 13% 106 15 120 16 136
Bio-Science & Bio-Medical
NAICS Description 2016 Jobs 2026 Jobs2016 - 2026
Change
2016 - 2026 %
Change
Nat'l Growth
EffectInd. Mix Effect Expected Change
Competitive
EffectCheck Current Wages
423450 Medical, Dental, and Hospital Equipment and Supplies Wholesalers 269 395 126 47% 27 14 40 86 126 42,617$
334517 Irradiation Apparatus Manufacturing 90 133 43 48% 9 1 10 33 43 78,421$
339112 Surgical and Medical Instrument Manufacturing 5 5 0 0% 1 0 1 (1) 0 No Data
339113 Surgical Appliance and Supplies Manufacturing 5 5 0 0% 1 (0) 0 (0) 0 No Data
333314 Optical Instrument and Lens Manufacturing 0 0 0 No Data 0 0 0 No Data No Data No Data
325412 Pharmaceutical Preparation Manufacturing 0 0 0 No Data 0 0 0 No Data No Data No Data
562211 Hazardous Waste Treatment and Disposal 0 0 0 No Data 0 0 0 No Data No Data No Data
325414 Biological Product (except Diagnostic) Manufacturing 0 0 0 No Data 0 0 0 No Data No Data No Data
339114 Dental Equipment and Supplies Manufacturing 0 0 0 No Data 0 0 0 No Data No Data No Data
334516 Analytical Laboratory Instrument Manufacturing 0 0 0 No Data 0 0 0 No Data No Data No Data
325411 Medicinal and Botanical Manufacturing 0 0 0 No Data 0 0 0 No Data No Data No Data
325413 In-Vitro Diagnostic Substance Manufacturing 0 0 0 No Data 0 0 0 No Data No Data No Data
423460 Ophthalmic Goods Merchant Wholesalers 5 5 0 0% 1 (0) 0 (0) 0 No Data
339115 Ophthalmic Goods Manufacturing 5 0 (5) (100%) 1 (1) (0) (5) (5) No Data
541711 Research and Development in Biotechnology 15 5 (10) (67%) 2 1 3 (13) (10) 45,975$
394 548 154 39% 39 (1) 39 115 154
Business & Financial Services
NAICS Description 2016 Jobs 2026 Jobs2016 - 2026
Change
2016 - 2026 %
Change
Nat'l Growth
EffectInd. Mix Effect Expected Change
Competitive
EffectCheck Current Wages
541219 Other Accounting Services 712 855 143 20% 71 (25) 46 97 143 43,709$
323111 Commercial Printing (except Screen and Books) 222 213 (9) (4%) 22 (68) (46) 38 (9) 47,327$
524114 Direct Health and Medical Insurance Carriers 197 262 66 34% 20 32 52 14 66 69,539$
522220 Sales Financing 48 65 17 35% 5 1 6 11 17 48,182$
541618 Other Management Consulting Services 22 32 10 43% 2 (1) 1 8 10 55,562$
541370 Surveying and Mapping (except Geophysical) Services 40 44 4 10% 4 (7) (3) 6 4 93,012$
541430 Graphic Design Services 28 33 5 19% 3 (2) 1 5 5 64,922$
541214 Payroll Services 307 356 50 16% 31 15 46 4 50 56,071$
523120 Securities Brokerage 84 95 11 13% 8 (1) 8 3 11 199,539$
523930 Investment Advice 64 90 26 40% 6 16 22 3 26 54,886$
523920 Portfolio Management 12 20 8 62% 1 3 5 3 8 49,110$
541620 Environmental Consulting Services 37 44 7 19% 4 3 7 (0) 7 60,465$
541110 Offices of Lawyers 552 581 30 5% 55 (25) 30 (0) 30 57,930$
2,324 2,690 366 16% 232 6 239 128 366

Subregion - Peninsula
Cross Cutting Industries
NAICS Description 2016 Jobs 2026 Jobs2016 - 2026
Change
2016 - 2026 %
Change
Nat'l Growth
EffectInd. Mix Effect Expected Change
Competitive
EffectCheck Current Wages
541990 All Other Professional, Scientific, and Technical Services 455 862 408 90% 45 151 197 211 408 44,784$
541720 Research and Development in the Social Sciences and Humanities 5 5 0 0% 1 (1) (0) 0 0 No Data
541330 Engineering Services 1,762 1,991 229 13% 176 119 295 (67) 229 78,534$
541712 R&D in the Physical, Engineering, and Life Sciences 1,646 1,773 127 8% 165 42 207 (80) 127 90,510$
551114 Corporate, Subsidiary, and Regional Managing Offices 2,430 2,563 133 5% 243 (15) 228 (95) 133 138,137$
6,298 7,194 896 14% 630 168 798 97 896
Maritime, Distribution & Logistics
NAICS Description 2016 Jobs 2026 Jobs2016 - 2026
Change
2016 - 2026 %
Change
Nat'l Growth
EffectInd. Mix Effect Expected Change
Competitive
EffectCheck Current Wages
336611 Ship Building and Repairing 19,579 22,339 2,760 14% 1,958 277 2,235 525 2,760 72,180$
541614 Process, Physical Distribution, and Logistics Consulting Services 276 485 209 76% 28 47 75 134 209 67,442$
488190 Other Support Activities for Air Transportation 556 735 179 32% 56 10 65 114 179 46,893$
488320 Marine Cargo Handling 183 248 65 35% 18 13 31 33 65 26,995$
484110 General Freight Trucking, Local 49 67 18 37% 5 1 5 13 18 39,839$
488999 All Other Support Activities for Transportation 72 86 14 19% 7 (4) 3 11 14 12,815$
484122 General Freight Trucking, Long-Distance, Less Than Truckload 14 22 8 55% 1 1 3 5 8 49,127$
484121 General Freight Trucking, Long-Distance, Truckload 48 55 7 15% 5 (2) 2 5 7 71,380$
488510 Freight Transportation Arrangement 23 20 (3) (13%) 2 0 3 (6) (3) 44,762$
488490 Other Support Activities for Road Transportation 37 37 (0) (1%) 4 3 7 (7) (0) 18,712$
492110 Couriers and Express Delivery Services 504 506 1 0% 50 (28) 22 (21) 1 44,421$
493120 Refrigerated Warehousing and Storage 40 19 (21) (53%) 4 (1) 3 (24) (21) 40,508$
493110 General Warehousing and Storage 77 59 (18) (24%) 8 2 10 (28) (18) 49,237$
488310 Port and Harbor Operations 118 32 (86) (73%) 12 4 15 (101) (86) 91,547$
21,576 24,707 3,132 15% 2,158 158 2,316 816 3,132
Food Processing & Agribusiness
NAICS Description 2016 Jobs 2026 Jobs2016 - 2026
Change
2016 - 2026 %
Change
Nat'l Growth
EffectInd. Mix Effect Expected Change
Competitive
EffectCheck Current Wages
311119 Other Animal Food Manufacturing 44 70 26 59% 4 (5) (1) 27 26 30,307$
312111 Soft Drink Manufacturing 371 335 (36) (10%) 37 (72) (35) (1) (36) 57,050$
311511 Fluid Milk Manufacturing 177 131 (45) (26%) 18 (18) (1) (45) (45) 54,049$
312120 Breweries 181 185 4 2% 18 34 52 (47) 4 69,816$
311710 Seafood Product Preparation & Packaging 448 393 (55) (12%) 45 (59) (14) (41) (55) 38,544$
1,220 1,114 (106) (9%) 122 (94) 28 (135) (106)
Info, Analytics & Security
NAICS Description 2016 Jobs 2026 Jobs2016 - 2026
Change
2016 - 2026 %
Change
Nat'l Growth
EffectInd. Mix Effect Expected Change
Competitive
EffectCheck Current Wages
541513 Computer Facilities Management Services 14 31 17 124% 1 1 2 15 17 81,710$
541690 Other Scientific and Technical Consulting Services 151 225 74 49% 15 49 65 9 74 51,724$
518210 Data Processing, Hosting, and Related Services 52 49 (2) (4%) 5 0 5 (8) (2) 96,575$
541519 Other Computer Related Services 23 5 (18) (78%) 2 (2) 0 (18) (18) 71,361$
541511 Custom Computer Programming Services 390 201 (188) (48%) 39 61 100 (288) (188) 81,703$
541512 Computer Systems Design Services 1,035 1,046 11 1% 103 230 333 (322) 11 97,675$
1,664 1,558 (106) (6%) 166 272 438 (545) (106)

Competitive Growth: Clusters by Region, Sub-region, & Locality
Cluster HR SS Pen Ches Frank Hamp IoW NN Norf Poq Ports S.hamp Suff VB
Advanced Manufacturing
Aerospace, Aviation & Defense
Bio-Science & Bio-Medical
Business & Financial Services
Cross Cutting Industries
Maritime, Distribution & Logistics
Food Processing
Info, Analytics, & Security
(+) Growth , (+) Competitive Effect
(+) Growth, ( - ) Competitive Effect
( - ) Growth , ( - ) Competitive Effect
No data available
Notes: Clusters shaded in green show the industry clusters that are projected to outpace national growth from 2016 to 2026 & hold positive competitive effect overthe same time period.
Clusters shaded in yellow are projected to maintain positive growth from 2016 to 2026 but this growth is to a lesser degree than that of national trends;therefore, the cluster holds a negative competitive effect.
Clusters shaded in red indicate that the industry cluster is projected to experience decreases in employment and hold a negative competitive effect.


