REGIONAL WATER DISTRIBUTION IN THE NILE DELTA 61 REGIONAL WATER DISTRIBUTION IN THE NILE DELTA OF EGYPT C.W.J. Roest SC DLO, p.o. box 725, 6700AC Wageningen, The Netherlands, e-mail c. w.j. roest@sc. dlo. nl Introduction In water scarce countries depending on external water supplies, such as Egypt, water distribution to the different water users is of paramount importance. For its water resources Egypt is depending mainly on the supply of fresh water transported to the country through the rive Nile. In addition to the Nile water, exploitation of groundwater from the Nubian aquifer and rainfall along the northern coast and in the Sinai Peninsula provide some potential for agriculture. The expanding population of Egypt creates an ever-growing pressure on the government to provide for new land reclamation areas. At the same time public water supply and industrial water requirements are increasing at the expense of agricultural water use. All these developments resulted in the recent past to adopt a strategy to reuse drainage water for irrigation on strategic locations where the drainage water is of sufficient quality to be mixed with irrigationwater for downstream use. This reuse of drainage water complicates management and planning of water distribution, but certainly is a fast and cheap way to improve the overall efficiency of water use in the Nile Delta. < In this monograph, regional water distribution in the Eastern Nile Delta will be analysed. It will be shown that reuse of drainage water improves the total efficiency of water use. It will be shown that the efficiency of the main irrigation-water conveyance system is quite high. The same is true for field irrigation operations. The majority of irrigation water losses occur in the connection between the regional system and the local (farming) system. Efforts to cut down these losses have repercussions for the amounts of reused drainage water. Consequently, improvements to reduce operational water losses are less effective than assumed by decision-makers. The Nile Delta The Nile Delta is located in the north of Egypt along the two Nile branches to the Mediterranean Sea (Figure 1). Since ancient times, the Nile has deposited a highly fertile clay soil in the Delta. Along the fringes with the desert this clay layer is just a few meters thick, but in the centre it may be up to twenty meters thick. The clay swells upon wetting and shrinks upon drying. It is this swelling and shrinking behaviour that makes
Transcript
REGIONAL WATER DISTRIBUTION IN THE NILE DELTA 61
REGIONAL WATER DISTRIBUTION IN THE NILE DELTA OF EGYPT
C.W.J. Roest
SC DLO, p.o. box 725, 6700AC Wageningen, The Netherlands, e-mail c. w.j. roest@sc. dlo. nl
Introduction
In water scarce countries depending on external water supplies, such as Egypt, water distribution to the different water users is of paramount importance. For its water resources Egypt is depending mainly on the supply of fresh water transported to the country through the rive Nile. In addition to the Nile water, exploitation of groundwater from the Nubian aquifer and rainfall along the northern coast and in the Sinai Peninsula provide some potential for agriculture. The expanding population of Egypt creates an ever-growing pressure on the government to provide for new land reclamation areas. At the same time public water supply and industrial water requirements are increasing at the expense of agricultural water use.
All these developments resulted in the recent past to adopt a strategy to reuse drainage water for irrigation on strategic locations where the drainage water is of sufficient quality to be mixed with irrigation water for downstream use. This reuse of drainage water complicates management and planning of water distribution, but certainly is a fast and cheap way to improve the overall efficiency of water use in the Nile Delta.
<
In this monograph, regional water distribution in the Eastern Nile Delta will be analysed. It will be shown that reuse of drainage water improves the total efficiency of water use. It will be shown that the efficiency of the main irrigation-water conveyance system is quite high. The same is true for field irrigation operations. The majority of irrigation water losses occur in the connection between the regional system and the local (farming) system. Efforts to cut down these losses have repercussions for the amounts of reused drainage water. Consequently, improvements to reduce operational water losses are less effective than assumed by decision-makers.
The Nile Delta
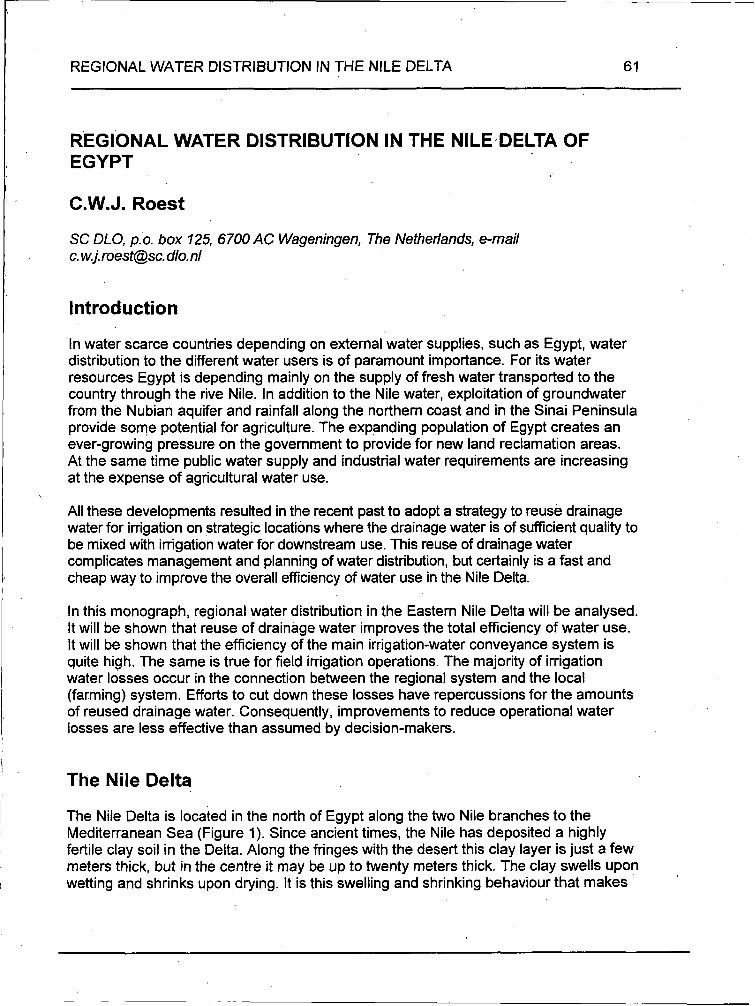
The Nile Delta is located in the north of Egypt along the two Nile branches to the Mediterranean Sea (Figure 1). Since ancient times, the Nile has deposited a highly fertile clay soil in the Delta. Along the fringes with the desert this clay layer is just a few meters thick, but in the centre it may be up to twenty meters thick. The clay swells upon wetting and shrinks upon drying. It is this swelling and shrinking behaviour that makes
62 ILRI WORKSHOP: WATER AND FOOD SECURITY IN (SEMI-) ARID AREAS
the soil suitable for irrigated agriculture.' Without the resulting soil cracks, the infiltration rate of the soil would be too slow to apply surface irrigation.
The land surface is gently sloping from Cairo, in the south, to the Mediterranean Sea in the north. In the southern part of the Delta losses from the irrigation system and the agricultural land occur. To a certain degree these losses are balanced by groundwater use in the south. In the north saline upward flow is dominant and the groundwater is unsuitable for agriculture. The drainage water in the south and along the two Nile branches is presently of good quality and is partly or completely reused in irrigation by mixing.
Figure 1. The Nile Delta has an agricultural area of about 1.7 million hectare.
Agriculture in the Nile Delta is characterised by small farm holdings with an average size of about 1.5 hectare. The main summer crops are cotton, maize and rice. The main winter crops are wheat and berseem (Alexandria clover), which is used to feed cattle. Field irrigation is implemented by subdividing the field in very small checks and flooding them.
Irrigation water supply is regulated at the apex of the Nile Delta, near Cairo. At this location the Delta Barrages were constructed and the water is distributed over the main canal intakes. The Eastern Nile Delta of about 755,000 hectares has nine of such intakes
'
REGIONAL WATER DISTRIBUTION IN THE NILE DELTA 63
(Figure 2). Water distribution to the main side branches (average size 60,000 hectares) of these irrigation command canals is by discharge control. The minor irrigation canals (called distributary canals) with an average command of 3,500 hectares are under rotation. Water supply to these canals is below land surface and control is based on downstream level. Farmers use diesel pumps to lift irrigation water from mesqaas, which are side branches of the distibutary canal, to irrigate their land. Nearly all irrigation canals, branches, distributaries and mesqaas, have tail end connections with the drainage system to prevent flooding of agricultural land in emergency situations.
Figure 2. Irrigation canals to distribute the water in the Eastem Nile Delta.
64 ILRl WORKSHOP: WATER AND FOOD SECURITY IN (SEMI-) ARID AREAS
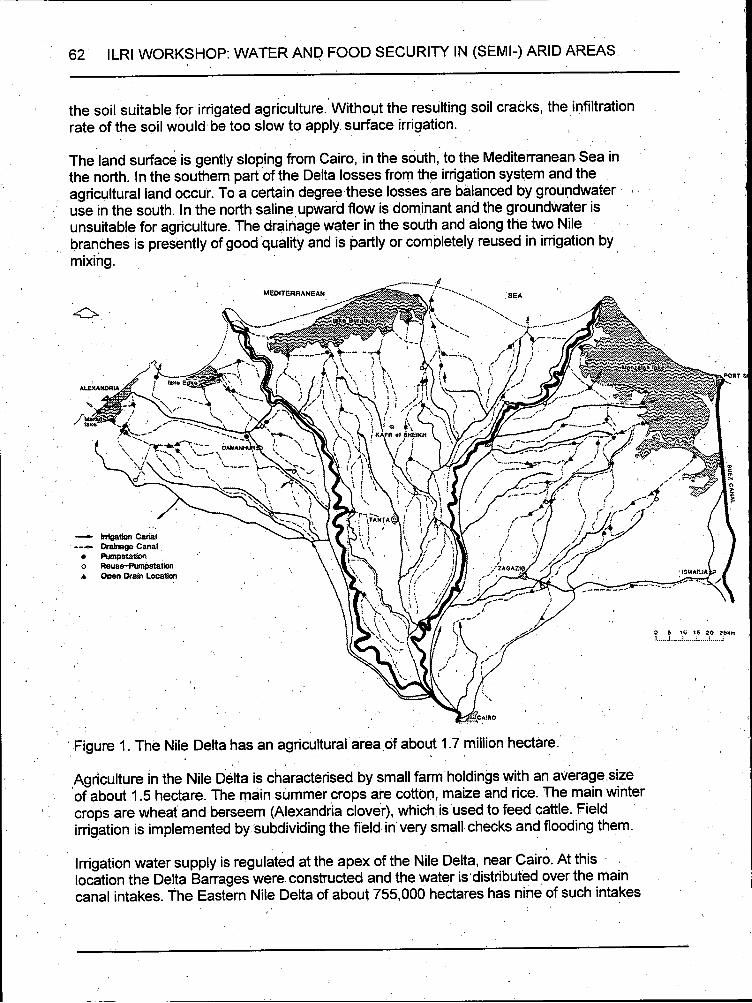
The drainage system is a separate dendritic canal system to collect the agricultural drainage water, irrigation water losses and the sewage water from villages in the Nile Delta. Drainage water is conveyed to the north, where the majority discharges in the coastal Manzalah Lake (Figure 3). The Manzalah Lake is an important resting place for migratory birds and provides fish to the local population.
Figure
Cairo
Drainage canals to collect and transp rt water from the Eastem Nile Delta.
1 REGIONAL WATER DISTRIBUTION IN THE NILE DELTA 65
The SIWARE model consists of four main modules (Figure 4), each one with special functions: o DESIGN to allocate the available irrigation water to the main canal intakes, based on
the areas with different crops grown in the respective commands. The allocation takes also care of the (assumed) availability of drainage water ate selected locations in the system. DESIGN also computes the target levels throughout the irrigation system for all location where regulating structures are present.
a WDUTY to compute the farmers' waterdemand, based on an unlimited supply of good quality irrigation water.
o WATDIS to compute the actual water distribution. WATDIS is a hydraulic model and confronts the target levels to be maintained by the irrigation authority for a fair distribution of water with the water demand of farmers, which try to maximise their share. Direct losses from the irrigation system to the drains are included in the computations through accounting for the day - night discrepancy between supply in the canals and the water uptake by farmers. Reuse of drainage water from the drainage system is included in the hydraulic computations and the resulting salinlty of the (mixed) irrigation water is computed.
a REUSE to compute the actual consumptive use of water by crops, the soil salinity and the field water irrigation and drainage losses. Based on the supply of irrigation water, the crop water needs and the availability of and access to drainage water the module computes the unofficial reuse of drainage water by farmers. REUSE also accounts for municipal drainage water and computes the transport of the generated losses to the
'
Data used for the analysis
The discharge data of the main irrigation canals are under full control of the Ministry of Public Works and Water Resources in Egypt. These data were used for the analysis. The second data source is the discharge and salinity of the main drainage commands collected on a regular basis by the Drainage Research Institute in Cairo. Such data (water supply on about 14 locations and water discharge on about 23 locations) is not sufficient to make an analysis of water management for an area with the size of the Eastem Nile Delta of 775,000 hectare.
The majority of data used for the analysis have been taken from model simulations with the SIWARE model. This model package has been developed for the analysis of reuse of drainage water options in the Nile Delta of Egypt (Abdel Gawad et al, 1991, Abdel Gawad and Roest, 1991, Abdel Gawad and Smit, 1991 , DRVSC-DLO, 1995, Roest et al, 1993, Sijtsma et al, 1995).).
1
I Data reliability
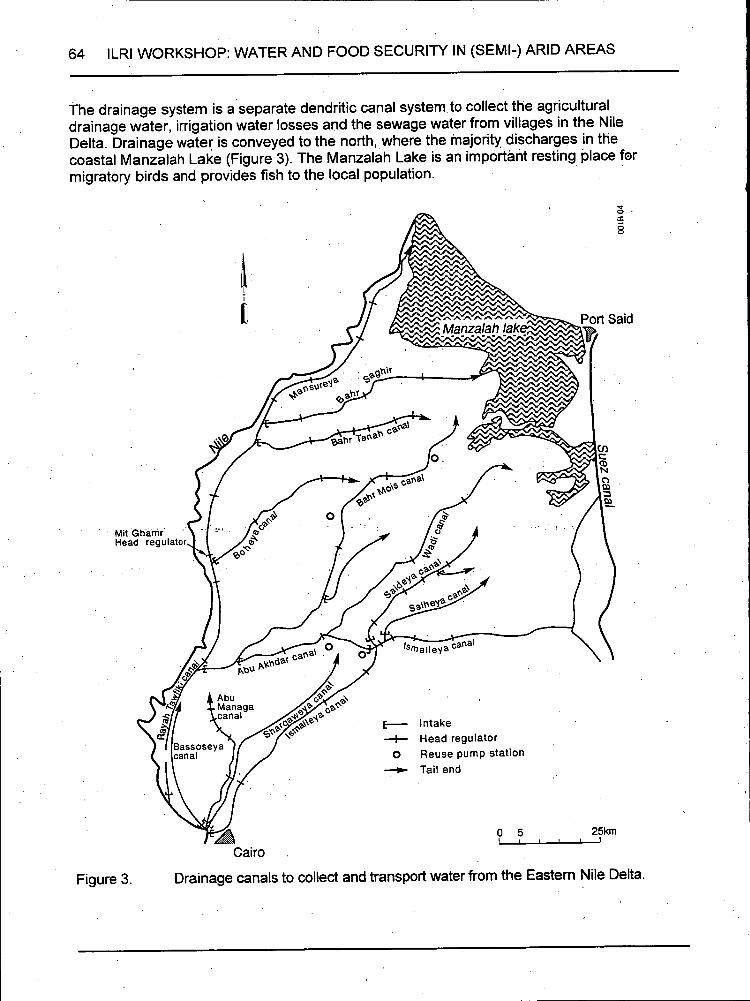
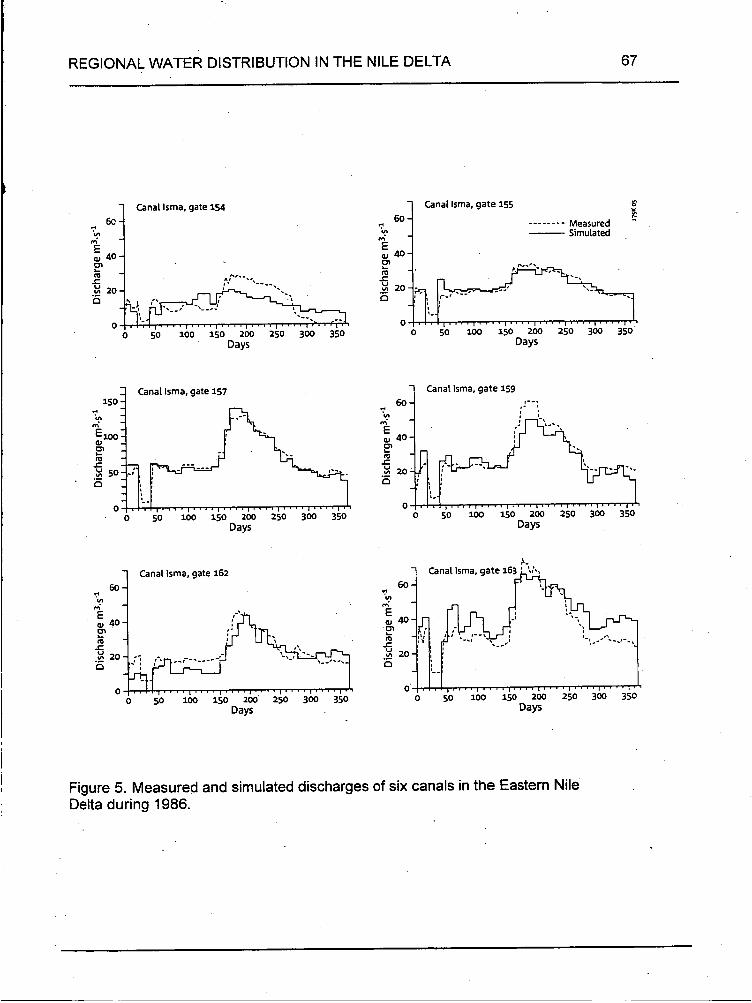
The simulation results were compared with the available data of irrigation supply and drainage discharge. Simulated water distribution agrees fairly well with reported values by the Ministry of Public Works and Water Resources (Figure 5).
66 ILRl WORKSHOP: WATER AND FOOD SECURITY IN (SEMI-) ARID AREAS
j Quantity irrigation and [ reuse water j Layout irrigation system
Physical Water supply per Target Agricultural d"ensions decade to main levels water irrigation canal intakes canals demand
Drainage - quantity - salinity
I Evapotranspiration Soil salinity 1 Reuse
Water distribution + 1 .
Figure 4. The SIWARE model consists of four modules and requires different types of input.
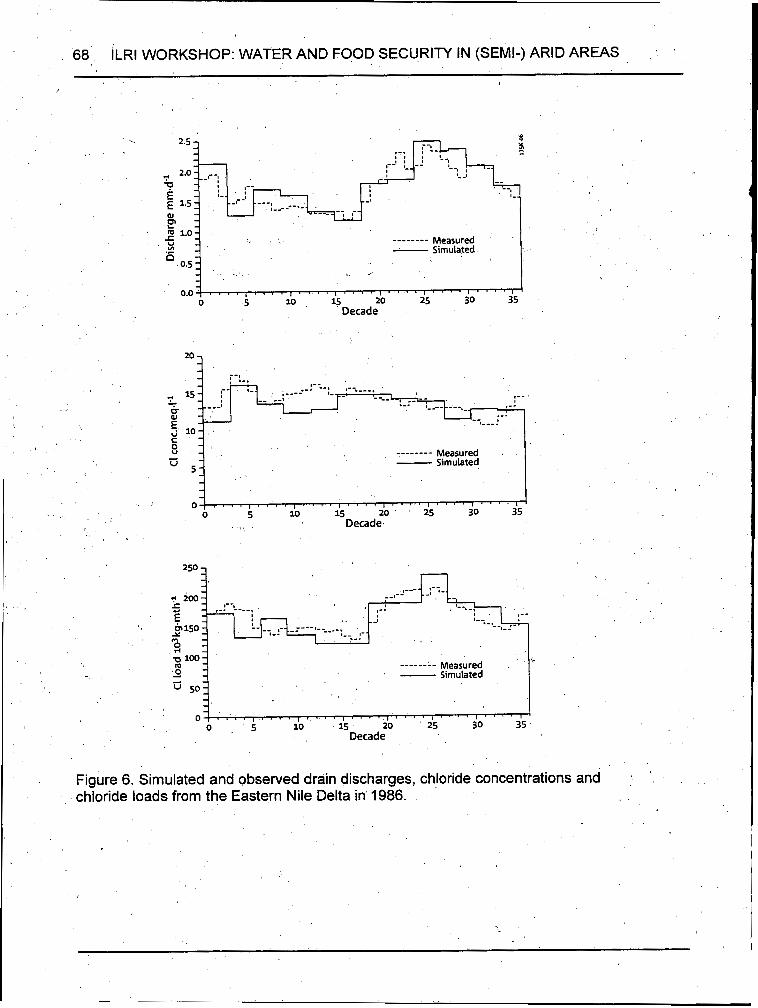
Total simulated discharge to the Mediterranean Sea from the Eastern Nile Delta agrees quite well with observations for 1986 (Figure 6). The same is true for the salinity and salt load.
The model has also been applied on the period from 1984 till 1988 to cover a substantial range of variation in water supply to the Eastern Nile Delta. Total simulated discharge and average salinity for this period shows a fair agreement with observations for the complete period (Figure 7).
In the international literature many researches have been reported giving the relation between soil salinity and crop yield. Since soil salinity is only one of the many production factors for crop yield, these experiments are normally performed under optimum crop growth conditions (sufficient water and nutrient supply), with the soil salinity as the only
REGIONAL WATER DISTRIBUTION IN THE NILE DELTA 67
1 Canal Isma. gate 154
E g 40
t.,.-
=: 20 n .-
O O 50 100 150 200 250 300 350
Days
1 Canal Isma, gate 157 150
1 Canal Isma, gate 155 s I
m E ni 40
Measured Simulated .
_-__----
o I . ! . ! I . . I . I n . 2 . I . " . l " ' " ' . " l " ' ' l . ~
O 50 100 150 200 250 300 350' Days
6o 4 Canal Isma, gate 159 1--1
Canal Isma, gate 162
d In
o I . ! . ! I . I I I . . . . I . . . " . ' . ' l " " l " ~ ' l ~ ~ 6 ;O 100 150 200 250 300 350 Days
6o 1 Canal Isma, gate
-? In
o I . . ! ! 8 . ' ' . ' . ' l " . ' l - ' " l ~ A ;o iAo i;o 2bo. 250 300 350 Days
1 [--I J I50
vaya
Figure 5. Measured and simulated discharges of six canals in the Eastern Nile Delta during 1986.
68 ILRl WORKSHOP: WATER AND FOOD SECURITY IN (SEMI-) ARID AREAS
Y , .C v ) -
n - 0.5 I
. .
. .
. . I
., . , - - - - - - - - Measured , - Simulated
c - 8 d -
5 - U -
____---- Measured I - Simulated, 1 '
Figure 6. Simulated and observed drain discharges, chloride concentrations and chloride loads from the Eastern Nile Delta in 1986.
I .
REGIONAL WATER DISTRIBUTION IN THE NILE DELTA 69
parameter to be varied. Maas and Hoffman (1977) report an extensive overview of this literature. The general shape of the crop yield response to soil salinity is a horizontal line until a certain threshold soil salinity value, and a linear decrease of crop yield with increasing soil salinity above this threshold value
.
- j 400
Simulated discharge ~ io6m3.yP
? 50
E c 4O
E C 30 8 8
6
O .C +-
4-
C
, d 2o U u m +- - z lo
.C
v)
O l . I ' l . I . 1 . 10 20 30 40 50
Measured CI concentration meq.1-I
Figure 7. Simulated discharge and average salinity for catchments smaller than 100,000 hectares for the validation period 1984 - 1988.
Research, carried out by the Drainage Research Institute since 1977 on farmer's fields into the relation between soil salinity and crop yield (Amer et al, 1989, Morsi et al, 1987, Ramadan et all, 1981 a, 1981 b, 1983), consistently showed a large scatter in the soil salinity - crop yield relation. This scatter is supposed to be caused by variations in the production factors, other than soil salinity.
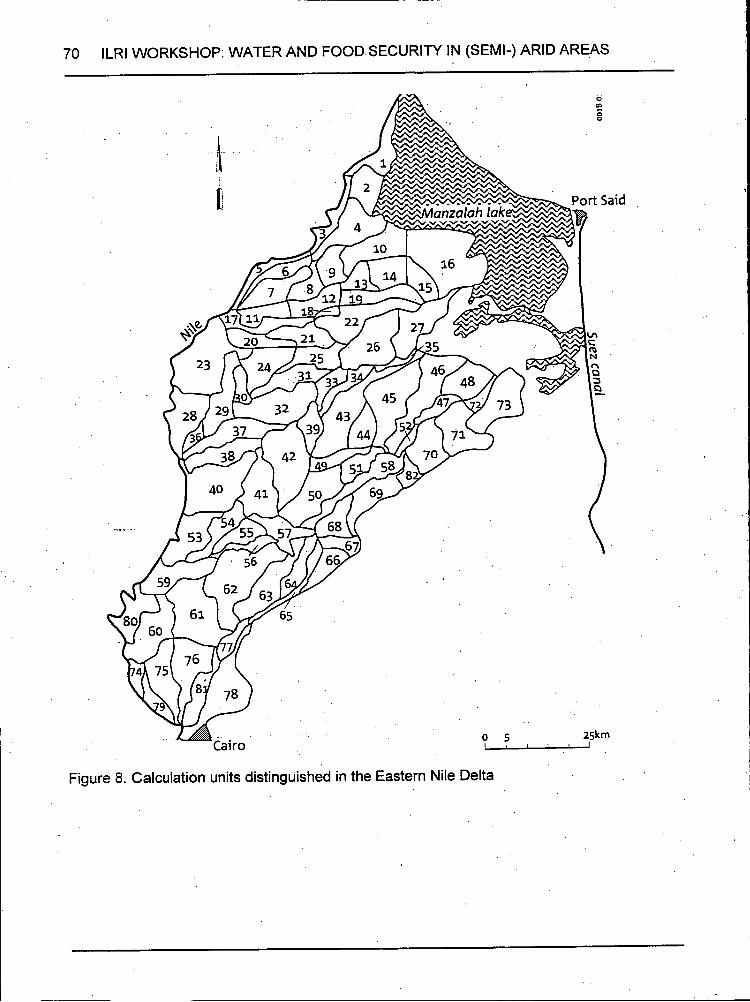
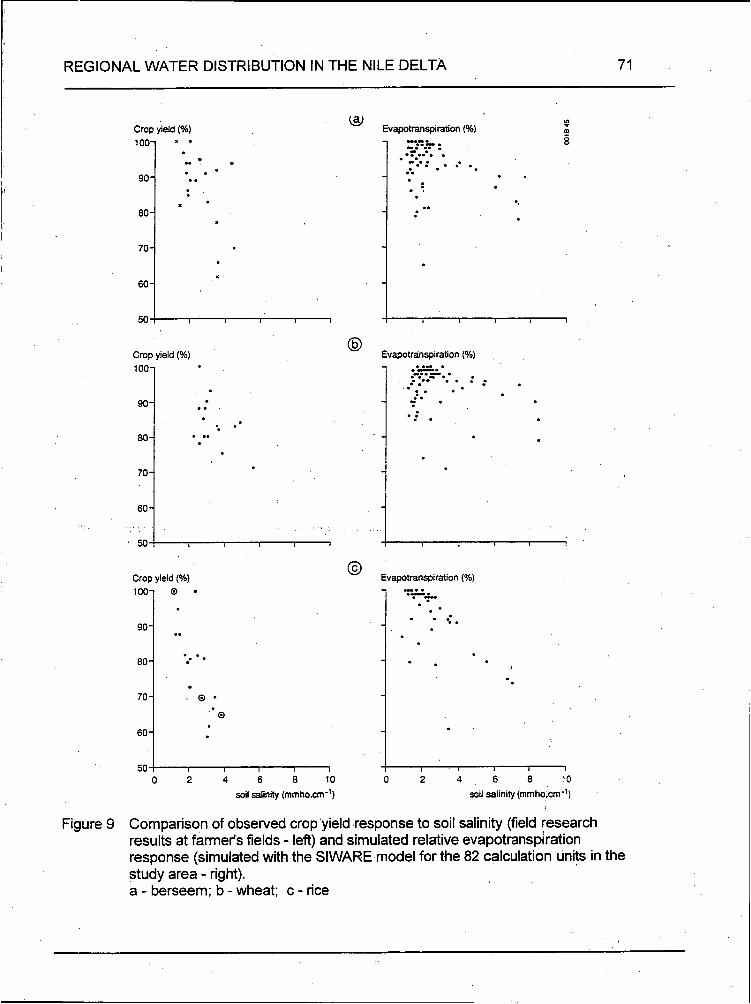
For the SIWARE model simulations the Eastem Nile Delta has been schematised into 82 calculation units (Figure 8). In each calculation unit a number of crops have been distinguished. In the model simulations such a crop is considered as a representative field plot. The simulation results of these representative field plots can be compared with field research results. The SIWARE model does not simulate the crop yield, but the relative evapotranspiration (relative to the optimum). It is generally accepted that relative evapo- transpiration is correlated with crop yield and, consequently, the reduction of actual evapotranspiration rate may be used as an indicator of crop yield depression due to soil salinity or water stress conditions. The mentioned field research results relating crop yield with soil salinity, conducted in the Nile Delta in Egypt, can be compared with the model simulation results relating the relative evapotranspiration with soil salintty (Figure 9). Doing so, two observations can be made:
the SIWARE simulation results show a similar scatter of data as the reported field
the crop yield reductions measured in the field research tend to appear at lower soil researches;
salinity than the evapotranspiration reduction simulated with the SIWARE model
70 ILRl WORKSHOP: WATER AND FOOD SECURITY IN (SEMI-) ARID AREAS
Figure 8. Calculation units distinguished in the Eastern Nile Delta
Figure 9 Comparison of observed crop'yield response to soil salinity (field research results at farmer's fields - left) and simulated relative evapotranspkation response (simulated with the SIWARE model for the 82 calculation units in the study area - right). a - berseem; b - wheat; c - rice
72 ILRl WORKSHOP: WATER AND FOOD SECURITY IN (SEMI-) ARID AREAS
For the interpretation of the SIWARE simulation results with respect to crop response there is an advantage over the field researches carried out in the past. In the model simulations the water supply to the crops is also known. By singling out the model results for which the water supply is clearly at, or above, the optimum, the only production factor left (in the model) is the soil salinity. Taking the results for the crop long berseem as an 1
example, no clear-cut relationship between soil salinity and relative evapotranspiration can be observed taking all simulated values into account (Figure IO). Below the soil salinity value of 2 mmh0.cm-l the reduction in evapotranspiration vanes from 0% to 32% and in the soil salinity range between 4 and 8 mmh0.cm-I this reduction ranges between 12% and 21% (Figure IO). By selecting only the simulated values for which the total seasonal crop water supply is larger than 95% of the agricultural demand (simulated with the model WDUN), a good correlation between soil salinity and relative evapo- transpiration can be obtained (Figure IO). The remaining scatter in the data given may be explained by the fact that the average soil salinity till drain depth is given and in the SIWARE model the evapotranspiration reacts to the soil salinity of the root zone. Also the temporal water supply pattem may explain part of the remaining scatter. It is very well conceivable that during certain parts of the growing season shortages of water occurred, and that crop evapotranspiration was reduced due to water shortages, although the seasonal water supply may have been sufficient. The crop yield response reported by Maas and Hoffman (1 977) is also included in this figure. For long berseem the crop yield appears to react at lower soil salinity than the simulated crop evapotranspiration response (Figure IO). This seems to confirm the second observation made by comparing the field research results with the SIWARE simulation result (Figure 9).
the groundwater used both for groundwater use and vertical upward seepage (values for each of the 82 calculation units). Validation of simulated chloride concentrations took place for the distributary drainage for the 27 observation locations. All other values are pure computations.
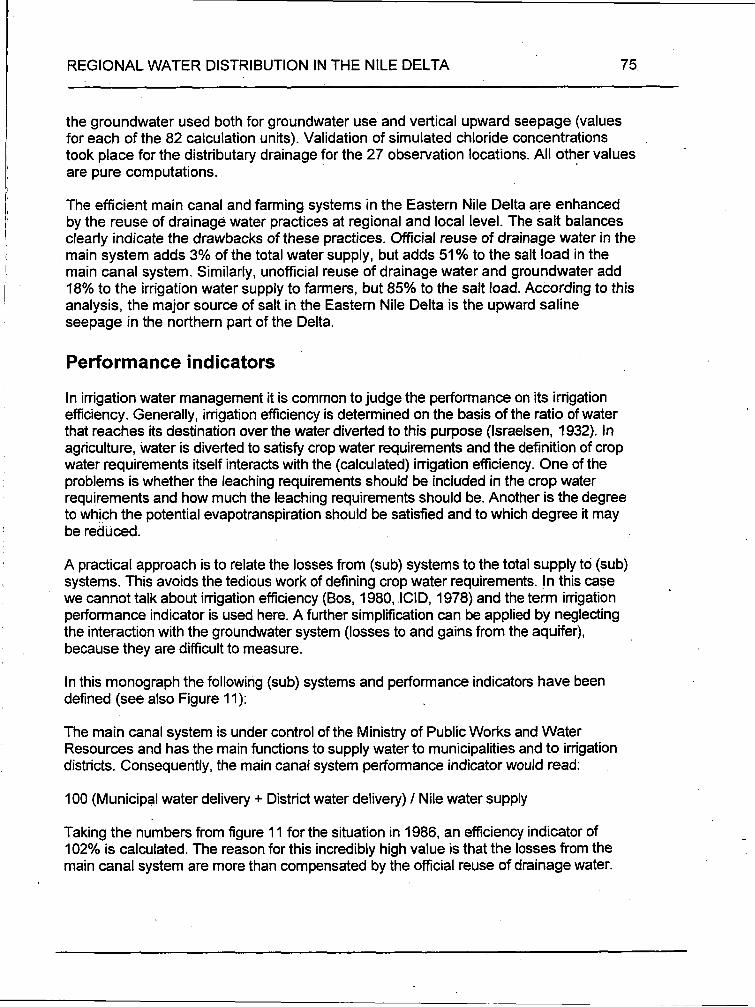
The efficient main canal and farming systems in the Eastern Nile Delta are enhanced by the reuse of drainage water practices at regional and local level. The salt balances clearly indicate the drawbacks of these practices. Official reuse of drainage water in the main system adds 3% of the total water supply, but adds 51 % to the salt load in the main canal system. Similarly, unofficial reuse of drainage water and groundwater add 18% to the irrigation water supply to farmers, but 85% to the salt load. According to this analysis, the major source of salt in the Eastem Nile Delta is the upward saline seepage in the northern part of the Delta.
Performance indicators
In irrigation water management it is common to judge the performance on its irrigation efficiency. Generally, irrigation efficiency is determined on the basis of the ratio of water that reaches its destination over the water diverted to this purpose (Israelsen, 1932). In agriculture, water is diverted to satisfy crop water requirements and the definition of crop water requirements itself interacts with the (calculated) irrigation efficiency. One of the problems is whether the leaching requirements should be included in the crop water requirements and how much the leaching requirements should be. Another is the degree to which the potential evapotranspiration should be satisfied and to which degree it may be reduced.
A practical approach is to relate the losses from (sub) systems to the total supply to (sub) systems. This avoids the tedious work of defining crop water requirements. In this case we cannot talk about irrigation efficiency (Bos, 1980, CID, 1978) and the term irrigation performance indicator is used here. A further simplification can be applied by neglecting the interaction with the groundwater system (losses to and gains from the aquifer), because they are difficult to measure.
In this monograph the following (sub) systems and performance indicators have been defined (see also Figure 11):
The main canal system is under control of the Ministry of Public Works and Water Resources and has the main functions to supply water to municipalities and to irrigation districts. Consequently, the main canal system performance indicator would read:
1 O0 (Municipal water delivery + District water delivery) / Nile water supply
Taking the numbers from figure 11 for the situation in 1986, an efficiency indicator of 102% is calculated. The reason for this incredibly high value is that the losses from the main canal system are more than compensated by the official reuse of drainage water.
76 ILRl WORKSHOP: WATER AND FOOD SECURITY IN (SEMI-) ARID AREAS
The district canal system is under control of the irrigation district engineers and has the main function to distribute the available water within the irrigation district to satisfy the crops in the field. Consequently, the district canal system performance indicator would read:
1 O0 (Crop water delivery) / District water delivery
Taking the numbers from figure 11 for the situation in 1986, an efficiency indicator of 90% is calculated. Again, the reason for the fairly high value of this indicator is the compensation of the losses from the distributary canals and mesqaas by groundwater use in the south and unofficial reuse of drainage water by farmers (Figure 11).
Taking the farmers’ fields as the focus of attention, also system indicators can be defined. Neglecting the interaction with the groundwater system, the farm system performance indicator can be defined as:
1 O0 (Crop water delivery - Crop drainage) / Crop water delivery
Taking the numbers from figure 1 1 for the situation in 1986, an efficiency indicator of 68% is calculated. Keeping in mind that leaching requirements are not included in the analysis, this gives a clear indication that such performance, as an average, is proof that farmers do not waste water and that field irrigation efficiencies are quite high. This does not indicate that wastage of water does not occur, however, because this is an average figure. It does implicate that wastage of water on one place may be compensated by shortages on other places in the system.
Enlarging the focus by moving form the farmers’ fields to the irrigation districts the performance indicator for this scale level can be defined as:
1 O0 (District water delivery - District drainage) / District water delivery
Taking the numbers from figure 11 for the situation in 1986, an efficiency indicator of 45% is calculated. This extremely low figure is explained by the large spill losses in the distributary and mesqaa canals and the connection between the continuous water supply at district level and the day - night variations in the uptake of water by farmers. Obviously, the tail end - head end inequity is also playing an important role in these large losses.
For the complete Eastem Nile Delta, the municipal water supply has to be taken into account for the system indicator.
1 O0 (Nile water supply - Drainage to sea + Municipal water delivery) / Nile water supply
The overall system performance indicator for the Eastem Nile Delta calculated with the data for 1986 comes to 62%, which is a fairly good performance for a system with the size of the Eastem Nile Delta.
REGIONAL WATER DISTRIBUTION IN THE NILE DELTA 77
Duty 87
Water saving strategies
Area I Duty Area I Duty 71 I 71 45 I 45
The weak point in the performance indicators derived for the Eastem Nile Delta obviously lies in the connection between the regional water supply system with continuous water supply and the local uptake system with a daily pattern. The system is especially vulnerable during periods with relatively low storage capacity in the district irrigation system. This is during the peak demand period in summer, and especially in the areas where a large proportion of the land use is rice during summer. Due to the ponded growing conditions of rice, this crop has an almost triple water requirement compared to the remaining summer crops. The effect of water savings on rice crop water use on the performance indicators has been studied in two ways by applying the SIWARE model to the Eastem Nile delta case: 1. By replacing in the model simulations the rice crop in stages from south to north by
maize. This measure represents a strategy of demand management: the water requirements are reduced.
2. By reducing the water allocated to the rice crop in steps from the original triple value to the water requirements of the other summer crops. This measure could be considered as a special form of supply management. By creating local water scarcity, it is left up to the farmers to use the supplied irrigation water more efficiently andlor look for additional drainage water to compensate for this scarctty.
100 100 100 99 99 99 99
Total water savings in both strategies are up to 24% of the normal Nile water supply (Table 1). The effect on the main canal supply indicator is only minimal, but negative for both strategies. Tail end losses are reduced, but at the same time the possibilities for reuse of drainage water are reduced. In other words: the system was efficient and remains efficient when these water saving strategies are implemented.
101 101 101 101 100 100 100
Table 1 Effect of two water saving strategies in the Eastern Nile Delta on performance indicators. Area indicates the strategy to replace rice by maize. Duty indicates the reduction of the allocation uty of rice.
88 91 93 94 95 96 95
I Supply system indicator (%) I Total system indicator (%) Water' I Main canal I District canal I Farm I District 1 Eastem Nile
The effects on the district canal performance indicator are significant. In the duty scenario spill losses remain larger than in the area scenario, but this is compensated largely by an increase of unofficial reuse (Table 1).
78 ILRl WORKSHOP: WATER AND FOOD SECURITY IN (SEMI-) ARID AREAS
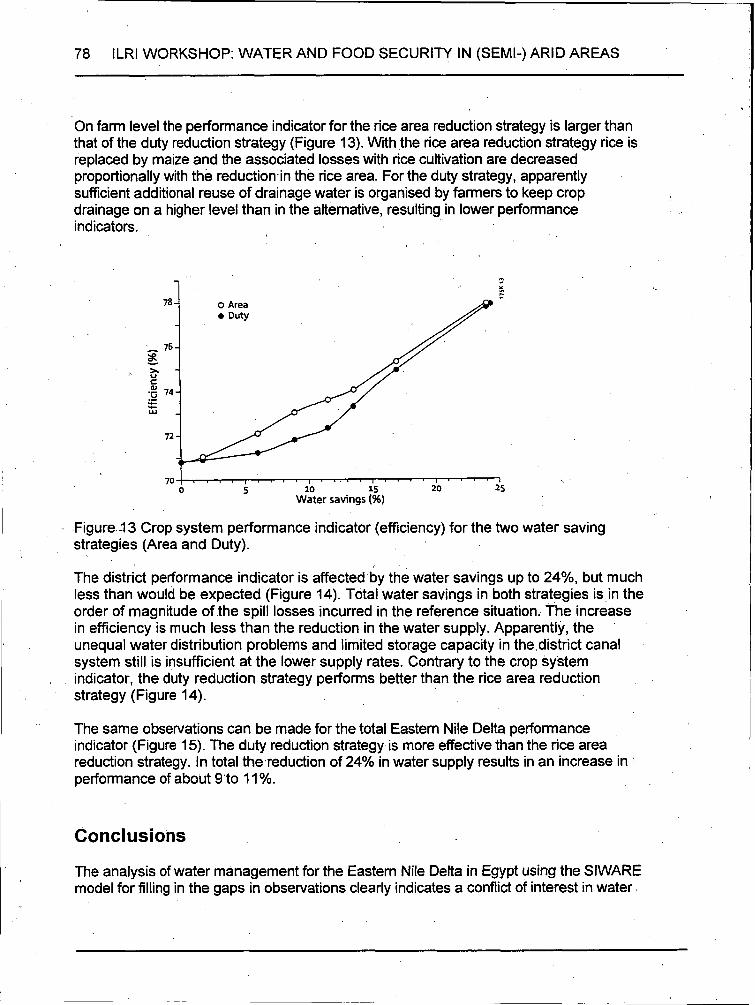
On farm level the performance indicator for the rice area reduction strategy is larger than that of the duty reduction strategy (Figure 13). With the rice area reduction strategy rice is replaced by maize and the associated losses with rice cultivation are decreased proportionally with the reduction in the rice area. For the duty strategy, apparently sufficient additional reuse of drainage water is organised by farmers to keep crop drainage on a higher level than in the altemative, resulting in lower performance indicators.
7 0 1 1 * I * - I 8 * I - ' I a " O I , O 5 10 15 20 25
Water savings (%)
Figure -13 Crop system performance indicator (efficiency) for the two water saving strategies (Area and Duty).
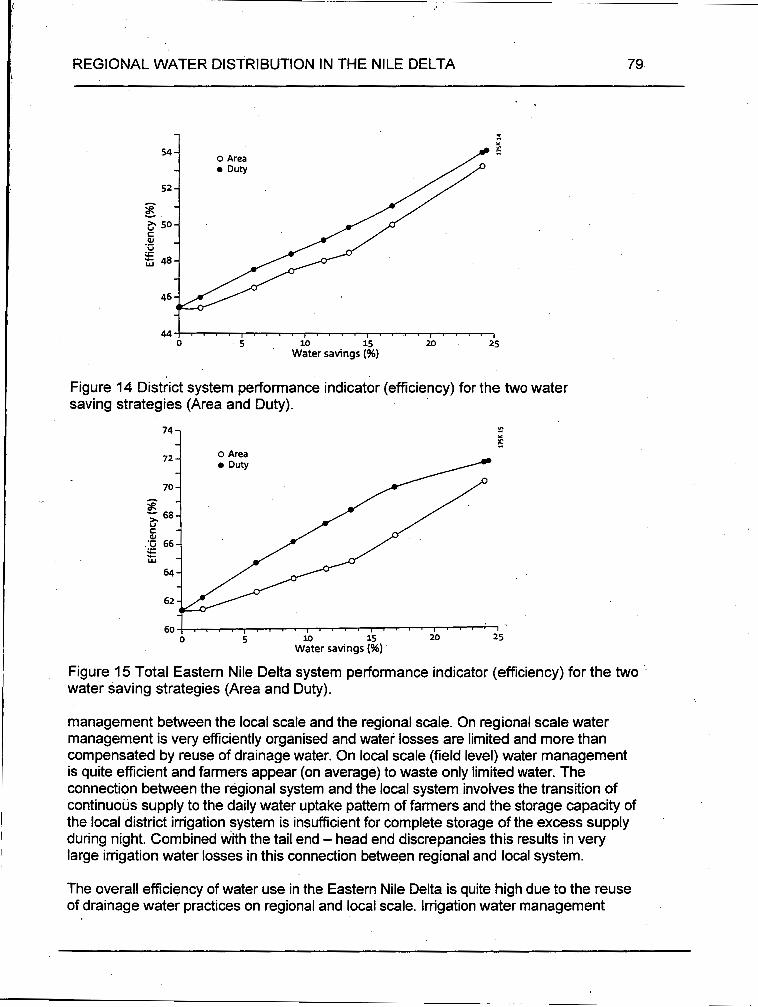
The district performance indicator is affected by the water savings up to 24%, but much less than would be expected (Figure 14). Total water savings in both strategies is in the order of magnitude of the spill losses incurred in the reference situation. The increase in efficiency is much less than the reduction in the water supply. Apparently, the unequal water distribution problems and limited storage capacity in the district canal system still is insufficient at the lower supply rates. Contrary to the crop system indicator, the duty reduction strategy performs better than the rice area reduction strategy (Figure 14).
The same observations can be made for the total Eastern Nile Delta performance indicator (Figure 15). The duty reduction strategy is more effective than the rice area reduction strategy. In total the reduction of 24% in water supply results in an increase in performance of about 9 to I 1 %.
Conclusions
The analysis of water management for the Eastem Nile Delta in Egypt using the SIWARE model for filling in the gaps in observations clearly indicates a conflict of interest in water
Figure 14 District system performance indicator (efficiency) for the two water saving strategies (Area and Duty).
l4 1 c c Y n
Figure 15 Total Eastern Nile Delta system performance indicator (efficiency) for the two water saving strategies (Area and Duty).
management between the local scale and the regional scale. On regional scale water management is very efficiently organised and water losses are limited and more than compensated by reuse of drainage water. On local scale (field level) water management is quite efficient and farmers appear (on average) to waste only limited water. The connection between the regional system and the local system involves the transition of continuous supply to the daily water uptake pattem of farmers and the storage capacity of the local district irrigation system is insufficient for complete storage of the excess supply during night. Combined with the tail end - head end discrepancies this results in very
The overall efficiency of water use in the Eastem Nile Delta is quite high due to the reuse of drainage water practices on regional and local scale. Irrigation water management
I large irrigation water losses in this connection between regional and local system.
80 ILRl WORKSHOP: WATER AND FOOD SECURITY IN (SEMI-) ARID AREAS
improvements by the introduction of water saving strategies on regional level to reduce these losses are therefore less efficient than one would expect. A better operation of water distribution on the connection between the regional and local level for instance through the introduction of water user associations would be required to avoid such losses. Such institutional improvements most probably would at the same time decrease the possibilities for reuse of drainage water.
Literature
Abdel Gawad, S.T., M.A. Abdel Khalek, D. Boek, D.E. EI Quosy, C.W.J. Roest, P.E. Rijtema and M.F.R. Smit, 1991. Analysis of Water management in the Eastern Nile Delta. Reuse of Drainage Water Project Report 30. Drainage Research Institute, Cairo and Winand Staring Centre, Wageningen. 245 p.
Abdel Gawad, S.T. and C.W.J. Roest, 1991. An Irrigation Water Saving Strategy in Egypt: Evaluation of Rice by Maize. Proceedings of the 8" Afro-Asian regional conference, CID Vol. C-14, Bangkok, Thailand, pp. 104-1 14.
Abdel Gawad, S.T., and M.F.R. Smit, 1991. Impact of reduced Water Supply on the Evapotranspiration of different Crops in Egypt. Proceedings of the 8* Afro-Asian regional conference, IClD Vol. C-14, Bangkok, Thailand, pp. 132-142.
Amer, M.H., S.M. EI Guindy and W. Rafla, 1989. Economic Justification of Drainage Projects in Egypt. In: Amer, M.H., and N.A. de Ridder (Eds.), Land Drainage in Egypt, Drainage Research Institute,' Cairo, Egypt. _ - _ ,
Bos, M.G., 1980. Irrigation efficiencies at crop production level. CID Bulletin 29(2): 18-26.
DRVSC-DLO, 1995. Reuse of Drainage Water in the Nile Delta; monitoring, modelling and analysis; final report Reuse of Drainage Water Project. Drainage Research Institute, Cairo and DLO Winand Staring Centre, Wageningen. 76 p.
CID, 1978. Standards for the calculation of irrigation efficiencies. lClD Bulletin 27. (1): 91- 101. i
Israelsen, O.W., 1932. Irrigation principles and practices. John Wiley, New York. 405 p.
Maas, E.V., and G.J. Hoffman, 1977. Crop Salt Tolerance - Current Assessment. Journal of the Irrigation and Drainage Division ASCE, Vol. 103, No IR2, Proc. Paper 12993, pp.
Ramadan, F.M., D.E. EI Quosy, M.A. Abdel Khalek, N. Badr, A. Omara, and M.A.M. Mann, 1981. Results of the Investigations in the Mashtul Pilot Area from December 1980 - July 1981. Drainage Research Institute, Giza, Egypt.
115-134.
REGIONAL WATER DISTRIBUTION IN THE NILE DELTA 81
Ramadan, F.M., M.S. Abdel Dayem, S.M. EI Guindy, M.A. Abdel Khalek, A. Omara, N. Badr, M. Korani and H.J. van der Zel, 1983. Mashtul Pilot Area, Results Winter Season 1981/1982. Technical Report 18. Drainage Research Institute, Giza, Egypt.
Ramadan, F.M., S.M. EI Guindy, M.A. Abdel Khalek, A. Omara, N. Badr, A. Kharbauwi, M.A.M. Mann and H.J. van der Zel, 1981. Mashtul Pilot Area, Results Summer Season 1981. Technical Report 13. Drainage Research Institute, Giza, Egypt.
Roest, C.W.J., S.T. Abdel Gawad and M.A. Abdel Khalek, 1993. Water Management in the Nile Delta of Egypt, A mathematical Approach. Proceedings of the 15" lntemational Congress of ICID, Vol. I-C, Question 44, R-99, The Hague, The Netherlands, pp, 1263- 1283.
Sijtsma, B.R., D. Boek, T.N.M. Visser, C.W.J. Roest and M.F.R. Smit, 1995. SIWARE users' Manual, version 1.2. Reuse of Drainage Water Project Report 27. Drainage Research Institute, Cairo and Winand Staring Centre, Wageningen. 158 p.
r
82 ILRl WORKSHOP: WATER AND FOOD SECURITY IN (SEMI-) ARID AREAS